the Creative Commons Attribution 4.0 License.
the Creative Commons Attribution 4.0 License.
 | 14 Jun 2024
Performance evaluation of a semivolatile aerosol dichotomous sampler (SADS) for exposure assessment: impact of design issues
Noredine Rekeb
Emmanuel Belut
Evelyne Géhin
Raymond Olsen
Aerosols of semivolatile organic compounds (SVOCs) pose significant health risks to workers in various occupational settings. Measuring human exposure to these aerosols requires a separate assessment of the contribution of particles and gases, which is not resolved by existing sampling techniques. Here, we investigate experimentally the performance of a semivolatile aerosol dichotomous sampler (SADS), proposed in previous studies, for sampling monodisperse liquid particles with aerodynamic diameters between 0.15 and 4.5 µm, corresponding to workplace aerosols. The measured sampling performances are compared to their theoretical counterparts computed by computational fluid dynamics. The effects of leakage rate, repeatability of the assembly, imprecision of the actually machined nozzle diameters, and SADS part misalignment are examined. The SADS assembly is found to be easily leaky, but consequences on sampling can be overcome when a prior leak test with a leakage rate below 4 Pa s−1 is passed. Variation of nozzle diameters in the range (−4.5 %, +3.7 %) with respect to nominal values affects marginally (< 3 %) aerosol transmission efficiency, but sampling performance is little reproducible during successive SADS assemblies (CV = 22.1 % for wall losses). Theoretically unpredicted large (40 %–46 %) wall losses are measured for particles larger than 2 µm, located mostly (80 %) on the external walls of the collection nozzle. Assembly repeatability issues and simulations of SADS parts misalignment effect by computational fluid dynamics (CFD) suggest that these undesirable particle deposits are due to the mechanical backlashes of the assembly. Thus, the current design does not guarantee a nozzle misalignment of less than 5 % of the acceleration nozzle diameter, and other important geometric parameters are not further constrained. The promising theoretical sampling performance of the SADS for SVOC aerosols larger than 1 µm thus falls short of expectations due to mechanical design issues that can be improved before possible field use.
- Article
(6455 KB) - Full-text XML
- BibTeX
- EndNote


Semivolatile organic compounds (SVOCs) represent a significant subgroup of volatile organic compounds (VOCs), and their presence in the environment raises concerns due to their association with carcinogenic, mutagenic, and reprotoxic effects (Raffy et al., 2018). One of the defining features of SVOCs is their ability to exist simultaneously in both vapour and particle phases, making their sampling and analysis a complex task. There are varying definitions of SVOCs, with the U.S. Environmental Protection Agency (Technical Overview of Volatile Organic Compounds, 2020) proposing a classification based on boiling points (240–380 °C at atmospheric pressure), while the standard EN 13936 defines them according to their saturation vapour pressure (ranging from 0.001 to 100 Pa at room temperature).
In occupational settings, SVOCs can be encountered in diverse forms, such as metalworking fluid (MWF) mists, phthalates, pesticides, acrylamides, machining fluids, exhaust gases from diesel engines, and more. Exposure to these pollutants in the workplace can pose health risks to workers, depending on their chemical nature and the extent of exposure. Understanding the health implications requires accurate measurement of both vapour and particle phases, as their behaviour and effects can differ when inhaled in the respiratory system. Notably, the vapour phase's absorption in the respiratory tract is influenced by the SVOC's solubility, while particle deposition in the lung is governed by their aerodynamic diameter (Volckens, 2003). Additionally, direct adsorption of SVOCs on the skin can lead to absorption into the body (Roberts et al., 2009). Thus, it becomes essential to separately quantify the concentrations of each phase that constitutes a semivolatile aerosol.
Various sampling techniques have been proposed to evaluate semivolatile aerosol concentrations, including filtration methods, thermodesorption tubes, cyclones, electrostatic precipitators, and multiple “filter + adsorbent” devices. However, these methods often suffer from the issue of evaporation of the particulate phase during sampling, leading to biased measurements. Filtration methods, for instance, have been found to underestimate particle concentrations due to continued evaporation from the filter during sampling (Park et al., 2015; Raynor et al., 2000; Simpson, 2003; Simpson et al., 2000; Volckens et al., 2010). Other techniques that do not instantaneously separate particles and vapour also face the problem of evaporation during sampling (Raynor and Leith, 1999; Leith et al., 2010; Lillienberg et al., 2008; Wlaschitz and Höflinger, 2007; Sutter et al., 2010; Kim and Raynor, 2010a). As of now, no applicable model exists to theoretically calculate the evaporation of a semivolatile aerosol during workplace air sampling, which hampers the use of these techniques.
An alternative approach is the virtual impactor (VI) principle, inspired by classical inertial impactors with collection plates (Loo and Cork, 1988; Marple and Chien, 1980). The VI is employed for size classification of particles based on their aerodynamic diameter. In 2009, a semivolatile aerosol dichotomous sampler (SADS), a novel variant of the VI dedicated to SVOCs, was proposed by Kim and Raynor (2009) and raised great hopes for this application. A photograph of a SADS prototype is presented in Fig. 1.
In its original version, the SADS features an inverted flow configuration between the major and minor flows, resulting in 86 % of the total air being directed into the collection nozzle, while the remaining 14 % is suctioned perpendicular to the acceleration nozzle axis (Fig. 2). The aerosol is sampled through a 4 mm inlet orifice and accelerated through a convergent shape called the “acceleration nozzle”, which narrows to a 0.8 mm orifice diameter. In the separation space, inertial particles are directed into the collection nozzle, while low inertial particles and vapours follow both the major and minor flows. The collection nozzle, located 1.2 mm from the acceleration nozzle, has a diameter of 1.1 mm, and filters and adsorbent beds are placed at each outlet (major and minor flow). The SADS operates at a total sampling flow rate of 2.1 L min−1, split into 1.8 L min−1 at the major flow outlet and 0.3 L min−1 at the minor flow outlet (split ratio of 0.143).
The SADS was further optimized numerically and tested both in the laboratory and in the field by its designers (Kim and Raynor, 2010a, b; Kim et al., 2014). The optimized version is characterized essentially by a revised split ratio of 0.1 with a total sampling flow rate of 2 L min−1 and with a length of the separation space reduced to 0.48 mm instead of 1.2 mm. The angle of the acceleration nozzle was also changed from 19 to 45° between the 2009 and 2010 versions. Despite these modifications, the overall mechanical design of the SADS has not changed between these two versions. The overall shape of the device is that of a 37 mm cassette, and it is made up of two parts that fit together via a cylindrical bearing surface. The parts are held together by two screws. Sealing is ensured by an O-ring between the two parts, pressed together by the two screws.
Thus, the work of Kim et al. (2009, 2010a, b) led to the creation of the SADS concept and revealed its interest in the sampling of semivolatile aerosols. However, many questions remain before SADS can be considered sufficiently mature for widespread use as a portable sampling device for SVOC aerosols.
Firstly, the sampling performance of the device was not evaluated in detail for particles with aerodynamic diameters greater than 1 µm, as the initial device was not designed for this. However, for field use, the evaluation of the performance of the SADS for particles above 1 µm is especially important because workplace SVOC aerosols showed a presence of particles with diameters up to 10 µm (Cooper et al., 1996; Park et al., 2009). Since the metric of SVOC exposure is mass concentration, and the mass carried by particles increases with the cube of their diameter, sampling errors on the most inertial particles generate biases in exposure measurements that are far more problematic than sampling errors on submicron particles. Optimization work by Kim et al. (2010b) focused on reducing the cut-off diameter of the device around an aerodynamic diameter of 0.7 µm, but the impact on supermicron particle sampling was not assessed. Subsequent tests on real aerosols revealed significant deposits in the device that had not been anticipated by the theoretical study, and the exact origin of these deposits is still unknown (26.5 % of wall losses for an aerosol with a mass median aerodynamic diameter (MMAD) of 2.17 µm in Kim and Raynor (2010b) and separate evaluations by the National Institute of Occupational Health (NIOH), Norway, and Fraunhofer ITEM that showed similarly high deposition ratios (Olsen et al., 2013)).
Secondly, it is important to emphasize the absence of published documentation or feedback regarding the mechanical realization and the necessary operating procedures for obtaining measurements in line with theoretical performance for the SADS. It is well known that the details of mechanical design and manufacture have as much to do with impactor performance as the theoretical design: sealing, nozzle alignment (Loo and Cork, 1988), geometric assembly tolerances – these are all necessary qualities which are the consequence of a suitable mechanical design. So far, the SADS design proposed by Kim et al. (2009, 2010b) has not been studied from these aspects, and it is possible that a more definitive version of the SADS will require a review of its overall mechanical design, without modification of the interior volume, which is perhaps optimal. Summarily, the authors who worked on the SADS have neither published documentation related to these aspects nor investigated them in previously published articles. In particular, it is doubtful whether the device as shown in Kim and Raynor (2010b) is leak-tight, with only two diametrically opposed clamping points. Also, in both versions, the proposed design does not seem to guarantee a precise control of nozzle spacing and alignment during assembly (limited guides and ground seats).
Finally, it is not certain that the optimized version proposed in 2010 is really optimal for sampling semivolatile aerosols encountered at workplaces, for various reasons. Firstly, from a methodological point of view, the optimization carried out is based on a computational fluid dynamics (CFD) model, which does not appear to provide accurate enough results for the optimization approach to be conclusive, as exposed in Belut et al. (2022). This is notably illustrated by significant differences between CFD predictions and measurements, for both the airflow and the aerosol phase. Modelled pressure drop on the major flow side is more than twice the measured value for Kim and Raynor (2009). Measured and simulated particle separation efficiencies depart by as much as 30 % in Kim and Raynor (2009) and by as much as 53 % in Kim and Raynor (2010b). Simulations report almost no particle deposition, but experimental evaluations found important wall losses: 26.5 % for an aerosol with MMAD of 2.17 µm in Kim and Raynor (2010a) and separate evaluations by NIOH, Norway, and Fraunhofer ITEM showing similarly high deposition ratios (Olsen et al., 2013). Secondly, the 2010 version has a much steeper inlet convergent angle (acceleration nozzle) than the 2009 version, which increases the probability of undesirable wall loss for the most inertial aerosols (Belut et al., 2022).
In this context, the present article
-
conducts an experimental investigation into the size-resolved sampling performances of the SADS on liquid SVOCs particles within an aerodynamic diameter range of 0.15–4.5 µm, i.e. extending beyond previous studies;
-
identifies practical issues related to the design, manufacturing, and operation of the SADS as proposed in Kim and Raynor (2009, 2010b);
-
investigates the effect of small variations in SADS nozzle diameters due to inevitable random manufacturing uncertainties;
-
details the localization of wall losses in the device, as mentioned in prior research, and identifies their cause.
In doing so, our aim is to suggest improvement targets for future realization of the SADS, a small step to obtain a device suitable for the dichotomic measurement of particles and vapours composing SVOCs aerosols at workplaces. We shall base our study on the 2009 version of the SADS, because of the smaller cut-off diameter and also considering that the issues related to the overall design of the SADS are common to both versions.
To reach our objectives, five 2009 SADS prototypes were constructed and their sampling behaviour was characterized, using monodisperse liquid aerosols of various sizes. After evaluating the leakage resistance of the assembly, and its consequences on wall deposition, the actual sampling performances are compared to their theoretical counterparts computed by Belut et al. (2022). Origins of discrepancies are examined in terms of influence of the actually machined nozzle diameter and of the repeatability of the SADS assembly. An analysis of the distribution of deposits within the SADS is then used to estimate the likely cause of deposits in the device. The results are then discussed to propose improvement targets for the realization of the SADS, in terms of design and assembly.
Where necessary, CFD simulation results are used to support the observations. The approach of Belut et al. (2022) is then used for this purpose, including systematic calculation verification steps.
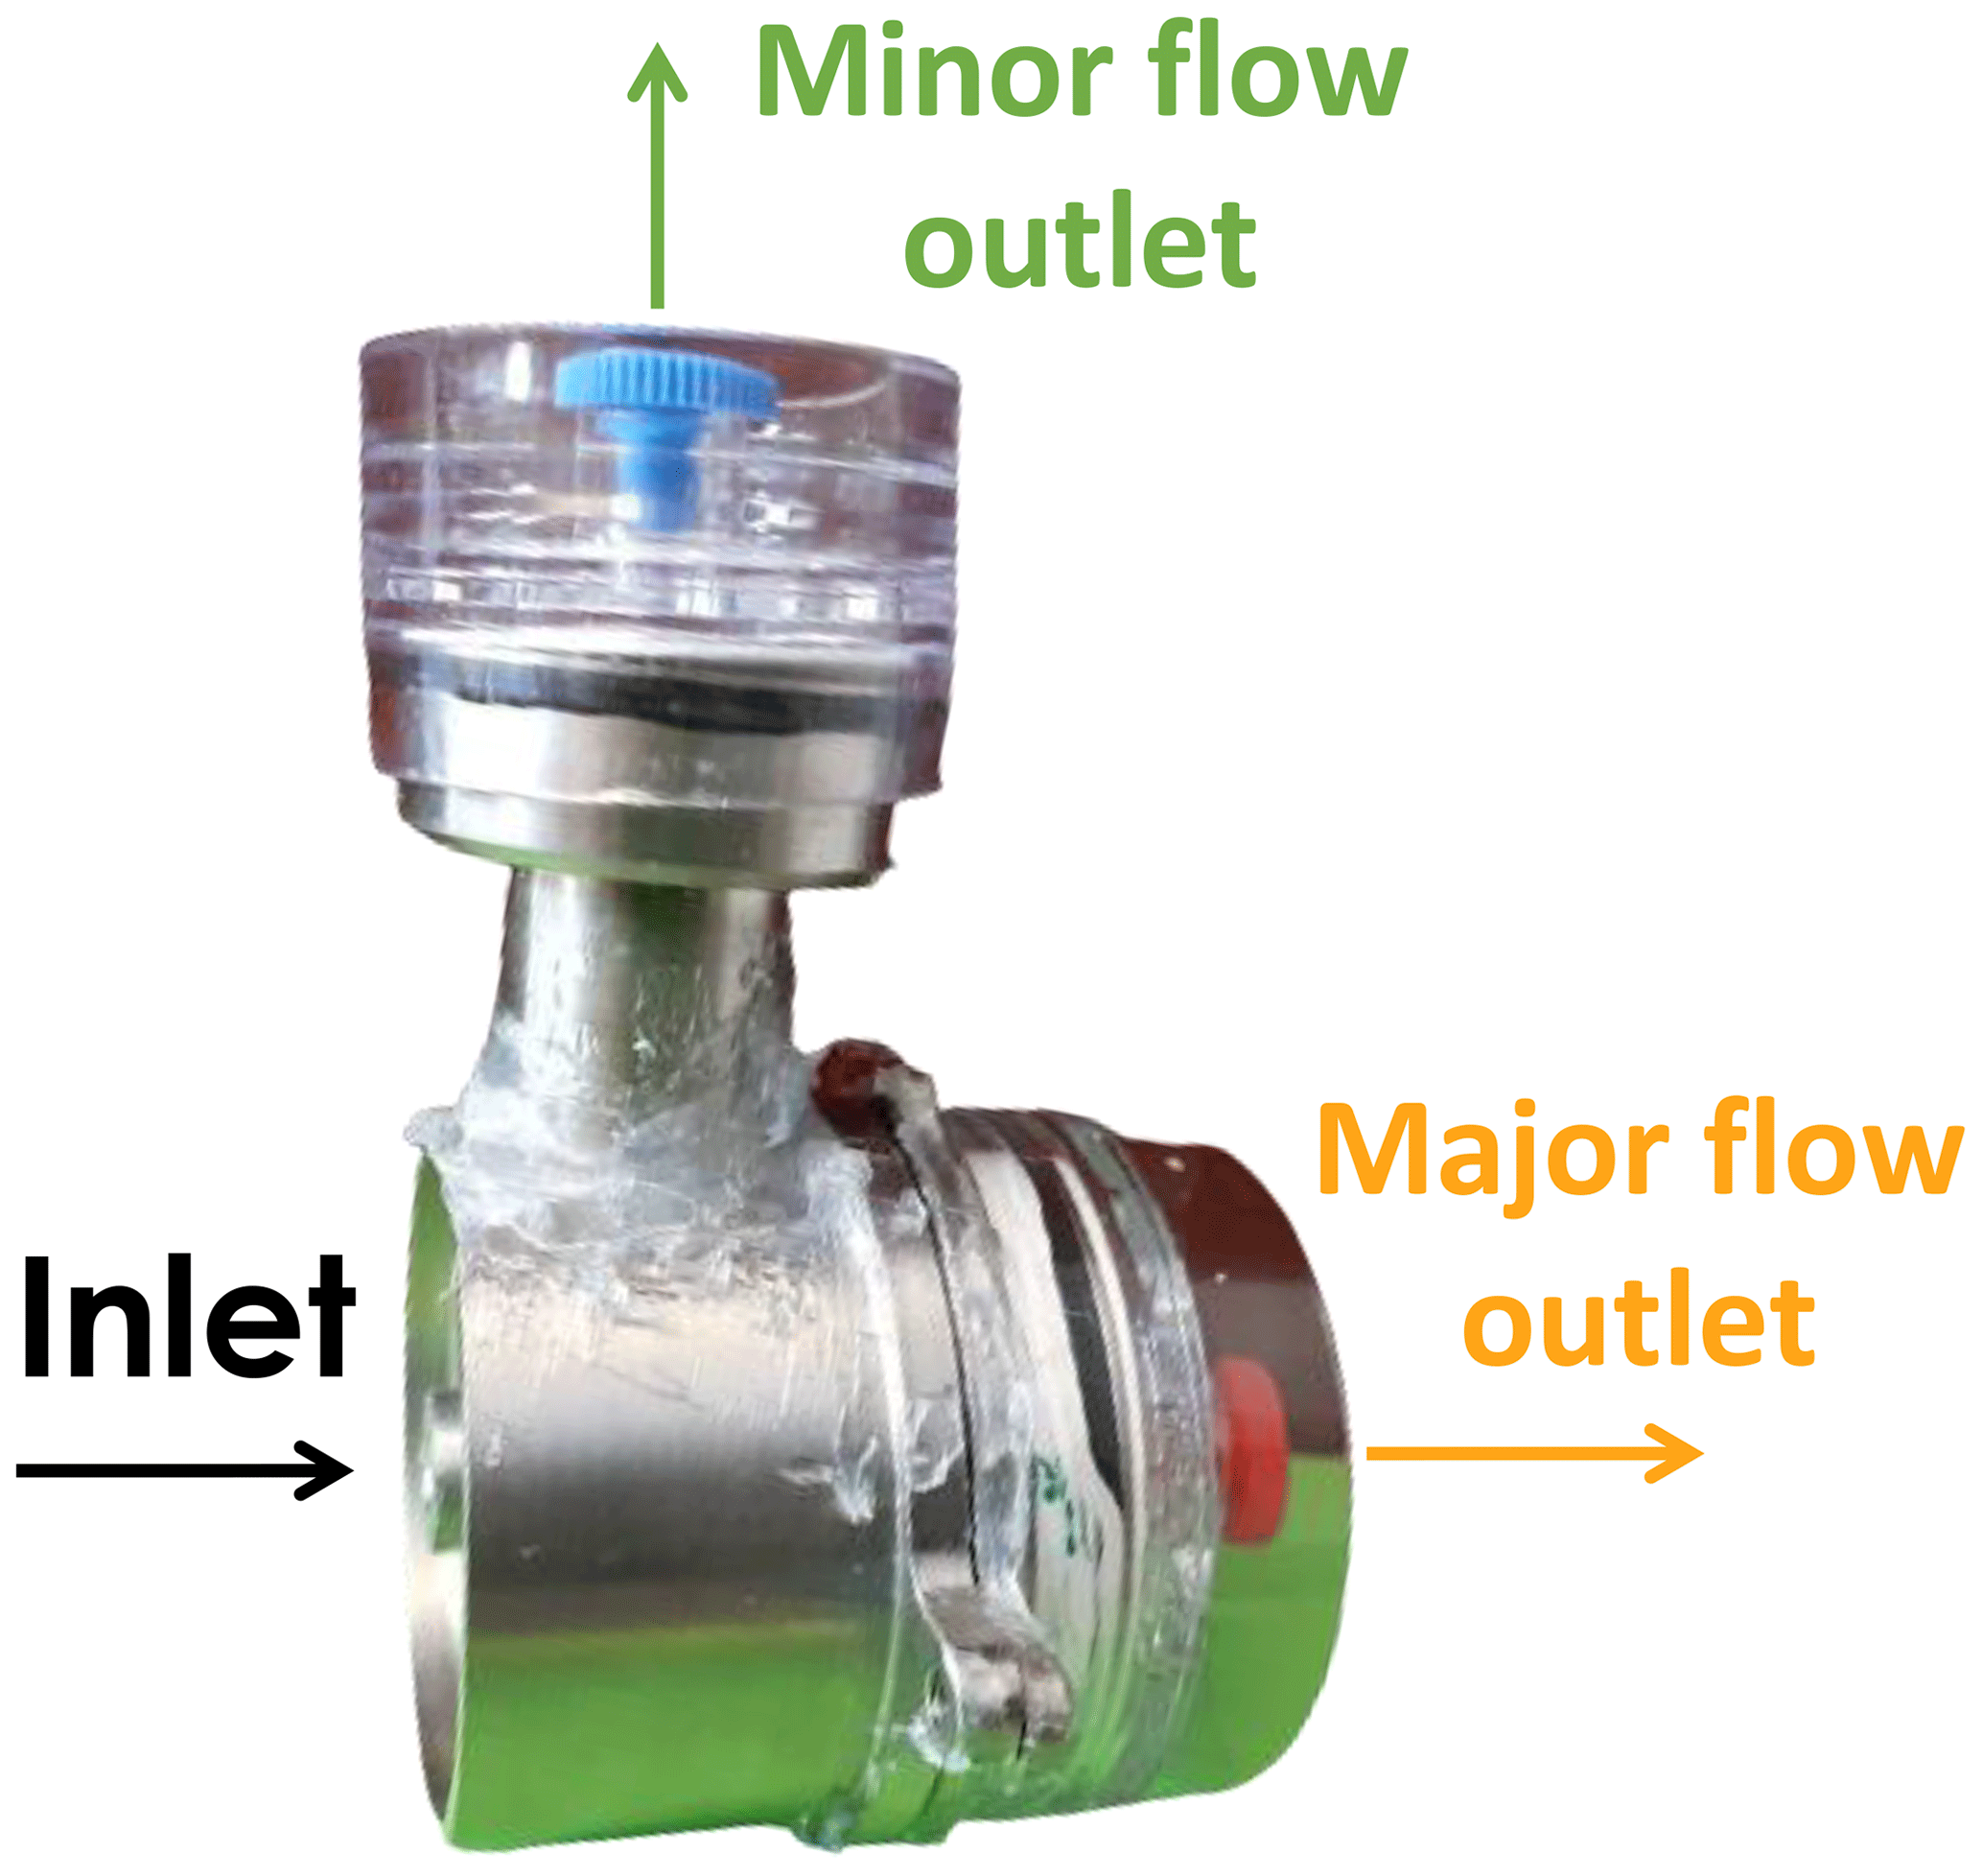
Figure 2Schematic diagram of the semivolatile aerosol dichotomous sampler (SADS). The diagram illustrates the positioning of the acceleration and collection nozzles and the division of the inlet airflow into a major (86 % of the inlet flow) and a minor flow outlet (14 % of the inlet flow). Each outlet is equipped with a filter and adsorbent for effective aerosol sampling. The different types of walls, used to determine the mass of particles collected on, are depicted by various dashed lines: acceleration nozzle walls, plenum walls, and collection nozzle walls.
The SADS is derived from the VI principle with an inverted split ratio between the major flow and the minor flow. The intended behaviour is as follows: the mixture of air, SVOC vapours, and SVOC aerosol particles is drawn into the device through its inlet (Fig. 2). This mixture is first accelerated by a convergent nozzle and reaches the separation gap of the device. In the separation gap, a small fraction of the flow is deflected laterally and directed to a first outlet, while a large fraction continues forward through a divergent collection nozzle. Because of their inertia, the particles should preferentially follow the main flow, while the concentration of the vapours remains unaffected by the separation of the flow. With ideal sizing, the minor flow is then free of particles, allowing the concentration of the vapour phase of the sampled SVOCs to be measured. Subtracting this vapour contribution from the mass of SVOCs collected with the main stream then allows the concentration of SVOC aerosol particles only to be retrieved. With an ideal design, the SADS then allows dichotomous analysis of airborne SVOCs.
For a given aerodynamic diameter of particles dae, the particle transmission efficiency ηp(dae) to the particle major flow outlet is defined as the ratio of particle mass collected at the major flow outlet to the total particulate sampled mass of particles with the same diameter (Eq. 1):
Similarly, ηv(dae) is the particle transmission ratio to the particle minor flow outlet, defined by the ratio of the particle mass collected at the minor flow outlet to the total particulate sampled mass (Eq. 2), for a given particle size.
Finally, we defined a particle deposition ratio ηd(dae) that corresponds to the ratio of the mass deposited on the inner wall of the SADS to the total particulate sampled mass, for a given particle size (Eq. 3):
In ideal working conditions of the SADS as a gas–particle separator, we expect ηd and ηv to be zero while ηp=1. The details of the device's geometric dimensions and the choice of minor and major flow rates determine the device's theoretical separation performance (Loo and Cork, 1988; Marple and Chien, 1980). In the present article, these choices are assumed to be theoretically optimal, and we study only the effects of certain design and manufacturing details on the device's ability to actually achieve its theoretical performance. Hence, minor and major flows are set constant at their theoretical optimum as specified.
In these conditions, the theoretical performance of the SADS in terms of ηp, ηv, and ηd has been extensively studied numerically by Belut et al. (2022); their work highlights the main factors influencing the representativeness of the CFD modelling of similar devices. In described operating conditions, they indicate that ηv=0 and ηp>98 % for dae in [0.9–20] µm (perfect separation). We may introduce a d50 cut-off diameter as the aerodynamic diameter of particles below which ηv is equal to half its maximum value of 0.143 (corresponding to no separation; in this case ηv equals the gas split ratio). Results from Belut et al. (2022) indicate that the theoretical d50 of the SADS is 0.44 µm, i.e. much smaller than most of SVOC aerosol diameters at the workplace. The SADS is hence in theory perfectly suitable for field use, where most of SVOC aerosol diameters are above the d50 of 0.44 µm (Cooper et al., 1996; Park et al., 2009). However, these performances are theoretical, hence the necessity of finding the conditions under which this is valid in actual realization of the SADS.
3.1 Aerosol generation
To assess the performance of the semivolatile aerosol dichotomous sampler (SADS), aerosols were generated using specialized equipment called the bench for organic aerosol (BOA), as depicted in Fig. 3. The BOA is a vertical wind tunnel designed to operate with controlled airflow velocities ranging from 0.1 to 0.5 m s−1 and humidity levels between 10 % RH to 90 % RH. Aerosols were introduced counter current at the head of the tunnel to ensure thorough mixing with the airflow. To achieve spatially homogeneous mixtures at the sampling zone, the air/aerosol mixture passed through a series of diaphragms with different meshes. The SADS prototypes, along with an isokinetic nozzle connected to online instrument measurements, were placed on a crown support in the sampling zone.
To maintain consistent experimental conditions, room temperature was set to 21 °C, atmospheric pressure was measured at 1018±10 hPa, relative humidity was regulated at 20 % RH, and airflow velocity was fixed at 0.2 m s−1. The airflow inside the tunnel was considered isothermal, incompressible, and turbulent, with a Reynolds number based on the tunnel size of approximately 4×10³.
The BOA was carefully calibrated to meet the requirements of the standard NF EN 13205-2:2014. Spatial homogeneity of velocities in the sampling section was confirmed, with the standard deviation below 1 % over the entire sampling zone. Similarly, the spatial homogeneity of particle concentration demonstrated standard deviation values below 10 %.
3.2 Aerosol generator
To produce aerosols for testing the SADS prototypes, a specialized condensation monodisperse aerosol generator (CMAG – TSI 3475) based on Sinclair–La Mer principle (Sinclair and La Mer, 1949) was employed. This specific generator condenses heated vapours of di-2-ethylhexyl sebacate (DEHS, CAS no. 122-62-3) homogeneously on thin particles of sodium chloride, referred to as nuclei, to form monodispersed liquid particles. The size of these particles ranges from 1 to 8 µm, depending on the selected generation conditions. Originally designed for use with DEHS and NaCl, the CMAG was modified to accommodate the use of glycerol and fluorescein (Steiner et al., 2017). This modification was necessary as DEHS is not water-soluble, making the analysis of particles collected on filters or internal walls of the sampler challenging and less sensitive. By replacing DEHS with glycerol and NaCl with fluorescein, water-soluble droplets were generated, and fluorescein could be quantified at a very low concentration (i.e. LoQ < 1 ng L−1 within water extract).
The aerosol production process within the CMAG initiates with the nebulization of a water solution, specifically composed of 0.8 g L−1 fluorescein and 5 g L−1 sodium hydroxide in pure water, within an atomizer. This step is succeeded by the drying of the droplets in a diffusion dryer. Following the diffusion dryer, small nuclei, constituted of a blend of fluorescein and sodium hydroxide, were generated. These nuclei, serving as condensation nuclei, exhibited sizes ranging from 10 to 100 nm. These nuclei were then exposed to a saturated vapour of glycerol downstream of the saturator. The resulting mixture of glycerol vapour and nuclei was directed to a re-heater and subsequently cooled down in a condensation chimney to produce the monodisperse aerosol.
It is important to note that the size of the generated particles could be adjusted by modifying the temperature of the saturator or the number concentration of nuclei. For this study, aerosols with mass median aerodynamic diameters (MMAD) of circa 0.15, 2, 3, and 4.5 µm were produced and used for the experiments.
3.3 Aerosol characterization
Characteristics of the generated aerosols were measured continuously during the generation process. Aerodynamic particle sizes and geometric standard deviations (GSDs) were measured using a TSI aerodynamic particle sizer (APS 3321) associated with an aerosol diluter (TSI 3302 A) for particles ranging from 0.5 to 20 µm. For particles ranging from 0.056 to 0.560 µm, a TSI fast mobility spectrometer (FMPS – 3091) was used. The FMPS apparatus measures a mobility diameter that was converted in this study in an aerodynamic diameter using the following equations, considering that all particles generated during this study were spherical:
where dm is the particle mobility diameter, dae the aerodynamic diameter, “Cu” the Cunningham correction factor calculated with the appropriate diameter, ρ0 the reference density (1000 kg m−3), and ρp the real density of the particle (kg m−3).
The particle density exhibits variability between nuclei and condensed glycerol particles. Based on the initial composition of the fluorescein solution utilized for generating nuclei, the density of the nuclei was determined to be 1720 kg m−3 after total desiccation. In contrast, the density of the condensed particles is approximated to the density of pure glycerol, given the negligible mass of the nuclei compared to the mass of glycerol that condenses on them. Consequently, particles with diameters of 2 µm and above are considered to possess a density of approximately 1260 kg m−3.
To further enhance the relevance of this study, the physical diameter of the particles is approximated by the measured aerodynamic diameter, considering the spherical nature of the particles. This approximation facilitates the conversion of the number-based particle size distribution into a mass-based particle size distribution, a parameter of greater significance for our research objectives. Following the conversion from a number-based to a mass-based particle size distribution, we proceeded to calculate the mass median aerodynamic diameter (MMAD). This parameter serves as a valuable metric, providing a comprehensive characterization of the aerosol particles in our investigation.
The measurement of aerosol characteristic by APS and FMPS apparatus allows modulating the particle diameter produced by the CMAG and verifying the stability of the aerosol concentration during the experiment. Averages are shown in Table 1. Note that the aerosol with a MMAD of 0.16 µm exhibited a high GSD of 1.56, which does not meet the monodisperse criteria with a GSD < 1.2. Specifically for this aerosol, the particles measured were actually nuclei generated by removing the glycerol from the CMAG. Consequently, without glycerol condensation on their surfaces, their diameters could not be homogenized. In summary, we typically measured the particle size distribution of nuclei generated before condensing glycerol on them to produce micron-monodispersed particles.
Table 1Averaged particle size distributions of the test aerosols (N=3 ± SD).
The stability of aerosol concentration in the sampling zone was verified, with a mass concentration deviation below 6 % across experiments.
3.4 SADS prototypes
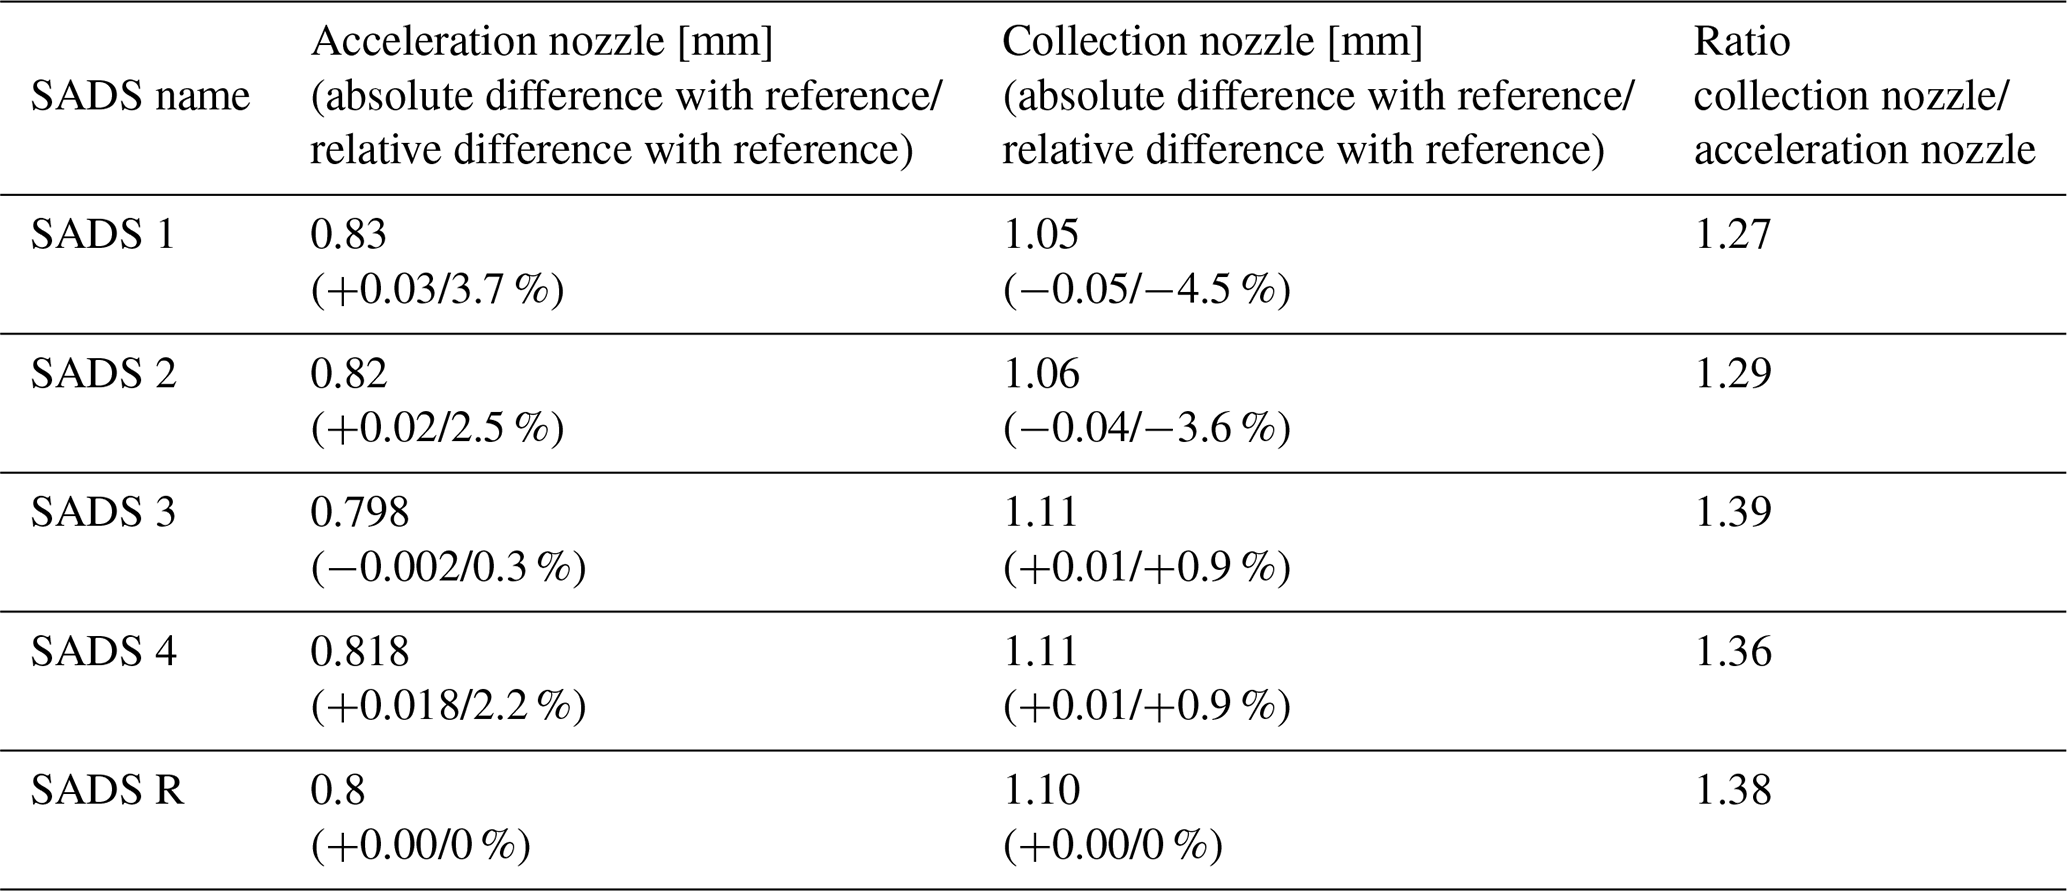
The STAMI, Norway, had five titanium SADS (Kim and Raynor, 2009) prototypes. Photographs of the SADS prototype components are presented in Fig. 4, illustrating the acceleration nozzle and the collection nozzle, along with the connection of a cassette to the SADS sampler. The SADS prototypes investigated in this study were manufactured by a precision mechanics workshop, resulting in slight deviations in their nozzle diameters compared to the reference dimensions proposed by Kim and Raynor (2009). These deviations were attributed to the inherent tolerance of the manufacturing process. Specifically, one of the prototypes (SADS R) exhibited nozzle diameters identical to those of the 2009 version, serving as the reference case for comparisons. The remaining prototypes (SADS 1, SADS 2, SADS 3, and SADS 4) showed minor differences in their nozzle diameters relative to the reference, as detailed in Table 2. The deviations, both absolute and relative, are provided for both the acceleration and collection nozzles. These dimensions were measured using scanning electron microscopy (SEM) for accuracy. The maximum deviation of nozzle diameter with respect to the reference dimensions of SADS R (Kim and Raynor, 2009, dimensions) was +0.03 mm (+3.7 %) for the acceleration nozzle and −0.05 mm (−4.5 %) for the collection nozzle.
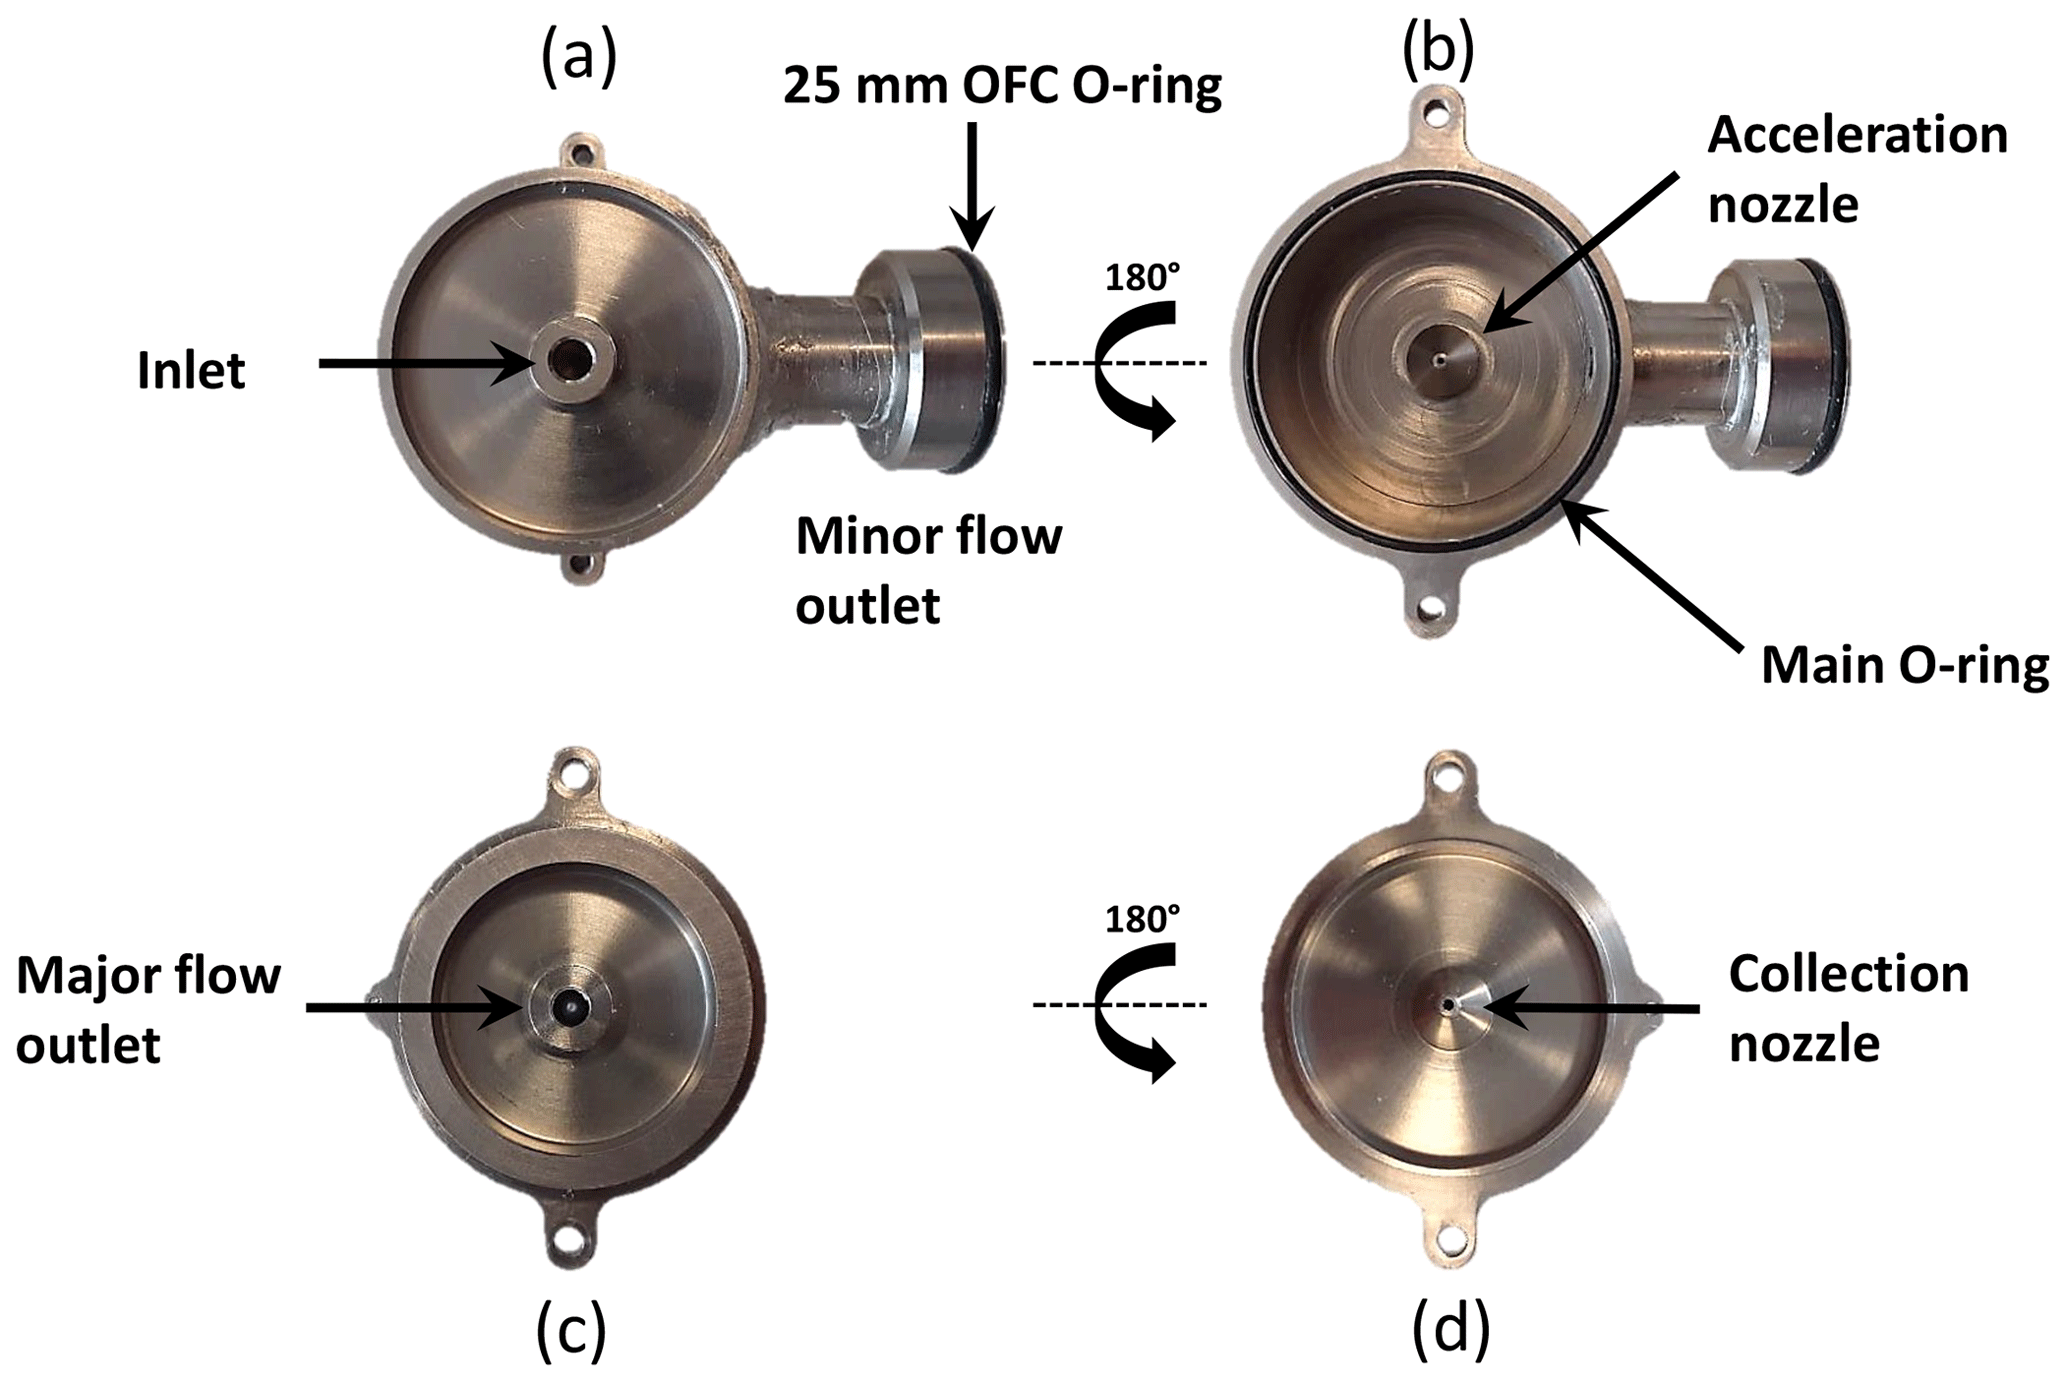
Figure 4Photographs of the SADS prototype, consisting of two main components – the acceleration nozzle (a) and the collection nozzle (b). The upper left photo (c) shows the inlet side of the acceleration nozzle, while the lower left photo (b) displays the outlet side of the collection nozzle. On the outlet side of the collection nozzle (d), a 37 mm cassette is easily connected to the SADS sampler.
3.5 SADS sampling procedure
The performance evaluation of the five SADS prototypes was conducted simultaneously in the sampling zone of the bench for organic aerosol (BOA) (Fig. 3). Prior to testing, each prototype was meticulously cleaned using ethanol and pure water. The samplers were equipped with Whatman quartz microfiber filters placed into 37 and 25 mm open-face cassettes (OFCs) and connected at the major outlet and the minor outlet (Fig. 2), respectively. The flow rates at the major flow outlet (1.8 L min−1) and the minor flow outlet (0.3 L min−1), corresponding to a total inlet flow rate of 2.1 L min−1, were precisely controlled using flow meters (Gilian Gilibrator 2).
3.6 Fluorescence analysis
After each generation test, the sampling procedure for fluorescence analysis was carried out. The Whatman quartz microfiber filters contained in the 37 and 25 mm OFCs were extracted separately and analysed for fluorescence content. Each filter in the closed-face cassette (CFC) and OFC was inserted into independent vials. A volume of 2 to 8 mL of the extraction solution, consisting of ultrapure water with a concentration of 5 g L−1 of NaOH, was added to the vial to dissolve the collected droplets of glycerol and their fluorescein–sodium hydroxide nuclei. The walls of the CFC were also washed with the extraction solution (pure water basified with 5 g L−1 of NaOH), and the resulting volume was combined with the one in the vial containing the CFC filter. After 20 min of mechanical shaking, the extracts were filtered through a PTFE syringe filter with a pore size of about 0.2 µm to prevent any disruption of the fluorescence measurement.
Wall deposition inside the SADS was determined by using 2 mL of the extraction solution to wash each wall of the SADS separately. Three different extracts were obtained: one from the acceleration nozzle wall (carried particle mass ), one from the collection nozzle wall (carried particle mass ), and one from the plenum wall (carried particle mass ) (Fig. 2).
The extracts were then analysed for fluorescence using a portable ESElog fluorescence detector (Qiagen, Germany), with an excitation wavelength of 485 nm and an emission wavelength of 520 nm. The linear range of the ESElog fluorescence detector defined the lower (LLOQ) and upper (ULOQ) limits of quantification, which covered the concentrations encountered in this work (LLOQ = 0.33 ng L−1, ULOQ = 4×10⁴ ng L−1).
For each tested aerosol aerodynamic diameter da, the total sampled mass minlet is evaluated as the sum of sampled masses:
and the fractional deposition ratio ηd(dae) is computed as
and local deposition ratios at the acceleration nozzle (), collection nozzle () and in the plenum () are respectively computed from
Because monodisperse aerosols are used, the masses evoked in this paragraph are all linearly related to the amount of fluorescent dye that they carry. Hence, deposition ratios are directly computed from the measured masses of fluorescent dye.
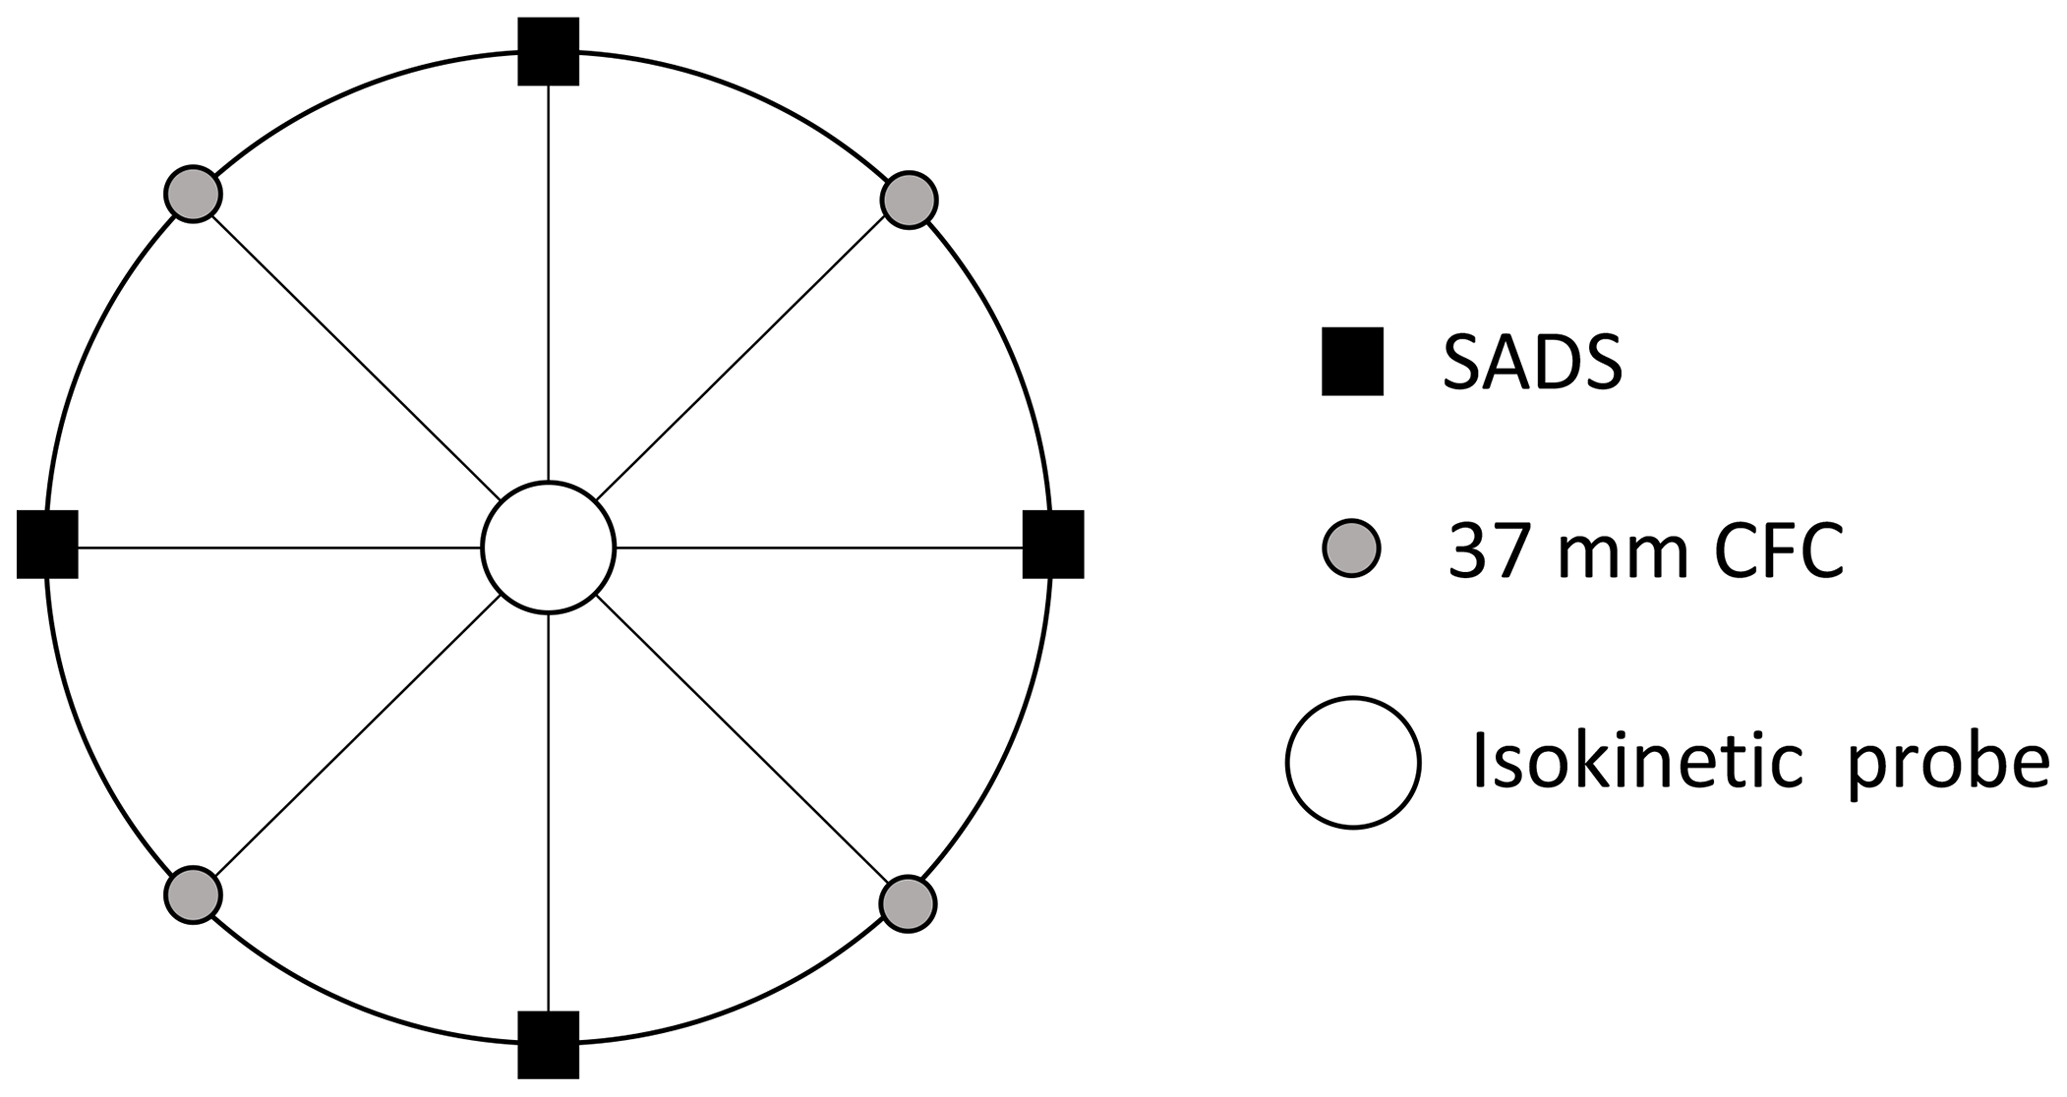
3.7 Mass balance verification
A mass balance verification step was adopted to verify that the protocol allowed recovering all particles sampled by the SADS. The SADS prototypes and 37 mm CFCs equipped with Whatman quartz microfiber filters were arranged alternately on the crown support (Fig. 5). The 37 mm CFCs equipped with Whatman quartz microfiber filters served as reference samplers, enabling the determination of the total mass of particles collected on the filter and walls of the CFC, in comparison to the particle mass measured by the SADS prototypes.
All SADS and 37 mm CFCs presented a standardized 4 mm aerosol-sampling orifice and operated at the same sampling flow rate of 2.1 L min−1. This standardization ensured that the total mass collected inside the 37 mm CFCs corresponded to minlet, the total mass sampled by the SADS, which includes the contribution of both the OFC placed at the minor and major flow outlets and the wall deposits. By comparing , the total particle mass measured by the SADS i, with the mean reference mass measured by the 37 mm CFCs (), we introduce the mass balance ratio of SADS i as
This mass balance makes it possible to assess the overall efficiency of the protocol used to measure the distribution of particles collected by SADS, between deposits and major and minor outlets.
Additionally, the use of the 37 mm CFCs allows assessing the spatial homogeneity of the aerosol distribution within the sampling zone. No significant spatial variation was observed across different positions of the CFCs (CV < 5 %). With this assurance of spatial homogeneity, the individual SADS mass balance (MbSADS) was calculated using Eq. (5) for each of the SADS prototypes.
3.8 Leak evaluation
Any form of leakage is known to compromise the sampling performances of aerosol samplers such as SADS, by disrupting the airflow and path lines within the nozzles and separation zone. Experimental tests were carried out to examine the leakage resistance of the proposed SADS assembly, to observe the effects of leaks and to determine an acceptable leakage limit for the SADS.
As the SADS operates under depression, a leakage test was performed using a digital pressure calibrator (DPC – FSM AG) set to a depression of −4000 Pa, equivalent to the operating pressure of the system. Following a stabilization period, the DPC's internal pump was deactivated, and the pressure was continuously measured to determine the leakage rate (LR) in Pa s−1 (Eq. 12). Three levels of air tightness were defined: low, medium, and high, corresponding to LR values of LR ≥ 13 Pa s−1, 4 Pa s−1 ≤ LR < 13 Pa s−1, and LR < 4 Pa s−1, respectively.
where P0 and Pf represent the pressures at t=0 s and at the final time, respectively, and Δt is the duration of the leak test.
3.9 Supporting CFD model
The CFD modelling approach employed in this study to support observations is documented in detail in Belut et al. (2022). Simulations are conducted using ANSYS FLUENT V.19.3 software. After due examination of the most influent modelling and physical factors affecting the significance of results, a 2D axisymmetric reduction of the inner volume of the SADS is used to perform simulations. A low-Reynolds realizable k−ε turbulence model is used to model the incompressible airflow, with a free-inlet boundary condition at the entrance of the SADS, following the guidelines of Belut et al. (2022). Aerosol particle fates are computed through a Lagrangian tracking of their centre of mass, taking into account turbulent dispersion and using a free-inlet boundary condition at the inlet. External forces acting on particles are reduced to drag force, including rarefaction effect. Impaction and interception phenomena are taken into account for wall losses, particles assumed to be trapped when they hit a wall (consistent with the liquid nature of present aerosols). An extensive verification of computations with respect to grid size, numerical resolution tolerances, and number of used aerosol trajectories was performed, exactly as exposed in Belut et al. (2022). For further insights into the model's design and its applicability to the SADS, interested readers are encouraged to refer to the aforementioned study. Following Belut et al. (2022), simulation results are realistic, within the calculated uncertainties, unless one of the following occurs: (1) the SADS walls are not smooth, (2) there is a difference between the actual and simulated geometry, or (3) residual turbulence exists at the SADS inlet (with a Kolmogorov timescale much greater than the aerodynamic response time of the particles, which does not correspond to normal ambient conditions).
4.1 Leak effects
The air tightness tests conducted revealed significant leakages, primarily occurring at the O-ring seal between parts A and B (Fig. 2) of the SADS prototypes. Additional leaks were also identified at the connection points between the open-face cassette (OFC) and the major and minor outlets of the SADS. Notably, SADS 1, 2, 3, and 4 displayed varying levels of air tightness during the tests, with the exception of SADS R, which consistently exhibited high air tightness across all tests. Figure 6 illustrates the evolution of mass balance and mass distributions for the five SADS prototypes with varying levels of air tightness.
The aerosol generated in the three tests was monodispersed with a size distribution centred on a MMAD of 3.11 ± 0.21 µm, with a GSD of 1.14 ± 0.03 and a particle number concentration of 10 124 ± 320 particle cm−3.
Tests on the leak effects on the performance of the SADS were also conducted with aerosols having MMAD of 2 and 4.5 µm. The results and conclusions were consistent with the distributions presented, indicating that the outcomes converge towards those presented in the following section.
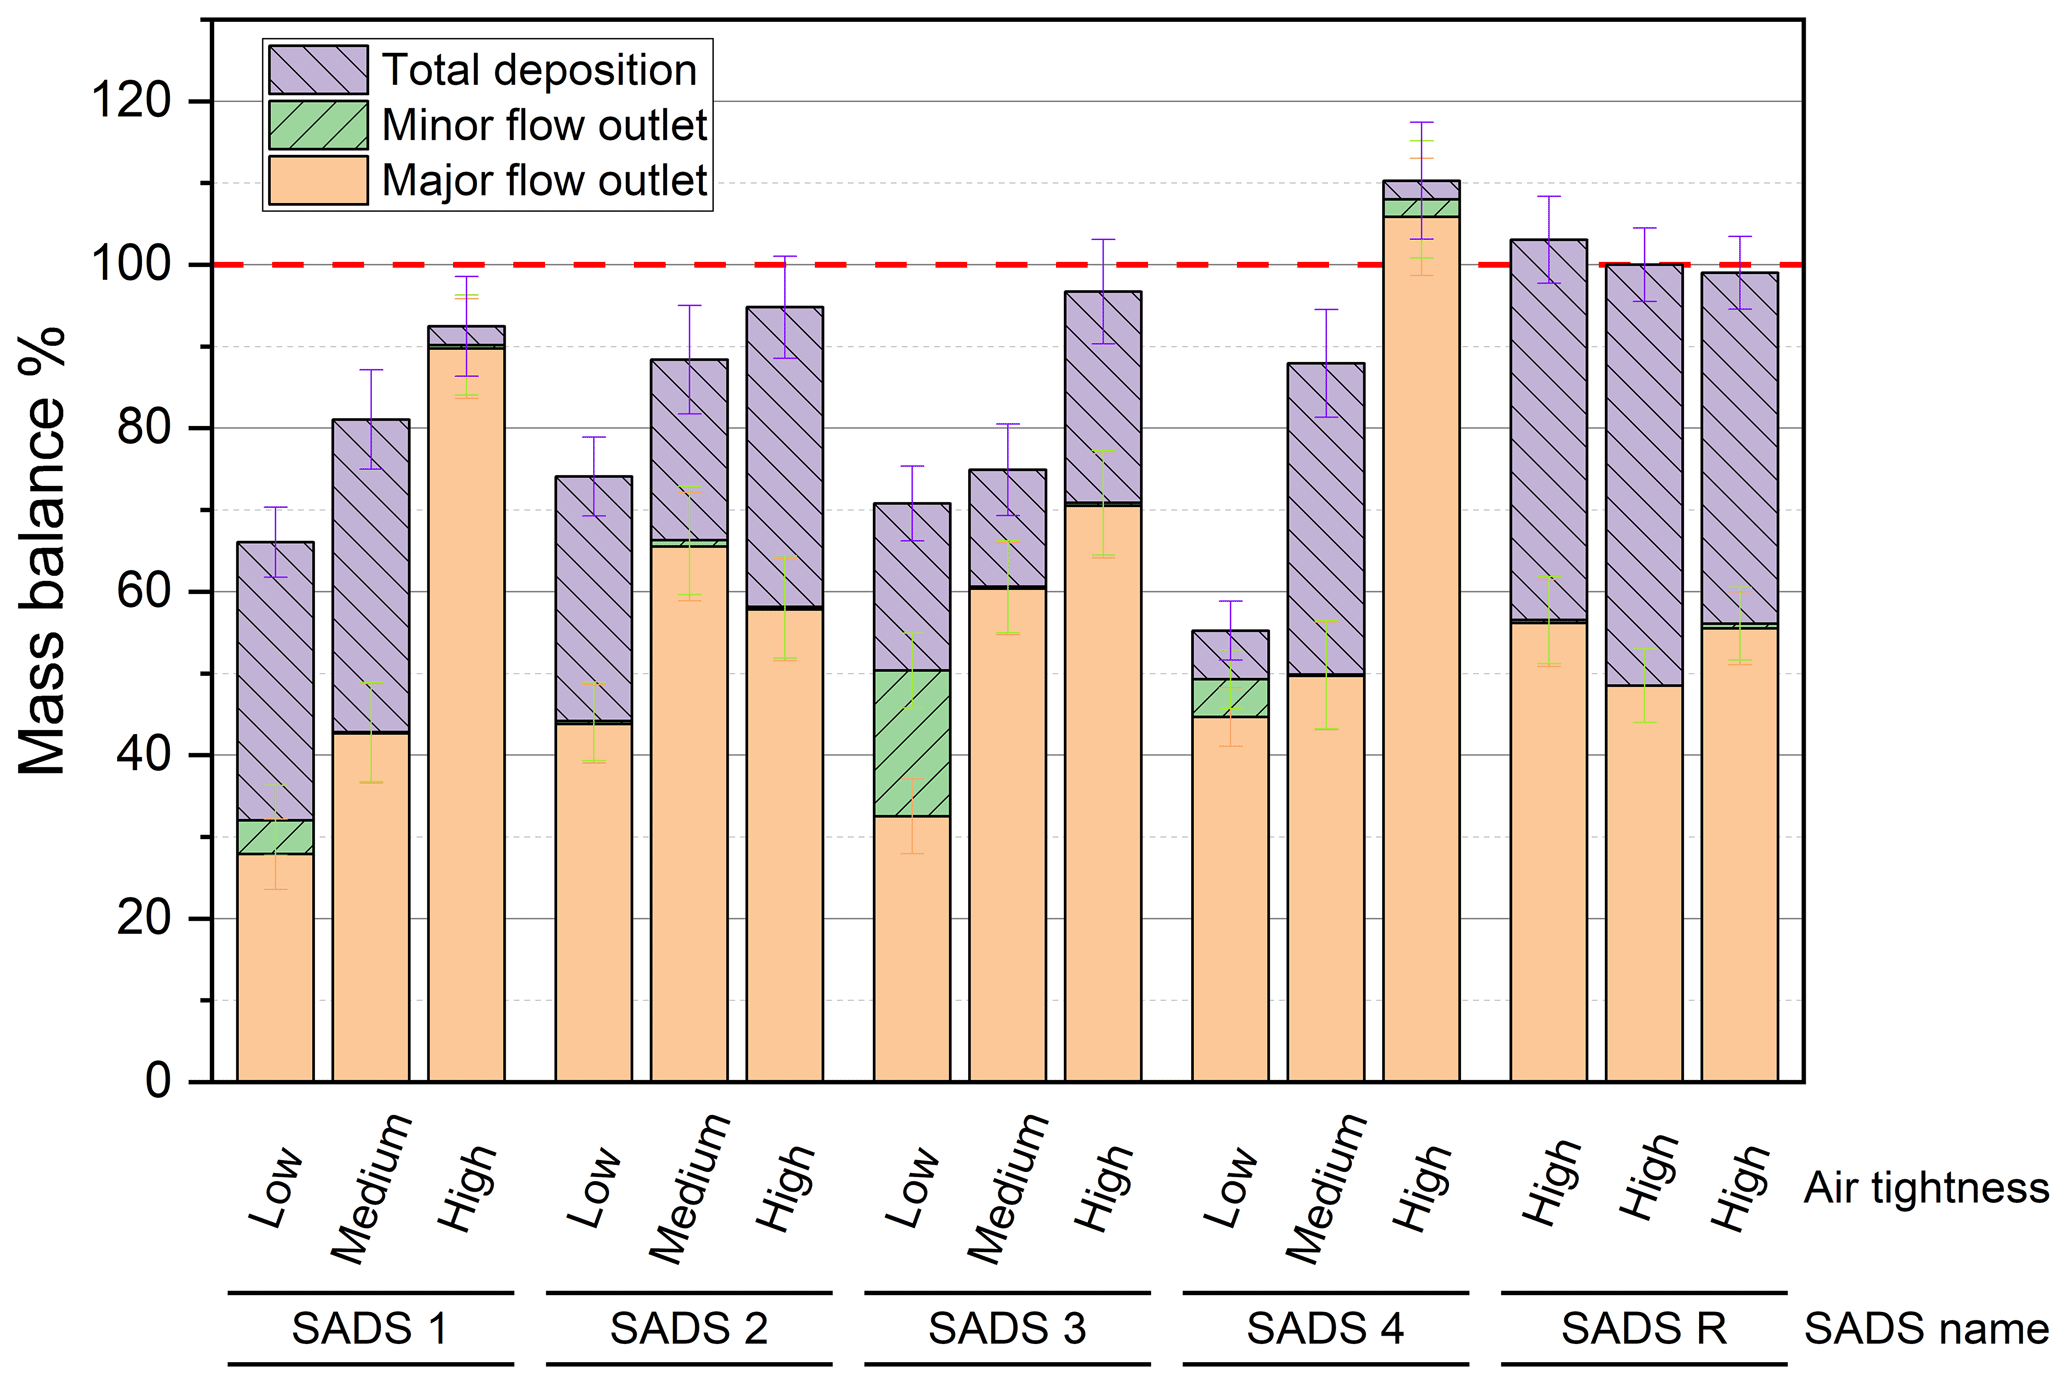
Figure 6Mass balance in the SADS prototypes in function of the air tightness level. Error bars represent the standard deviation calculated on five replicates for each condition.
Low air tightness led to a substantial decrease in the mass balance of SADS 1, 2, 3, and 4 (Fig. 6), with mass balances reaching 66 ± 6.2 %, 74 ± 6.8 %, 70 ± 6.58 %, and 55 ± 7.59 %, respectively. Only when a high level of air tightness was achieved could a mass balance of 90 % or higher be attained for all prototypes.
Moreover, low air tightness resulted in an undesirable increase in the mass fraction collected at the minor flow outlet. Presumably, leaks disturbed the airflow in the separation space, leading to the deviation of larger particles to the minor flow outlet than theoretically expected.
Globally, leaks not only influenced the total amount of particles collected within the SADS but also affected the particle transmission ratio to the major and minor outlets, which make results from leaky SADS unreliable.
A systematic leak test is then mandatory before using the SADS for sampling purposes. To ensure reliable and accurate results, the SADS should only be considered suitable for sampling when the leakage rate (LR) is below 4 Pa s−1. Keeping the leakage rate within this acceptable limit will help maintain the integrity of the SADS and improve the reliability of the concentrations measured during sampling operations. For further development, we also recommend revising the design of future realization of the SADS to guarantee its air tightness.
Due to difficulties in maintaining a constant level of air tightness for SADS 3 and 4 throughout all experimental tests, further experimentation with these two prototypes was not conducted.
4.2 Theoretical effect of actually manufactured nozzle diameters
Before comparing theoretical and actual performances of manufactured SADS, the effect of the lack of precision on the actually manufactured nozzle diameters is examined from a theoretical point of view, using the CFD model with the measured nozzle diameters of SADS 1, 2, 3, 4, and R. The numerical model computed the ηp curves for each SADS prototype across a range of aerodynamic particle diameters from 0.1 to 20 µm, and the results are presented in Fig. 7. Error bars correspond to 1 standard deviation of values arising from turbulent dispersion.
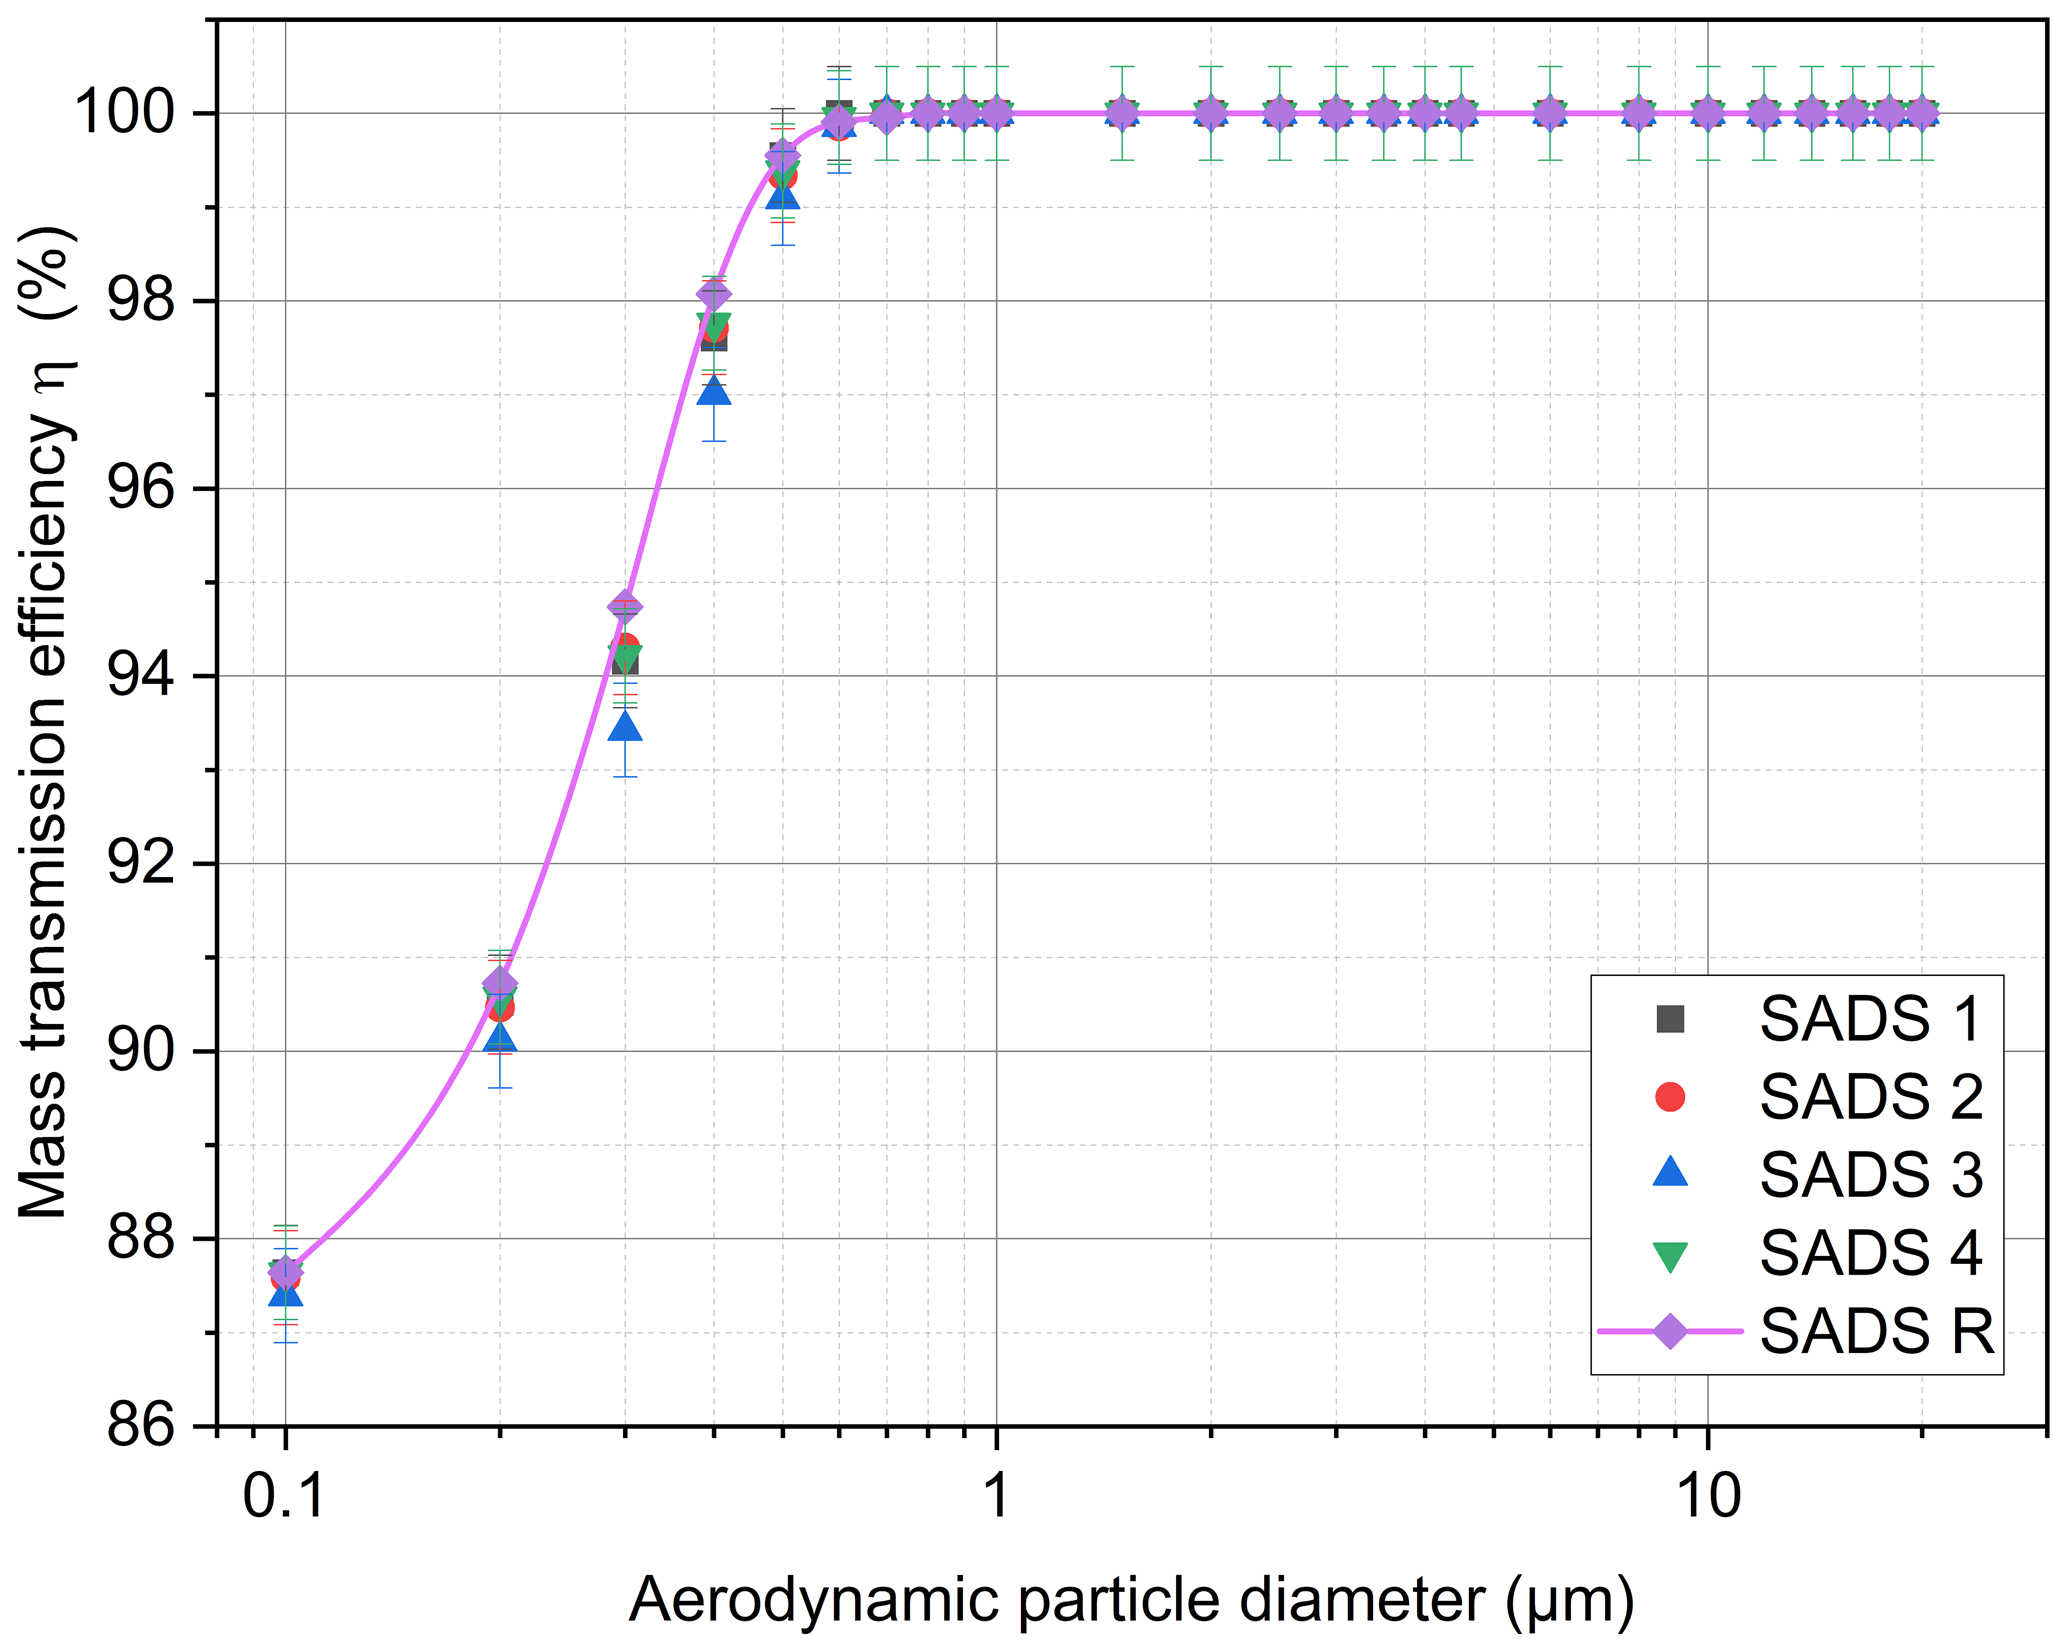
Figure 7Evolution of CFD mass transmission of the SADS prototypes, accounting for variation in nozzle diameters.
The theoretical ηp curves calculated by the numerical model are similar for all SADS prototypes (Fig. 7). SADS 3 exhibits the maximum difference compared to the reference SADS R transmission efficiency curve, but this difference remains below 3 % for all diameters. Overall, the variations observed in the nozzle diameters actually machined are not expected to lead to radically different sampling performance between the different prototypes.
These results are consistent with findings from a previous study on a VI by Marple and Chien (1980), who observed that increased ratios between nozzle diameters led to increased wall deposition, above the recommended value of 1.33 (and thus to decreased transmission ratios). From Table 2, we indeed see that SADS 3 exhibits the largest nozzle diameters ratio (1.39) of the prototypes. All ratios are, however, below 1.49 as recommended by Marple and Chien (1980).
4.3 Actual vs. theoretical particle transmission efficiency
Figure 8 compares the theoretical and actually measured ηp curves of the three airtight SADSs.
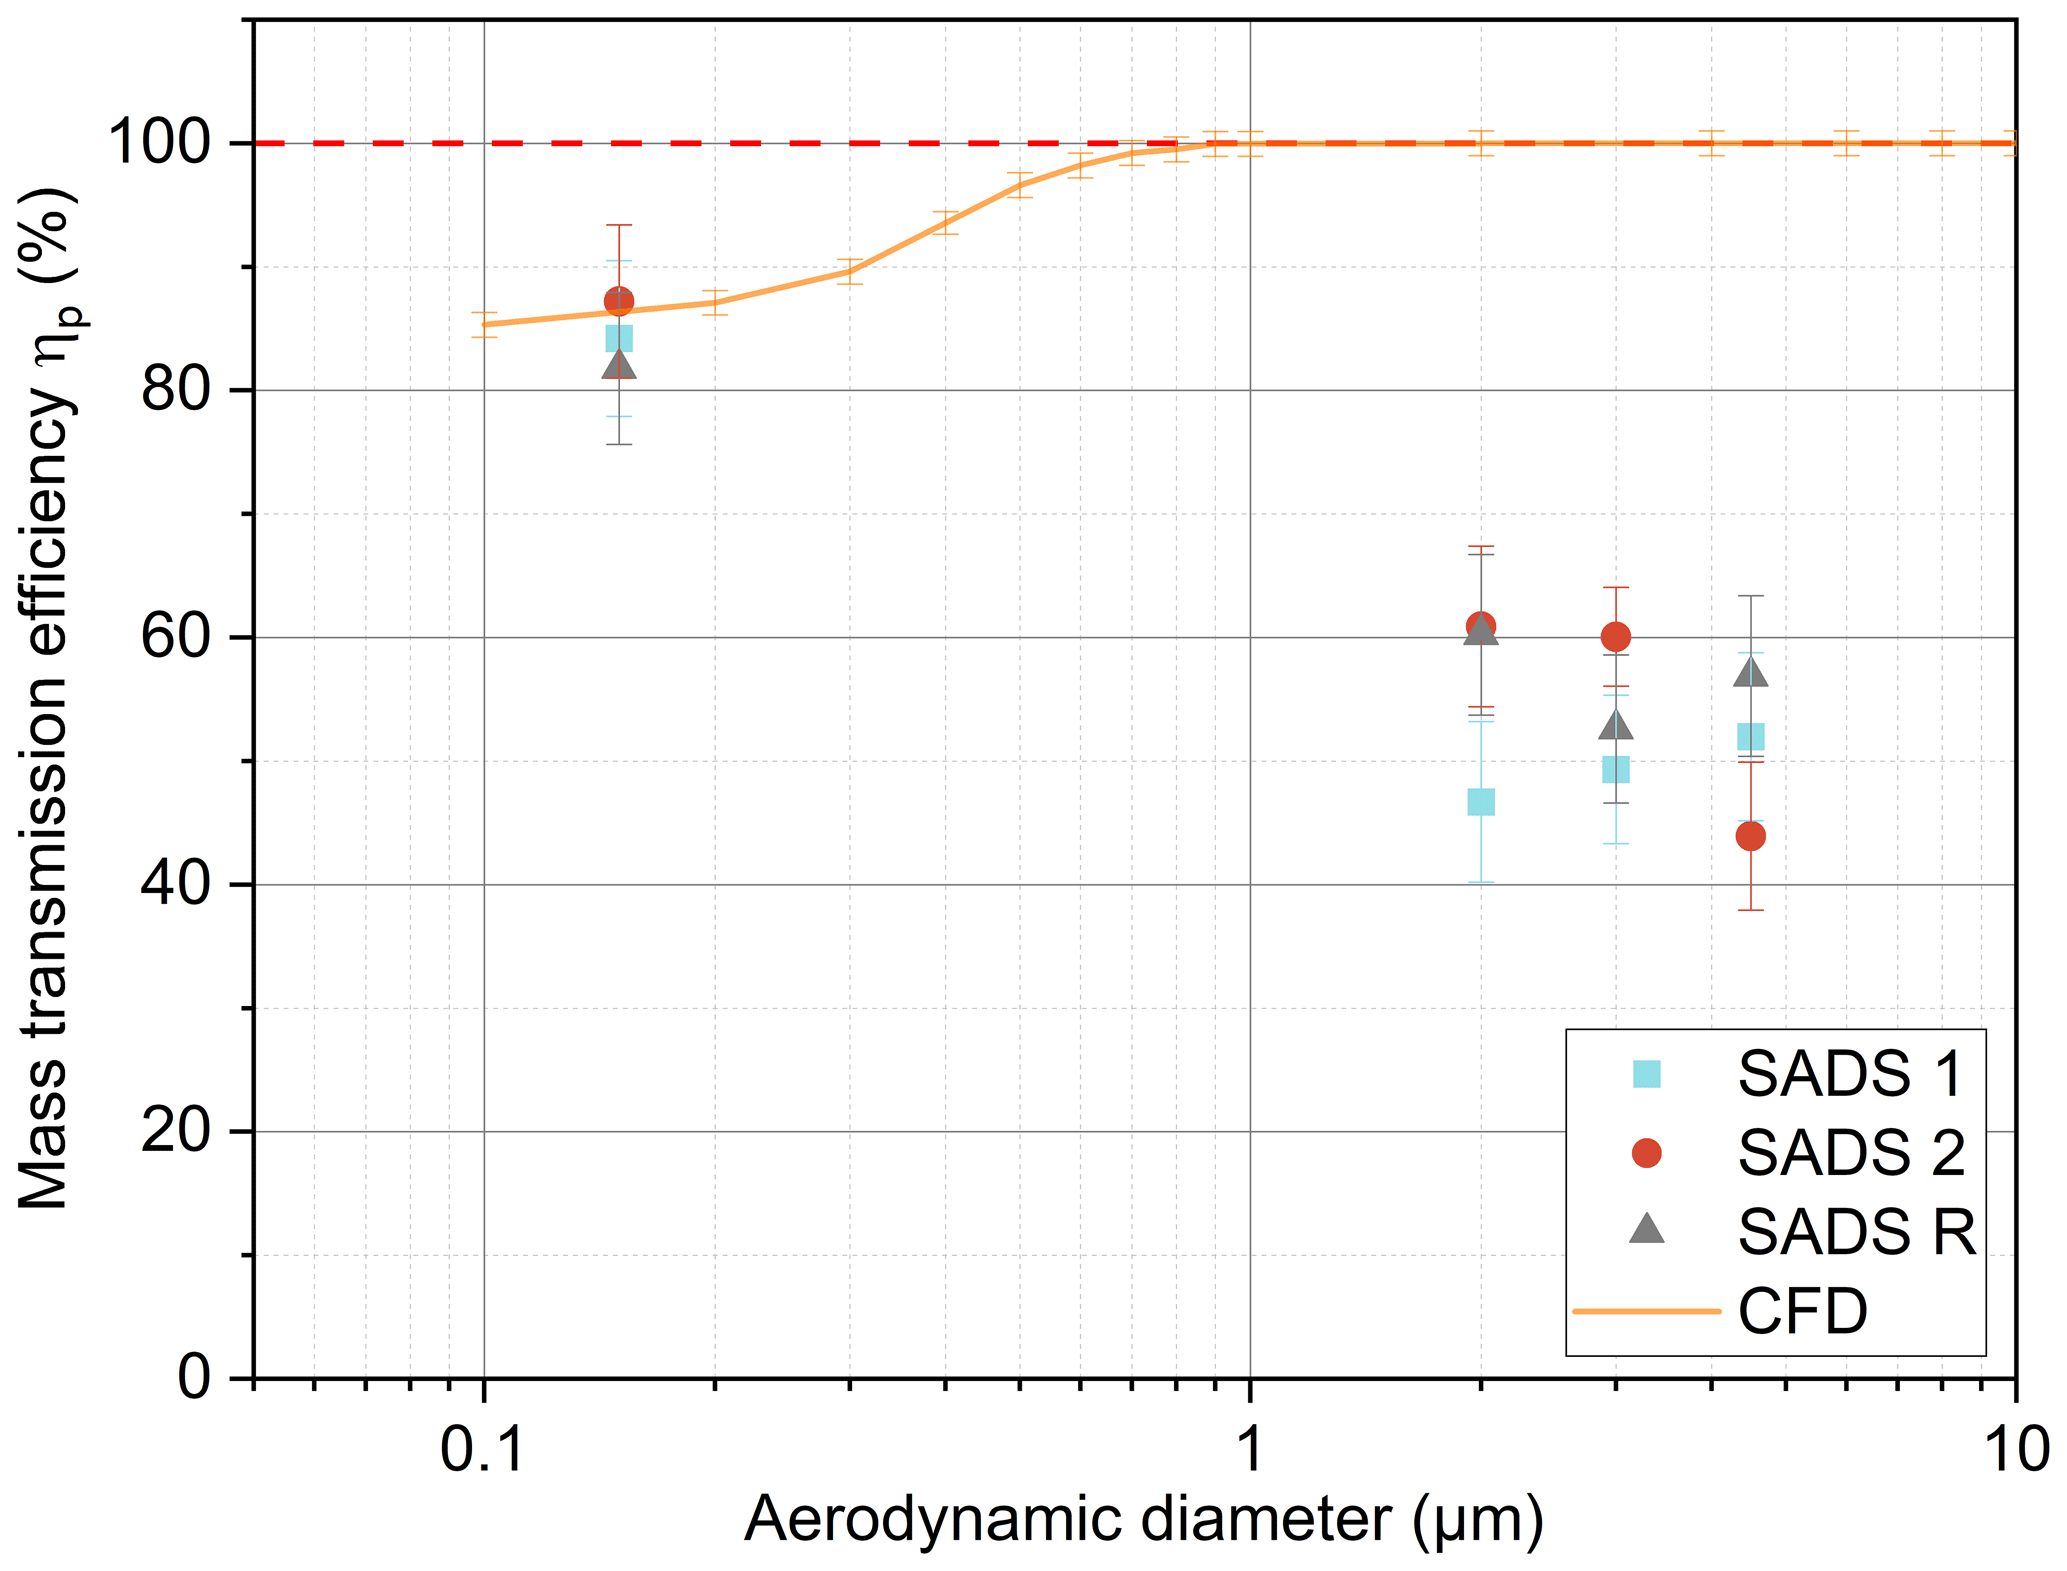
Figure 8Comparison of theoretical CFD transmission efficiency ηp (SADS R) with experimental results for SADS 1, SADS 2, and SADS R. Error bars represent 1 standard deviation for CFD simulations due to turbulent dispersion and measuring uncertainty for experimental data.
For aerosols with a reference diameter of 0.15 µm, numerical predictions are in accordance with experimental tests, with transmission efficiencies to the major and minor flow outlets close to the ratio between the major and the minor flow ( % for the model and % experimentally). This corresponds to the expected behaviour of low inertial particles that are not separated by the SADS. We shall see, however, in the following section that a substantial fraction of these particles is actually deposited experimentally, in contradiction with theoretical results.
For the inertial particles tested with nominal diameters 2, 3, and 4.5 µm, ηp is measured as always less than about 60 %, whereas 100 % is theoretically expected for the SADS in free-sampling situation. The origin of this difference is examined first by considering the particle deposition ratio in the next sections.
4.4 Fate of inertial particles and repeatability issues
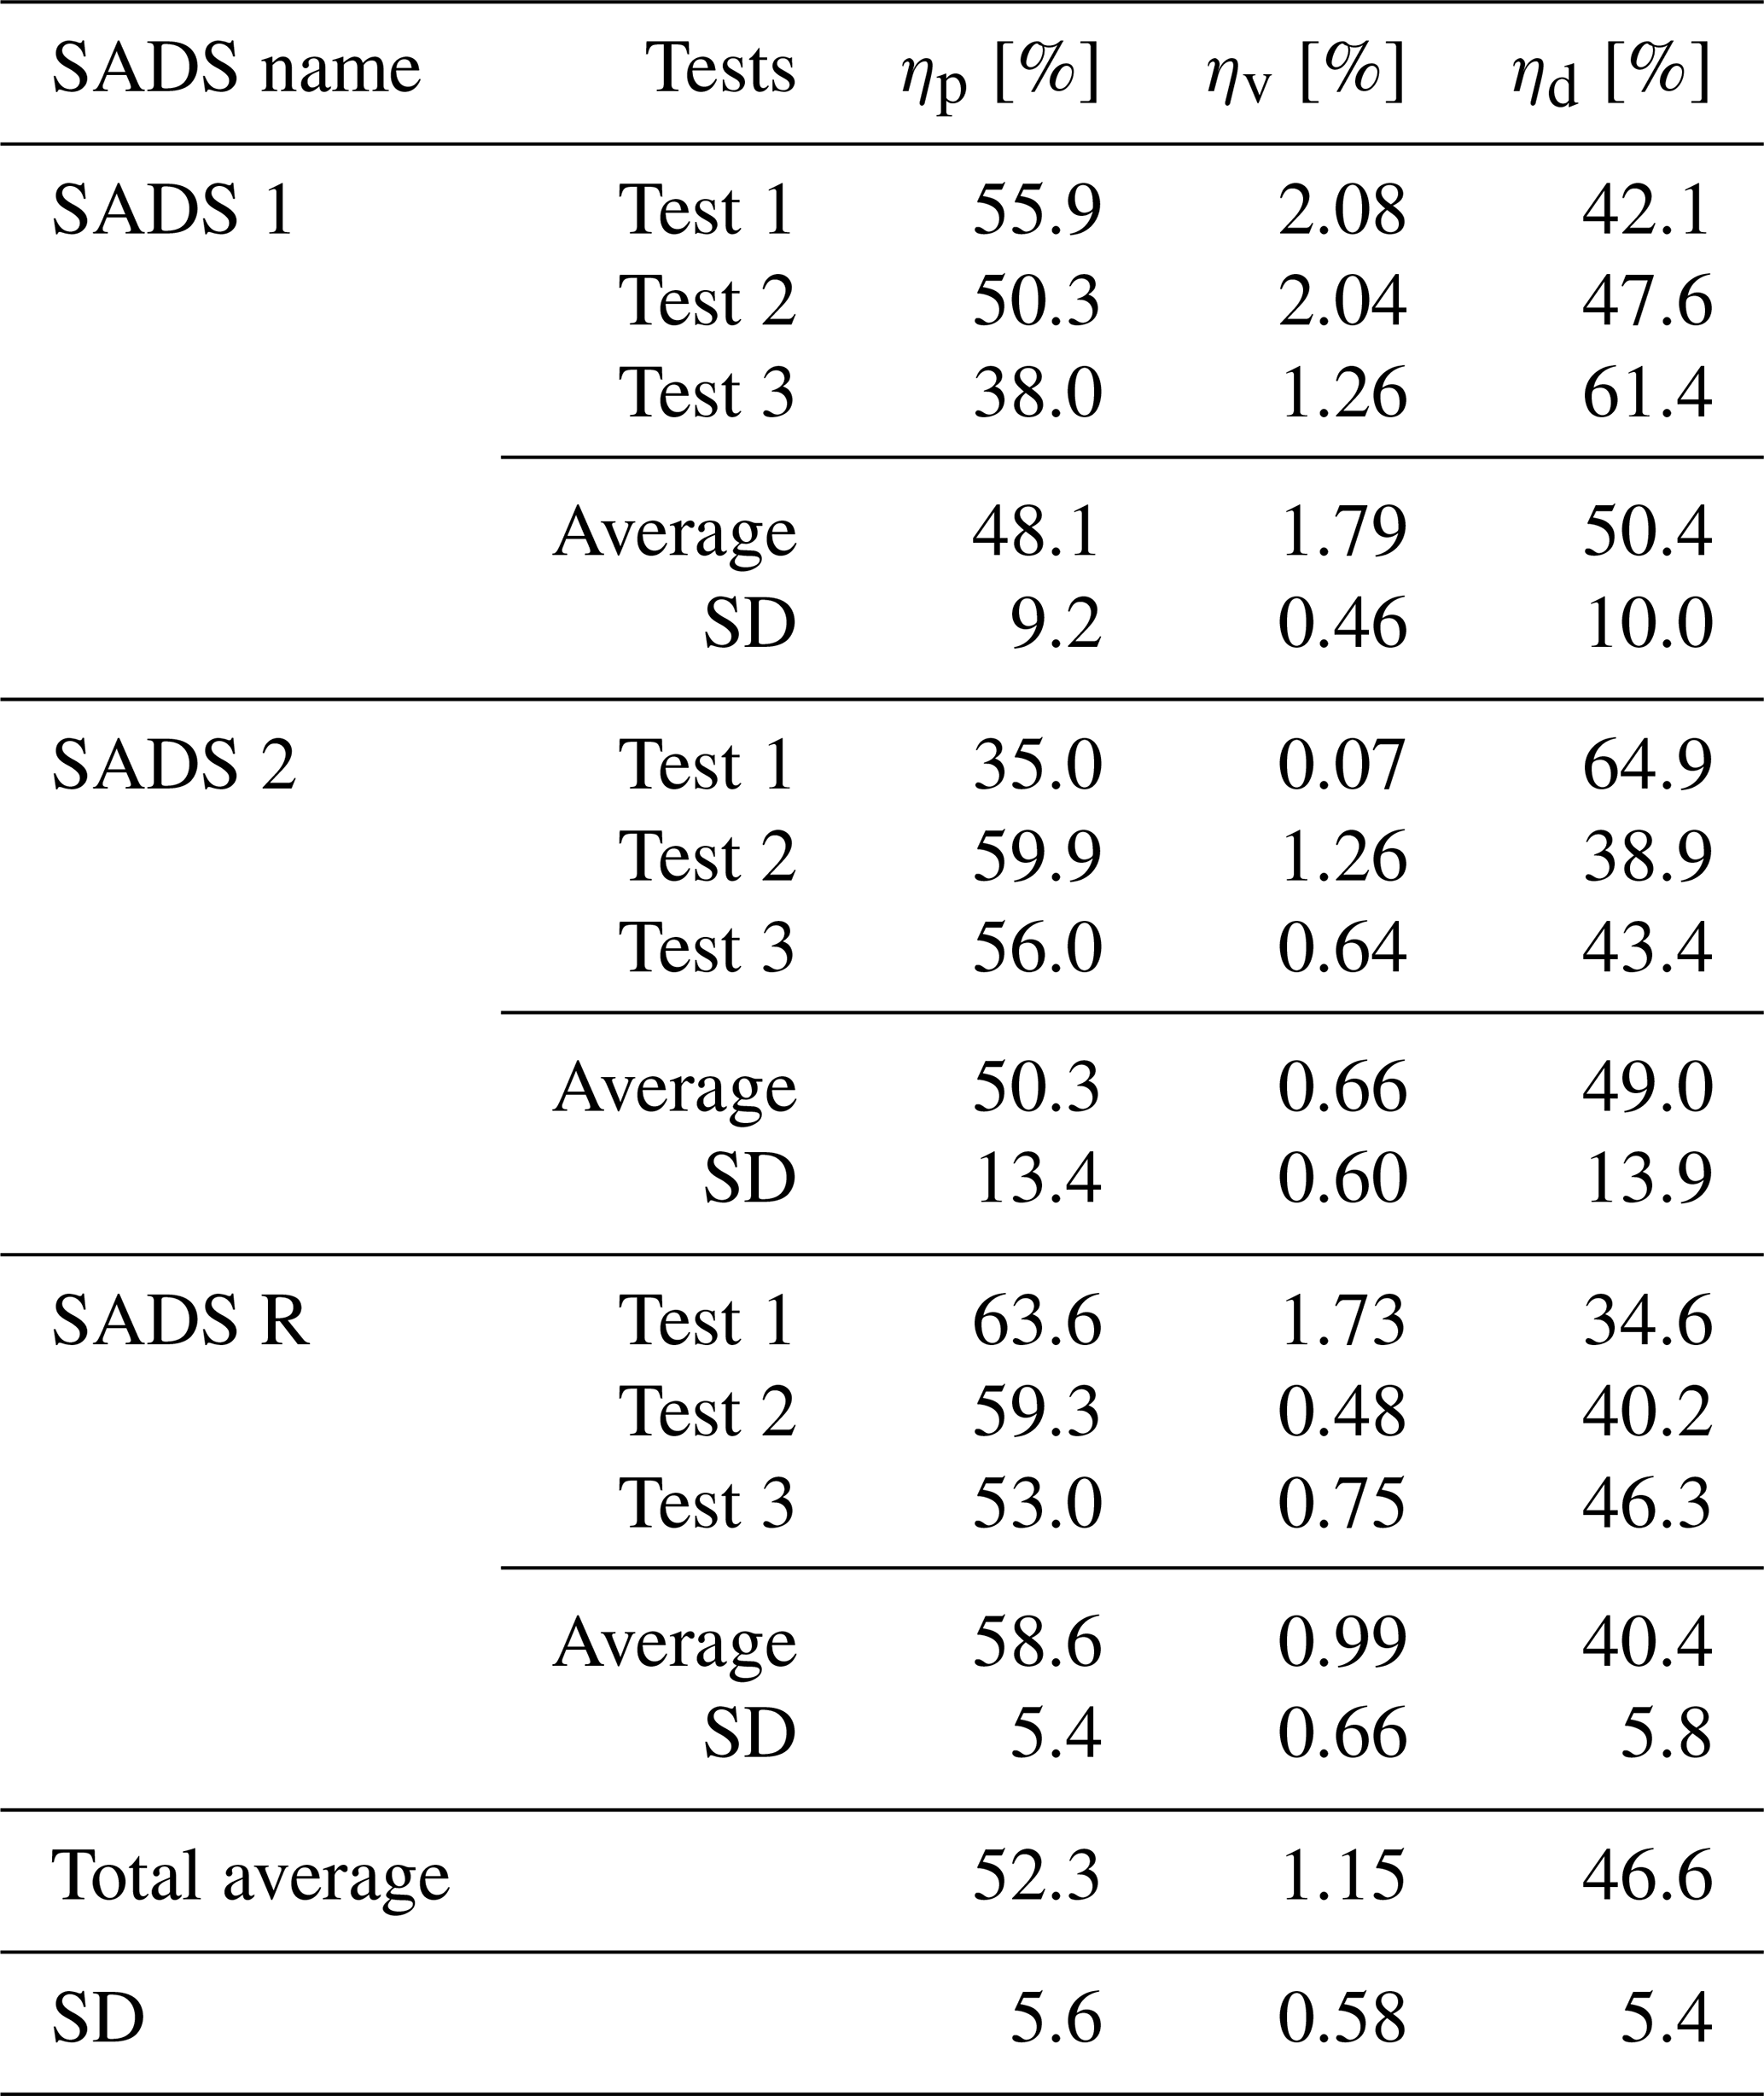
To illustrate the origin of the unexpectedly low transmission efficiency of inertial particles in the device, the distribution of all measured ηp, ηv, and ηd for three repetitions of the experiment and for the three airtight prototypes is shown in Fig. 9 and Table 3. Only results for the 4.5 µm particles are shown here for brevity. For these particles, we observe that the low transmission efficiency ηp is attributable to large (46.6 ± 5.4 %) wall losses (ηd), not to the misdirection of particles to the minor outlet. These deposits are not theoretically explained, even if we take into account the lack of precision of machined nozzle diameters (Fig. 8), and we can note that they apparently vary randomly across repetitions with a large coefficient of variation for ηd (22.1 %). These variations are then likely to be attributable to the assembly process of the SADS, since other influencing parameters were monitored and controlled (flow rates, aerosol particle sizes, homogeneity of concentrations in the BOA, SADS leakage rate, similarity of sampled masses).
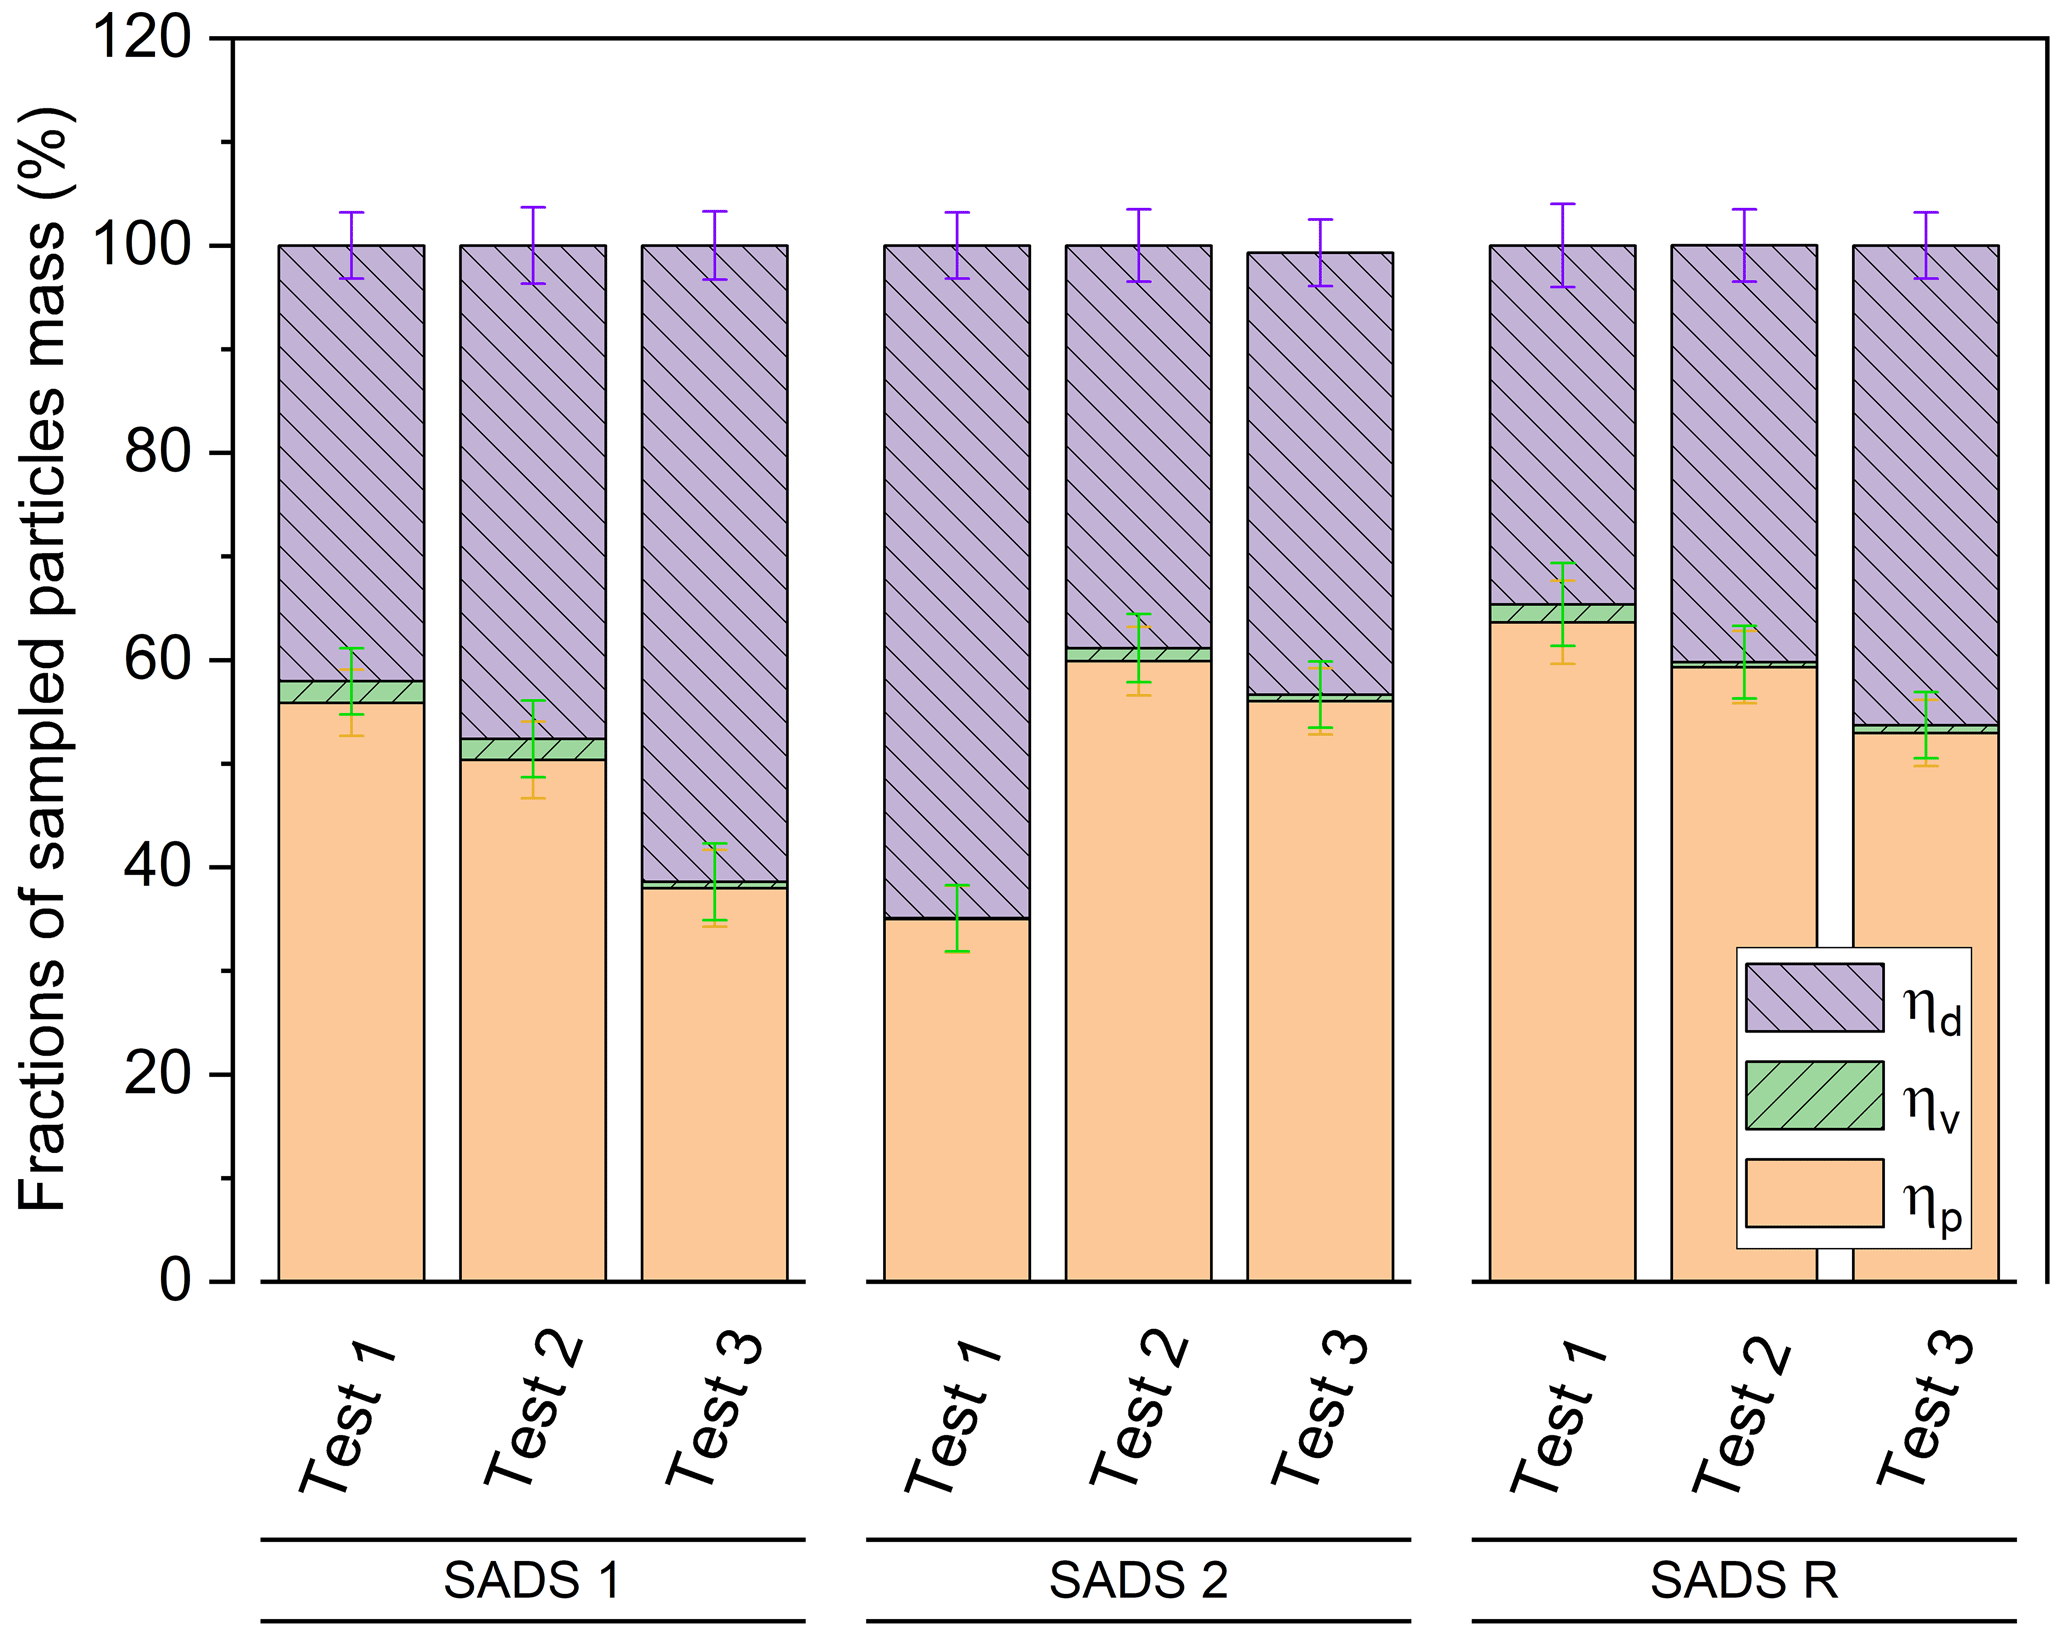
Figure 9Distribution of the fate of inertial particles with a reference diameter of 4.5 µm in multiple repetitions, for SADS 1, SADS 2, and SADS R at high airtightness level. Error bars represent the measuring uncertainty associated with the data points.
Table 3Transmission ratio to the major and minor outlets and deposition ratio for SADS 1, 2, and R.
4.5 Detailed particle fate measured for SADS-R
Figure 10a and b present images depicting a typical deposition that occurs inside the SADS after the sampling process. Notably, a significant amount of liquid particles can be seen on the external walls of the nozzles. Deposits can also be found on the internal walls of the nozzles, but they are difficult to capture in photographs. Additionally, in certain tests, projections of macroscopic droplets from the nozzles to the walls of the plenum were also observed.
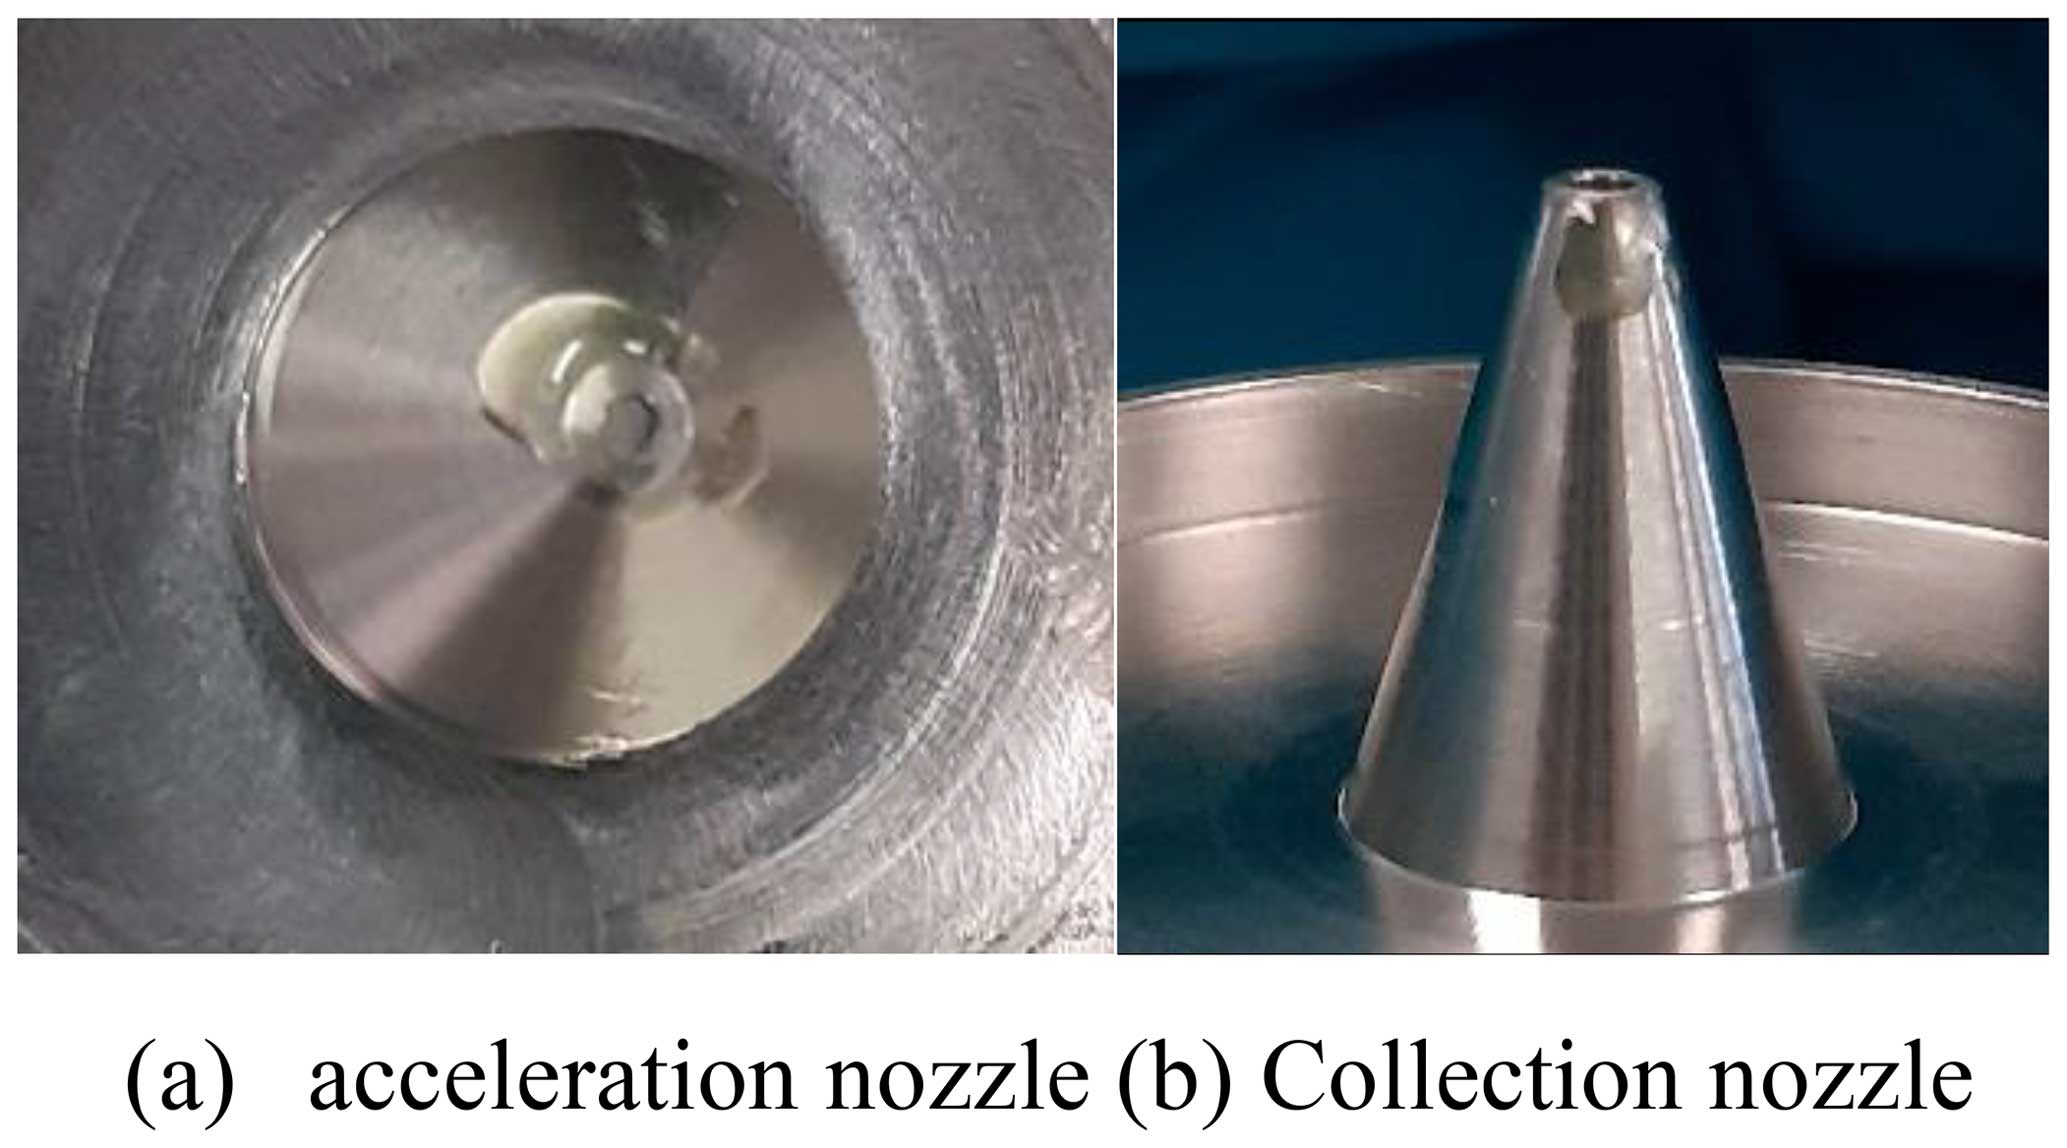
Figure 10Pictures of particle deposition outside the nozzle: (a) acceleration nozzle and (b) collection nozzle.
To better understand the localization and underlying reasons for particle deposition in the SADS, independently of variations between prototypes, the detailed transmission ratios and position-resolved deposition ratios for the reference SADS-R are given in Fig. 11, for all tested particle sizes. Values are averaged over three repetitions.
For particles with reference diameter 0.15 µm, wall deposition is primarily located on the collection nozzle, with 6 ± 5.8 % of sampled mass, though it should be almost zero theoretically (0.44 ± 0.58 %).
For particles with reference diameters 2, 3, and 4.5 µm, the experimental results show substantial particle depositions (43 % of sampled mass in average), unpredicted by theory either (0.2 ± 0.1 %). These experimental wall deposits seem almost independent of particle diameter for these inertial particles. The distribution of deposits across zones reveals that the majority of particles deposit on the collection nozzle (34.5 ± 3.4 %), followed by the acceleration nozzle (7.6 ± 3.4 %), with minimal deposition in the plenum (0.6 ± 3.4 %).
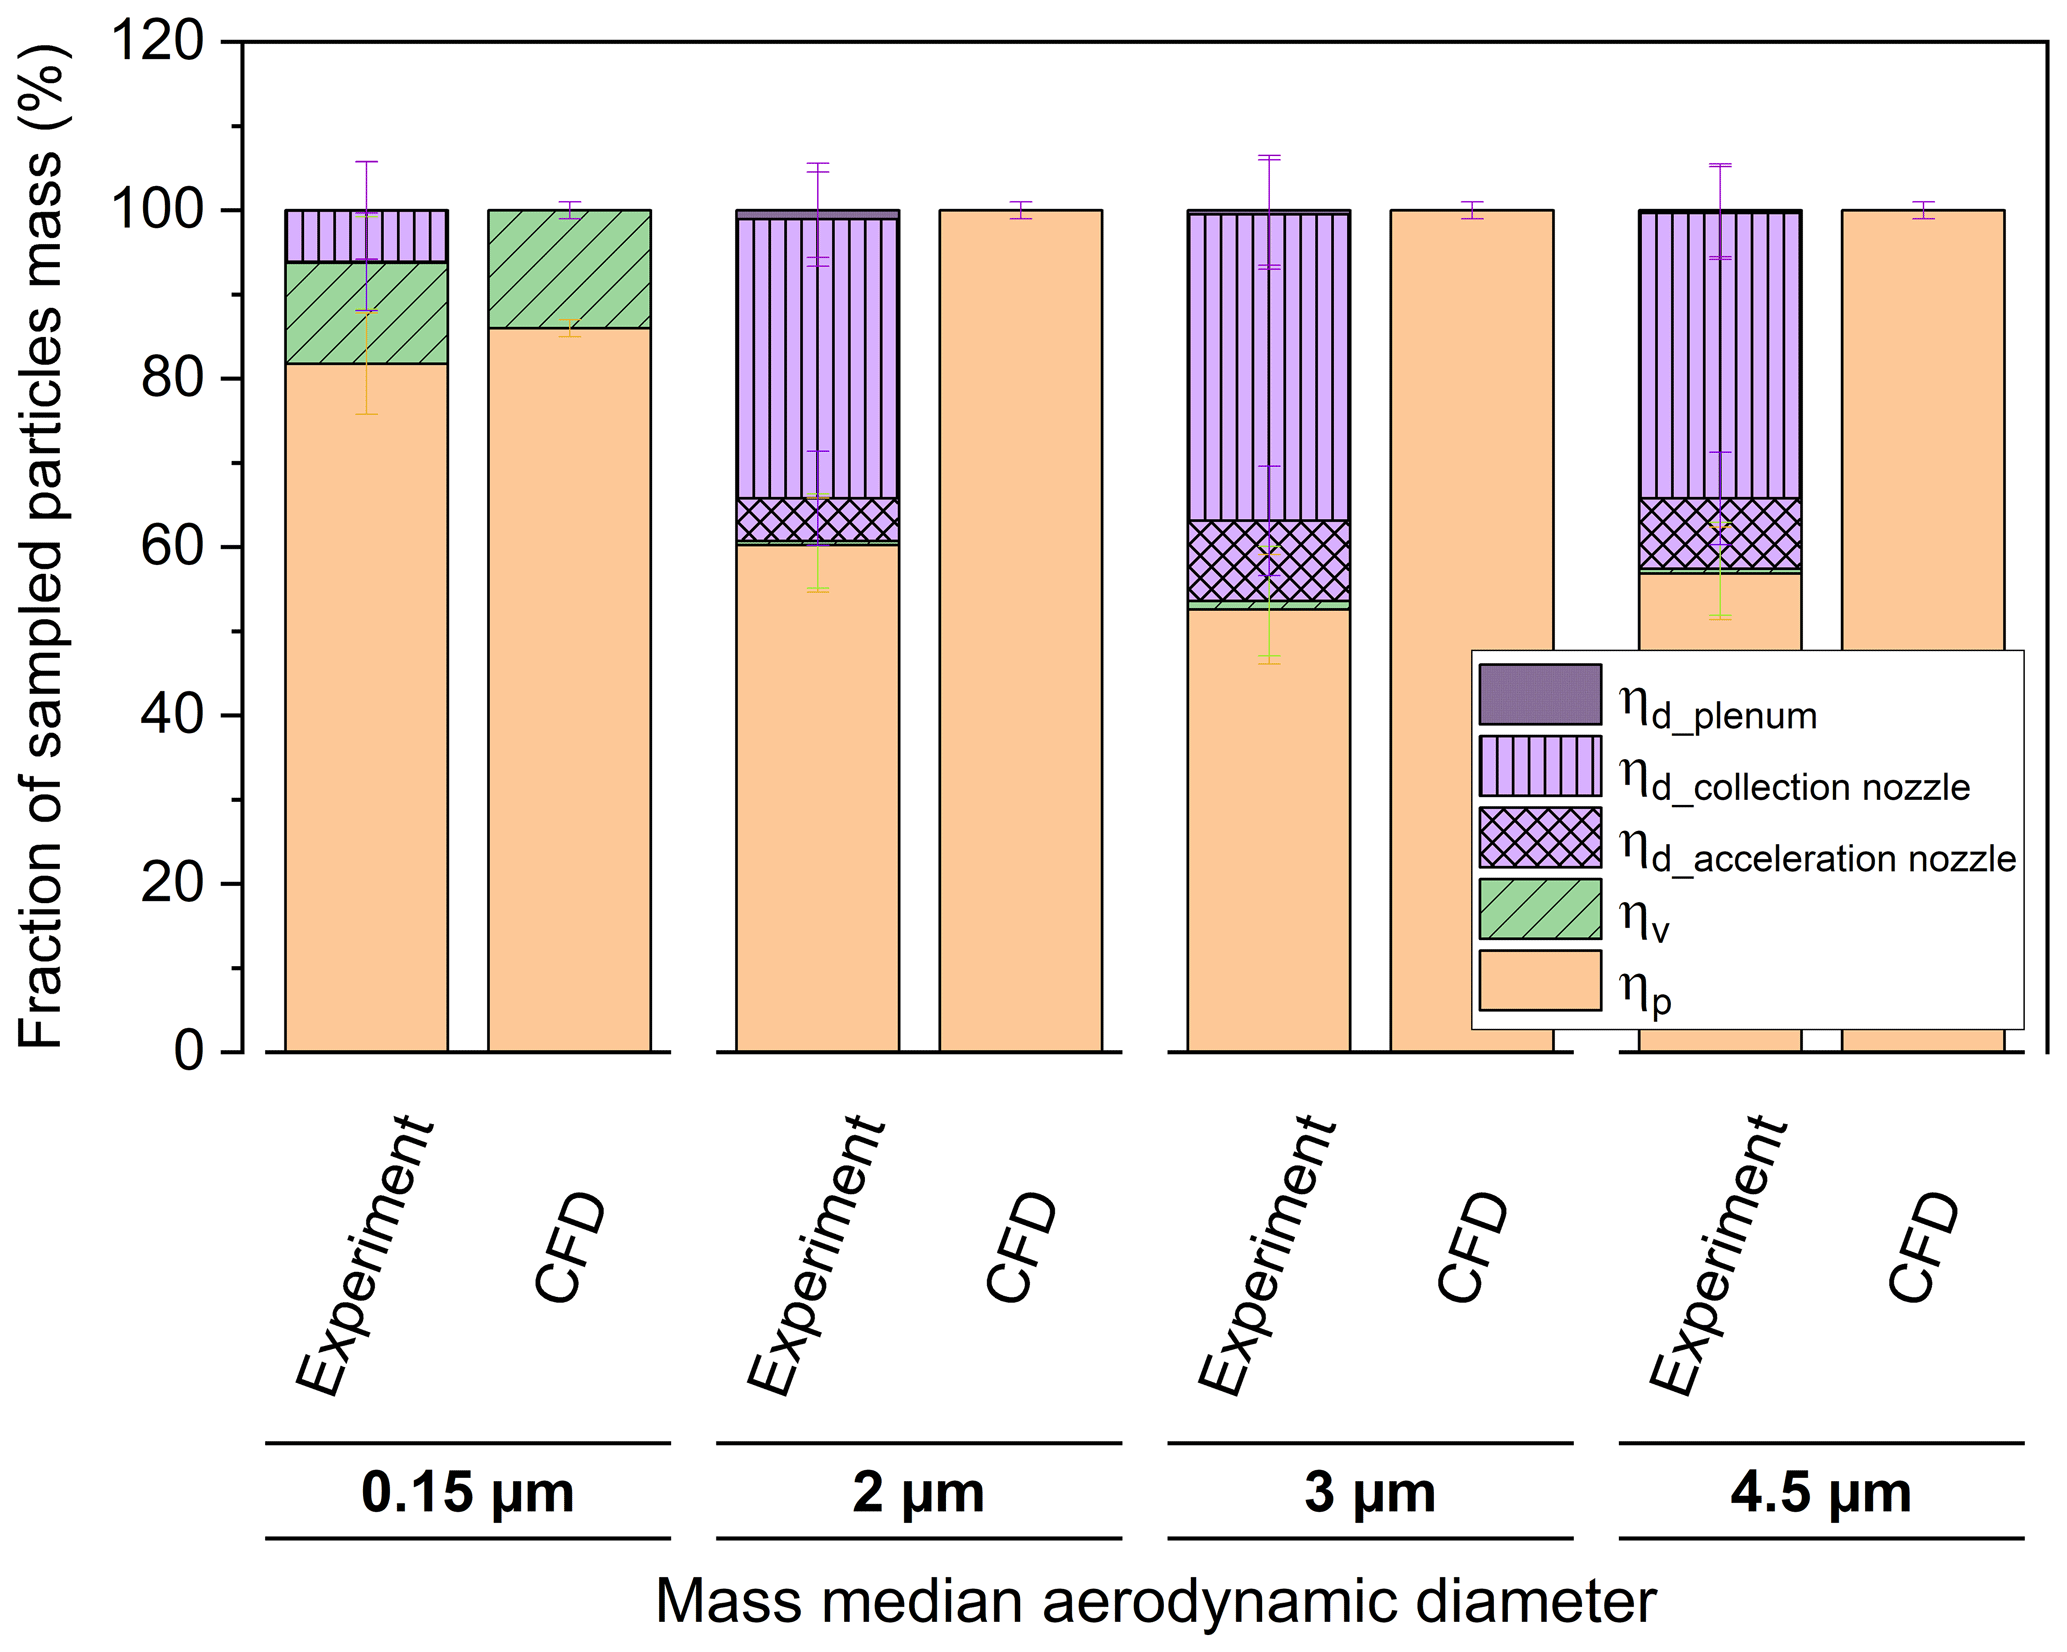
Figure 11Mass distribution in SADS R exposed to four different particle size distributions: experimental and numerical study for precise wall deposition localization and transmission efficiency analysis (three repetitions; error bars represent measuring uncertainty). It is essential to note that most of the deposits observed can contaminate the vapour phase measurements at the minor outlet if particles evaporate after deposition. Indeed, wall deposition on the acceleration nozzle is located before separation, and most of the deposit of the collection nozzle is actually located on its outside walls (fraction of the deposit which is visible to the unaided eye).
Having ruled out the effects of leakage and machining inaccuracies in nozzle diameter, we can envisage several reasons for these deposits, which are not predicted by the numerical model. Firstly, the simulated geometry may not correspond to the real geometry for aspects other than nozzle diameter. In particular, the variations in deposits between the tests (Figs. 9 and 11) suggest variability in the assembly of the two parts of the SADS in relation to each other, and therefore a geometry of the interior domain of the SADS that is not only variable but also different from what is simulated. These variations may correspond in particular to a misalignment of the nozzles with respect to each other, which can easily explain the impaction of inertial particles outside the collection nozzle (Loo and Cork, 1988). In the following section, the sensitivity of SADS performances with respect to nozzle misalignment is thus illustrated theoretically.
4.6 Theoretical effect of nozzle misalignment
A study by Loo and Cork (1988) emphasized the importance of maintaining axial alignment between the acceleration and collection nozzle of a VI. In their case, which is very different from the SADS in terms of dimensions and air flow rates, they recommend avoiding an offset of more than 1.6 % of nozzle diameter and observe that each 1.6 % increase in misalignment leads to a 1 % increase in nozzle wall loss. Meeting this criterion in the case of the SADS would mean avoiding a misalignment of more than 0.013 mm, which is challenging from a mechanical design point of view. Experimentally, measuring the misalignment offset of the mounted SADS was not feasible. However, a sensitivity analysis can be performed by means of parametric CFD computations to explore the impact of this parameter.
Simulations were hence carried out with relative displacements of the collection nozzle with respect to the acceleration nozzle (Fig. 2) in the Z-axis direction, with likely values of the axial backlash between the two parts of the SADS. These parts are assembled by manually fitting together a shaft and a 37 mm diameter hole. Following the ISO system of limits and fits, this corresponds to a H7/h6 clearance fit (location fit); hence a possible axial backlash in the range 0 to 0.041 mm is deduced. Parametric computations were then performed for axial backlashes of 0, 0.025, and 0.041 mm respectively (corresponding to 0, 3.1 %, and 5.1 % of the nozzle diameter respectively). A simulation with an extreme backlash of 0.075 mm (9.4 % of nozzle diameter) was also performed for information, which could correspond to a more tolerant H8/f7 ISO clearance fit (close-running fit).
Figure 12 displays the corresponding numerical simulation results for the transmission efficiency and wall deposition, compared with experimental measurements of SADS 1, 2, and R, illustrating the possible effect of axial misalignment on ηp.
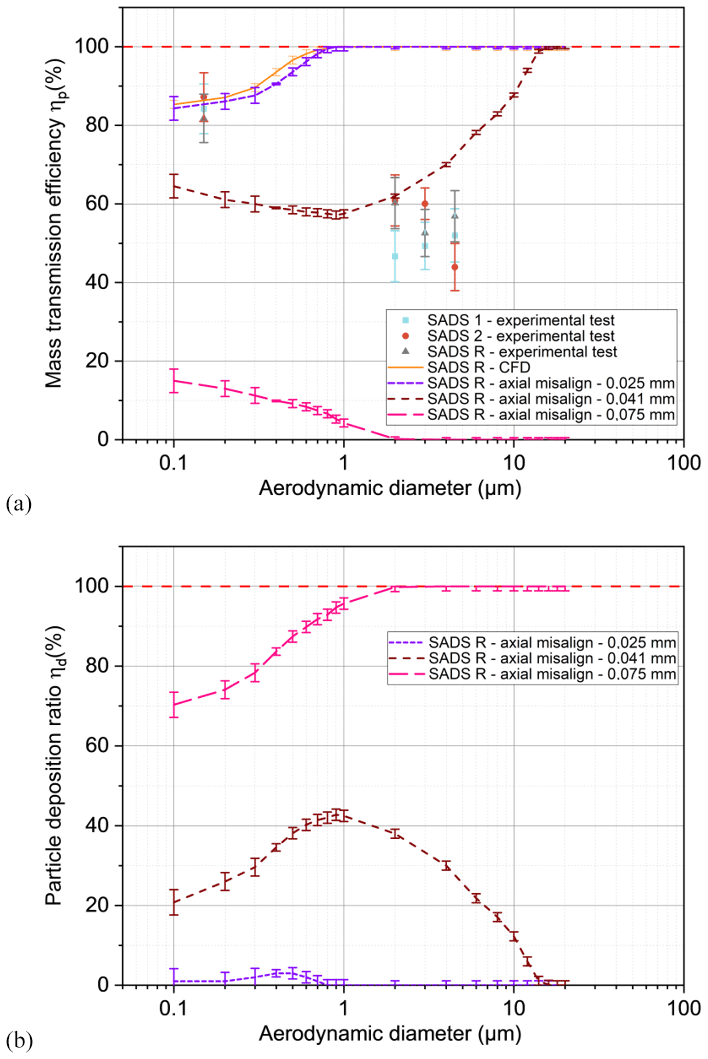
Figure 12Misalignment effect on mass transmission efficiency (a) and particle deposition ratio (b), evaluated by numerical simulations and experimental tests.
Results show that likely values of the axial mechanical backlash between the two parts lead to a severe decrease of ηp due to dramatically increasing wall losses ηd on the collection nozzle external walls, especially for the most inertial particles. This finding is compatible with experimental measurements. Axial misalignment of the device is therefore a possible cause of the differences in performance between the ideal version and the mechanical realization of the SADS, for the most inertial particles tested. Of course, present simulations can only qualitatively reproduce the tendency of the experiment, since they were not performed with the actual axial backlash, which is unknown and varies between each SADS assembly. Also, the effects of other existing mechanical backlashes were not numerically tested and necessarily contribute to sampling performances (tolerance on the separation length between nozzles, existing angle between the axes of the two parts of the SADS, etc.).
Based on the analysis of the results, we can conclude that the maximum allowable misalignment during the assembly of the SADS, between the collection nozzle and the acceleration nozzle, is established at 0.025 mm, as evidenced by the violet curve. Notably, this curve consistently aligns with that of the SADS R-CFD, representing a curve with perfect alignment.
This study experimentally evaluated the dichotomous sampling performance (gas and particles) of five SADS prototypes (2009 version) of identical design and for an aerosol of liquid particles with aerodynamic diameters of 0.15, 2, 3, and 4.5 µm. The study was carried out for constant air flows set in accordance with SADS specifications.
Lab tests were carried out in a dedicated controlled generation environment, the BOA, in which monodisperse aerosols marked with a fluorescent dye were emitted, thanks to the modification of the CMAG generator to accommodate the use of glycerol and fluorescein as condensing vapour and nuclei respectively.
SADS sampling performance in terms of total mass sampled, particle fraction transmitted to the major outlet, and particle losses at the walls were put into perspective with the details of mechanical construction and with the operating conditions of the prototypes: leak rate, repeatability between successive assemblies, imprecision of machined nozzle diameters, and axial misalignment of the assembly.
The measured sampling performances were compared to their theoretical counterparts computed by CFD in Belut et al. (2022), and CFD was also used to study the theoretical effect of variations in the geometry of machined SADS relative to the plans, regarding the nozzle diameters and nozzle misalignments.
With the originally proposed design, the SADS assembly was found easily leaky, but consequences on sampling could be overcome when a prior leak test with leakage rate LR below 4 Pa s−1 was passed.
Sampling performances were found to be little reproducible during successive SADS assemblies (between tests, CV = 22.1 % for wall losses). Theoretically unpredicted large (40 %–46 % of sampled mass) wall losses were measured for particles larger than 2 µm, located mostly (80 %) on the external walls of the collection nozzle. Assembly repeatability issues and simulations of SADS parts misalignment effect by CFD suggest that these undesirable particle deposits are due to the mechanical backlashes of the assembly, not to the imprecision of actually machined nozzle diameters. Indeed, the measured variation of nozzle diameters in the range (−4.5 %, +3.7 %) with respect to nominal values was found to theoretically marginally affect (< 3 %) aerosol transmission efficiencies.
Present results suggest that although the dichotomous sampling performances of the SADS are theoretically interesting for workplace exposure assessment to SVOC aerosols, its actual realization fails in reaching theoretical performances for micron-sized particles, due to mechanical design issues. Airtightness, nozzle alignment, and repeatability of assembly are not sufficiently guaranteed by its initial design, and future development should focus on improving these aspects to obtain a sampler suitable for field studies.
However, several biases may have affected the findings of the study. For example, rare macroscopic particles are sometimes emitted by the CMAG and may have been sampled by the SADS, biasing the separation performance measurements and especially the deposition measurements. However, we believe that this possibility is largely controlled by the real-time monitoring of particle sizes in the test rig and by the simultaneous use of several SADS in the test rig. Regarding the plausibility of the simulation results, it is, of course, limited by the physical phenomena actually taken into account. Calculation errors are limited by the verification procedure used (Belut et al., 2022), which guarantees a numerical error of less than 0.5 % on the particulate fractions deposited and transmitted. However, actual variations in the geometry of assembled SADS compared with the drawings (due to machining inaccuracies other than nozzle diameters) are not taken into account, nor is wall roughness, despite its acknowledged effect on deposits. The roughness of the machined acceleration nozzles could therefore help to explain the deposition of particles in this nozzle, which are not predicted by calculations that assume a perfectly smooth nozzle. Similarly, the more or less pronounced sharpness of the sampling orifice actually machined can have a significant influence on the inlet particle velocity and concentration profile and therefore on the actual performance of the SADS (Belut et al., 2022).
Nevertheless, the lack of repeatability of SADS performance between successive assemblies, its low and variable airtightness level, and its radial clearance large enough to cause a significant misalignment of the nozzles (typically 5 %) have sufficiently important effects for these possible limitations of the study not to call into question its conclusions.
Overall, these results clearly show that it is mechanically difficult to design a SADS that meets the theoretical specifications. In fact, the alignment tolerances require precise machining, which may be an obstacle to the development of this device. It should be added that the head losses of the device at its nominal flow rate are 1400 Pa on the major flow side and 3700 Pa on the minor flow side (Belut et al., 2022). These head losses are at the limit of the performance of individual sampling pumps, especially when considering the additional head losses caused by the collection media downstream of the SADS outlets. This raises the question of whether the device should be completely redesigned, with larger nozzle diameters that are easier to align mechanically and generate less pressure drop.
By addressing the identified challenges and incorporating further refinements in the SADS design and operation, researchers can enhance its reliability, accuracy, and applicability in various aerosol sampling applications, contributing to advancements in aerosol science and related fields.
The computations were performed on proprietary software (ANSYS FLUENT 19.3.0 2019 R1 Build10141, running on SUSE Linux Enterprise 64-bit platform release 12.0.20141010), whose code cannot be made freely available, but whose versions are fully traceable. The details of the models and options used are very extensively described in the supplementary material of Belut et al. (2022) so that the results can be easily reproduced. CAD models and meshes can be made available in a non-proprietary format upon reasonable request directly to the authors.
No data sets were used in this article.
BS, EB, EG, and RO conceptualized the research project. NR, BS, and EB developed the methodology, and NR was responsible of the investigation. BS and EB validated the results. EG was responsible for the supervision of the project. NR wrote the original draft preparation, and BS, EB, and EG reviewed and edited the manuscript.
The contact author has declared that none of the authors has any competing interests.
Publisher’s note: Copernicus Publications remains neutral with regard to jurisdictional claims made in the text, published maps, institutional affiliations, or any other geographical representation in this paper. While Copernicus Publications makes every effort to include appropriate place names, the final responsibility lies with the authors.
This paper was edited by Evangelia Diapouli and reviewed by two anonymous referees.
Belut, E., Rekeb, N., Sutter, B., and Géhin, E.: Revisiting the CFD modeling of a virtual impactor with inverted split ratio: Highlighting some determinants of representativeness, J. Aerosol Sci., 166, 106068, https://doi.org/10.1016/j.jaerosci.2022.106068, 2022.
Cooper, S. J., Raynor, P. C., and Leith, D.: Evaporation of Mineral Oil in a Mist Collector, Appl. Occup. Environ. Hyg., 11, 1204–1211, https://doi.org/10.1080/1047322X.1996.10389398, 1996.
Kim, S. W. and Raynor, P. C.: A New Semivolatile Aerosol Dichotomous Sampler, Ann. Occup. Hyg., 53, 239–248, https://doi.org/10.1093/annhyg/mep008, 2009.
Kim, S. W. and Raynor, P. C.: Experimental Evaluation of Oil Mists Using a Semivolatile Aerosol Dichotomous Sampler, J. Occup. Environ. Hyg., 7, 203–215, https://doi.org/10.1080/15459620903582244, 2010a.
Kim, S. W. and Raynor, P. C.: Optimization of the Design of a Semivolatile Aerosol Dichotomous Sampler, Aerosol Sci. Technol., 44, 129–140, https://doi.org/10.1080/02786820903426739, 2010b.
Kim, S. W., Lee, E. G., Lee, T., Lee, L. A., and Harper, M.: Exposure to chlorpyrifos in gaseous and particulate form in greenhouses: a pilot study, J. Occup. Environ. Hyg., 11, 547–555, 2014.
Leith, D., Leith, F. A., and Boundy, M. G. Laboratory Measurements of Oil Mist Concentrations Using Filters and an Electrostatic Precipitator, Am. Ind. Hyg. Assoc. J., 57, 1137–1141, https://doi.org/10.1080/15428119691014242, 1996.
Lillienberg, L., Burdorf, A., Mathiasson, L., and Thörneby, L.: Exposure to Metalworking Fluid Aerosols and Determinants of Exposure, Ann. Occup. Hyg., 52, 597–605, https://doi.org/10.1093/annhyg/men043, 2008.
Loo, B. W. and Cork, C. P.: Development of High Efficiency Virtual Impactors, Aerosol Sci. Technol., 9, 167–176, https://doi.org/10.1080/02786828808959205, 1988.
Marple, V. A. and Chien, C. M.: Virtual Impactors: A Theoretical Study, Environ. Sci. Technol., 14, 976–985, https://doi.org/10.1021/es60168a019, 1980.
Olsen, R., Thomassen, Y., Koch, W., Halgard, K., Bakke, B., and Ellingsen, D. G.: Performance testing of a personal sampler for full-shift sampling of oil mist and oil vapour, STAMI National Institute of Occupational Health, 27 pp., https://hdl.handle.net/11250/3133119 (last access: 10 June 2024), 2013.
Park, D., Stewart, P. A., and Coble, J. B.: Determinants of Exposure to Metalworking Fluid Aerosols: A Literature Review and Analysis of Reported Measurements, Ann. Occup. Hyg., 53, 271–288, https://doi.org/10.1093/annhyg/mep005, 2009.
Park, S. S., Kang, M. S., and Hwang, J.: Oil mist collection and oil mist-to-gas conversion via dielectric barrier discharge at atmospheric pressure, Sep. Purif. Technol., 151, 324–331, https://doi.org/10.1016/j.seppur.2015.07.059, 2015.
Raffy, G., Mercier, F., Glorennec, P., Mandin, C., and Le Bot, B.: Oral bioaccessibility of semi-volatile organic compounds (SVOCs) in settled dust: A review of measurement methods, data and influencing factors, J. Hazard. Mater., 352, 215–227, https://doi.org/10.1016/j.jhazmat.2018.03.035, 2018.
Raynor, P. C. and Leith, D.: Evaporation of accumulated multicomponent liquids from fibrous filters, Ann. Occup. Hyg., 43, 181–192, https://doi.org/10.1093/annhyg/43.3.181, 1999.
Raynor, P. C., Volckens, J., and Leith, D.: Modeling Evaporative Loss of Oil Mist Collected by Sampling Filters, Appl. Occup. Environ. Hyg., 15, 90–96, https://doi.org/10.1080/104732200301890, 2000.
Roberts, J. W., Wallace, L. A., Camann, D. E., Dickey, P., Gilbert, S. G., Lewis, R. G., and Takaro, T. K.: Monitoring and Reducing Exposure of Infants to Pollutants in House Dust, edited by: Whitacre, D., Reviews of Environmental Contamination and Toxicology, Vol. 201, Springer, Boston, MA. https://doi.org/10.1007/978-1-4419-0032-6_1, 2009
Simpson, A. T.: Comparison of Methods for the Measurement of Mist and Vapor from Light Mineral Oil–Based Metalworking Fluids, Appl. Occup. Environ. Hyg., 18, 865–876, https://doi.org/10.1080/10473220390237386, 2003.
Simpson, A. T., Groves, J. A., Unwin, J., and Piney, M.: Mineral oil metal working fluids (MWFs) – development of practical criteria for mist sampling, Ann. Occup. Hyg., 44, 165–172, https://doi.org/10.1093/annhyg/44.3.165, 2000.
Sinclair, D. and La Mer, V. K.: Light Scattering as a Measure of Particle Size in Aerosols. The Production of Monodisperse Aerosols, Chem. Rev., 44, 245–267, https://doi.org/10.1021/cr60138a001, 1949.
Steiner, S., Majeed, S., Kratzer, G., Hoeng, J., and Frentzel, S.: A new fluorescence-based method for characterizing in vitro aerosol exposure systems, Toxicol. In Vitro, 38, 150–158, https://doi.org/10.1016/j.tiv.2016.09.018, 2017.
Sutter, B., Bémer, D., Appert-Collin, J.-C., Thomas, D., and Midoux, N.: Evaporation of Liquid Semi-Volatile Aerosols Collected on Fibrous Filters, Aerosol Sci. Technol., 44, 395–404, https://doi.org/10.1080/02786821003674244, 2010.
Technical Overview of Volatile Organic Compounds: Technical Overview of Volatile Organic Compounds, https://www.epa.gov/indoor-air-quality-iaq/technical-overview-volatile-organic-compounds (last access: 7 June 2024), 2020.
Volckens, J.: Partitioning Theory for Respiratory Deposition of Semivolatile Aerosols, Ann. Occup. Hyg., 47, 157–164, https://doi.org/10.1093/annhyg/meg015, 2003.
Volckens, J., Boundy, M., Leith, D., and Hands, D.: Oil Mist Concentration: A Comparison of Sampling Methods, Am. Ind. Hyg. Assoc. J., 60, 684–689, https://doi.org/10.1080/00028899908984492, 2010.
Wlaschitz, P. and Höflinger, W.: A new measuring method to detect the emissions of metal working fluid mist, J. Hazard. Mater., 144, 736–741, https://doi.org/10.1016/j.jhazmat.2007.01.104, 2007.
- Abstract
- Introduction
- Principle of the particle–vapour dichotomous sampling in the SADS and definitions
- Material and methods
- Results and discussion
- Conclusion and discussion
- Appendix A
- Code availability
- Data availability
- Author contributions
- Competing interests
- Disclaimer
- Review statement
- References