the Creative Commons Attribution 4.0 License.
the Creative Commons Attribution 4.0 License.
 | 22 May 2024
Intermediate ions as indicator for local new particle formation
Santeri Tuovinen
Janne Lampilahti
Veli-Matti Kerminen
Markku Kulmala
Atmospheric aerosol particles have a considerable influence on climate via both aerosol–radiation and aerosol–cloud interactions. A major fraction of global aerosol particles, in terms of their number concentration, is due to atmospheric new particle formation (NPF) that involves both neutral and charged clusters and particles. NPF is the major source of atmospheric intermediate ions, i.e., charged particles with mobility diameters between approx. 2 and 7 nm. We investigate ion concentrations between 1.7 and 3.1 nm at the SMEAR II (Station for Measuring Forest Ecosystem–Atmosphere Relations II) measurement station in Hyytiälä, Finland. Both negative and positive ion number size distributions measured by a Neutral cluster and Air Ion Spectrometer (NAIS) are used. Our aim is to find the best diameter size range of ions for identifying and evaluating the intensity of local intermediate ion formation (LIIF). Intermediate ion formation (IIF) refers to the formation of intermediate ions through NPF, while local means that the growth of such ions from smaller clusters has occurred in close proximity (e.g., within 500 m to 1 km) to the measurement site, i.e., locally. We find that the ions in the mobility diameter size range of 2.0–2.3 nm are the best suited for detection of LIIF. The ion concentrations in this size range indicate the elevated rates of IIF, and the potential distances the growing ions have traveled are smaller than those for larger ions. In addition, in Hyytiälä, the negative ion concentrations are more sensitive to IIF than the positive ion concentrations due to the higher difference in concentrations between periods of IIF and the background. Therefore, we recommend the concentrations of ions with diameters 2.0–2.3 nm as the best choice for identifying and evaluating the intensity of LIIF.
- Article
(2351 KB) - Full-text XML
-
Supplement
(652 KB) - BibTeX
- EndNote


Atmospheric aerosol particles affect climate on local, regional, and global scales (Boucher et al., 2013; Rosenfeld et al., 2014; Quaas et al., 2022; Pörtner et al., 2022). These particles scatter radiation, impacting Earth's radiative balance (Bellouin et al., 2005; Yu et al., 2006). In addition, particles with diameters larger than about 50–100 nm are able to act as cloud condensation nuclei (CCN) (Komppula et al., 2005; Anttila et al., 2010; Bougiatioti et al., 2020). CCN are a necessity for cloud droplet formation, and CCN number and properties influence cloud properties such as cloud irradiance (Rosenfeld et al., 2014; Fan et al., 2016). A large fraction, estimated to be over half, of the global aerosol number concentration is due to atmospheric new particle formation (NPF) (Merikanto et al., 2009; Spracklen et al., 2010; Gordon et al., 2017).
During NPF, sub-2 nm atmospheric aerosol particles are formed by gas-to-particle conversion, after which they start growing to larger sizes (Kulmala et al., 2001; Kerminen et al., 2018). Eventually, the particles created due to NPF might reach sizes where they can have impacts on, e.g., climate or air quality. We consider the growth of the particles to above roughly 2–3 nm to be a necessary prerequisite for NPF. Therefore, even if small molecular clusters form, if there is no growth, or the growth is negligible, we do not consider NPF to have taken place.
So-called NPF events, during which the formation and growth of particles are seen based on increased particle number concentrations, are regularly observed all over the globe, from boreal forests to urban megacities (Dal Maso et al., 2007; Dada et al., 2017; Kerminen et al., 2018; Chu et al., 2019; Bousiotis et al., 2021; Brean et al., 2023). In addition, there is so-called quiet NPF, which takes place on days typically classified as NPF non-event days (Kulmala et al., 2022). NPF has been observed to occur regularly at the SMEAR II (Station for Measuring Forest Ecosystem–Atmosphere Relations II) measurement station in Hyytiälä, southern Finland (Dal Maso et al., 2005; Nieminen et al., 2014; Dada et al., 2017). Over 20 % of the days in Hyytiälä are classified as NPF event days (Dada et al., 2018), during which NPF often occurs on a regional scale. In addition, local evening and nighttime clustering events have been observed (Mazon et al., 2016). The days classified as NPF event days in Hyytiälä have been estimated to contribute most to the particle production, while quiet NPF is responsible for around one-fifth of the total particle production (Kulmala et al., 2022). Furthermore, NPF contributes significantly to CCN production at this site (Sihto et al., 2011).
The extent of particle production due to NPF depends on environmental conditions. For example, low levels of particle pollution and sufficient abundance of potential precursor vapors, such as sulfuric acid, bases, and oxidized organic compounds, tend to favor NPF (Paasonen et al., 2010; Kulmala et al., 2013a; Schobesberger et al., 2013; Dada et al., 2017; Kerminen et al., 2018; Lehtipalo et al., 2018; Yan et al., 2021). Therefore, for example during any regional-scale NPF event, different local environments within the region of interest are expected to provide different contributions to the regional new particle production. To accurately evaluate the strength of the local particle production, the influence of particles originating from outside the area of interest should be minimized.
In previous studies (Hõrrak et al., 2000; Hirsikko et al., 2005; Kulmala et al., 2007; Virkkula et al., 2007; Hirsikko et al., 2011), atmospheric clusters, referring to particles with mobility diameters smaller than approximately 2 nm, have been observed to exist all the time, as predicted by Kulmala et al. (2000). The majority of these clusters are neutral; however a fraction of them are charged ions (Kulmala et al., 2007). Due to the large number of ever-present neutral clusters and ionization due to, e.g., cosmic and gamma radiation and radon decay, the concentrations of atmospheric ion clusters are relatively stable (Laakso et al., 2004; Tammet et al., 2006). Therefore, as we consider the growth of particles a prerequisite for NPF, we cannot detect NPF reliably from the concentrations of neutral or charged clusters because such concentrations do not tell us whether the clusters are growing or not. We note that based on the measured number concentrations of sub-2 nm ions, it is not possible to separate large charged molecules from charged molecular clusters. Therefore, cluster ions and charged molecules are hereafter referred to together as small ions.
In contrast to small ions, concentrations of intermediate ion (ions with mobility diameters approximately between 2 and 7 nm) have been observed to be very low except during periods of atmospheric new particle formation, rain, snowfall, or snowstorms (Hõrrak et al., 1998; Hirsikko et al., 2007, 2011; Tammet et al., 2014; Leino et al., 2016). During NPF, intermediate ions are formed through ion-mediated nucleation pathways or through the attachment of small ions with neutral particles formed through neutral nucleation pathways. Therefore, increased concentrations of intermediate ions can be considered indicative of the occurrence of NPF (Tammet et al., 2014; Leino et al., 2016).
In this work, we will investigate the use of atmospheric intermediate ion concentrations for studying local NPF. There are two important issues connected to this. First, we want to exclude primary ions as well as the ions that have not (yet) been activated for growth and might not contribute to the local particle production. Therefore, we want to observe only the ions attributable to NPF as per our definition. Second, the activation of clusters for growth should occur as locally as possible. In the context of our study, local means within close proximity (in practice, within 500 m to 1 km) as well as within the same environment. We will refer to the formation of intermediate ions as IIF (intermediate ion formation) and to the IIF which occurs locally as LIIF. The separate term for intermediate ion formation compared to NPF is used to make it clear that we are observing and studying the formation of charged particles. At which intensity the formation of neutral particles is taking place at the same time is not known for certain.
Usually atmospheric NPF is dominated by neutral pathways (Kulmala et al., 2013b), and as some of the neutral particles are charged, simultaneous IIF can be observed. However, even if the ion-induced pathways dominate, collisions between oppositely charged ions, neutralizing the ions, are bound to take place, and they result in the formation of neutral particles concurrently with IIF. Therefore, LIIF can be used to identify local NPF, regardless of the nucleation pathway. However, the total particle production rate cannot be directly derived from the observed intensity of LIIF, unless the particles are at the equilibrium charge fraction (Kerminen et al., 2007; Leppä et al., 2013), which is usually not the case (Leppä et al., 2013).
The intermediate ion concentrations are affected by transportation, which means that growing ions and neutral particles, which are ionized before detection, have been transported by moving air masses. Therefore, depending on the distance the ions have been transported, the factors which have led to the activation of the clusters for growth or impacted their growth rate might differ. Our aim is to use ion concentrations to identify LIIF. Thus, we want to minimize the impact of transportation on the observed intermediate ion concentrations. Ideally, the distance ions have been transported should be as small as possible; however as mentioned, requiring a smaller maximum distance than 500 to 1 km is not practical considering the timescales of particle growth and air mass transport. The wider the size range of ions is, the wider their potential source area will be. Therefore, narrow ion diameter ranges should have less variation in the potential source area compared to wider ranges. We note that while transport of ions can be both horizontal and vertical, in this study our focus is on the horizontal transport.
In this study, we will investigate intermediate ion concentrations measured in Hyytiälä, Finland, using a Neutral cluster and Air Ion Spectrometer (NAIS) (Mirme and Mirme, 2013; Manninen et al., 2016). Our aim is to find the optimal size range of intermediate ions to be used in identifying and evaluating the intensity of LIIF. In addition, both ion polarities will be compared, and the potential impact of polarity on intermediate ion concentrations, and therefore on the sensitivity to and the characteristics of LIIF, will be evaluated. The potential contribution of transport to the ion concentrations will be discussed. Finally, a recommendation for the best ion diameter to use in the identification and evaluation of the intensity of LIIF with minimal influence from transportation is given.
2.1 Ion number size distribution data
We used ion number size distribution data from the SMEAR II measurement station (Hari and Kulmala, 2005). The SMEAR II station is located in Hyytiälä, southern Finland (61°51′ N, 24°17′ E; 180 m above sea level). The site is surrounded by a relatively homogeneous Scots pine forest. For more details on the site and the measurements therein, see, e.g., Manninen et al. (2009b) and Nieminen et al. (2014).
The ion number size distribution data used were measured with a NAIS (Neutral cluster and Air Ion Spectrometer) (Mirme and Mirme, 2013; Manninen et al., 2016). The NAIS is able to measure both air ions (mobility diameters 0.8–42 nm) and total particles (mobility diameters 2.5–42 nm) by the use of a corona charger. Both polarities are simultaneously measured. The data were inverted using the v14-lrnd inverter (Wagner et al., 2016). The time resolution of the data was 2 min. The measurement height for the NAIS measurements was 2 m. Due to the presence of charger ions in diameters of up to 2.5 nm in the total particle size distributions measured by the instrument (Manninen et al., 2009b; Mirme and Mirme, 2013), we restricted our analysis to ions in this study.
The ion size number distribution data were used from between 4 January 2016 and 31 December 2020. The data coverage was good for the whole period, with few major gaps of more than 24 h in the data.
2.2 Ion number concentration analysis
Recent advances have shown that NPF does occur even during the days classified as non-event days (Kulmala et al., 2022). Therefore, the data were used from all the available days, and no distinction was made based on whether the days had been classified as NPF days or not.
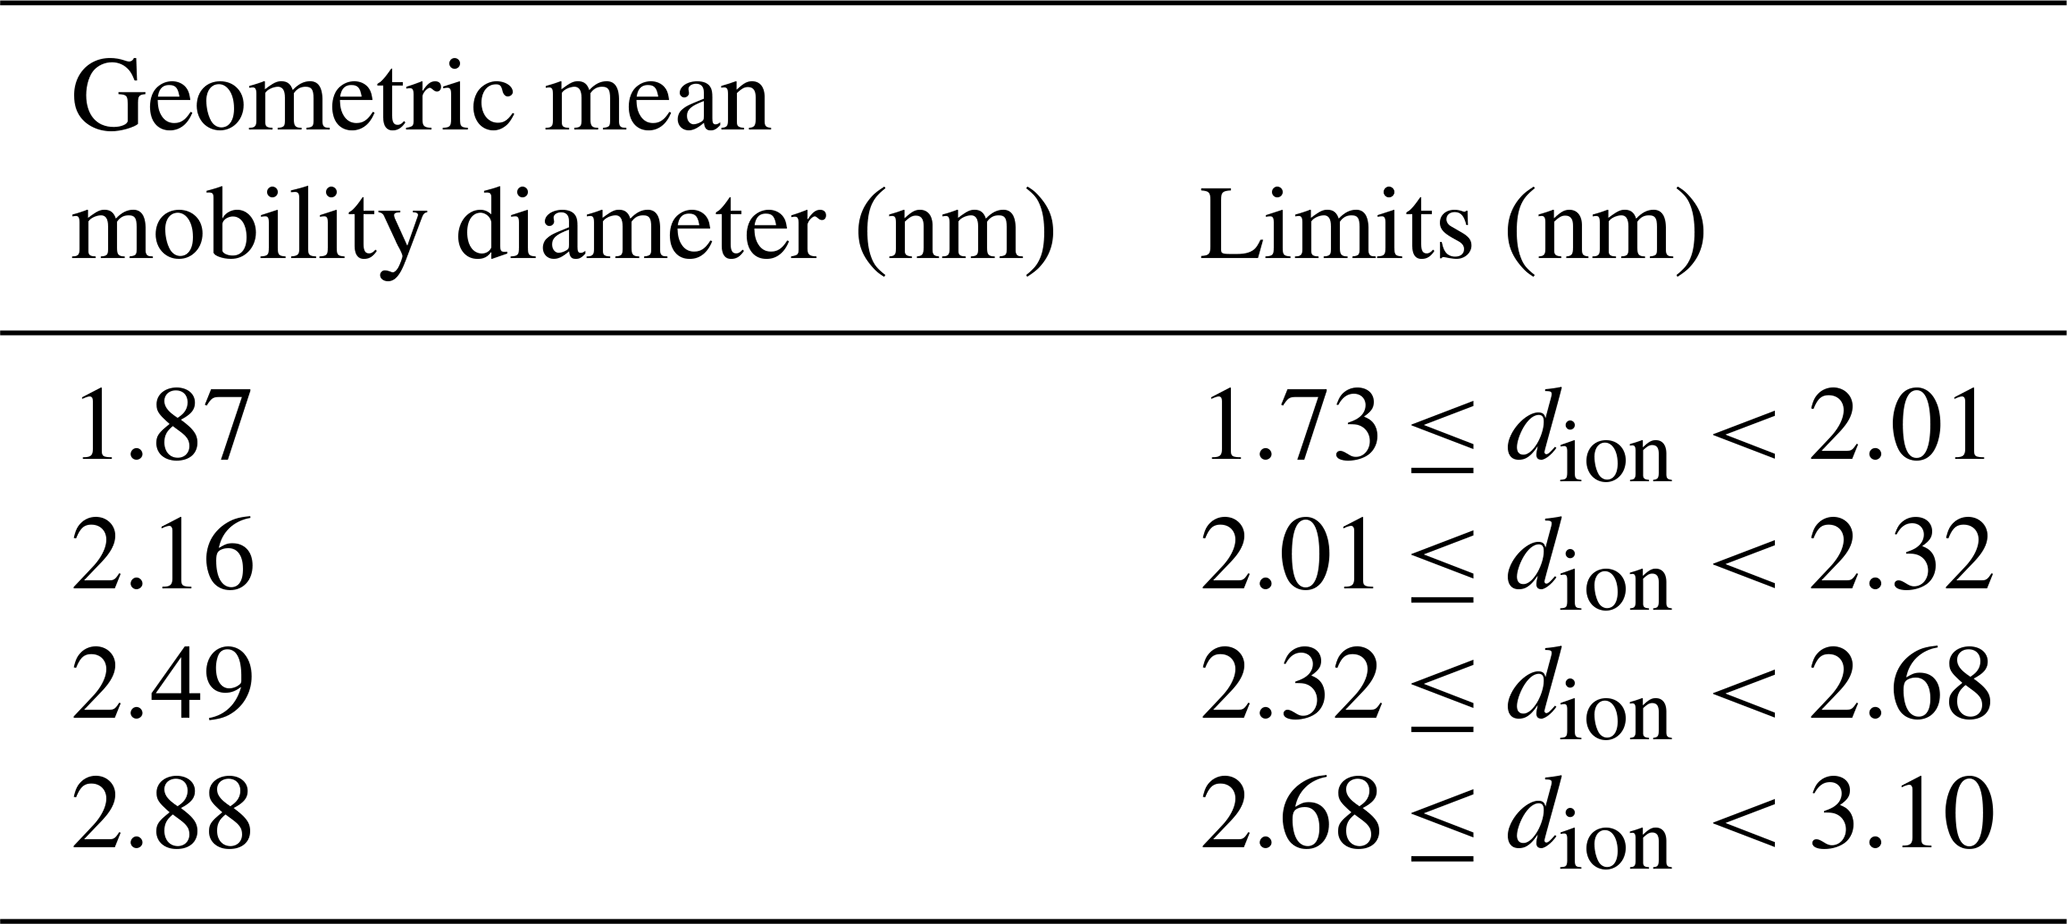
Four different ion size bins, which were based on the inversion method used, were considered in the analysis (Table 1). The choice of these ion sizes is discussed in Sect. 2.3. The ion concentration values equal to or below zero were omitted, and outliers were removed based on the 1 % and 99 % quantiles. However, we note that the effect of this procedure on our results was found to be minor.
Median, 25 %, and 75 % quantile concentrations were determined for each hour of a 24 h cycle. All the data points which were measured during a certain hour were found, and then the median and the quantile values were calculated. The 75 % quantile concentrations include, with a high probability, the data that correspond to times of higher rates of intermediate ion formation (IIF), while the 25 % quantile is more likely to include data from times with no IIF. As such, although no strict division between NPF events and non-event was made, we could derive information on the ion concentrations with respect to the probable strength of IIF.
In addition, we used the daily background ion concentrations, which were assumed to correspond to the concentrations when no, or little, IIF was taking place. These concentrations were determined as median values between 00:00 and 08:00 (UTC+02:00). This time span was chosen based on a visual inspection of the statistical behavior of the ion concentrations. The time periods during which when the variation in the concentrations was relatively low were assumed to correspond to the times with (statistically) little IIF.
Table 1The four different size bins which were used in the analysis. The data were measured by the Neutral cluster and Air Ion Spectrometer (NAIS), and the bins are based on the data inversion used.
2.3 Choosing the investigated diameters
Intermediate ions with mobility diameters between approximately 2 and 7 nm have in previous studies been used to capture and investigate NPF (see, e.g., Kulmala et al., 2013b). In this work, we narrowed the investigated mobility diameters to between 1.7 and 3.1 nm. Narrow diameter ranges were investigated to minimize the variation in the potential source area of the growing ions. The lower and upper limits were chosen based on our main motivations: first, as we are interested in local ion formation, we wanted the source area of the growing ions to be as small as possible. The upper limit of 3.1 nm was decided based on two assumptions – that the ions larger than 3.1 nm in diameter are likely to originate from outside the desired source area and that the ions with smaller diameters than 3.1 nm are sensitive enough to IIF and the inclusion of larger ions is unnecessary. We note that in the initial phases of this study, ions with diameters of up to 4 nm, which was the upper limit used by, e.g., Dada et al. (2018), were considered and later excluded. In addition, as mentioned before in the Introduction, we wanted to observe the ions that were already growing to larger sizes. Previous studies have used the mobility diameter of 2 nm as the limit between small and intermediate ions. Small ions tend to be present practically all the time (e.g., Hõrrak et al., 2000; Hirsikko et al., 2011) and, as such, do not guarantee the formation of larger particles associated with atmospheric NPF. However, the value of 2 nm for the limit of small ions and intermediate ions is an approximation, and thus we chose to include one size bin extending to below 2 nm in our analysis.
2.4 Horizontal ion transport
Simple linear calculations were made to illustrate the size dependency of how far a growing ion can be transported before being measured. We assumed a constant growth rate (GR) for the ions and that the growing ions were transported horizontally along air masses characterized by a constant wind speed. Thus, if the initial ion size is d0 and the size it is measured at is d1, we can say that the farthest distance it can have traveled during its growth is
We investigated atmospheric ion concentrations for four different diameters to determine the most suitable diameter range for identification and evaluating the intensity of local intermediate ion formation (LIIF). The choice of the investigated diameters is justified in Sect. 2.3.
Our base assumption in all our analysis is that the main source of intermediate ions is intermediate ion formation (IIF). Therefore, clear and relatively sharp increases in ion concentrations (i.e., peaks) in a relatively short time period (e.g.,1 to 3 h) are assumed to indicate IIF with a high probability. Other potential explanations for such features are primary sources such as traffic (Jayaratne et al., 2014), which are assumed to be negligible in Hyytiälä, and changes in meteorological conditions or the ion sink. In addition, it could be possible that the growth of the ions is stunted, and they are then transported to the measurement site from elsewhere before evaporating. While difficult to ensure, we assume that the impact of this on the statistical behavior of the ion concentrations is minor. This assumption is vindicated by the observations of elevated ion concentrations statistically coinciding with time periods of elevated intensity of NPF (see Sect. 3.1). Based on the discussion here, IIF can be identified from elevated intermediate ion concentrations. Since we have assumed that IIF is the main source of intermediate ions, higher intermediate ion concentrations can be assumed to correspond to more intense IIF.
It should be noted that our results are mainly concerned with the statistical features of atmospheric ion concentrations made from a relatively large number of observational data. Features of atmospheric IIF on individual days, as well as how that is observable from ion concentrations, might differ from the statistical observations made in this study due, for example, to variations in particle formation mechanisms and pathways and meteorological conditions.
3.1 Diurnal cycles of ion concentrations
We investigated the statistics of diurnal cycles of ion concentrations in four different size bins between 1.7 and 3.1 nm. The 25 %, 50 % (median), and 75 % quantile concentrations for the ion concentrations were determined for each 1 h time window of a 24 h day (see Sect. 2.2). The values based on all the data are presented in Fig. 1. Figures 2 and 3 include the data from only March–May and September–November, respectively. The diurnal ion concentrations for December–February and June–August are presented in the Supplement (Figs. S1 and S2, respectively).
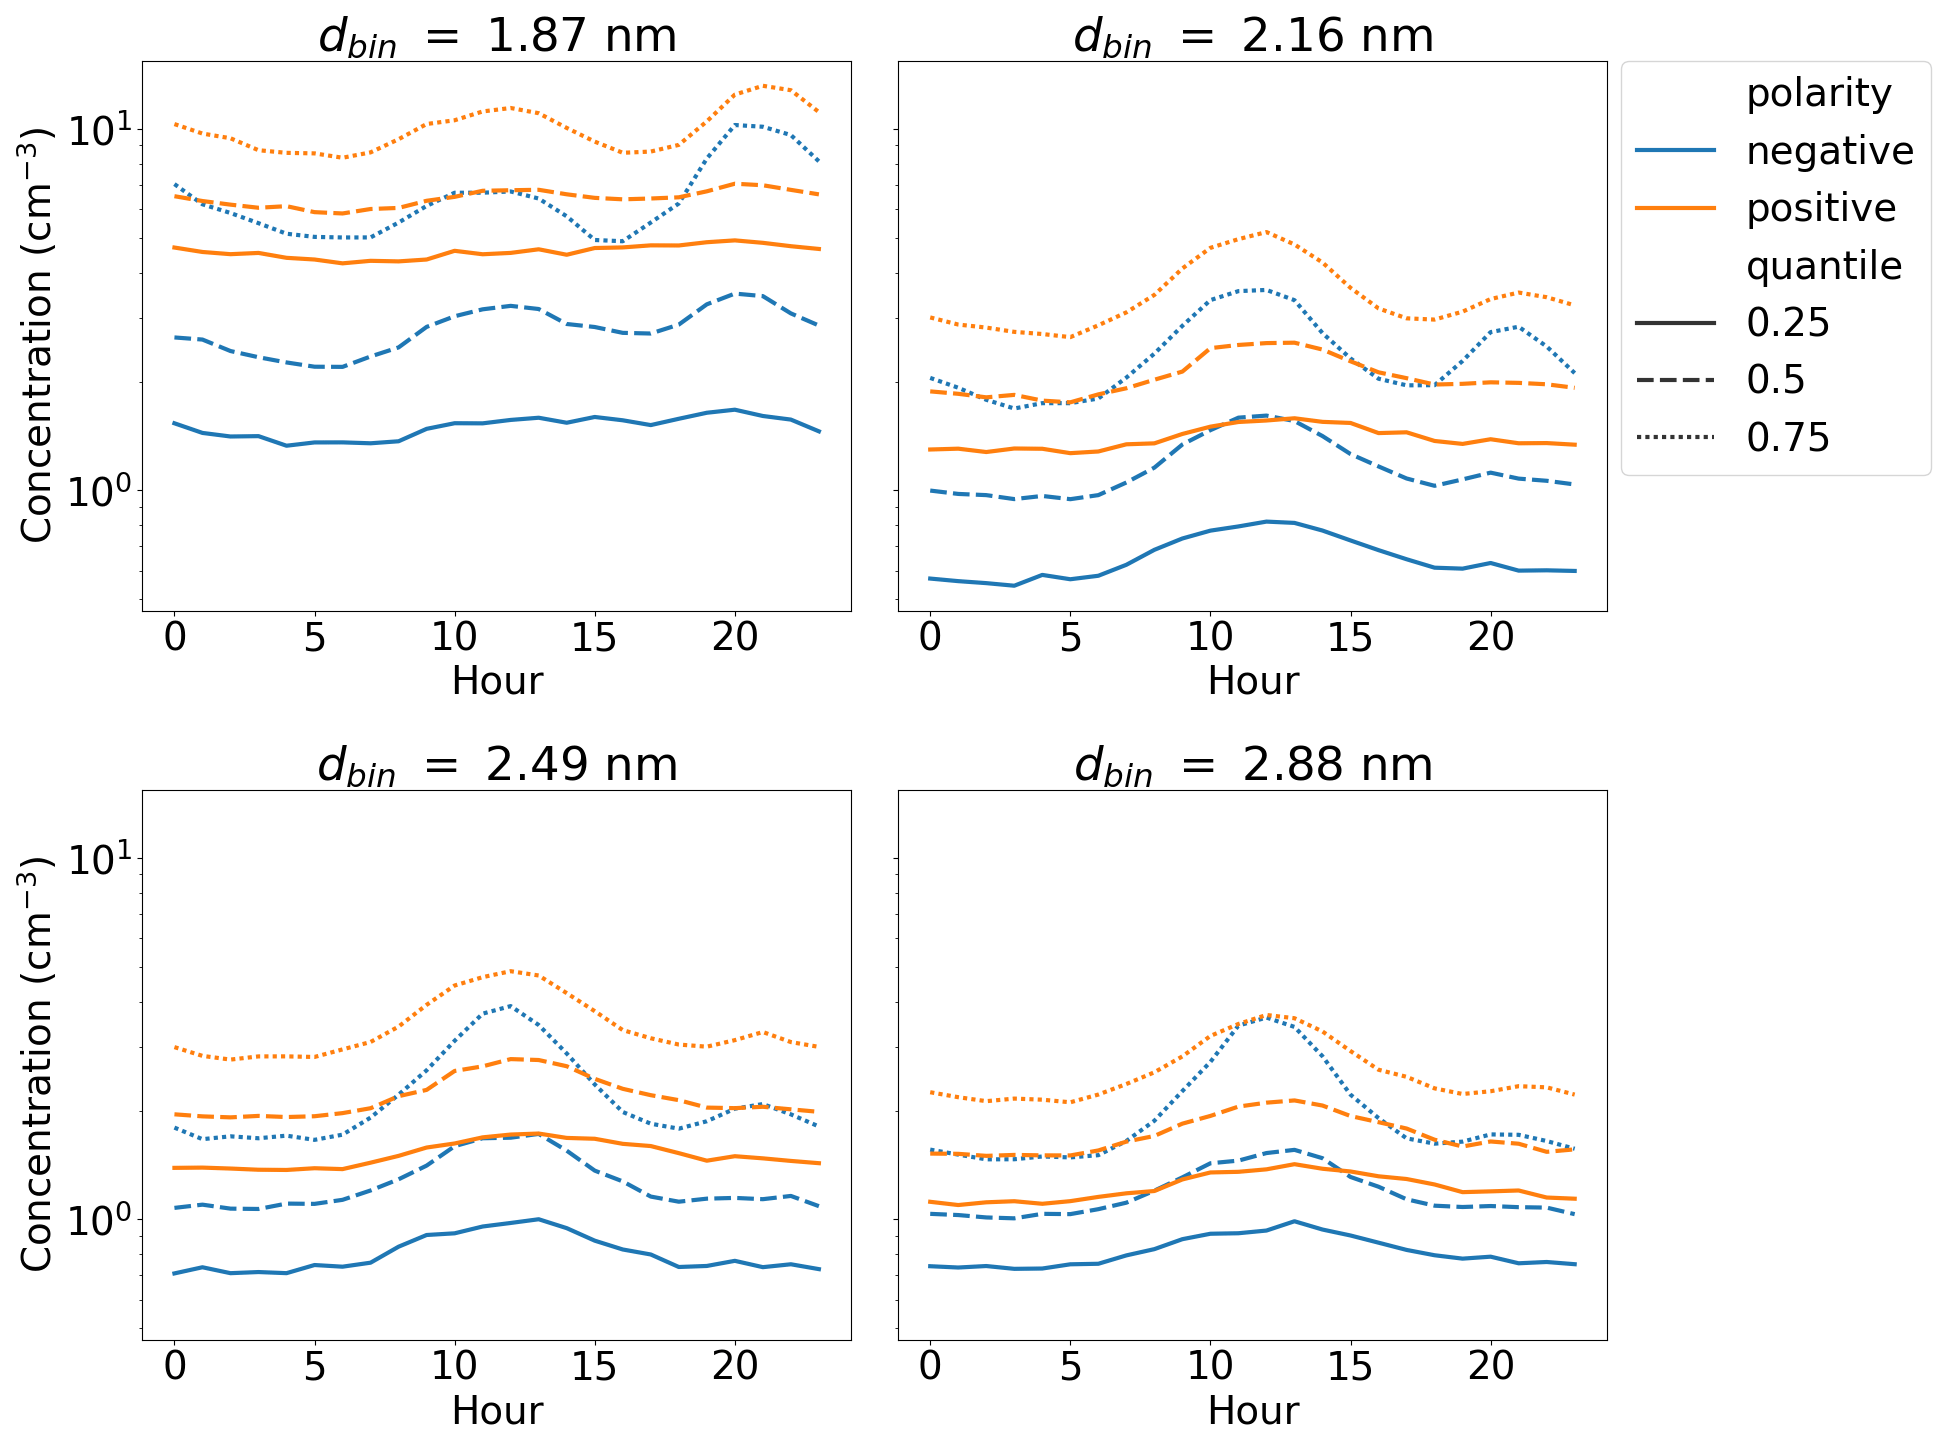
Figure 1Hourly ion concentrations in four size bins with geometric mean mobility diameter dbin based on median, 25 %, and 75 % quantiles. The ion concentrations were measured by a Neutral cluster and Air Ion Spectrometer (NAIS) at the SMEAR II measurement station in Hyytiälä, Finland, from 2016 to 2020. Data from all seasons are included, and no distinction between the days that were classified as NPF events days or not was made.
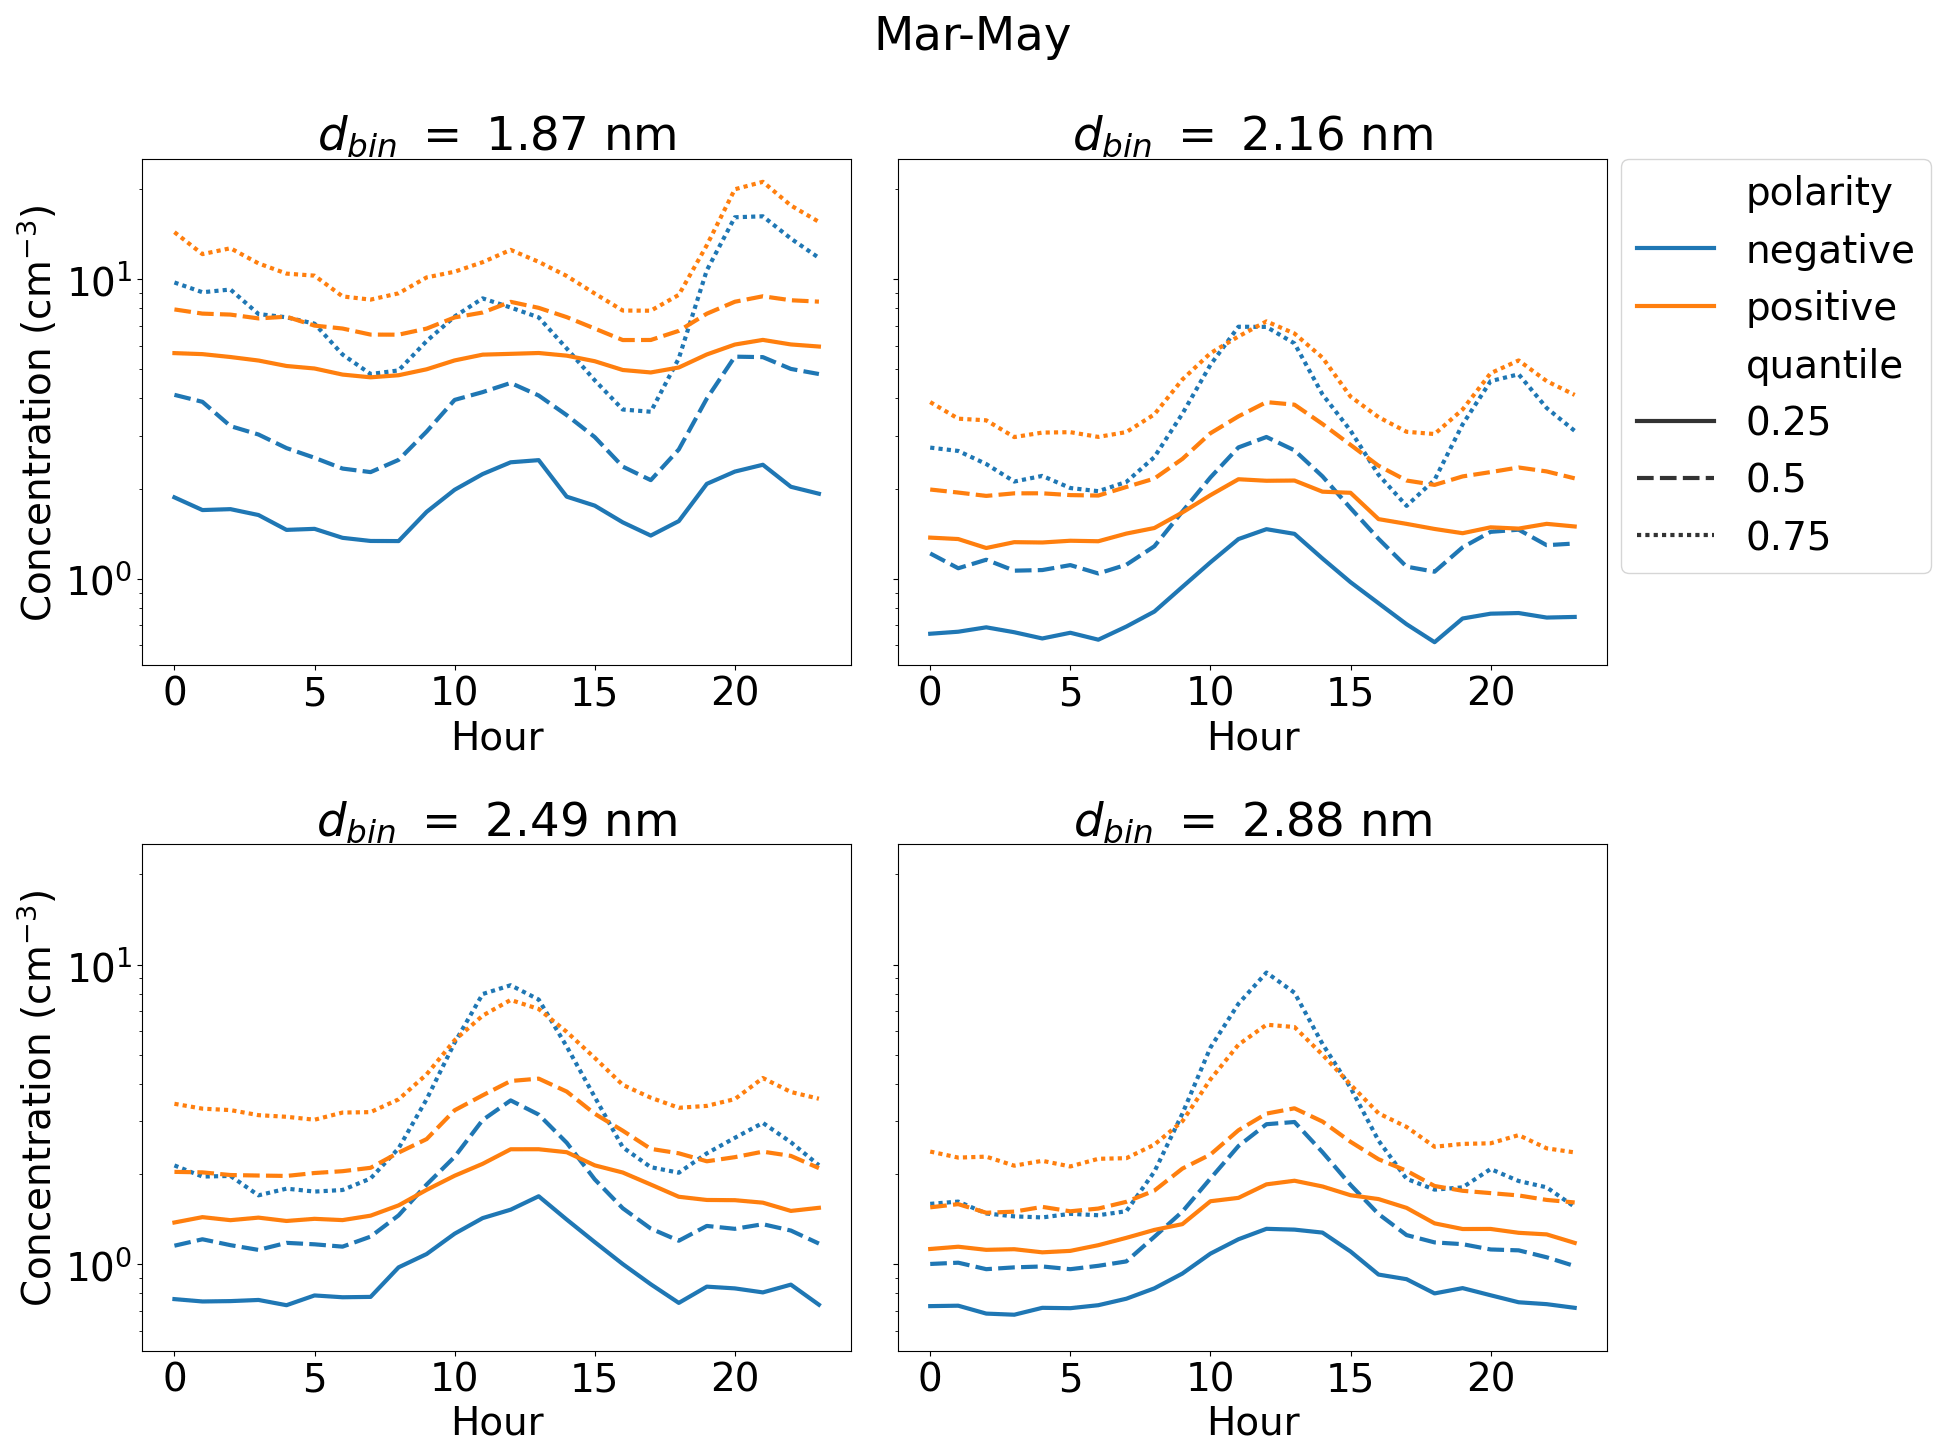
Figure 2Hourly ion concentrations from March–May in size bins with geometric mean mobility diameter dbin based on median, 25 %, and 75 % quantiles. The ion concentrations were measured by a Neutral cluster and Air Ion Spectrometer (NAIS) at the SMEAR II measurement station in Hyytiälä, Finland, from 2016 to 2020.
In Fig. 1, aside from the 25 % quantile concentrations of dbin≈1.87 nm ions, increases in concentrations during the daytime (approx. between 10:00 and 15:00 UTC+02:00) can be clearly seen. For the median concentrations, the increase is roughly 0.5 cm−3 in all four size bins. In Fig. 2 (spring) a similar increase in concentrations during the daytime is observed; however it is clearer compared to Fig. 1. In Fig. 2, the increase in the median concentrations is roughly 2 cm−3 in all four size bins. Based on previous research, we know that NPF events often occur around midday and that the main source of ions in the intermediate size range is due to IIF. In addition, we know that in Hyytiälä the spring period has the most frequent NPF events. Therefore, we can safely assume that these peaks indicate that the rate of IIF is increased during this time period, either on site or with the growing ions being transported to the site from elsewhere. The daytime peaks during autumn (Fig. 3) are weak, and they are completely absent in the concentrations of dbin≈1.87 nm ions. This is as expected based on the fact that NPF during the autumn is less common due to the lower precursor concentrations and photochemical activity compared to spring.
In Fig. 1, we see peaks in the 75 % quantile ion concentrations also during the evening (around 20:00 UTC+02:00). These peaks are stronger for the smaller size bins, while from the concentrations in dbin≈2.88 nm, the peak is barely noticeable. These peaks suggest that there are also potentially slightly elevated rates of IIF in the evening; however the efficiency of the growth of particles to larger diameters appears to be very low. The daytime peaks of the 75 % concentrations in Fig. 1 show an increase by a relatively similar amount in all four size bins. However, the evening peak for dbin≈1.87 nm in the negative polarity shows an increase by over 5 cm−3, while for the concentrations in dbin≈2.16 nm, the increase is less than 1 cm−3 (Fig. 1). Evening ion clustering, attributed to organic emissions, has in previous studies been observed to take place at the site (Mazon et al., 2016; Rose et al., 2018). The effect of the evening clustering is likely to have little effect on the total production of larger particles, which could affect, e.g., climate.
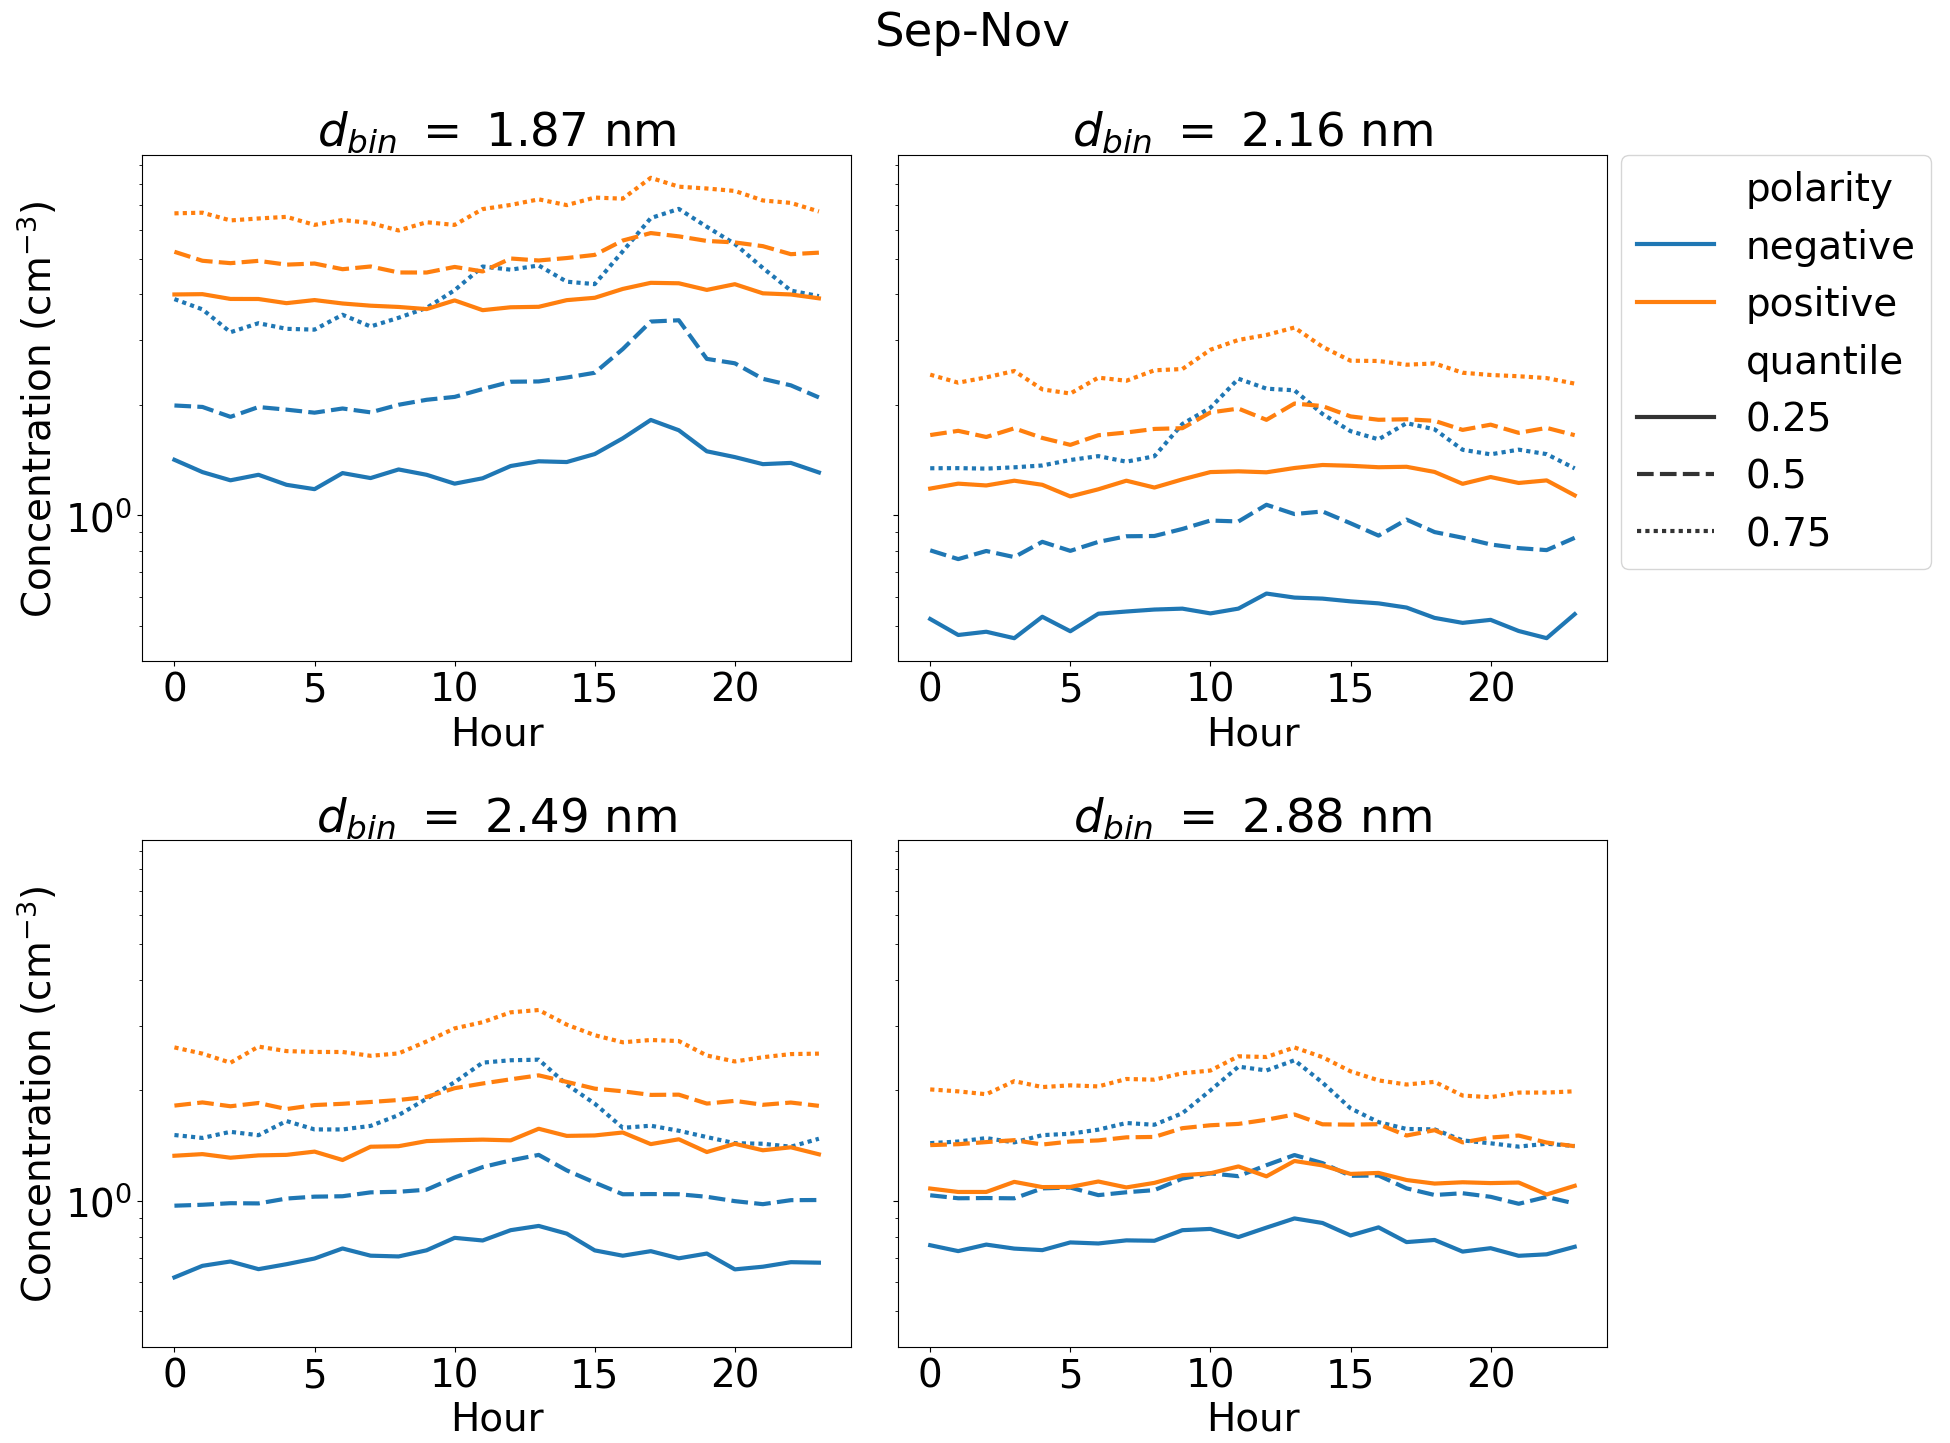
Figure 3Hourly ion concentrations from September–November in size bins with geometric mean mobility diameter dbin based on median, 25 %, and 75 % quantiles. The ion concentrations were measured by a Neutral cluster and Air Ion Spectrometer (NAIS) at the SMEAR II measurement station in Hyytiälä, Finland, from 2016 to 2020.
Next, we will discuss the differences between the four investigated size bins more. From Figs. 1–3 we can see that the concentrations of smaller-sized ions are overall higher than for larger ions. This is the most apparent between the concentrations in dbin≈1.87 nm and the concentrations in other size bins, while the differences between the concentrations from the other three size bins are much smaller. Figure 4 shows the median hourly values of the ion concentrations divided by the daily background concentrations (see Sect. 2.2). For the ion concentrations to be good for identifying IIF, the difference between the background and the peaks corresponding to a higher intensity of IIF should be as clear as possible. We see that for dbin≈1.87 nm, the daily peak concentration is less than 1.1 times the background ion concentration. For the three larger size bins, the peak concentration is between 1.5 and 1.7 times higher than the background concentration, with the value increasing with the diameter. However, it should be noted that the background for dbin≈1.87 nm ion concentrations is likely overestimated to some extent as the increased concentrations from the evening decrease slowly during the night. Regardless, it seems probable that on average it may be more difficult to detect IIF, especially in the case of weak IIF, from the concentrations in dbin≈1.87 nm compared to the larger size bins. This is supported by Fig. 3, which shows that during autumn there are no visible daytime peaks for dbin≈1.87 nm in the median and 25 % quantile concentrations, unlike for the other larger size bins.
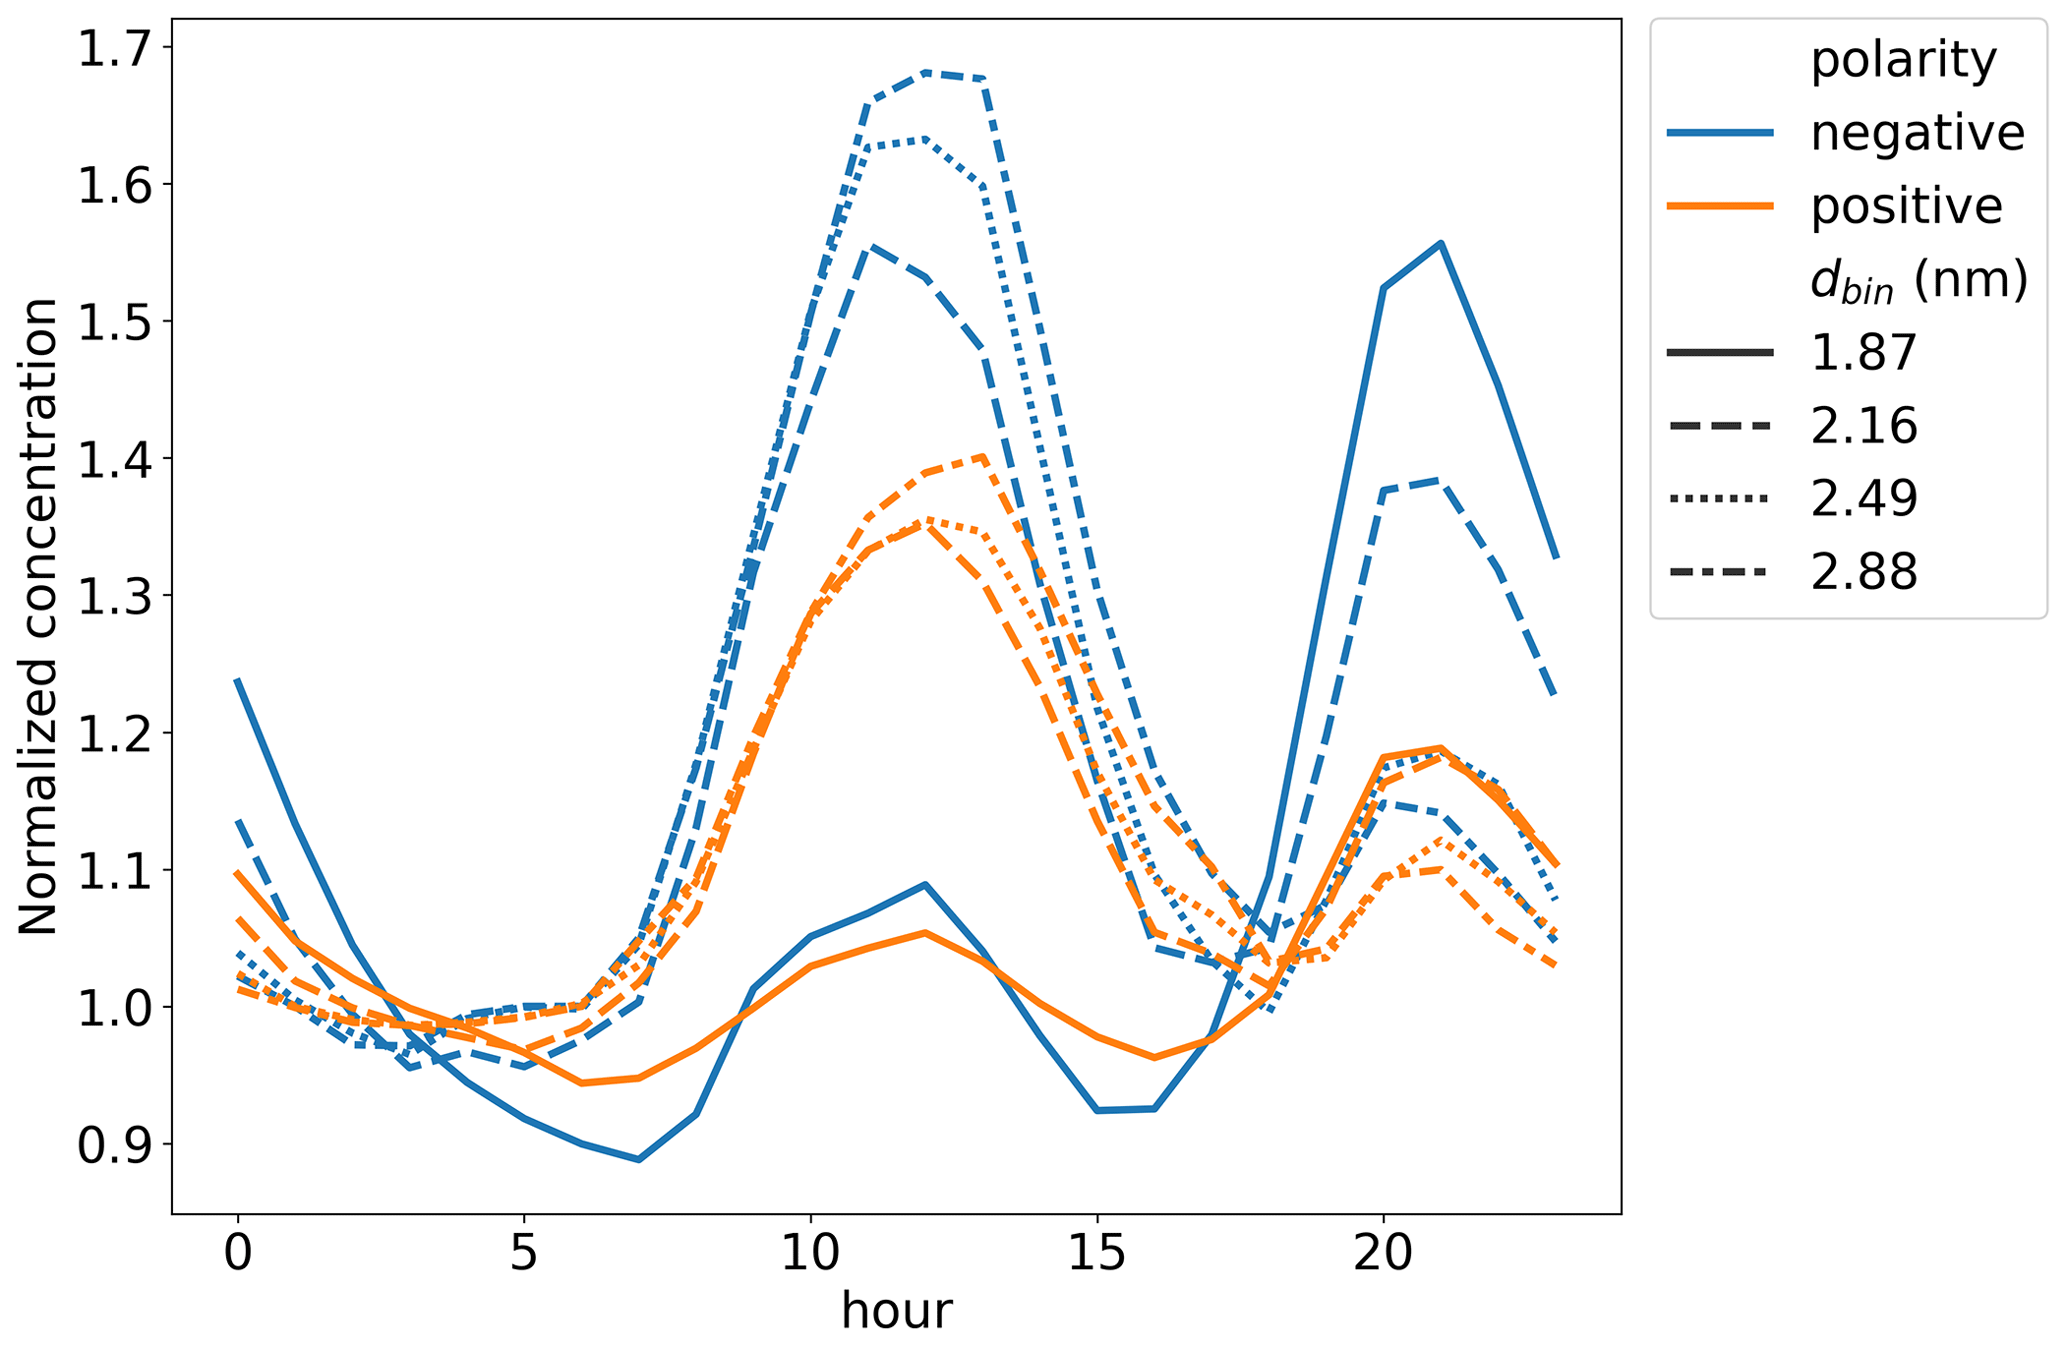
Figure 4The median hourly ion concentrations normalized by the background ion concentration. The geometric mean mobility diameters of the different size bins are denoted with dbin. The ion concentrations were measured by a Neutral cluster and Air Ion Spectrometer (NAIS) at the SMEAR II measurement station in Hyytiälä, Finland, from 2016 to 2020.
The evening ion cluster formation is, as mentioned, the most apparent for the concentrations in dbin≈1.87 nm and has mostly disappeared by dbin≈2.88 nm. For the concentrations in dbin≈1.87 nm, the evening peaks are equal to or higher than the daytime peaks. The behavior and diurnal pattern of the ion concentrations in dbin≈1.87 nm are different from those of the ion concentrations in the three other size bins. Therefore, the increasing ion concentration in this size bin might not necessarily indicate that there is any considerable growth of ions above 2 nm in size. In addition, if we use the concentrations in size bin dbin ≈ 1.87 nm to evaluate the intensity of IIF, we might end up drawing inaccurate conclusions such as the evening having the most intense IIF. On the contrast, based on the three larger size bins, we can identify the periods with the highest rates of IIF. While the concentrations in the size bin dbin≈1.87 nm would be a good choice for detecting and evaluating the potential intensity of evening ion cluster formation, we argue they are less suited for detecting or evaluating the intensity of IIF. Another important implication of our results is that ions smaller than 2 nm are arguably small ions. Based on the NAIS measurements, the separation between small and intermediate ions appears to be at the mobility diameter of 2 nm, as has been used in previous studies (e.g., Leino et al., 2016).
Next, we will discuss the differences between the two polarities. From Fig. 1, the first obvious difference between the concentrations in the two polarities is that the positive ion concentrations appear to be higher compared to the negative ion concentrations. This holds true both for all four size bins and for all hours. In addition, the difference between the peak concentrations and the lower concentrations appears to be higher for negative ions compared to positive ions. If we only look at the 75 % quantile concentrations during spring (Fig. 2), we can see that, aside from dbin≈ 1.87 nm, the peak concentrations for the negative ions are equal to, or even higher than, those for the positive ions. This is despite the overall lower concentration of the negative ions.
Figure 4 shows that the concentrations of the daytime peak, which we assume to indicate the occurrence of daytime IIF, are higher compared to the background concentration for the negative ions than for the positive ions. For example, for the concentrations in dbin≈2.88 nm, the peak median concentration is around 1.4 times the background for positive ions versus around 1.65 times for negative ions. Figure 5 shows the 75 % quantile values divided by 25 % quantile values. We have assumed that the main source of intermediate ions is IIF. Therefore, the different quantile concentrations can be used to derive insight into the differences in the concentration signals between the times of strong IIF versus little IIF. We see that for all the four size bins, the difference between the 75 % and the 25 % concentrations is higher for the negative ions compared to the positive ions. For example, for the negative concentrations in dbin≈2.16 nm, the 75 % quantile concentrations are approximately 10 times higher than the 25 % quantile concentrations. For the positive ion concentrations in the same size bin, the difference is only of a factor of 5.
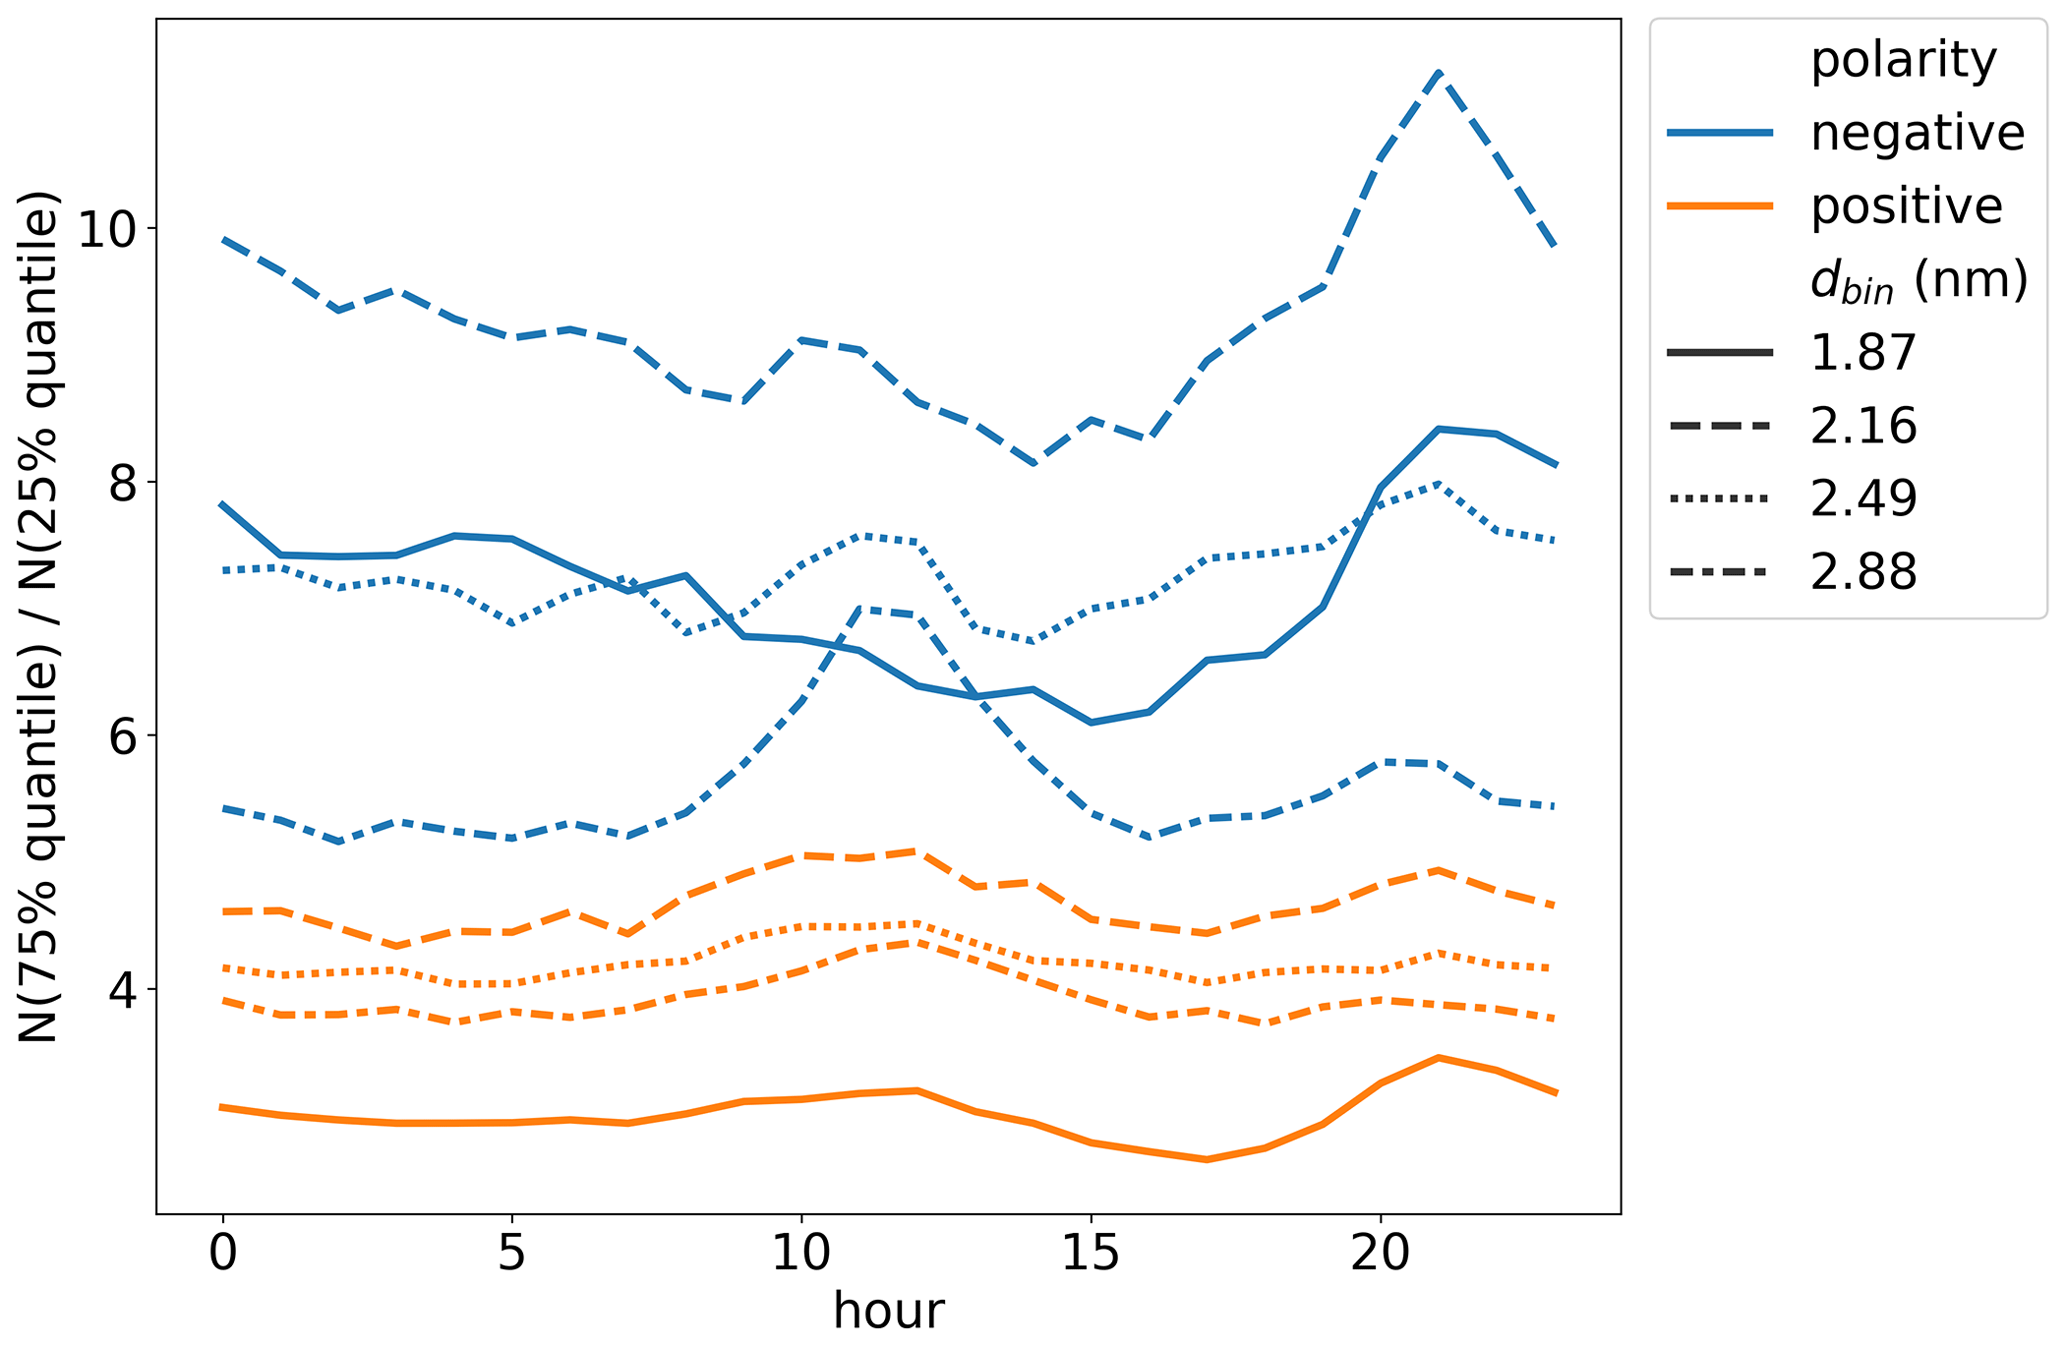
Figure 5Hourly 75 % quantile ion concentrations divided by the 25 % quantile concentrations of the same hour. The geometric mean mobility diameters of the different size bins are denoted with dbin. The ion concentrations were measured by a Neutral cluster and Air Ion Spectrometer (NAIS) at the SMEAR II measurement station in Hyytiälä, Finland, from 2016 to 2020.
Based on the analysis presented here, at least in Hyytiälä, the difference between the times of IIF taking place and little to no IIF can be expected to be higher for the negative ion concentrations than for the positive ion concentrations. This suggests that the negative ion concentrations are better suited for identifying and evaluating the intensity of IIF than the positive ion concentrations. These observations and conclusions are in agreement with previous studies, such as Hirsikko et al. (2007), where intermediate ion formation was detected slightly more often for negative than positive ions at the Hyytiälä measurement stations.
We postulate that the influence of constant background concentrations could be larger for positive ions due to their larger mobility diameters compared to negative ions (Hõrrak et al., 2000; Harrison and Aplin, 2007), extending the background to larger diameters. This is supported by Fig. S3, showing the median hourly concentrations of both polarities for diameters 0.8–1.2 nm, 1.2–1.6 nm, and 1.6–2 nm. We can see that the concentration of the smallest ions is higher for negative ions, whereas the positive ion concentration is higher than the negative one for both 1.2–1.6 nm and 1.6–2 nm ions. This suggests a shift in the small ion spectrum for the positive polarity compared to the negative polarity, and it would explain our observations on the differences between the positive and the negative ion concentrations, at least to some extent. In addition, the electrode effect is known to cause discrepancies in the concentrations of the ions of the two polarities near the ground surface (Israël, 1973). However, previous studies have neglected the effect inside the boreal forest environment (e.g., Tammet and Kulmala, 2005; Tammet et al., 2006).
Previous studies (e.g., Enghoff and Svensmark, 2017) have shown that ion-induced nucleation can result in a higher overcharge (i.e., higher concentration compared to equilibrium) of negative ions compared to positive ions. This suggests that negative ions might be more sensitive to IIF in general, not just in Hyytiälä as shown in this study, at least if ion-induced nucleation is a major contributor to IIF. However, it should be noted that there might be differences in how the concentrations between the polarities differ based on the measurement site due to differing nucleation mechanisms and differences in the background ion concentrations. Therefore, while for Hyytiälä the negative ion concentrations appear to be a preferable choice for identifying IIF, the same might not be true at all locations. Further studies are needed.
Based on the analysis presented in this section, we argue that out of the four investigated size bins, three are suited for identifying and evaluating the intensity of IIF (dbin≈2.16 nm, dbin≈2.49 nm, dbin≈2.88 nm). In addition, for Hyytiälä the negative polarity is arguably the better choice compared to the positive polarity. However, whether this can be generalized to other environments is uncertain. In the next section, the use of ion concentrations to detect and evaluate the intensity of local-scale IIF (LIIF) is discussed.
3.2 Transport of ions and the impact on ion footprint
In the previous section, we showed that the ion concentrations in the size bins dbin≈2.16 nm, dbin≈2.49 nm, and dbin≈2.88 nm can be used to detect IIF. However, the main objective of this study is to find a size, or size range, which is most suited for identifying and evaluating the intensity of local IIF (LIIF). As previously defined, LIIF in this study refers to IIF, where the activation of the ions for growth has occurred within a maximum of 500 m to 1 km of the measurement site. Therefore, it is critical to consider the effect of transport on the measured ion concentrations for different diameters. In this section, transport refers solely to the horizontal transport of a growing air ion or neutral particle, which is ionized before its detection and will be referred to as an ion for simplicity. We note that the ions can also be transported in the vertical direction in the atmosphere. However, IIF related to the detailed description of three-dimensional motion of air parcels is out of the scope of the present investigation.
The larger the ion, the longer the time it has been growing. Consequently, the potential distance the ion may have traveled during its growth increases with the size of the ion. We illustrate this point by very simple linear calculations (see Sect. 2.3) shown in Fig. 6. In the calculations, an initial size of 2 nm was assumed based on both previous studies (see, e.g., Kulmala et al., 2013b) and our results from Sect. 3.1. It should be noted that Fig. 6 presents a rough estimate, and for a more accurate estimation of the transport of growing ions, other factors such as surface roughness and canopy height would need to be considered. For our purposes in this study, a rough estimate is sufficient.
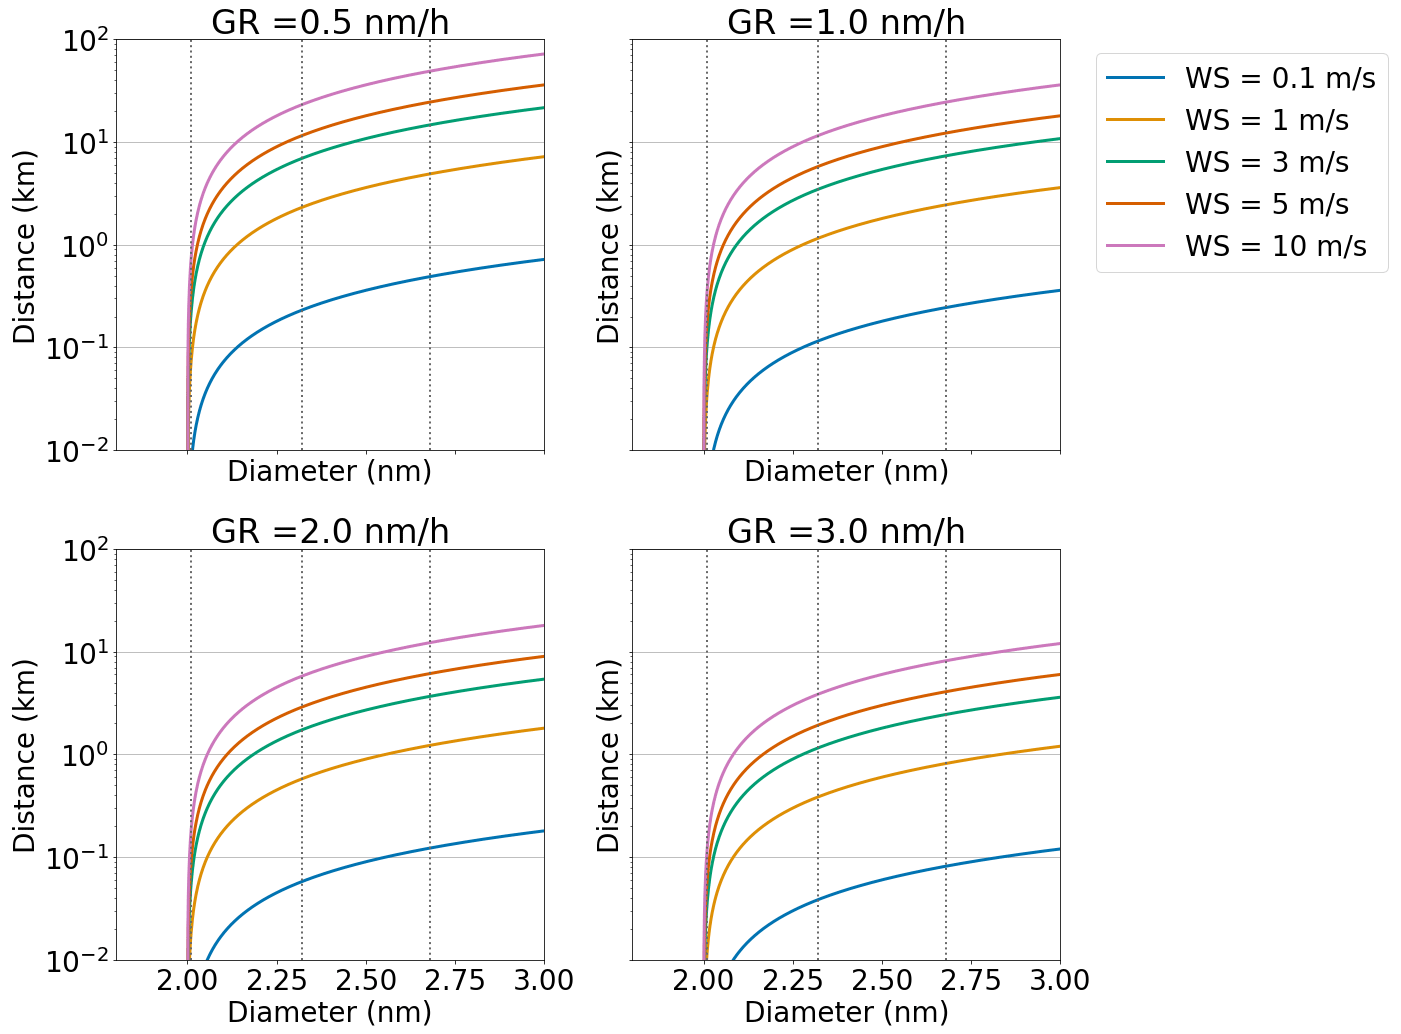
Figure 6The distance a growing atmospheric ion or a neutral particle can be transported by horizontal winds, assuming an initial mobility diameter of 2 nm. The growth rate of the ion/particle is denoted by GR, and it is assumed to stay constant with increasing size. The vertical lines mark the geometric mean mobility diameters of the four size bins of NAIS data, which were used in the study. The horizontal grid has been added as a visual aid.
If we assume a wind speed of 3 m s−1 and GR of 2 nm h−1, which is close to the average particle GR in Hyytiälä (Manninen et al., 2009a), the observed ions in the size bin dbin≈2.88 nm have traveled a distance of approximately 5 km during their growth from 2 to 2.88 nm (Fig. 6). In the same conditions, ions in the size bin dbin≈2.49 nm would have been transported from a distance of between approximately 1.5 and 3 km during their growth. Most of the ions in the size bin dbin≈2.16 nm would have traveled 1 km or less. However, if the wind speed were 1 m s−1, most of the ions in all the investigated size bins would likely have traveled less than a 1 km distance and most of the ions in dbin ≈ 2.16 nm could be assumed to have traveled less than 500 m.
The calculations shown above show that the distances over which growing ions have traveled during their growth are strongly dependent on their size. Therefore, even small increases in the diameter of the detected ions could mean that they are transported hundreds of meters more during their growth. The closer the detected ions are to the size at which they started to grow, the more probable it is that they can be attributed to LIIF. Based on this, we argue that the ions concentrations in dbin ≈ 2.16 nm, corresponding to the size range of 2.0–2.3 nm, are better suited for detecting and evaluating the intensity of LIIF as compared to the concentrations in dbin≈2.49 nm or dbin≈2.88 nm. The application of our results will be discussed in Sect. 4.
3.3 Impact of data quantity on ion diurnal cycle
Based on the discussion in the previous section, the ion concentrations in dbin≈ 2.16 nm are recommended for use in identifying and evaluating the intensity of LIIF. Two matters to consider remain: first, we need to evaluate whether it makes a difference or not to use ion concentrations only from dbin≈ 2.16 nm, versus also including data from the larger bins in the analysis. Second, using data from only one size bin could potentially increase the influence of statistical noise, especially if data are sparse, and thus lead to higher uncertainties in the observations of IIF.
Figure 7 shows the median diurnal curves for the negative ion concentrations in dbin≈ 2.16 nm and in the diameter ranges of 2.01–2.50 nm and 2.05–2.68 nm. The latter are based on the nearest-neighbor interpolation and take into account the concentrations in both dbin ≈ 2.16 nm and dbin≈ 2.49 nm. Both curves with all data and with 50 %, 10 %, and 1 % of them are included. The 50 %, 10 %, and 1 % samples of the full data were based on a random sampling of data from all data points.
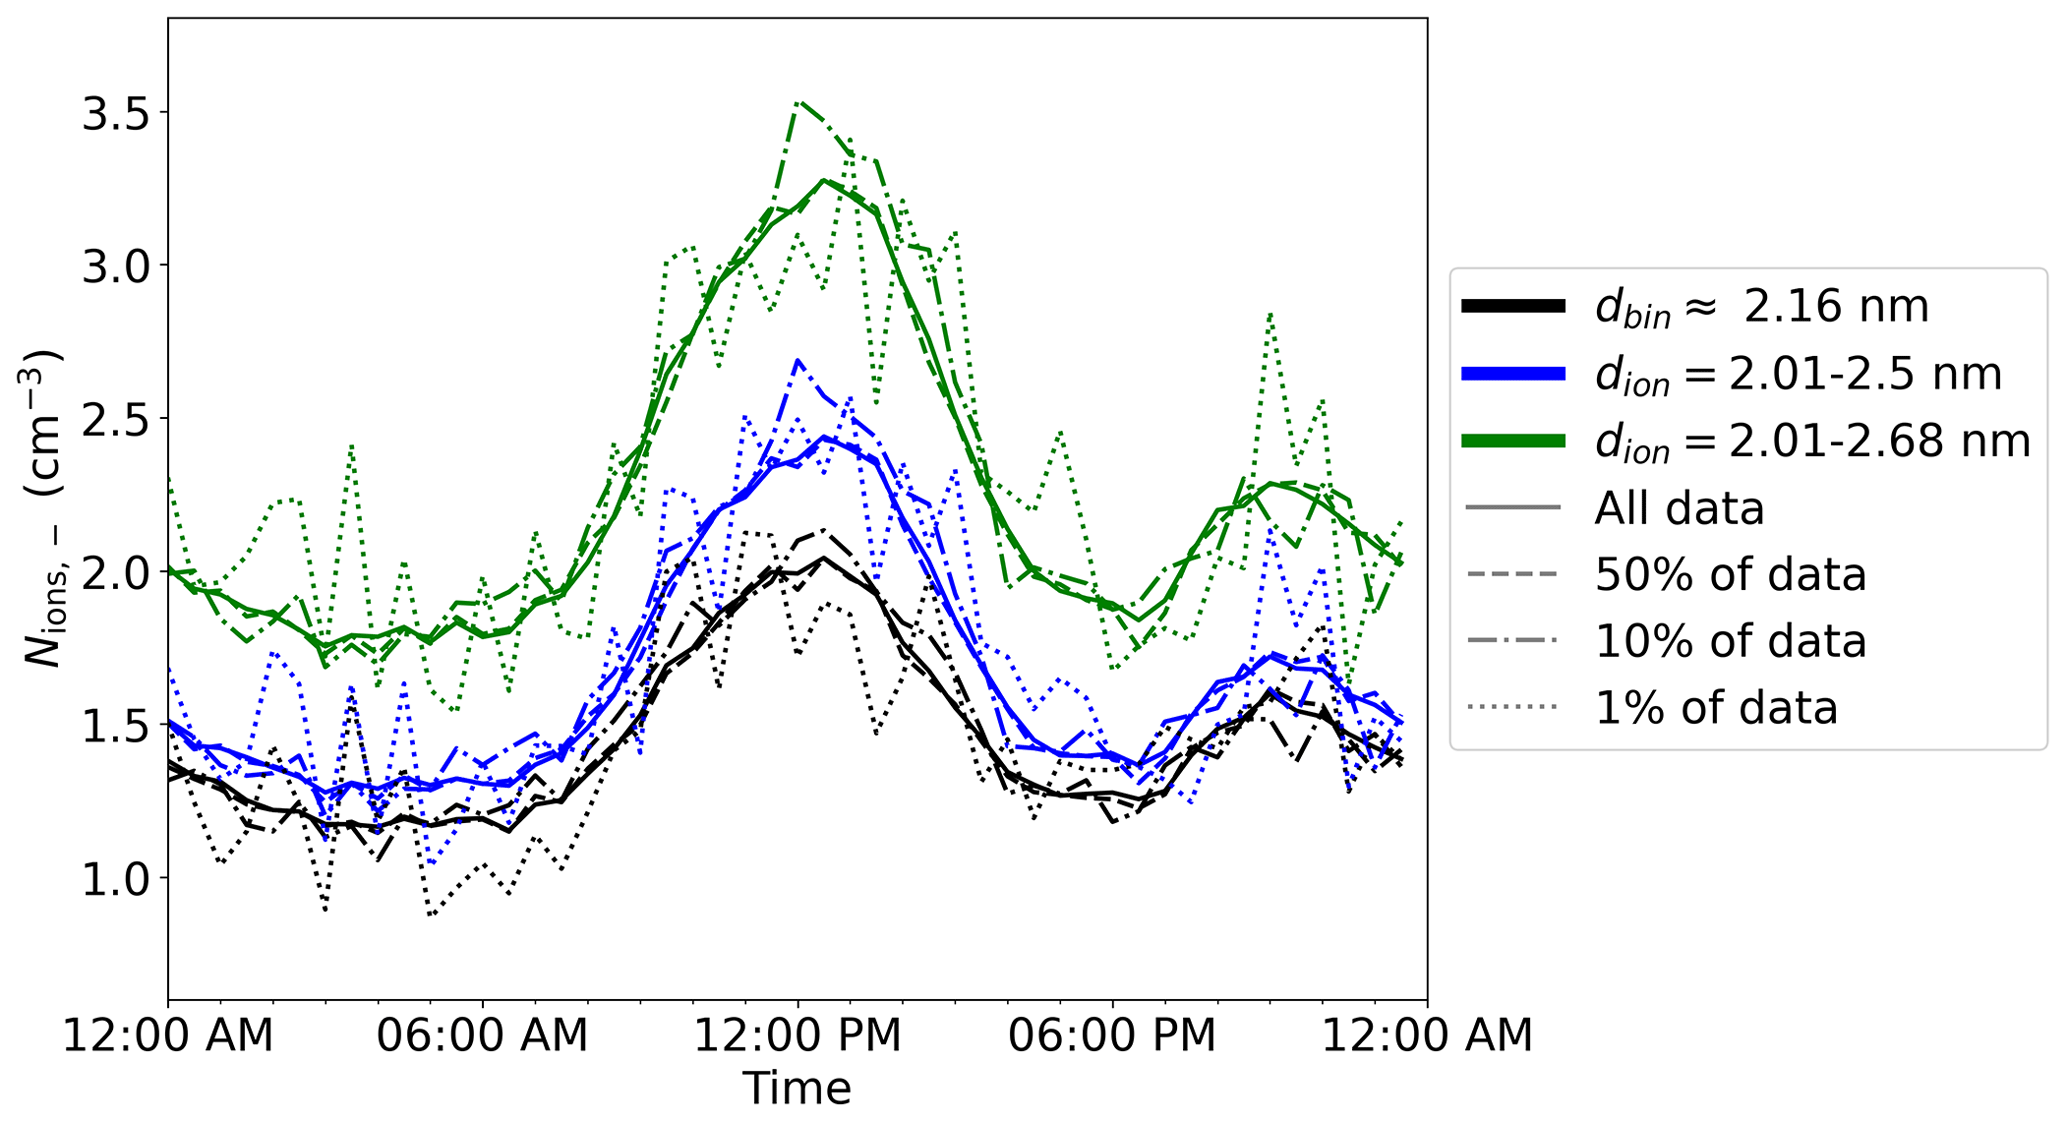
Figure 7Median daily cycle of concentrations of negative ions in the size bin of geometric mean diameter dbin≈ 2.16 nm and between size limits 2.01–2.50 nm and 2.01–2.68 nm, which include data from both the size bin dbin≈ 2.16 nm and the size bin dbin ≈ 2.49 nm. Data are from 2016 to 2020, and they were measured with a Neutral cluster and Air Ion Spectrometer (NAIS).
Figure 7 shows that including the concentrations only from dbin≈ 2.16 nm or from both dbin≈ 2.16 nm and dbin≈ 2.49 nm has a minor effect on the averaged behavior of the negative ion concentration. As such, if we use only the concentrations from dbin ≈ 2.16 nm versus from, e.g., both dbin≈ 2.16 nm and dbin≈ 2.49 nm, there should statistically be no major effect on the observed behavior of ion concentrations during IIF. In addition, Fig. 7 shows that reducing the number of data does not seem to result in a more considerable amount of noise if only data from one size bin are used compared to if data from two size bins are used. Thus, we argue that using the ion concentrations in dbin≈ 2.16 nm, which corresponds to a diameter range of 2–2.3 nm, is the best choice for identifying and evaluating the intensity of LIIF.
In this section, we will discuss a couple of important issues that need to be considered in the application of our results. In addition, example cases for the application of the results will be discussed.
First, one should consider which polarity data to use, assuming both types exist. Differences in the polarities could, for example, be used to derive insight into the growth mechanisms during LIIF or to study the effect of polarity on LIIF. At most other times, however, use of data for only one polarity is preferable, which could for example be the case due to the desire for a more straightforward application and analysis. As discussed in Sect. 3.1, in this case in Hyytiälä the negative polarity would be a preferable choice.
In addition to IIF, intermediate ion concentrations could be elevated due to snowstorms and rain, and therefore these should be filtered out from the data by use of either additional data or visual analysis of the ion concentrations.
The potential source area (i.e., the area from which the ion could have been transported from during its growth) of the 2.0–2.3 nm ions should be considered. Considering the variation in features, such as the landscape, vegetation, and primary emission sources (e.g., traffic) within the potential source area of the detected ions and how it can impact the observed concentrations of the 2.0–2.3 nm ions, is recommended. For example, direct emissions of small ions might increase the observed concentrations, while the GR of ions can vary based on heterogeneities in the precursor vapor, such as low-volatility organic compounds.
In addition, it should be kept in mind that we have defined LIIF so that the initial phase of the growth of the ion from a cluster to larger sizes occurs within proximity to the measurement site. As such, local does not strictly mean that the observed IIF would be free from influences of air outside the source area of interest. Air masses from outside the source area transport larger pre-existing particles and precursor chemical compounds, influencing both the rate at which the growing clusters coagulate with larger particles and the rate that they grow to larger sizes. For example, in Hyytiälä, air masses arriving from the northwest direction have been shown to favor NPF due to these air masses having a low surface area of pre-existing particles (Dal Maso et al., 2007; Dada et al., 2017). In addition to precursor compounds emitted within the area, transported precursor compounds could also affect the number of new clusters. Therefore, one should not interpret the 2.0–2.3 nm ion concentrations or LIIF as independent of influences from outside the assumed source area.
Next, two example cases for the application of our results are discussed. First, if we want to estimate the contribution to total regional particle production by different environments, such as a boreal forest or a wetland, the 2–2.3 nm ion concentrations can be used to represent the particle production if some assumptions are made (see Kulmala et al., 2024). If the average ion sink and the ion growth rate are similar in these environments, the 2.0–2.3 nm ion concentrations should be proportional to the particle production. This information can then for example be used to estimate the contribution of different environments to, e.g., CCN production or aerosol radiative forcing.
Second, the growth of the 2.0–2.3 nm ions from clusters occurs mainly within an area which is similar in size to the footprint area of tower-based eddy covariance measurements. Therefore, the ion concentrations and the eddy covariance fluxes can be assumed to be mostly under the influence of the same environmental conditions. Our results can therefore be applied to estimate particle production within a similar area to CO2 flux, and other fluxes, to study their combined climate impacts (see Kulmala et al., 2024).
Our main objective in this study was to evaluate the suitability of ion concentrations of different sizes for identifying and evaluating the intensity of local intermediate ion formation (LIIF). We studied the ion concentrations in four small size ranges between the mobility diameters 1.7 and 3.1 nm. Ion number size distribution data measured by a Neutral cluster and Air Ion Spectrometer (NAIS) at the SMEAR II measurement station in Hyytiälä, southern Finland, were used.
We found that ion concentrations in the size ranges of 2.0–2.3, 2.3–2.7, and 2.7–3.1 nm can be used in finding periods with elevated rates of intermediate ion formation (IIF) and to evaluate the potential strength of IIF. Ions below 2 nm were found to be less suitable for such purposes. Ions below 2 nm have higher background concentrations, and appear to be less affected by IIF compared to larger ions. In addition, the dynamics of sub-2 nm ions are different from larger ions. These observations indicate that 2 nm is the size which separates small ions and intermediate ions. Compared with positive ions, negative ions were found to be more sensitive to IIF at the SMEAR II measurement station; however whether this is also true at other locations remains to be verified. The impact of transport on concentrations of ions was discussed. The potential distance that the detected ions could have been transported by air masses during their growth becomes longer the larger the ions are. Therefore, we argued that the ions in the size range of 2.0–2.3 nm are the best option for identifying and evaluating the intensity of LIIF associated with NPF.
The ion number concentrations used in this study are available at https://doi.org/10.5281/zenodo.8059335 (Tuovinen et al., 2023).
The supplement related to this article is available online at: https://doi.org/10.5194/ar-2-93-2024-supplement.
ST conducted the data analysis and wrote the paper. JL was responsible for the ion measurements. VMK and MK designed the study. All authors contributed to discussion of the results and provided input for the paper.
At least one of the (co-)authors is a member of the editorial board of Aerosol Research. The peer-review process was guided by an independent editor, and the authors also have no other competing interests to declare.
Publisher’s note: Copernicus Publications remains neutral with regard to jurisdictional claims made in the text, published maps, institutional affiliations, or any other geographical representation in this paper. While Copernicus Publications makes every effort to include appropriate place names, the final responsibility lies with the authors.
The University of Helsinki Doctoral Programme in Atmospheric Sciences is acknowledged. University of Helsinki support via ACTRIS-HY is acknowledged. Support of the technical and scientific staff in Hyytiälä is acknowledged.
This research has been supported by the Research Council of Finland (grant nos. 337549, 302958, 1325656, 311932, 334792, 316114, 325647, 325681, and 347782); the Jane ja Aatos Erkon Säätiö (“Quantifying carbon sink, CarbonSink+ and their interaction with air quality” grant); the Jenny ja Antti Wihurin Rahasto (“Gigacity” grant); and the European Research Council, H2020 European Research Council (grant no. 742206).
This paper was edited by Jonas Elm and reviewed by Martin Bødker Enghoff and one anonymous referee.
Anttila, T., Kerminen, V.-M., and Lehtinen, K. E. J.: Parameterizing the formation rate of new particles: The effect of nuclei self-coagulation, J. Aerosol Sci., 41, 621–636, https://doi.org/10.1016/j.jaerosci.2010.04.008, 2010.
Bellouin, N., Boucher, O., Haywood, J., and Reddy, M. S.: Global estimate of aerosol direct radiative forcing from satellite measurements, Nature, 438, 1138–1141, https://doi.org/10.1038/nature04348, 2005.
Boucher, O., Randall, D., Artaxo, P., Bretherton, C., Feingold, G., Forster, P., Kerminen, V.-M., Kondo, Y., Liao, H., Lohmann, U., Rasch, P., Satheesh, S. K., Sherwood, S., Stevens, B., and Zhang, X. Y.: Clouds and aerosols, in: Climate Change 2013: The Physical Science Basis. Contribution of Working Group I to the Fifth Assessment Report of the Intergovernmental Panel on Climate Change, edited by: Stocker, T. F., Qin, D., Plattner, G.-K., Tignor, M., Allen, S. K., Doschung, J., Nauels, A., Xia, Y., Bex, V., and Midgley, P. M., Cambridge University Press, Cambridge, UK, 571–657, https://doi.org/10.1017/CBO9781107415324.016, 2013.
Bougiatioti, A., Nenes, A., Lin, J. J., Brock, C. A., de Gouw, J. A., Liao, J., Middlebrook, A. M., and Welti, A.: Drivers of cloud droplet number variability in the summertime in the southeastern United States, Atmos. Chem. Phys., 20, 12163–12176, https://doi.org/10.5194/acp-20-12163-2020, 2020.
Bousiotis, D., Pope, F. D., Beddows, D. C. S., Dall'Osto, M., Massling, A., Nøjgaard, J. K., Nordstrøm, C., Niemi, J. V., Portin, H., Petäjä, T., Perez, N., Alastuey, A., Querol, X., Kouvarakis, G., Mihalopoulos, N., Vratolis, S., Eleftheriadis, K., Wiedensohler, A., Weinhold, K., Merkel, M., Tuch, T., and Harrison, R. M.: A phenomenology of new particle formation (NPF) at 13 European sites, Atmos. Chem. Phys., 21, 11905–11925, https://doi.org/10.5194/acp-21-11905-2021, 2021.
Brean, J., Beddows, D. C. S., Harrison, R. M., Song, C., Tunved, P., Ström, J., Krejci, R., Freud, E., Massling, A., Skov, H., Asmi, E., Lupi, A., and Dall'Osto, M.: Collective geographical ecoregions and precursor sources driving Arctic new particle formation, Atmos. Chem. Phys., 23, 2183–2198, https://doi.org/10.5194/acp-23-2183-2023, 2023.
Chu, B., Kerminen, V.-M., Bianchi, F., Yan, C., Petäjä, T., and Kulmala, M.: Atmospheric new particle formation in China, Atmos. Chem. Phys., 19, 115–138, https://doi.org/10.5194/acp-19-115-2019, 2019.
Dada, L., Paasonen, P., Nieminen, T., Buenrostro Mazon, S., Kontkanen, J., Peräkylä, O., Lehtipalo, K., Hussein, T., Petäjä, T., Kerminen, V.-M., Bäck, J., and Kulmala, M.: Long-term analysis of clear-sky new particle formation events and nonevents in Hyytiälä, Atmos. Chem. Phys., 17, 6227–6241, https://doi.org/10.5194/acp-17-6227-2017, 2017.
Dada, L., Chellapermal, R., Buenrostro Mazon, S., Paasonen, P., Lampilahti, J., Manninen, H. E., Junninen, H., Petäjä, T., Kerminen, V.-M., and Kulmala, M.: Refined classification and characterization of atmospheric new-particle formation events using air ions, Atmos. Chem. Phys., 18, 17883–17893, https://doi.org/10.5194/acp-18-17883-2018, 2018.
Dal Maso, M., Kulmala, M., Riipinen, I., and Wagner, R.: Formation and growth of fresh atmospheric aerosols: Eight years of aerosol size distribution data from SMEAR II, Hyytiälä, Finland, Boreal Environ. Res., 10, 323–336, 2005.
Dal Maso, M. D., Sogacheva, L., Aalto, P. P., Riipinen, I., Komppula, M., Tunved, P., Korhonen, L., Suur-Uski, V., Hirsikko, A., KurtéN, T., Kerminen, V.-M., Lihavainen, H., Viisanen, Y., Hansson, H.-C., and Kulmala, M.: Aerosol size distribution measurements at four Nordic field stations: identification, analysis and trajectory analysis of new particle formation bursts, Tellus B, 59, 350–361, https://doi.org/10.1111/j.1600-0889.2007.00267.x, 2007.
Enghoff, M. B. and Svensmark, J.: Measurement of the charging state of 4–70 nm aerosols, J. Aerosol Sci., 114, 13–20, https://doi.org/10.1016/j.jaerosci.2017.08.009, 2017.
Fan, J., Wang, Y., Rosenfeld, D., and Liu, X.: Review of Aerosol–Cloud Interactions: Mechanisms, Significance, and Challenges, J. Atmos. Sci., 73, 4221–4252, https://doi.org/10.1175/JAS-D-16-0037.1, 2016.
Gordon, H., Kirkby, J., Baltensperger, U., Bianchi, F., Breitenlechner, M., Curtius, J., Dias, A., Dommen, J., Donahue, N. M., Dunne, E. M., Duplissy, J., Ehrhart, S., Flagan, R. C., Frege, C., Fuchs, C., Hansel, A., Hoyle, C. R., Kulmala, M., Kürten, A., Lehtipalo, K., Makhmutov, V., Molteni, U., Rissanen, M. P., Stozkhov, Y., Tröstl, J., Tsagkogeorgas, G., Wagner, R., Williamson, C., Wimmer, D., Winkler, P. M., Yan, C., and Carslaw, K. S.: Causes and importance of new particle formation in the present-day and preindustrial atmospheres, J. Geophys. Res.-Atmos., 122, 8739–8760, https://doi.org/10.1002/2017JD026844, 2017.
Hari, P. and Kulmala, M.: Station for measuring Ecosystem-Atmosphere relations (SMEAR II), Boreal Environ. Res., 10, 315–322, 2005.
Harrison, R. G. and Aplin, K. L.: Water vapour changes and atmospheric cluster ions, Atmos. Res., 85, 199–208, https://doi.org/10.1016/j.atmosres.2006.12.006, 2007.
Hirsikko, A., Laakso, L., Hõrrak, U., Aalto, P. P., Kerminen, V.-M., and Kulmala, M.: Annual and size dependent variation of growth rates and ion concentrations in boreal forest, Boreal Env. Res., 10, 357–369, 2005.
Hirsikko, A., Bergman, T., Laakso, L., Dal Maso, M., Riipinen, I., Hõrrak, U., and Kulmala, M.: Identification and classification of the formation of intermediate ions measured in boreal forest, Atmos. Chem. Phys., 7, 201–210, https://doi.org/10.5194/acp-7-201-2007, 2007.
Hirsikko, A., Nieminen, T., Gagné, S., Lehtipalo, K., Manninen, H. E., Ehn, M., Hõrrak, U., Kerminen, V.-M., Laakso, L., McMurry, P. H., Mirme, A., Mirme, S., Petäjä, T., Tammet, H., Vakkari, V., Vana, M., and Kulmala, M.: Atmospheric ions and nucleation: a review of observations, Atmos. Chem. Phys., 11, 767–798, https://doi.org/10.5194/acp-11-767-2011, 2011.
Hõrrak, U., Salm, J., and Tammet, H.: Bursts of intermediate ions in atmospheric air, J. Geophys. Res., 13909–1915, 1998.
Hõrrak, U., Salm, J., and Tammet, H.: Statistical characterization of air ion mobility spectra at Tahkuse Observatory: Classification of air ions, J. Geophys. Res., 105, 9291–9302, https://doi.org/10.1029/1999JD901197, 2000.
Israël, H.: Atmospheric electricity, vol. II, Israel Program for Sci. Transl. & NSF, Jerusalem, 502, 1973.
Jayaratne, E. R., Ling, X., and Morawska, L.: Observation of ions and particles near busy roads using a neutral cluster and air ion spectrometer (NAIS), Atmos. Environ., 84, 198–203, https://doi.org/10.1016/j.atmosenv.2013.11.045, 2014.
Kerminen, V.-M., T. Anttila, Petäjä, T., Laakso, L., Gagneé, S., Lehtinen, K. E. J., and Kulmala, M.: Charging state of the atmospheric nucleation mode: Implications for separating neutral and ion-induced nucleation, J. Geophys. Res., 112, D21205, https://doi.org/10.1029/2007JD008649, 2007.
Kerminen, V.-M., Chen, X., Vakkari, V., Petäjä, T., Kulmala, M., and Bianchi, F.: Atmospheric new particle formation and growth: review of field observations, Environ. Res. Lett., 13, 103003, https://doi.org/10.1088/1748-9326/aadf3c, 2018.
Komppula, M., Lihavainen, H., Kerminen, V.-M., Kulmala, M., and Viisanen, Y.: Measurements of cloud droplet activation of aerosol particles at a clean subarctic background site, J. Geophys. Res.-Atmos., 110, D06204, https://doi.org/10.1029/2004JD005200, 2005.
Kulmala, M., Pirjola, L., and Mäkelä, J. M.: Stable sulphate clusters as a source of new atmospheric particles, Nature, 404, 66–69, https://doi.org/10.1038/35003550, 2000.
Kulmala, M., Maso, M. D., Mäkelä, J. M., Pirjola, L., Väkevä, M., Aalto, P., Miikkulainen, P., Hämeri, K., and O'dowd, C. D.: On the formation, growth and composition of nucleation mode particles, Tellus B, 53, 479–490, https://doi.org/10.1034/j.1600-0889.2001.530411.x, 2001.
Kulmala, M., Riipinen, I., Sipilä, M., Manninen, H. E., Petaja, T., Junninen, H., Maso, M. D., Mordas, G., Mirme, A., Vana, M., Hirsikko, A., Laakso, L., Harrison, R. M., Hanson, I., Le- ung, C., Lehtinen, K. E. J., and Kerminen, V.-M.: Toward Direct Measurement of Atmospheric Nucleation, Science, 318, 89–92, https://doi.org/10.1126/science.1144124, 2007.
Kulmala, M., Petäjä, T., Ehn, M., Thornton, J., Sipilä, M., Worsnop, D. R., and Kerminen, V.-M.: Chemistry of Atmospheric Nucleation: On the Recent Advances on Precursor Characterization and Atmospheric Cluster Composition in Connection with Atmospheric New Particle Formation, Annu. Rev. Phys. Chem., 65, 21–37, https://doi.org/10.1146/annurev-physchem-040412-110014, 2013a.
Kulmala, M., Kontkanen, J., Junninen, H., Lehtipalo, K., Manninen, H. E., Nieminen, T., Petäjä, T., Sipilä, M., Schobesberger, S., Rantala, P., Franchin, A., Jokinen, T., Järvinen, E., Äijälä, M., Kangasluoma, J., Hakala, J., Aalto, P. P., Paasonen, P., Mikkilä, J., Vanhanen, J., Aalto, J., Hakola, H., Makkonen, U., Ruuskanen, T., Mauldin, R. L., Duplissy, J., Vehkamäki, H., Bäck, J., Kortelainen, A., Riipinen, I., Kurtén, T., Johnston, M. V., Smith, J. N., Ehn, M., Mentel, T. F., Lehtinen, K. E. J., Laaksonen, A., Kerminen, V.-M., and Worsnop, D. R.: Direct Observations of Atmospheric Aerosol Nucleation, Science, 339, 943–946, https://doi.org/10.1126/science.1227385, 2013b.
Kulmala, M., Junninen, H., Dada, L., Salma, I., Weidinger, T., Thén, W., Vörösmarty, M., Komsaare, K., Stolzenburg, D., Cai, R., Yan, C., Li, X., Deng, C., Jiang, J., Petäjä, T., Nieminen, T., and Kerminen, V.-M.: Quiet New Particle Formation in the Atmosphere, Front. Environ. Sci., 10, 912385, https://doi.org/10.3389/fenvs.2022.912385, 2022.
Kulmala, M., Ke, P., Lintunen, A., Peräkylä, O., Lohtander, A., Tuovinen, S., Lampilahti, J., Kolari, P., Schiestl-Aalto, P., Kokkonen, T., Nieminen, T., Dada, L., Ylivinkka, I., Petäjä, T., Bäck, J., Lohila, A., Heimsch, L., Ezhova, E., and Kerminen, V.-M.: A novel concept for assessing the potential of different boreal ecosystems to mitigate climate change (CarbonSink+ Potential), Boreal Environ. Res., 29, 1–16, 2024.
Laakso, L., Petäjä, T., Lehtinen, K. E. J., Kulmala, M., Paatero, J., Hõrrak, U., Tammet, H., and Joutsensaari, J.: Ion production rate in a boreal forest based on ion, particle and radiation measurements, Atmos. Chem. Phys., 4, 1933–1943, https://doi.org/10.5194/acp-4-1933-2004, 2004.
Lehtipalo, K., Yan, C., Dada, L., Bianchi, F., Xiao, M., Wagner, R., Stolzenburg, D., Ahonen, L. R., Amorim, A., Baccarini, A., Bauer, P. S., Baumgartner, B., Bergen, A., Bernhammer, A.-K., Breitenlechner, M., Brilke, S., Buchholz, A., Mazon, S. B., Chen, D., Chen, X., Dias, A., Dommen, J., Draper, D. C., Duplissy, J., Ehn, M., Finkenzeller, H., Fischer, L., Frege, C., Fuchs, C., Garmash, O., Gordon, H., Hakala, J., He, X., Heikkinen, L., Heinritzi, M., Helm, J. C., Hofbauer, V., Hoyle, C. R., Jokinen, T., Kangasluoma, J., Kerminen, V.-M., Kim, C., Kirkby, J., Kontkanen, J., Kürten, A., Lawler, M. J., Mai, H., Mathot, S., Mauldin, R. L., Molteni, U., Nichman, L., Nie, W., Nieminen, T., Ojdanic, A., Onnela, A., Passananti, M., Petäjä, T., Piel, F., Pospisilova, V., Quéléver, L. L. J., Rissanen, M. P., Rose, C., Sarnela, N., Schallhart, S., Schuchmann, S., Sengupta, K., Simon, M., Sipilä, M., Tauber, C., Tomé, A., Tröstl, J., Väisänen, O., Vogel, A. L., Volkamer, R., Wagner, A. C., Wang, M., Weitz, L., Wimmer, D., Ye, P., Ylisirniö, A., Zha, Q., Carslaw, K. S., Curtius, J., Donahue, N. M., Flagan, R. C., Hansel, A., Riipinen, I., Virtanen, A., Winkler, P. M., Baltensperger, U., Kulmala, M., and Worsnop, D. R.: Multicomponent new particle formation from sulfuric acid, ammonia, and biogenic vapors, Sci. Adv., 4, eaau5363, https://doi.org/10.1126/sciadv.aau5363, 2018.
Leino, K., Nieminen, T., Manninen, H., Petäjä, T., Kerminen, V.-M., and Kulmala, M.: Intermediate ions as a strong indicator of new particle formation bursts in boreal forest, Boreal Env. Res., 21, 274–286, 2016.
Leppä, J., Gagné, S., Laakso, L., Manninen, H. E., Lehtinen, K. E. J., Kulmala, M., and Kerminen, V.-M.: Using measurements of the aerosol charging state in determination of the particle growth rate and the proportion of ion-induced nucleation, Atmos. Chem. Phys., 13, 463–486, https://doi.org/10.5194/acp-13-463-2013, 2013.
Manninen, H. E., Nieminen, T., Riipinen, I., Yli-Juuti, T., Gagné, S., Asmi, E., Aalto, P. P., Petäjä, T., Kerminen, V.-M., and Kulmala, M.: Charged and total particle formation and growth rates during EUCAARI 2007 campaign in Hyytiälä, Atmos. Chem. Phys., 9, 4077–4089, https://doi.org/10.5194/acp-9-4077-2009, 2009a.
Manninen, H., Petäjä, T., Asmi, E., Riipinen, N., Nieminen, T., Mikkilä, J., Hõrrak, U., Mirme, A., Mirme, S., Laakso, L., Kerminen, V.-M., and Kulmala, M.: Long-term field measurements of charged and neutral clusters using Neutral cluster and Air Ion Spectrometer (NAIS), Boreal Environ. Res., 14, 591–605, 2009b.
Manninen, H. E., Mirme, S., Mirme, A., Petäjä, T., and Kulmala, M.: How to reliably detect molecular clusters and nucleation mode particles with Neutral cluster and Air Ion Spectrometer (NAIS), Atmos. Meas. Tech., 9, 3577–3605, https://doi.org/10.5194/amt-9-3577-2016, 2016.
Mazon, S. B., Kontkanen, J., Manninen, H. E., Nieminen, T., Kerminen, V.-M., and Kulmala, M.: A long-term comparison of nighttime cluster events and daytime ion formation in a boreal forest, Boreal Env. Res., 21, 242–261, 2016.
Merikanto, J., Spracklen, D. V., Mann, G. W., Pickering, S. J., and Carslaw, K. S.: Impact of nucleation on global CCN, Atmos. Chem. Phys., 9, 8601–8616, https://doi.org/10.5194/acp-9-8601-2009, 2009.
Mirme, S. and Mirme, A.: The mathematical principles and design of the NAIS – a spectrometer for the measurement of cluster ion and nanometer aerosol size distributions, Atmos. Meas. Tech., 6, 1061–1071, https://doi.org/10.5194/amt-6-1061-2013, 2013.
Nieminen, T., Asmi, A., Maso, M. D., Aalto, P. P., Keronen, P., Petäjä, T., Kulmala, M., and Kerminen, V.-M.: Trends in atmospheric new-particle formation: 16 years of observations in a boreal-forest environment, Boreal Environ. Res., 19, 191–214, 2014.
Paasonen, P., Nieminen, T., Asmi, E., Manninen, H. E., Petäjä, T., Plass-Dülmer, C., Flentje, H., Birmili, W., Wiedensohler, A., Hõrrak, U., Metzger, A., Hamed, A., Laaksonen, A., Facchini, M. C., Kerminen, V.-M., and Kulmala, M.: On the roles of sulphuric acid and low-volatility organic vapours in the initial steps of atmospheric new particle formation, Atmos. Chem. Phys., 10, 11223–11242, https://doi.org/10.5194/acp-10-11223-2010, 2010.
Pörtner, H. O., Roberts, D. C., Poloczanska, E. S., Mintenbeck, K., Tignor, M., Alegría, A., Craig, M., Langsdorf, S., Löschke, S., Möller, V., and Okem, A.: IPCC, 2022: summary for policymakers, in: Climate change 2022: Impacts, adaptation, and vulnerability: contribution of working group II to the sixth assessment report of the intergovernmental panel on climate change. Cambridge, UK and New York, NY, US, 3–33 pp., https://doi.org/10.1017/9781009325844.001, 2022.
Quaas, J., Jia, H., Smith, C., Albright, A. L., Aas, W., Bellouin, N., Boucher, O., Doutriaux-Boucher, M., Forster, P. M., Grosvenor, D., Jenkins, S., Klimont, Z., Loeb, N. G., Ma, X., Naik, V., Paulot, F., Stier, P., Wild, M., Myhre, G., and Schulz, M.: Robust evidence for reversal of the trend in aerosol effective climate forcing, Atmos. Chem. Phys., 22, 12221–12239, https://doi.org/10.5194/acp-22-12221-2022, 2022.
Rose, C., Zha, Q., Dada, L., Yan, C., Lehtipalo, K., Junninen, H., Mazon, S. B., Jokinen, T., Sarnela, N., Sipilä, M., Petäjä, T., Kerminen, V.-M., Bianchi, F., and Kulmala, M.: Observations of biogenic ion-induced cluster formation in the atmosphere, Sci. Adv., 4, eaar5218, https://doi.org/10.1126/sciadv.aar5218, 2018.
Rosenfeld, D., Andreae, M. O., Asmi, A., Chin, M., de Leeuw, G., Donovan, D. P., Kahn, R., Kinne, S., Kivekäs, N., Kulmala, M., Lau, W., Schmidt, K. S., Suni, T., Wagner, T., Wild, M., and Quaas, J.: Global observations of aerosol-cloud-precipitation-climate interactions, Rev. Geophys., 52, 750–808, https://doi.org/10.1002/2013RG000441, 2014.
Schobesberger, S., Junninen, H., Bianchi, F., Lönn, G., Ehn, M., Lehtipalo, K., Dommen, J., Ehrhart, S., Ortega, I. K., Franchin, A., Nieminen, T., Riccobono, F., Hutterli, M., Duplissy, J., Almeida, J., Amorim, A., Breitenlechner, M., Downard, A. J., Dunne, E. M., Flagan, R. C., Kajos, M., Keskinen, H., Kirkby, J., Kupc, A., Kürten, A., Kurtén, T., Laaksonen, A., Mathot, S., Onnela, A., Praplan, A. P., Rondo, L., Santos, F. D., Schallhart, S., Schnitzhofer, R., Sipilä, M., Tomé, A., Tsagkogeorgas, G., Vehkamäki, H., Wimmer, D., Baltensperger, U., Carslaw, K. S., Curtius, J., Hansel, A., Petäjä, T., Kulmala, M., Donahue, N. M., and Worsnop, D. R.: Molecular understanding of atmospheric particle formation from sulfuric acid and large oxidized organic molecules, P. Natl. Acad. Sci. USA, 110, 17223–17228, https://doi.org/10.1073/pnas.1306973110, 2013.
Sihto, S.-L., Mikkilä, J., Vanhanen, J., Ehn, M., Liao, L., Lehtipalo, K., Aalto, P. P., Duplissy, J., Petäjä, T., Kerminen, V.-M., Boy, M., and Kulmala, M.: Seasonal variation of CCN concentrations and aerosol activation properties in boreal forest, Atmos. Chem. Phys., 11, 13269–13285, https://doi.org/10.5194/acp-11-13269-2011, 2011.
Spracklen, D. V., Carslaw, K. S., Merikanto, J., Mann, G. W., Reddington, C. L., Pickering, S., Ogren, J. A., Andrews, E., Baltensperger, U., Weingartner, E., Boy, M., Kulmala, M., Laakso, L., Lihavainen, H., Kivekäs, N., Komppula, M., Mihalopoulos, N., Kouvarakis, G., Jennings, S. G., O'Dowd, C., Birmili, W., Wiedensohler, A., Weller, R., Gras, J., Laj, P., Sellegri, K., Bonn, B., Krejci, R., Laaksonen, A., Hamed, A., Minikin, A., Harrison, R. M., Talbot, R., and Sun, J.: Explaining global surface aerosol number concentrations in terms of primary emissions and particle formation, Atmos. Chem. Phys., 10, 4775–4793, https://doi.org/10.5194/acp-10-4775-2010, 2010.
Tammet, H. and Kulmala, M.: Simulation tool for atmospheric aerosol nucleation bursts, J. Aerosol Sci., 36, 173–196, https://doi.org/10.1016/j.jaerosci.2004.08.004, 2005.
Tammet, H., Hõrrak, U., Laakso, L., and Kulmala, M.: Factors of air ion balance in a coniferous forest according to measurements in Hyytiälä, Finland, Atmos. Chem. Phys., 6, 3377–3390, https://doi.org/10.5194/acp-6-3377-2006, 2006.
Tammet, H., Komsaare, K., and Hõrrak, U.: Intermediate ions in the atmosphere, Atmos. Res., 135–136, 263–273, https://doi.org/10.1016/j.atmosres.2012.09.009, 2014.
Tuovinen, S., Lampilahti, J., Kerminen, V.-M., and Kulmala, M.: Dataset for Measurement report: Ion clusters as indicator for local new particle formation (Version 1), Zenodo [data set], https://doi.org/10.5281/zenodo.8059335, 2023.
Wagner, R., Manninen, H. E., Franchin, A., Lehtipalo, K., Mirme, S., Steiner, G., Petäjä, T., and Kulmala, M.: On the accuracy of ion measurements using a Neutral cluster and Air Ion Spectrometer, Boreal Env. Res., 21, 230–241, 2016.
Virkkula, A., Hirsikko, A., Vana, M., Aalto, P. P., Hillamo, R., and Kulmala, M.: Charged particle size distributions and analysis of particle formation events at the Finnish Antarctic research station Aboa, Boreal Env. Res., 12, 397–408, 2007.
Yan, C., Yin, R., Lu, Y., Dada, L., Yang, D., Fu, Y., Kontkanen, J., Deng, C., Garmash, O., Ruan, J., Baalbaki, R., Schervish, M., Cai, R., Bloss, M., Chan, T., Chen, T., Chen, Q., Chen, X., Chen, Y., Chu, B., Dällenbach, K., Foreback, B., He, X., Heikkinen, L., Jokinen, T., Junninen, H., Kangasluoma, J., Kokkonen, T., Kurppa, M., Lehtipalo, K., Li, H., Li, H., Li, X., Liu, Y., Ma, Q., Paasonen, P., Rantala, P., Pileci, R. E., Rusanen, A., Sarnela, N., Simonen, P., Wang, S., Wang, W., Wang, Y., Xue, M., Yang, G., Yao, L., Zhou, Y., Kujansuu, J., Petäjä, T., Nie, W., Ma, Y., Ge, M., He, H., Donahue, N. M., Worsnop, D. R., Kerminen, V.-M., Wang, L., Liu, Y., Zheng, J., Kulmala, M., Jiang, J., and Bianchi, F.: The Synergistic Role of Sulfuric Acid, Bases, and Oxidized Organics Governing New-Particle Formation in Beijing, Geophys. Res. Lett., 48, e2020GL091944, https://doi.org/10.1029/2020GL091944, 2021.
Yu, H., Kaufman, Y. J., Chin, M., Feingold, G., Remer, L. A., Anderson, T. L., Balkanski, Y., Bellouin, N., Boucher, O., Christopher, S., DeCola, P., Kahn, R., Koch, D., Loeb, N., Reddy, M. S., Schulz, M., Takemura, T., and Zhou, M.: A review of measurement-based assessments of the aerosol direct radiative effect and forcing, Atmos. Chem. Phys., 6, 613–666, https://doi.org/10.5194/acp-6-613-2006, 2006.