the Creative Commons Attribution 4.0 License.
the Creative Commons Attribution 4.0 License.
 | 27 May 2025
Multi-seasonal measurements of the ground-level atmospheric ice-nucleating particle abundance on the North Slope of Alaska
Aidan D. Pantoya
Stephanie R. Simonsen
Elisabeth Andrews
Ross Burgener
Christopher J. Cox
Gijs de Boer
Bryan D. Thomas
Atmospheric ice-nucleating particles (INPs) are an important subset of aerosol particles that are responsible for the heterogeneous formation of ice crystals. INPs modulate the arctic cloud phase (liquid vs. ice), resulting in implications for radiative feedbacks. The number of arctic INP studies investigating specific INP episodes or sources increased recently. However, existing studies are based on short-duration field data, and long-term datasets are lacking. Continuous, long-term measurements are key to determining the abundance and variability of ambient arctic INPs and constraining aerosol–cloud interactions, e.g., to verify and/or improve simulations of mixed-phase clouds. Here, we present a new long-duration INP dataset from the Arctic: 2 years of predominantly immersion-mode INP concentrations (nINP) measured continuously at the National Oceanic and Atmospheric Administration's Barrow Atmospheric Baseline Observatory (BRW) on the North Slope of Alaska. A portable ice nucleation experiment chamber (PINE-03), which simulates adiabatic expansion cooling, was used to directly measure the ground-level INP abundance with an approximately 12 min time resolution from October 2021 to December 2023. We document PINE-03 nINP measurements as well as estimated ice nucleation active surface site density (ns) over a wide range of heterogeneous freezing temperatures from −16 to −31 °C from which we introduce new season-specific parameterizations suitable for modeling mixed-phase clouds. Collocated aerosol and meteorological data were analyzed to assess the correlation between ambient nINP, air mass origin region, and meteorological variability. Our findings suggest (1) very high freezing efficiency of INPs across the measured temperatures (ns ≈ 2×10⁸–1010 m−2 for −16 to −31 °C), which is a factor of 10–1000 times greater efficiency as compared to that found in the previous mid-latitude INP measurements in fall using the same instrument; (2) surprisingly high nINP (≥ 1 L−1 at −25 °C) for the examined temperatures throughout the year that were not measured by PINE-03 at other sites; and (3) high nINP in spring, possibly related to arctic haze episodes. Relatively low concentrations of aerosol surface area and contrasting high-INP concentrations at BRW relative to mid-latitude sites are the possible reasons for the observed high freezing efficiency.
- Article
(5874 KB) - Full-text XML
-
Supplement
(2610 KB) - BibTeX
- EndNote


Ice formation in the atmosphere is facilitated by ice-nucleating particles (INPs) through heterogeneous freezing (Hoose and Möhler, 2012) by reducing the activation energy required to induce the release of latent heat, thereby triggering spontaneous ice growth (Vali et al., 2015). Below ≈ −35 °C, freezing of supercooled water droplets can take place homogeneously (Koop and Murray, 2016). At warmer sub-zero temperatures, several heterogeneous freezing mechanisms are important, including immersion freezing, which is the dominant ice formation pathway in mixed-phase clouds (hereafter referred to as MPCs) (Hande and Hoose, 2017; Westbrook and Illingworth, 2011).
In the Arctic, MPCs are ubiquitous, dominating features of the low-cloud fraction (Morrison et al., 2012) and radiative balance (e.g., Shupe and Intrieri, 2004). They are observed under a variety of conditions and in all seasons (e.g., Shupe, 2011; Shupe et al., 2010, 2013). INPs can act as cloud-destroying agents in MPCs. For example, model sensitivity studies indicate that MPC lifetime is strongly sensitive to INP concentration (nINP) (Solomon et al., 2018) despite the fact that nINP is several orders of magnitude smaller than concentrations of cloud condensation nuclei (CCN) (Lee et al., 2024; Mamouri and Ansmann, 2016). The forcing and feedback mechanisms associated with aerosols and clouds remain uncertain (Kanji et al., 2017; Solomon et al., 2009). Murray et al. (2021) postulate that, in the Arctic, MPCs could decrease due to positive feedback with atmospheric INPs, supported by reduced snow and ice coverage enhancing INP emissions from exposed terrestrial surfaces or even thermokarst landforms (Barry et al., 2023).
Arctic INPs have been reported in several past studies, in particular from the North Slope of Alaska (NSA), as summarized in Appendix A. Fountain and Ohtake (1985) found a mean INP abundance of ≈ 0.2 L−1 at −20 °C at the surface there from August 1978 to April 1979. Prenni et al. (2007) measured a similar nINP from aircraft, with a mean of ≈ 0.2 L−1 in deposition and condensation freezing modes over ≈ −8 to −28 °C. Elevated nINP values (up to ≈ 40 L−1) were measured in the temperature range between ≈ −14 and −30 °C during the aircraft measurements along the NSA coast by Sanchez-Marroquin et al. (2023). While the authors found the INP source identification to be challenging (i.e., terrestrial, permafrost, maritime, biogenic, and/or a combination of any), their complementary aerosol particle composition and back-trajectory results implied that local and remote emissions and sinks of INP played an important role in the nINP variability.
Several aircraft-based studies documented that a greater nINP leads to more ice in arctic clouds. For example, Rogers et al. (2001) reported a mean nINP of up to 57 L−1 in the examined temperature range between −10 and −30 °C during May 1998. High INPs in the NSA region were reported in a more recent research vessel study in the Chukchi Sea (Inoue et al., 2021). Based on offline freezing assay analysis, the authors measured up to ≈ 100 L−1 in the temperature range between −7.5 and −29.5 °C. The observed high-INP abundance during cold-air outbreak events was attributed to ocean mixing and the associated sea spray emission of ice nucleation active organic substances. Over land, INP studies report ambient mineral dust to be a significant source of arctic INPs. For instance, high-INP episodes were also seen in an Iceland study (> 100 L−1 at −26 °C; Sanchez-Marroquin et al., 2020) and southern Alaska (≈ 6 L−1 at −26 °C; Barr et al., 2023), suggesting the importance of high-latitude dust and other local terrestrial INP sources.
In contrast, Creamean et al. (2018b) reported a lower nINP at Oliktok Point, Alaska, about 250 km ESE of Utqiaġvik (formerly known as Barrow), Alaska. During March–May 2017, they measured nINP up to ≈ L−1 for aerosol particles in the diameter range between 0.15 and 12 µm over the examined freezing temperatures. Creamean et al. (2018a, b) also found that the composition of aerosols from their study region varied, but it typically included terrestrial and/or maritime materials. Their source analysis postulates that bubble bursting and bacteria or fragments of marine organisms can act as the INP source from ice-free open water. Similarly, a ship-based study examining sea spray aerosol as the INP source over the central Bering Sea in summer 2012 found low abundance of up to ≈ L−1 from −12 to −20 °C (DeMott et al., 2016). Low ambient nINP has been found in arctic regions farther from Alaska too. Creamean et al. (2022) reported < 0.1 L−1 at −25 °C during the Multidisciplinary drifting Observatory for the Study of Arctic Climate (MOSAiC) expedition in the central Arctic (September 2019–October 2020). Similar to the MOSAiC finding, the offline freezing assay performed by Welti et al. (2020, W20 hereafter) showed a nINP(−28 °C) of 0.2 L−1 from the PS 106 arctic expedition in the vicinity of Svalbard, Norway (May–July 2017). Continental dust in winter and marine biota from ice-free open water in summer were identified as the potential INP sources (Creamean et al., 2022; Irish et al., 2019a, b; Creamean et al., 2019, C19 hereafter).
Compiling eight previous INP studies from Alaskan, Canadian, and European arctic regions covering a wide range of freezing temperatures, Wilbourn et al. (2023) summarized abundance as spanning 7 orders of magnitude (≈ 10−5 to 70 L−1). Because the INP abundance is so variable and most data thus far have been limited to brief campaigns, it is important to develop and analyze INPs statistically based on continuous, long-term, and finely resolved measurements (Murray et al., 2021). This study reports on seasonality in the abundance of INPs activated at conditions relevant to mixed-phase clouds (predominantly immersion mode) using a single instrument, the Portable Ice Nucleation Experiment (PINE) chamber version 03 (PINE-03 hereafter). PINE-03 was installed on the NSA near Utqiaġvik for multi-seasonal INP monitoring. In addition to a statistical analysis of nINP, we combine the measurements with observatory data there to construct a parameterization for heterogeneous freezing efficiencies of ambient aerosols (i.e., nINP scaled to aerosol abundance).
2.1 Study site and period
Observations were made at the National Oceanic and Atmospheric Administration (NOAA) Barrow Atmospheric Baseline Observatory (71.32° N, 156.61° W; “BRW” hereafter), ∼ 6 km northeast of the town of Utqiaġvik. Our observing period began in October 2021 and continued until May 2024 as the field component of Examining INP at NSA (ExINP-NSA), covering nearly 32 months. Here, we utilize data acquired from mid-October 2021 through December 2023. We note that any data gaps pertain to the PINE-03 system maintenance, as required every 3–4 months (see Wilbourn et al., 2024; Sect. S5 in the Supplement). The maintenance was also conducted immediately after we observed and flagged the PINE-03 operational issues. The most common problems include an OPC malfunction, diaphragm pump filter replacement, or LabView data acquisition console disconnection. During ExINP-NSA, we rarely observed such issues (41 out of 1506 operations, 2.7 %), and PINE-03 ran reliably with scheduled maintenance periods. Operational flagging was assessed every cycle during measurements.
Although measurements at BRW are made over open tundra, there are large lagoons and numerous lakes in the vicinity, and the Arctic Ocean is less than 3 km to the north and east. Because of its proximity to these bodies of water and the prevailing easterlies from the Beaufort Sea, BRW is perhaps best characterized as having an arctic maritime climate modulated by nearby sea ice conditions, but it is also influenced by episodic atmospheric advection from the North Pacific (e.g., Cox et al., 2012, 2017). The BRW observatory was chosen for ExINP-NSA to collocate with NOAA's atmospheric baseline measurements, which include aerosol optical, microphysical, and chemical properties as well as meteorology. To complement the current BRW capabilities, we experimentally characterized INP abundance in association with the physicochemical properties of ambient aerosols. The findings are described throughout Sect. 3. BRW is equipped with well-characterized laminar flow stack inlets, and the air intake is about 12 m above ground level (a.g.l., Andrews et al., 2019). Moreover, at the beginning of the field campaign, we conducted a complementary characterization of aerosol transmission efficiency through the inlet, and the result is reported in Sect. S1. No corrections for particle losses or sampling conditions are applied to any aerosol data used in this report (see Sect. S1).
2.2 INP concentration measurement
The PINE-03 system measures ambient nINP in situ using a simulated adiabatic expansion cooling method (Möhler et al., 2021). This system is a commercialized product, resulting in consistent operation amongst studies (Möhler et al., 2021; Knopf et al., 2021; Lacher et al., 2024; Wilbourn et al., 2024) compared to traditional INP monitoring devices, which are typically custom-built by individual scientists. Besides a relatively high measurement time resolution (less than or equal to 12 min), the advantages of PINE-03 include (1) no substantial artifacts (e.g., no ice off the vessel wall), (2) remote operation capability with minimum in-person maintenance or supervision requirements, and (3) fast turnover times to scan freezing temperatures in a wide range (Wilbourn et al., 2024).
The PINE-03 system operates by a combination of “flush”, “expansion”, and “refill” modes cycling approximately every 5–12 min. In the flush mode, ambient air is actively dried through a set of two Perma Pure dryers and is injected into the 10 L volume chamber with a flow rate of 2 L m−1 for 10 min. In the subsequent expansion mode, sample gas temperature and pressure are reduced with a 3 L min−1 pump flow rate to 800 hPa in the vessel to supersaturation with respect to both ice and water. This simulated adiabatic expansion typically lasts about 1 min and triggers ice nucleation if INPs are present in the sample. An optical particle counter (OPC; fidas-pine; Palas GmbH) deployed downstream of the chamber then detects particles exiting the chamber. Based on the optical size (typically > 10 µm in diameter), ice crystals can be separated from other particles (i.e., interstitial aerosols and/or water droplets) and counted as predominantly immersion-mode INPs. In the refill mode, filtered air is injected into the chamber for approximately 1 min to precondition the vessel for the next run cycle.
To harmonize datasets collected with different time intervals, the INP dataset was processed by averaging over 6 h and synchronized to the same timescales following the previous PINE-03 study led by Wilbourn et al. (2024). In our typical chamber operation, the air gas set-point temperature is changed between −10 and −31 °C. The time resolution of such a temperature ramp was approximately 2 h, and thereby the 6 h time-averaged PINE-03 data represent nINP from three temperature ramps. A single PINE-03 “operation” typically lasts 1 d until daily maintenance is performed. Therefore, a set of multiple temperature ramps was acquired daily. PINE-03 was cleaned daily by flushing filtered ambient dry air through the chamber until no particles were detected. We followed other long-term chamber maintenance protocols as described in Wilbourn et al. (2024).
The highest freezing temperature for detecting INPs at NSA was −10.4 °C, based on the original data acquisition time resolution. The PINE-03 system has a temperature uncertainty of ±1.5 °C. The total effective sampling volume is a combination of the chamber size, the number of sampling cycles that are averaged, and the pressure to which the chamber is filled. A detection limit of PINE-03 is 0.2 L−1 for individual expansion, which corresponds to a single INP detection per air volume assessed in a single expansion (≈ 3.4 L on average), and 0.02 L−1 on a 6 h time average basis, allowing summed air volume assessment specific to the ExINP-NSA conditions. With this detection limit, a temperature-dependent Poisson error analysis was carried out in the field, which verified the statistical validity of the PINE-03 data below −16 °C (see Sect. S2). Nonetheless, due to this upper temperature limit, we note that observed INPs do not necessarily represent INPs in near-surface clouds. Further details of the working principle of the PINE-03 system, together with its calibration protocol and data, can be found in Möhler et al. (2021) and Wilbourn et al. (2024).
2.3 Aerosol data
2.3.1 Aerosol number concentration
Aerosol number concentrations (naer) were measured at BRW with a condensation particle counter (CPC; model 3010, TSI Inc.). The naer was used to indicate the total aerosol particle abundance over the study period and to compute the INP-activated fraction (IAF = ). In addition, another CPC (model 3772, TSI Inc.) was operated at the adjacent U.S. Department of Energy (DOE) Atmospheric Radiation Measurement (ARM) program site as part of the NSA Aerosol Observing System. Both the 3010 and 3772 CPCs have a 10 nm minimum cut size. Over our ≈ 2-year study period, a similar naer was measured by the BRW CPC (median of 156.3 cm−3) and the ARM CPC (179.0 cm−3) for non-screened datasets. Although the BRW CPC reads slightly lower than the ARM CPC based on 6 h time-averaged medians, the Pearson correlation coefficient, r, between two CPC datasets is high (r ≈ 0.9). All naer presented here are from the BRW CPC. To make all data from instruments that have different sampling times comparable, all online datasets discussed in this study were averaged over 6 h periods.
2.3.2 Surface area concentration
We estimate the aerosol surface area concentration (Saer) at volume standard temperature and pressure (273.15 K and 1013.25 hPa) using aerosol scattering coefficients measured by an integrating nephelometer (Model 3563, TSI Inc.). Aerosol scattering coefficients from the nephelometer are reported in units of inverse megameters (Mm−1). The application of nephelometer data to calculate the aerosol surface areas has been demonstrated in prior studies under marine conditions (DeMott et al., 2016; Wilbourn et al., 2024). Aerosol scattering coefficients at three wavelengths (450, 550, and 700 nm) were continuously measured by the nephelometer, which was operated under low-humidity conditions (< 40 % relative humidity). Saer values are computed by scaling aerosol scattering coefficients at 450 nm () by a factor of 4 and normalizing the scaled number to Q using the following equation (Moore et al., 2022):
where Q is an effective aerosol scattering efficiency. The annual average coarse-mode (i.e., PM10–PM1) Q value of 2.37 (±0.04 standard deviation) derived under clean marine conditions at El Arenosillo, Spain, is considered a representative Q and is used in this study. More details are discussed in Sect. S3. We use Saer to assess the particle surface area and to compute the ice nucleation active surface site density ns(T) = .
2.3.3 Black carbon mass concentration
Black carbon mass concentration (mBC) was estimated for the PM10 size range based on the Continuous Light Absorption Photometer (CLAP, Ogren et al., 2017). The CLAP is a filter-based instrument that uses Beer's law to relate the change in optical transmission through a filter caused by particle deposition to the light absorption coefficient of deposited particles. Aerosol absorption coefficients from the CLAP are also reported (Mm−1). Measured mass absorption cross-sectional values for freshly generated black carbon fall within a relatively narrow range of 7.5 ± 1.2 m2 g−1 at 550 nm (Bond et al., 2013). This assumption of uniform aerosol composition may introduce uncertainties in information derived from CLAP data, which represents a limitation of this study, as few natural aerosol populations have uniform composition. Here, mBC (ng m−3) was estimated by dividing the absorption at 528 nm by the estimated mass-absorbing cross section of 7.5 m2 g−1 (Zheng et al., 2018; Bond et al., 2013).
2.3.4 Particle sulfate and nitrate mass concentration
Ambient mass concentrations of major arctic haze tracers, such as non-sea-salt (nss) SO and aerosol NO, were measured using filter samples of atmospheric aerosols collected at BRW for subsequent ion analysis (Quinn et al., 2002, 2000, 1998). We calculated the nss particle sulfate mass concentration by relating the total SO ion mass concentration to the mass concentration of reference species, such as sodium, in seawater (Keene et al., 1986). While both submicron and supermicron particle data are available, supermicron data availability had a very limited temporal resolution (minimum 7 d, maximum 28 d). Therefore, we used the submicron dataset to represent arctic haze tracers. It is worth noting that submicron SO and NO were the predominant contributors to the total mass of the submicron ions (a factor of 4–5 more compared to the supermicron mass, where sea salt is the dominant species) for periods when both datasets were available. We also note that the sampling resolutions of these offline ion analysis data are much longer than 6 h (minimum 24 h, maximum 96 h), and the sampling interval varied with the season. Therefore, the 6 h time-averaging protocol was not applied for these offline data, and we report the ion concentration data at their native time resolution. The filter measurements only sample when air is coming from the clean air sector (see the next section).
2.3.5 Aerosol data flagging
NOAA's aerosol data protocol flags data as contaminated when the measured wind direction (WD) is aligned with the town of Utqiaġvik (i.e., 130° < WD < 360°). Thus, aerosol data from the wind direction of Utqiaġvik are flagged automatically. The clean air sector at BRW is to the east (0°< WD < 130°). The full flagging method is described in Sheridan et al. (2016). Briefly, in addition to the wind direction criterion, CPC spikes, notable contamination identified by instrument mentors, and abnormally low wind speed time periods are considered in the flagging algorithm. This method is consistent across NOAA observatories and varies only by clean air sector definition. NOAA provides flagging information for the aerosol data for every minute. NOAA's aerosol data flagging was synchronized to the PINE-03 data acquisition interval.
At BRW, easterly winds and emissions from the Prudhoe Bay oil field can impact measurements (Kolesar et al., 2017; Creamean et al., 2018b). However, the oil field is located ≈ 300 km east of Utqiaġvik. Because we cannot easily segregate Prudhoe Bay emissions from other local emissions, data coinciding with easterly winds are not flagged in this study. Although mBC could be used as a proxy for potential oil field emissions only when the wind is from the clean sector (Sect. 3.2 and Fig. 3), this could also be due to recirculation of air masses containing emissions from the nearby community of Utqiaġvik.
2.3.6 Meteorological and air mass data
The local meteorology, including wind speed, wind direction, temperature, and relative humidity, was from BRW (see the “Data availability” section). We used temperature data at 10 m a.g.l., which is nearest to the stack inlet height. For comparison with INP data, which are collected at different timescales, meteorological datasets were also averaged over 6 h time periods. Visibility and time-averaged cumulative precipitation observations are not made at BRW but are reported at Wiley Post–Will Rogers Memorial Airport (ICAO: PABR) (71.285° N, 156.769° W) located ∼ 7 km southwest of our field site.
3.1 Meteorology
Figure 1 displays meteorological data collected at BRW and their seasonality from 19 October 2021 to 31 December 2023. The overall median temperature during our study period was −7.7 °C. There is a pronounced seasonality in temperature, with a summer maximum of 19.7 °C and a winter minimum of −37.2 °C. The median relative humidity (with respect to water) measured at BRW was 84.2 %. Particularly in winter, the air is typically near saturation or supersaturation with respect to ice.
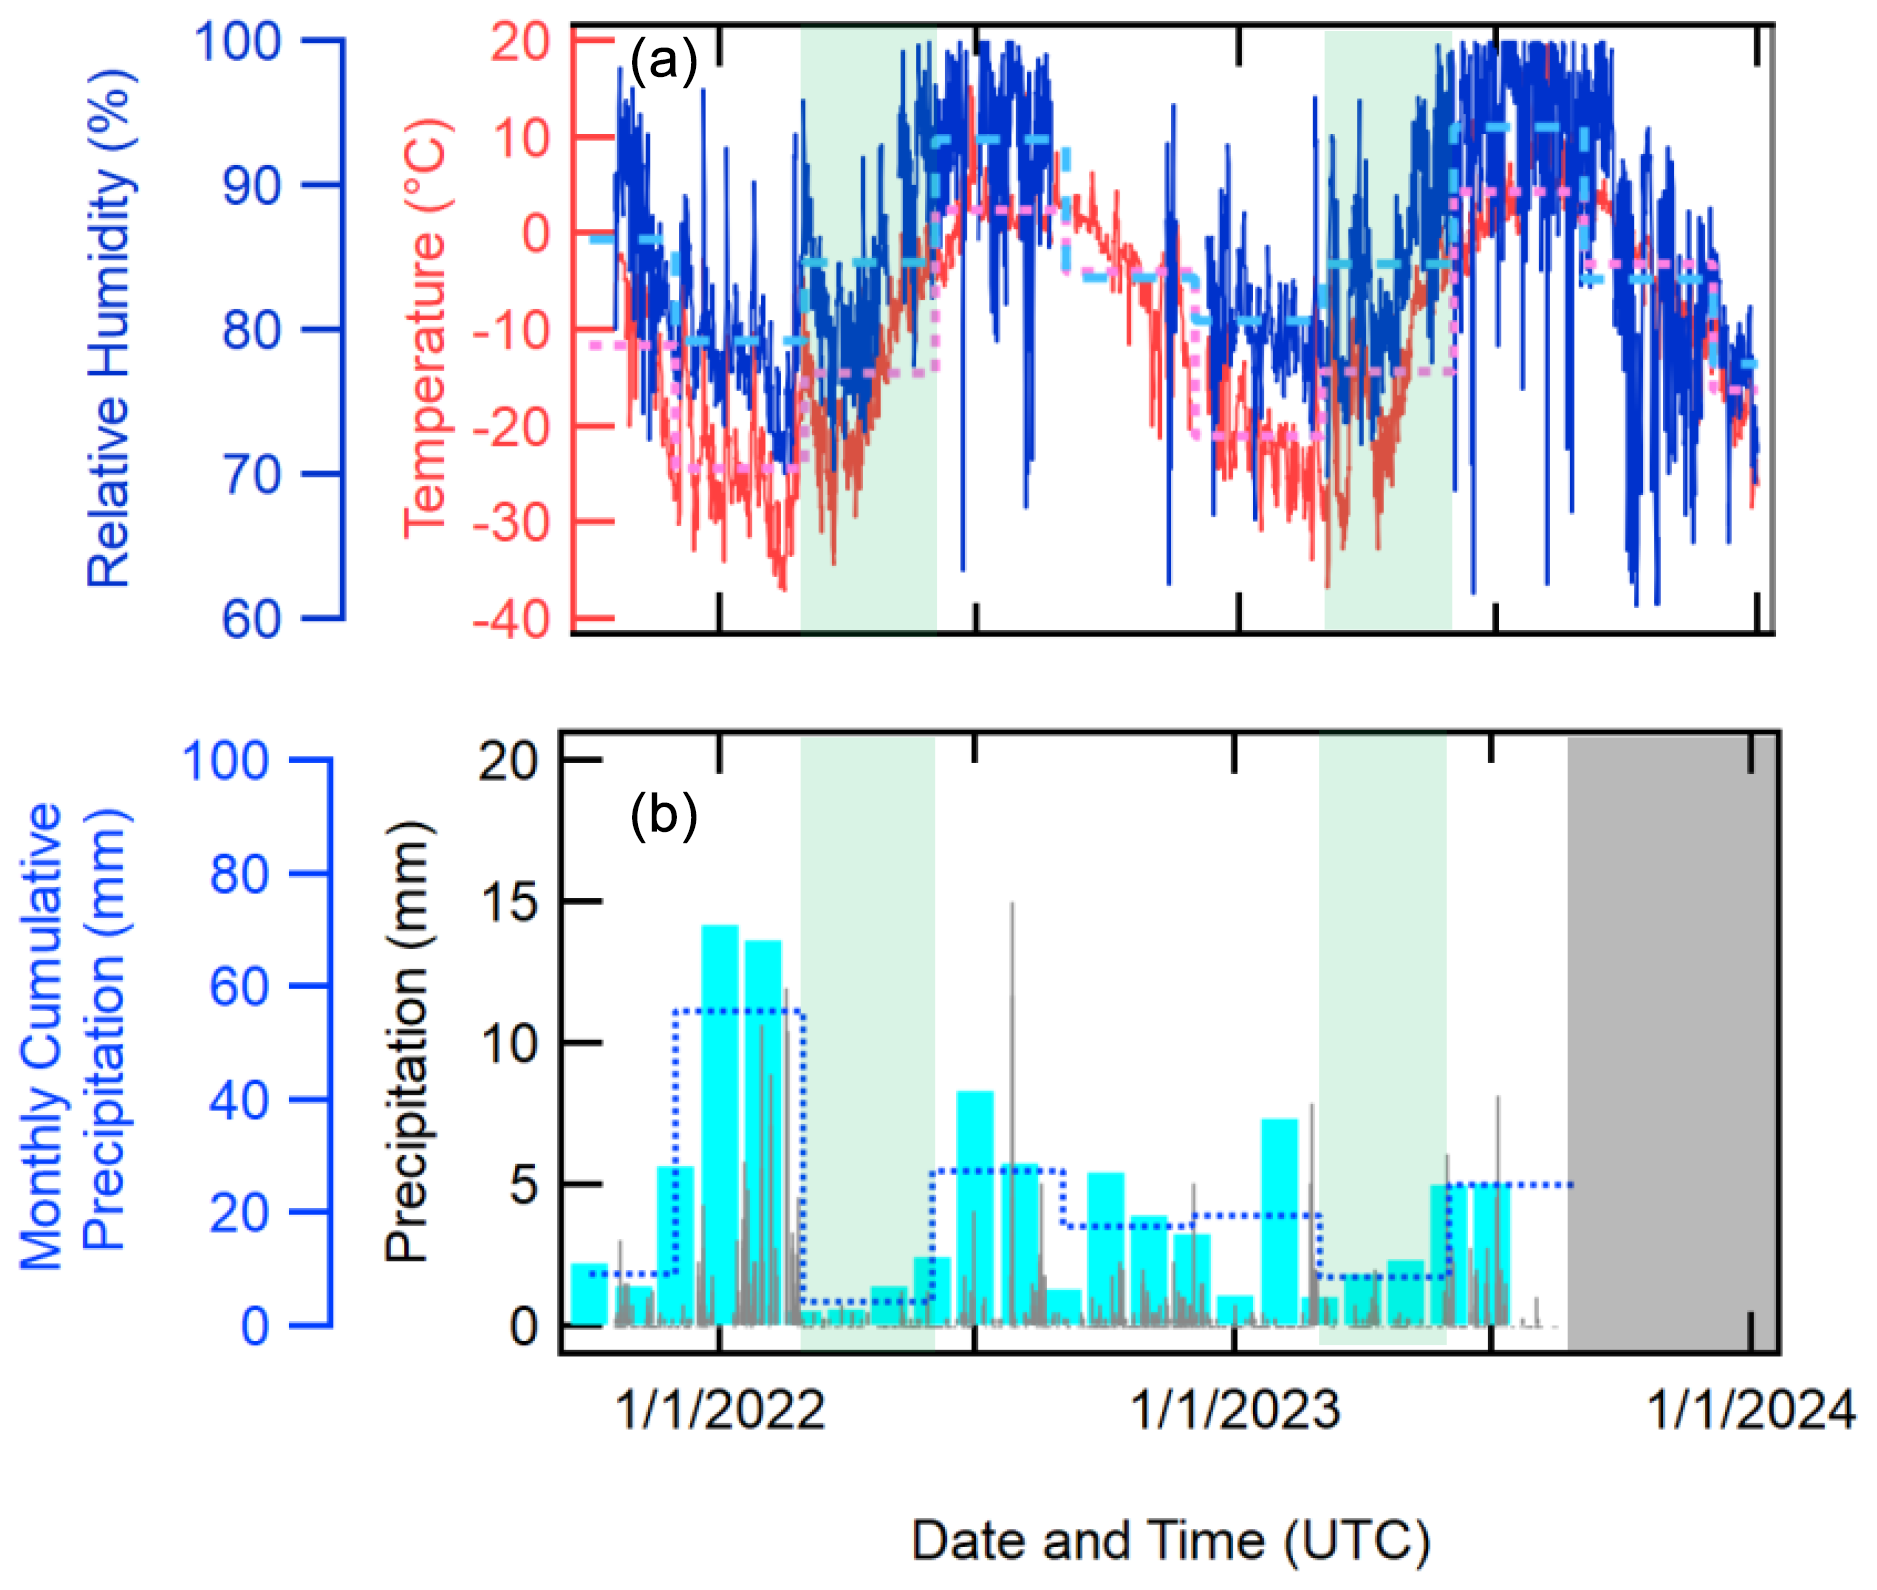
Figure 1The time series of the 6 h average temperature and relative humidity (a). Panel (b) displays the 6 h average precipitation and monthly cumulative precipitation amounts. The dashed lines in each panel are the mean seasonal values of individual measurements, and the green-shaded areas represent spring. Precipitation data from mid-August 2023 were not available, which is indicated by the grey-shaded area. The relative humidity data from late August to early December 2022 are also missing.
The seasonal average of measured visibility during our study ranged from 6.9 to 8.4 km without any distinct seasonal patterns. Both the lowest and highest average visibilities were measured in winter (low in 2022 and high in 2023). It is noteworthy that the 6 h time-averaged visibility fluctuated throughout 2021–2023. The observed visibilities (not shown) are seasonally consistent but occasionally variable, implying a strong influence of localized events, such as blowing dust, blowing snow, haze, fog, and sea spray (e.g., Chen et al., 2022; Quinn et al., 2007; DeMott et al., 2016).
Seasonal wind roses (6 h time-averaged) are plotted in Fig. 2. The median annual wind speed (± standard error) at BRW was 5.2 ± 1.6 m s−1. During fall–winter, the seasonal average wind speed ranged from 6.4 m s−1 (September–October–November; SON) to 5.6 m s−1 (December–January–February; DJF). During spring–summer, the seasonal average wind speed was similar (5.2 m s−1). The maximum wind speed of 18.6 m s−1 was measured in November 2023. Although there was variability in the wind direction measured at BRW, northeasterly winds prevailed as expected throughout the study period, which is predominantly from the clean air sector upwind of nearby settlements.
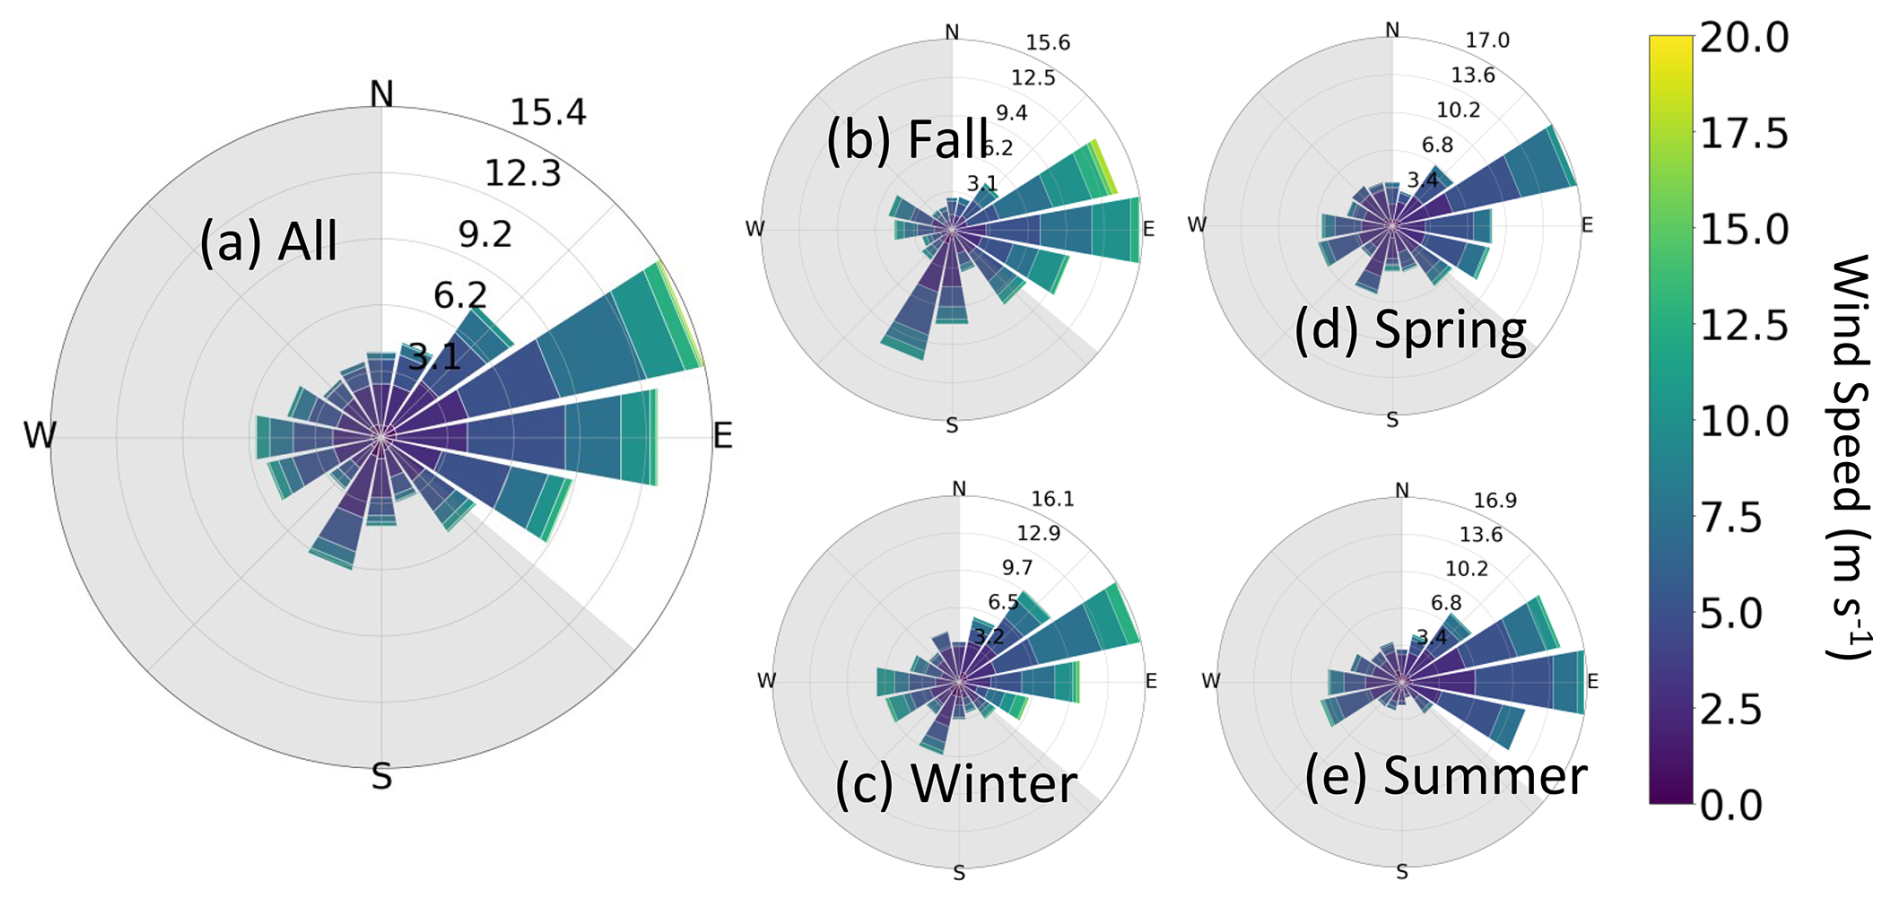
Figure 2The wind speed and direction distributions during ExINP-NSA (October 2021–December 2023) are shown in the wind rose plot (a). The color scale of the wind roses represents the wind speed observed at ground level (11 m a.s.l.). Panels (b)–(e) show the wind roses for the different seasons: fall (b), winter (c), spring (d), and summer (e). The grey-shaded area represents the flagged wind direction (130° < WD < 360°), indicating potential contamination from the nearby community of Utqiaġvik.
The median value of the monthly cumulative precipitation (± standard error) measured at the BRW site was 14.2 ± 4.1 mm. As seen in Fig. 1c, biannual maxima of measured precipitation in winter (37.6 mm) and summer (26.4 mm) were found in 2021–2023; the lowest amount of precipitation occurred in spring (mean 6.6 mm).
3.2 Aerosol abundance
Figure 3 shows time series plots of naer and Saer, black carbon mass, and submicron ion mass concentrations of arctic haze tracers. The total naer (cm−3, shown with black dots) is plotted at 6 h time-averaged intervals. The overall median naer (± standard error) during October 2021–December 2023 was 156.3 ± 8.1 cm−3, while the seasonal average naer was highest in summer (589.1 ± 54.2 cm−3) and lowest in winter (227.2 ± 18.9 cm−3). On average, spring also exhibited a relatively high naer of 431.4 ± 44.0 cm−3, implying an influence of arctic haze (Quinn et al., 2007). Seasonal averages from this study are consistent with a long-term trend of monthly geometric means of condensation nuclei measured at BRW from 1977 to 1994 with an annual cycle of typical summer maxima and winter minima (Polissar et al., 1999).
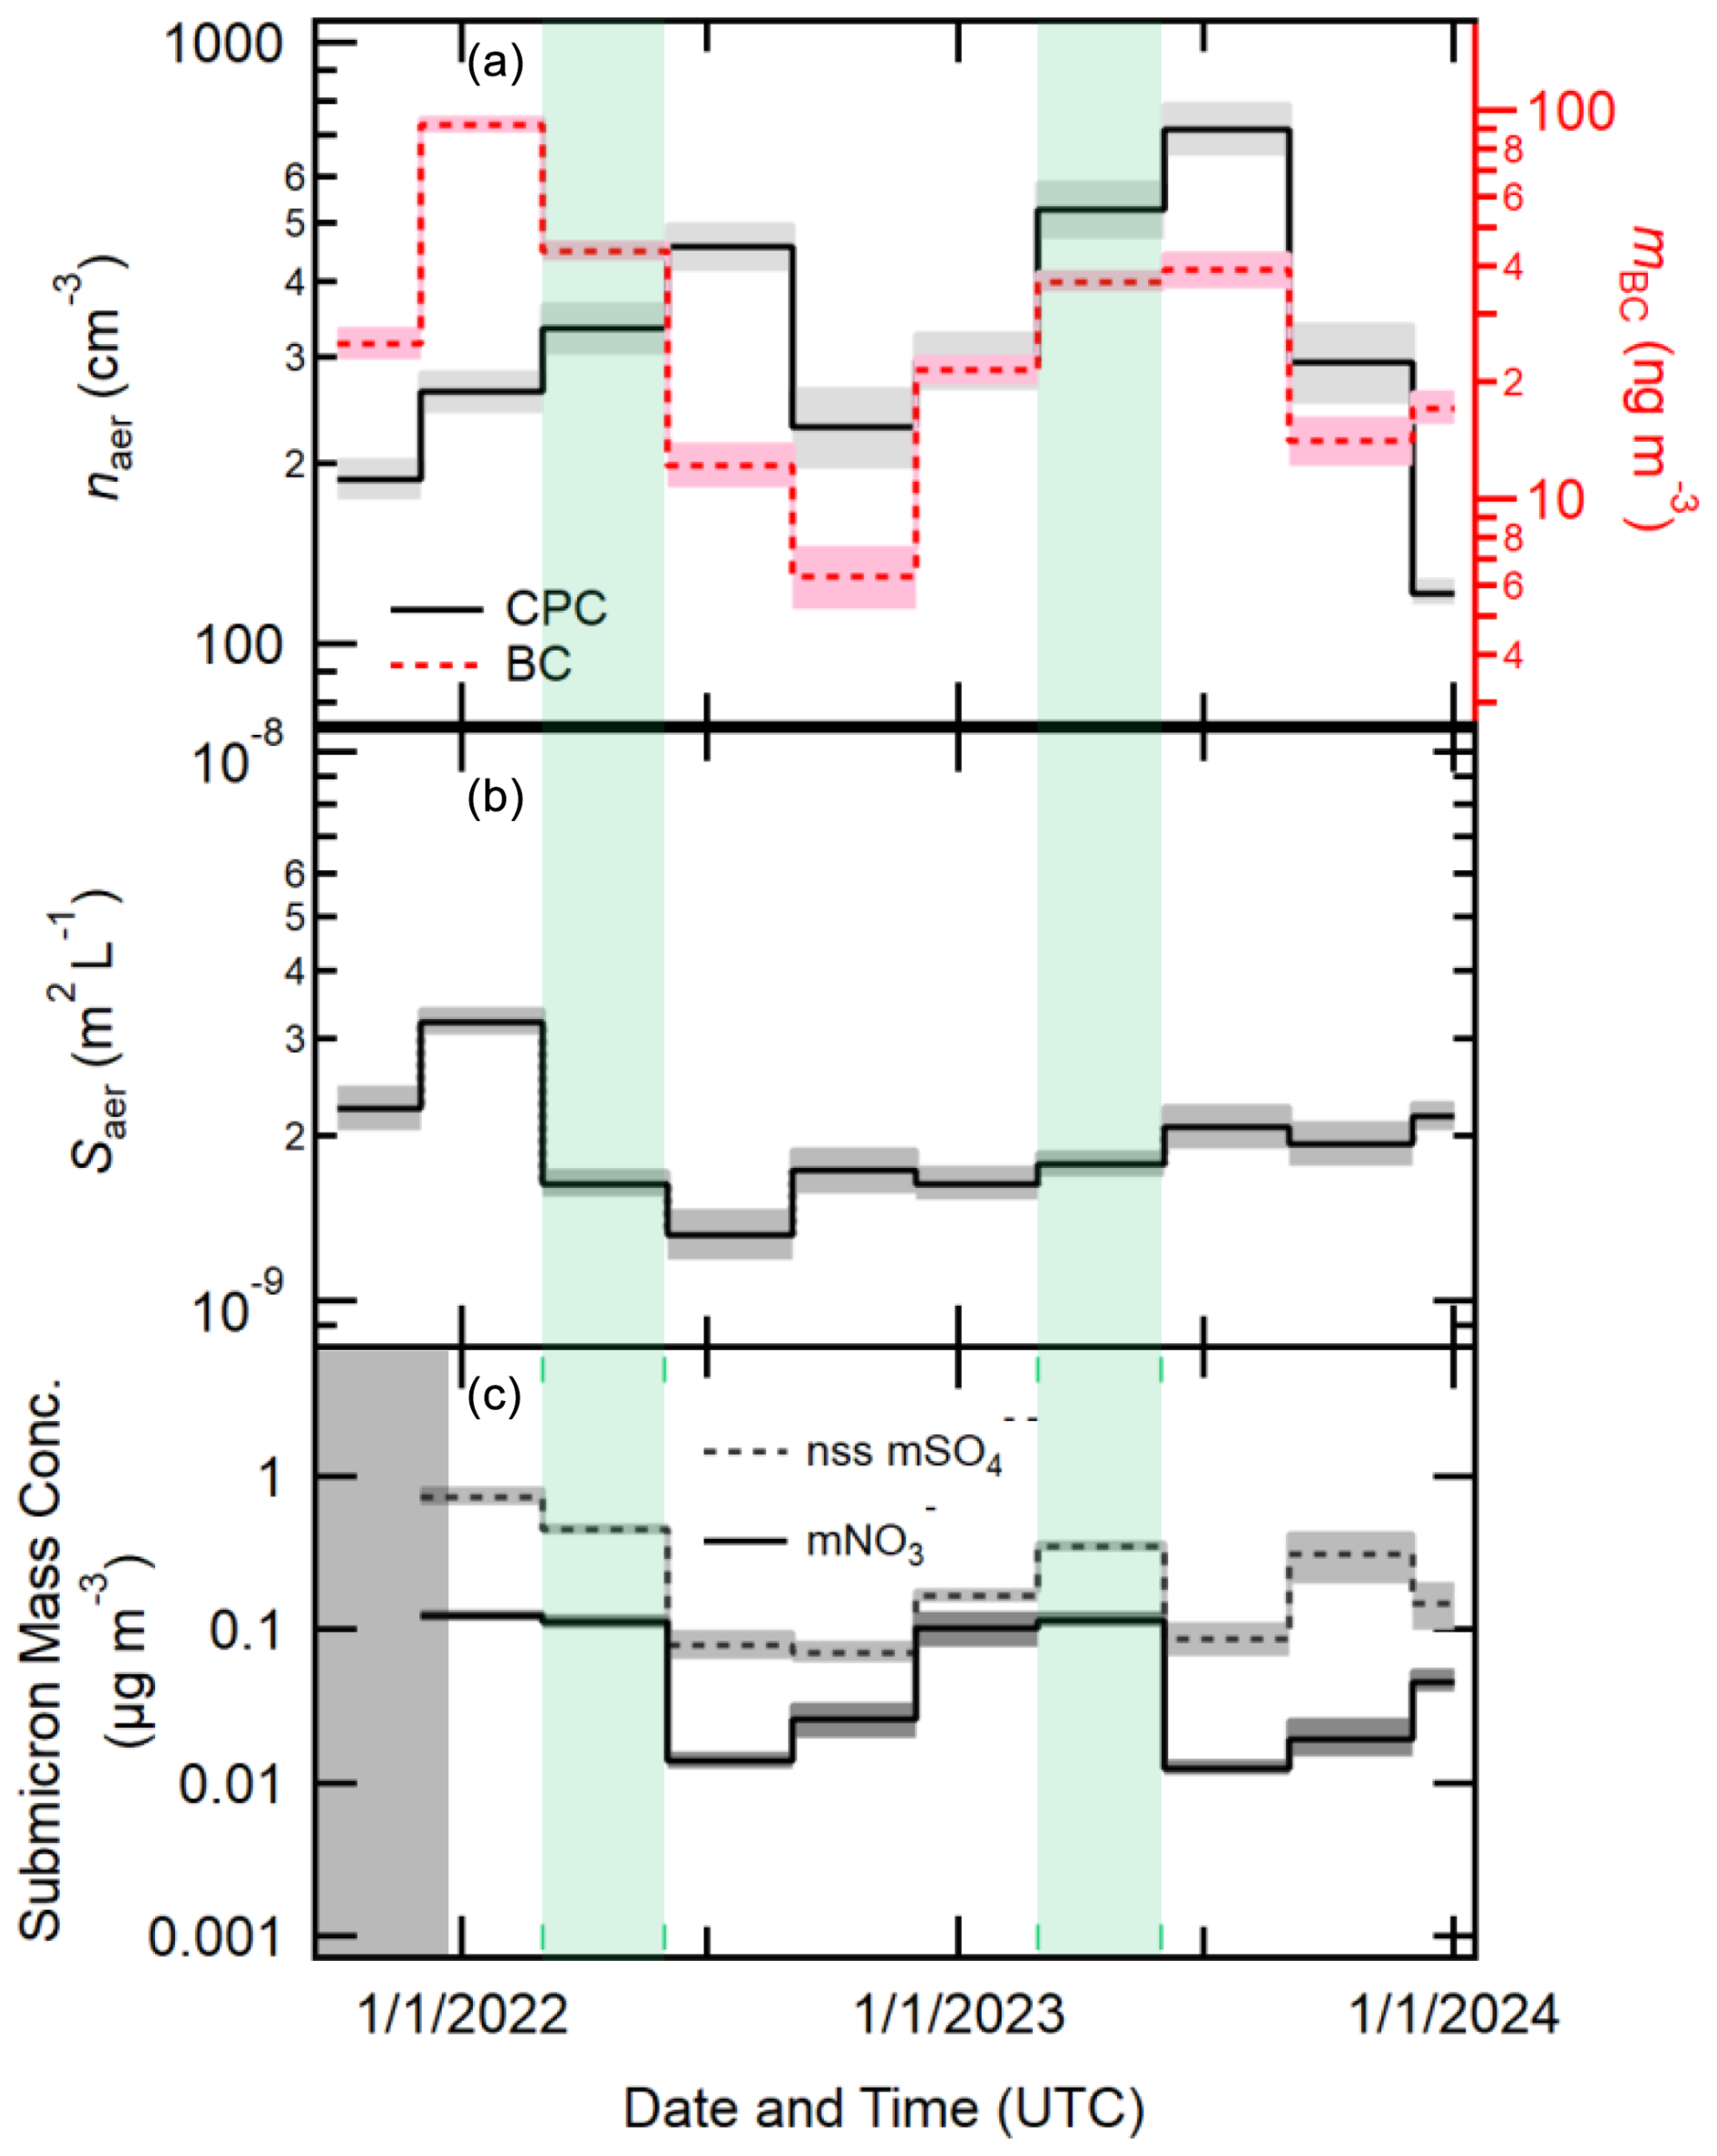
Figure 3The seasonal average total particle concentration (naer, cm−3, black line) and the mass concentration of black carbon (mBC, ng m−3, red line) (a). The time series of the seasonal average total surface area concentration (Saer, m2 L−1) (b). Submicron NO and nss SO ion mass concentrations (c). The shaded areas in panels (a) and (b) represent the standard errors of each measurement. The uncertainties in panel (c) are reported in the chemical data. The grey-shaded area shows the data-missing period, and the green-shaded area shows the Arctic spring during our study periods.
Estimated mBC values are also shown in Fig. 3a. With a median ± standard error value of 13.2 ± 3.4 ng m−3, a strong winter maximum is apparent (up to 92.2 ± 3.9 ng m−3), consistent with previous reports of the seasonality of absorbing aerosol at BRW (e.g., Polissar et al., 1999; Delene and Ogren, 2002; Schmeisser et al., 2018). The highest mBC was also observed during spring with ∼ 40 ng m−3 on average. Previously, Barrett and Sheesley (2017) reported a peak elemental carbon (EC) mass concentration (mEC) of ∼ 100 ng m−3 measured at the ARM-NSA facility in February 2013. The authors identified fossil fuel combustion via transport as a significant source of ambient organic carbons, accounting for > 60 % of mass, during their year-round study period from the summer of 2012. Moffett et al. (2022) measured low mEC near Utqiaġvik during summer, suggesting biomass burning and wildfire contribution as a minor source of EC.
The median Saer (± standard error) at BRW was ± m2 L−1. Seasonal variability in Saer is shown in Fig. 3b, with seasonal average maxima and minima found in winter 2021 (DJF; ± m2 L−1) and summer 2022 (JJA; ± m2 L−1), respectively. The estimated median single-particle surface area (i.e., ) from BRW (< 0.02 µm2) is substantially smaller than at ARM's Southern Great Plains (SGP; 1.4 µm2) and Eastern North Atlantic (ENA; 0.05 µm2) observatories, as derived from Wilbourn et al. (2024), suggesting a predominance of small particles at BRW. We note that Saer is derived by means of nephelometer measurements at both BRW and ENA. In situ coarse aerosol size distribution measuring instruments, such as an optical particle counter and an aerosol particle sizer, were not operational during any of our campaigns.
The minimum and maximum ranges of nss SO and NO at BRW are 0.003–2.2 and 0.005–1.2 µg m−3, respectively, during our field study. Clear seasonal cycles were found for arctic haze tracers, including nss SO and NO (Fig. 3c). With a median mass concentration of 0.2 ± 0.02 µg m−3, the maximum mass concentration of nss SO was found in spring on average (0.4 ± 0.03 µg m−3). Likewise, NO had the highest seasonal average of 0.1 ± 0.01 µg m−3 in spring. The observed spring maxima and seasonality in particulate nss sulfate and nitrate mass concentrations can primarily be attributed to the long-range transport of arctic haze (Quinn et al., 2007). We also note that, because these aerosol composition values are for submicron soluble aerosol, these chemistry measurements may not directly relate to INPs, as INPs preferentially involve insoluble supermicron particles (e.g., Mason et al., 2016).
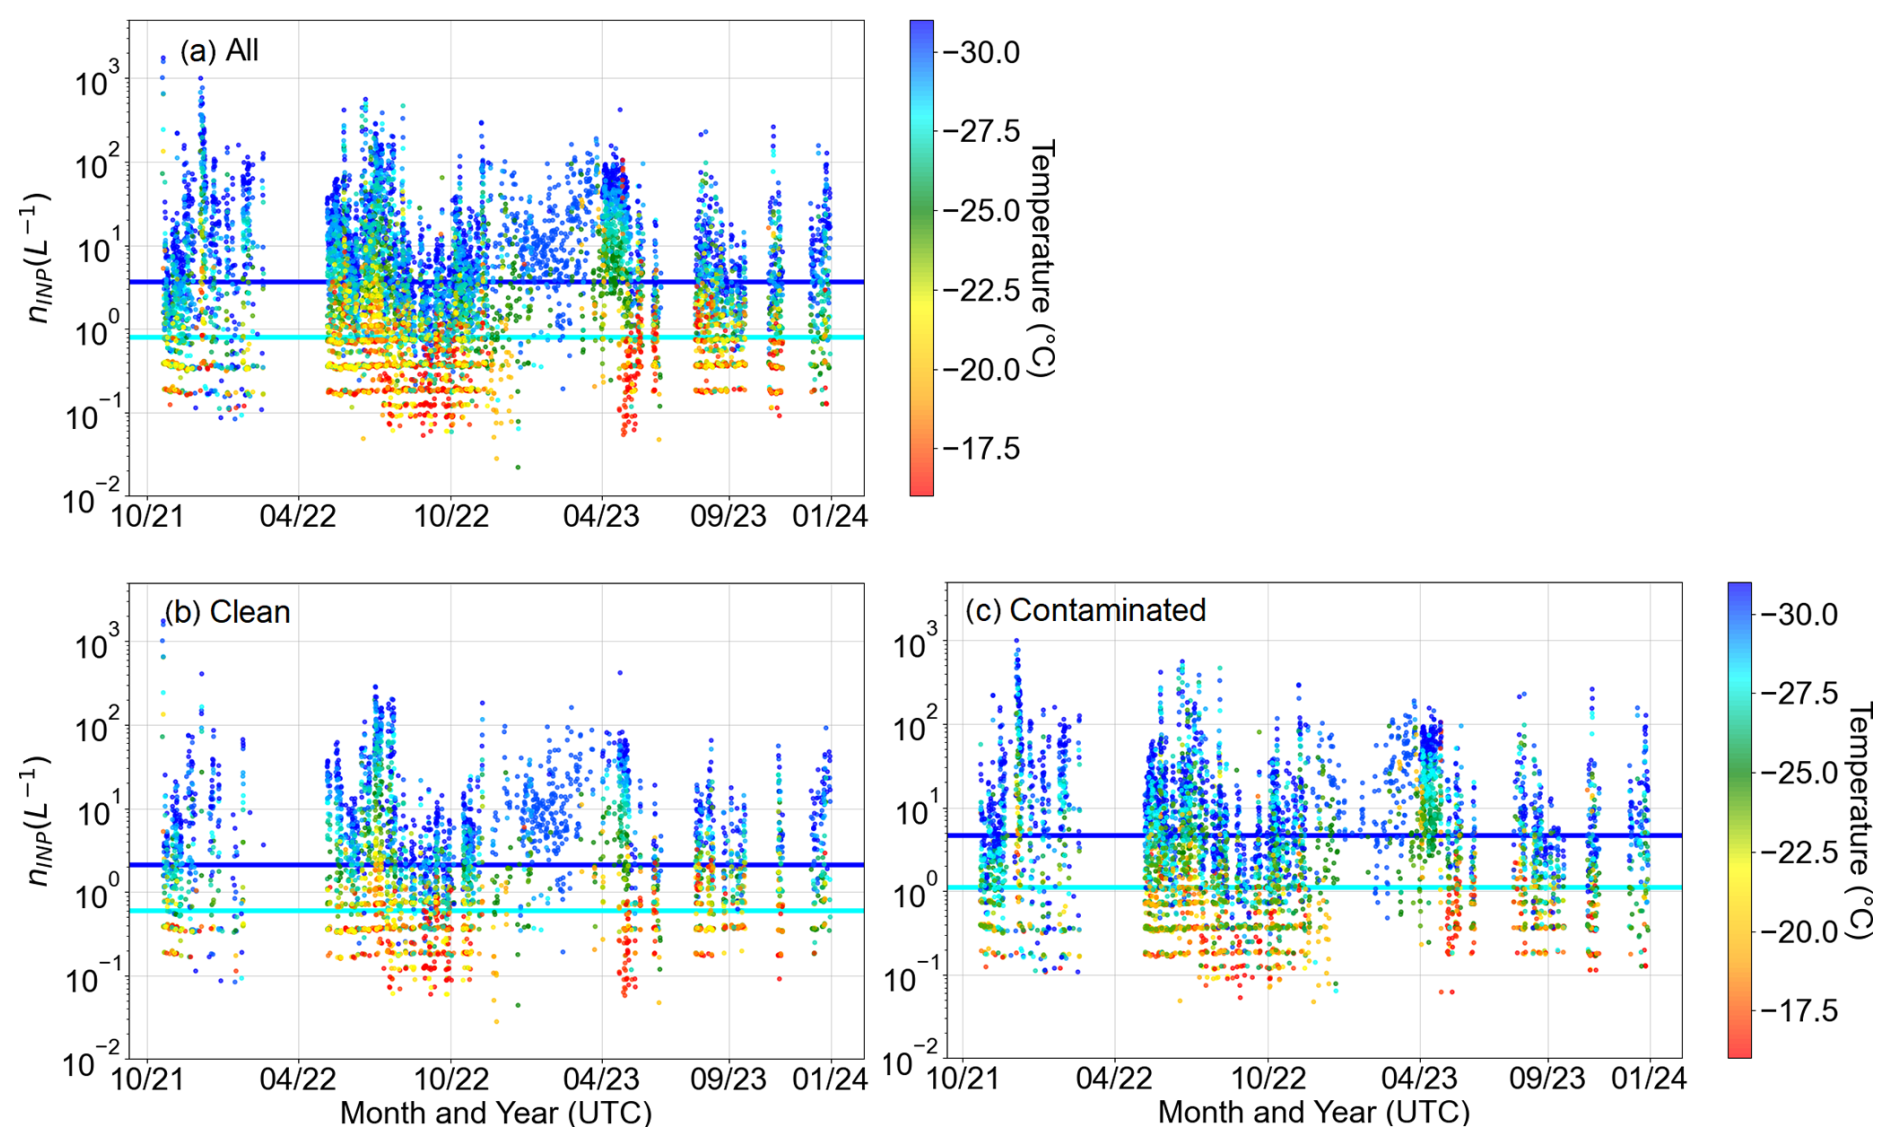
Figure 4INP concentrations (nINP(T)) measured at BRW. The “all” dataset collected throughout the campaign is shown in panel (a). The segregated datasets collected during the “clean” periods (clean data) and “contaminated” periods (presumably contaminated data) are shown in panels (b) and (c). Each point represents a 6 h time-averaged concentration. The color scale indicates the measured freezing temperature. The individual data points are temperatures binned for 1 °C. The campaign mean and median nINP(−25 °C) are shown with dark-blue and cyan lines.
3.3 Ice-nucleating particle abundance
Shown in Fig. 4 is the comparison of the online nINP(T) based on (a) the “all” dataset (i.e., all valid measurements retained), (b) the “clean” data subset as determined following the standard BRW wind protocols and removing flagged PINE-03 data for operational issues, and (c) the “contaminated” subset following the wind and PINE-03 data-screening protocols. The time series of 6 h time-averaged nINP(T) from BRW with a temperature resolution of 1 °C is shown in each panel, with different colors scaling to freezing temperature between −16 °C (red) and −31 °C (blue). For the “all” dataset, nINP(T) data are displayed with a total of 14 318 data points of 6 h time-averaged nINP(T) collected during our study period. Data gaps in spring 2022, summer 2023, and fall 2023 seen in Fig. 4a are due to maintenance.
As shown in Fig. 4, the nINP(−25 °C) values ± standard errors are 3.6 ± 1.2, 2.1 ± 0.6, and 4.6 ± 1.5 L−1 for the all, clean, and contaminated datasets, respectively. Likewise, the medians of nINP(−25 °C) are similarly sorted, with 0.8 ± 0.4, 0.6 ± 0.2, and 1.1 ± 0.5 L−1 for the all, clean, and contaminated datasets. As anticipated, the contaminated dataset exhibited a higher mean than others, likely reflecting the influence of emissions from Utqiaġvik. The distribution of nINP(T) is skewed due to the occurrence of positive extremes. Thus, we report the median in addition to the mode.
3.4 Freezing efficiencies
Figure 5 shows the 6 h time-averaged nINP(T), IAF (i.e., ), and ns(T) (i.e., ) at selected temperatures (−20, −25, and −30 °C). A noticeable difference between nINP,all and nINP,clean is seen in Fig. 5. We observe that nINP,all exceeds nINP,clean as the all / clean ratio is typically > 1 (Fig. 5g–i). In winter, the ratio is especially high. During this time, southwesterlies, presumably contaminated by recirculated emissions from the town, contain abundant INPs. In winter 2021, the seasonal mBC of 92.2 ng m−3 is higher than the overall average mBC, which indicates the impact of Utqiaġvik emissions (e.g., fuel burning). We note that a seasonal average mBC of 21.5 ng m−3 in winter 2022 is lower than the overall average mBC, suggesting that local emissions may not have made a prominent contribution to mBC observed at BRW in winter 2022 and that BC is in part from long-range transport, as suggested by previous studies (Barrett and Sheesley, 2017; Moffett et al., 2022). High-INP abundance and freezing efficiencies not associated with local emissions were observed in spring 2023. This coincided with a large temporal change in ambient temperature and minimal seasonal precipitation (Fig. 1) as well as observed high concentrations of arctic haze tracers (Fig. 3). Hence, this high-INP episode may have been triggered by a combination of factors. Average IAFs at −20, −25, and −30 °C are similar between the all and clean datasets (–). Conversely, ns(T) exhibits a slight deviation between the two datasets, with “clean” having lower average ns(T) values of ≈ 3.2×10⁸ to ≈ 1.1×10¹⁰ m−2 than the “all” dataset (≈ 9.4×10⁸ to ≈ 1.6×10¹⁰ m−2). In order to relate our results to BRW baseline aerosol measurements and the previous literature, “clean” sector data are used for further analysis in this study.
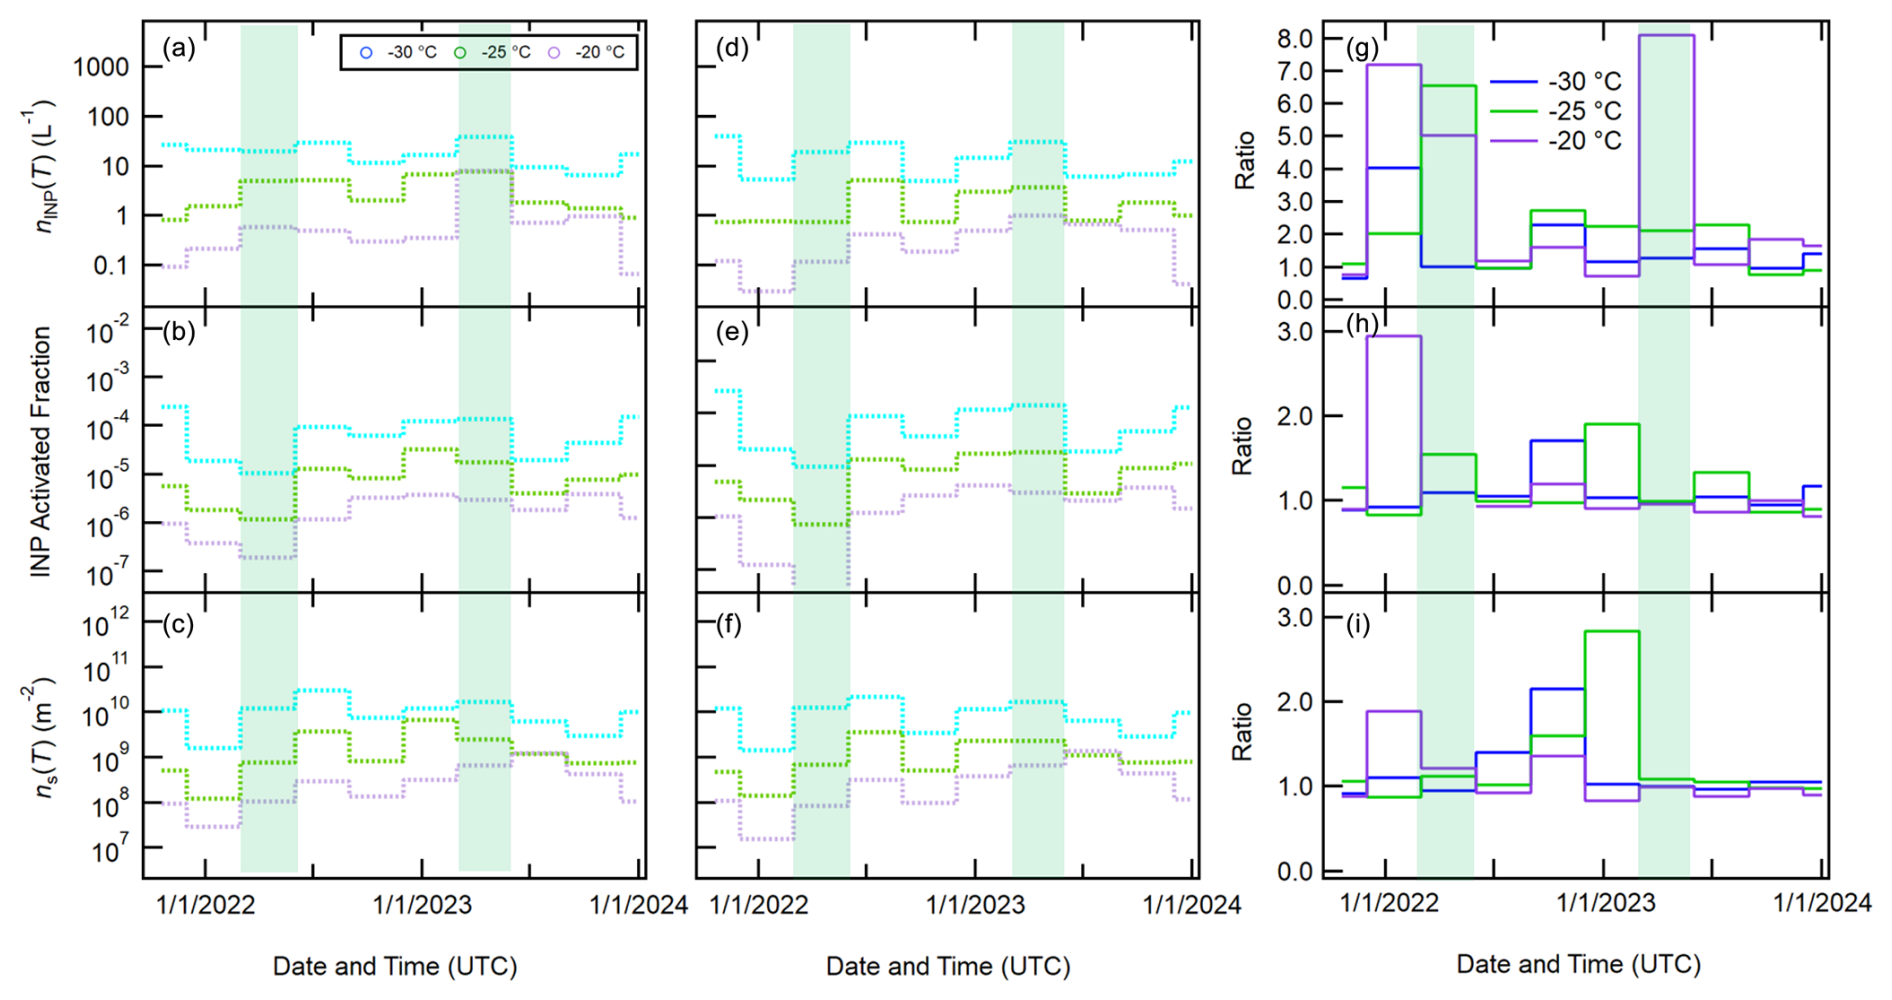
Figure 5The seasonally averaged nINP(T), IAF, and ns(T) at selected temperatures for the “all” dataset (a–c) and the screened “clean” data subset (d–f) at BRW. Panels (g)–(i) show the ratio of the all and clean data seasonally. The lines represent seasonal average values for the measured periods. The green-shaded areas represent the arctic spring periods.
A series of histograms displaying probability densities and relative frequencies of 6 h time-averaged nINP(T) and ns(T) data from PINE-03 is shown in Fig. 6, with a temperature resolution of 1 °C for BRW. The modes nINP(T) and ns(T) are reasonably comparable to our average ns(T) for data with the given bin-resolved data density (n > 224) despite some inclusion of outliers at low nINP(T) and ns(T). For the ns(T) distributions, fitted ns(T) values from this study are also superimposed onto each histogram to show reasonable agreement with the average values of the lognormal ns(T) distribution. Seasonal breakdowns of the nINP(T) and ns(T) histograms are shown in Figs. S2 and S3 in the Supplement (Sect. S4).
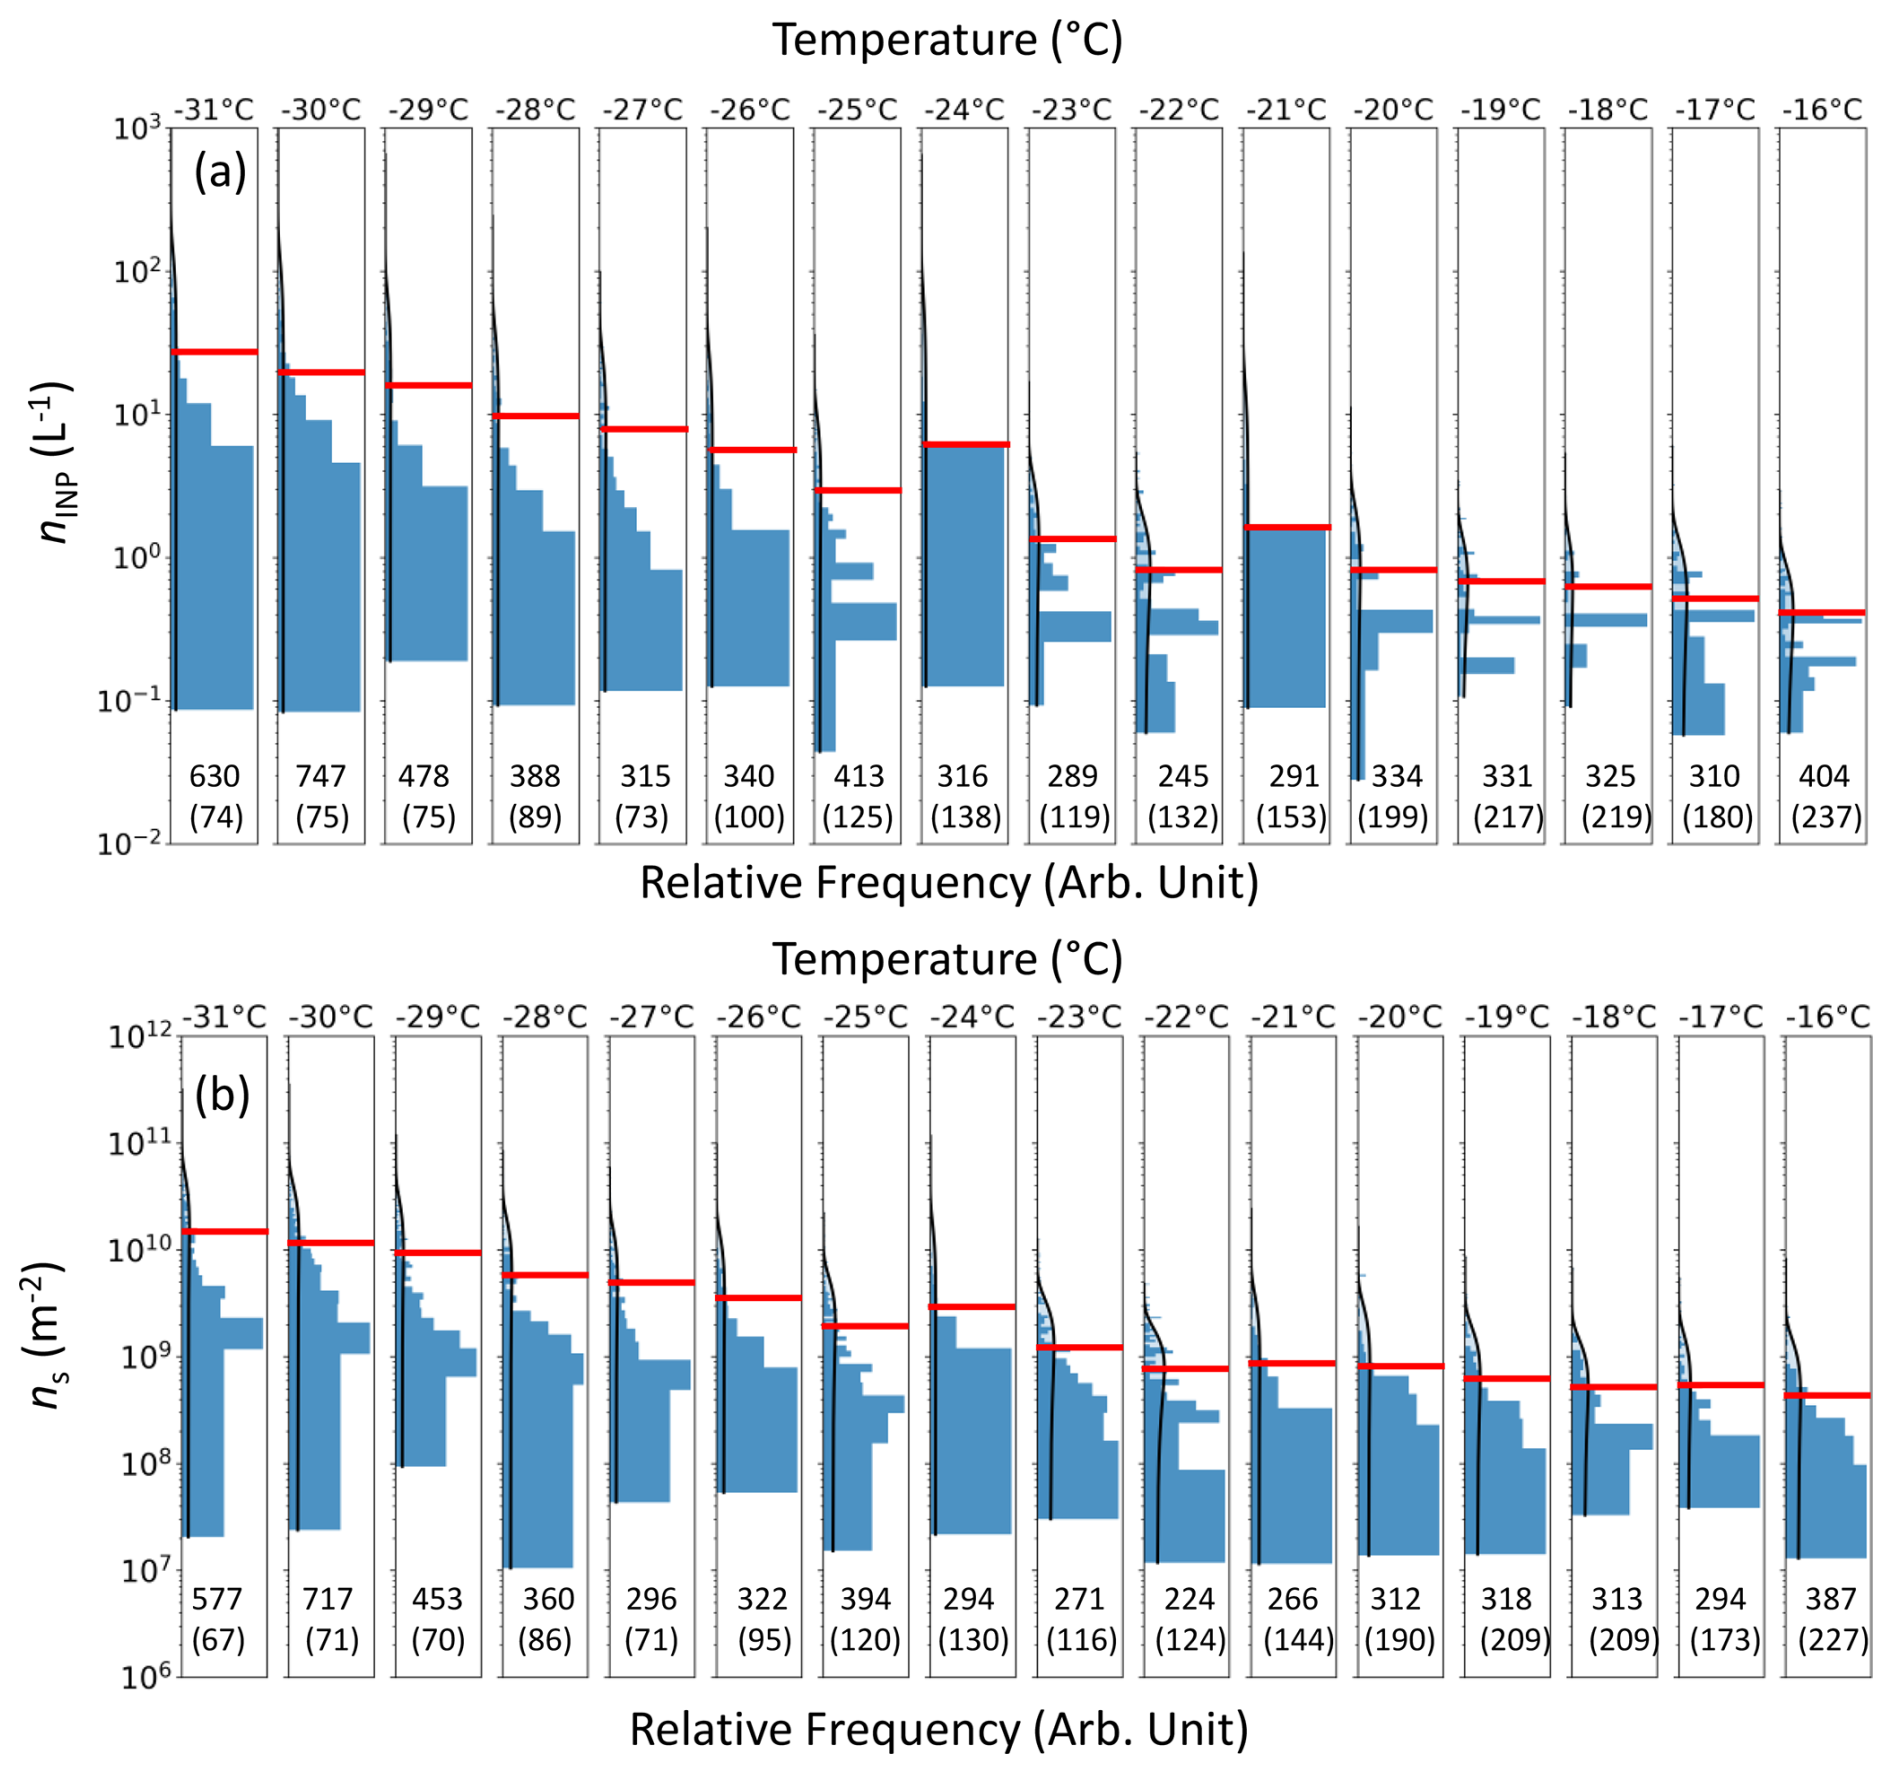
Figure 6Histograms of the PINE-03-based nINP(T) and ns(T) Gaussian distributions with 1 °C temperature binning are shown in panels (a) and (b). The “clean” data were used to generate this figure. The data cover a statistically validated freezing temperature range (−16 to −31 °C) for October 2021–December 2023. Individual data densities are shown at the bottom of each column, and zero INP number counts, included in the time-averaged nINP calculation, are shown in parentheses. Relative frequencies (arbitrary unit) for each degree are shown at the bottom of each subpanel. Red horizontal lines in each relative frequency distribution subpanel represent the average. The Gaussian lognormal fit is shown for each degree of binned data (black lines).
Figure 7 shows 6 h time-averaged PINE-03-measured nINP and ns data from BRW as a function of freezing temperatures (1 °C resolution) as boxplots (a)–(b). Clean data were used to generate Fig. 7, while Fig. S4 is based on “all” data for comparison (Sect. S5). Also shown in Fig. 7a are previously reported nINP(T) data collected from or near the North Slope of Alaska (see Sect. 1.4 and the references therein). The data collected in this study are generally comparable to data presented in Barr et al. (2023; B23), Inoue et al. (2021; I21), Sanchez-Marroquin et al. (2023; S-M23), and Prenni et al. (2007; P07) as their data overlap with our 25th–75th percentile nINP(T) data in one temperature bin at least. On the other hand, the nINP(T) range for some studies is much lower than the nINP(T) range of ExINP-NSA, potentially due to differences in INP sources that those studies investigated (e.g., sea spray aerosols without sea ice coverage). Figure 7b shows the ns(T) data as well as the associated exponential fits. Following Li et al. (2022) and Wilbourn et al. (2024), we computed ns(T) parameterizations that fit the average values of the lognormal ns(T) distribution as a function of freezing temperatures as follows:
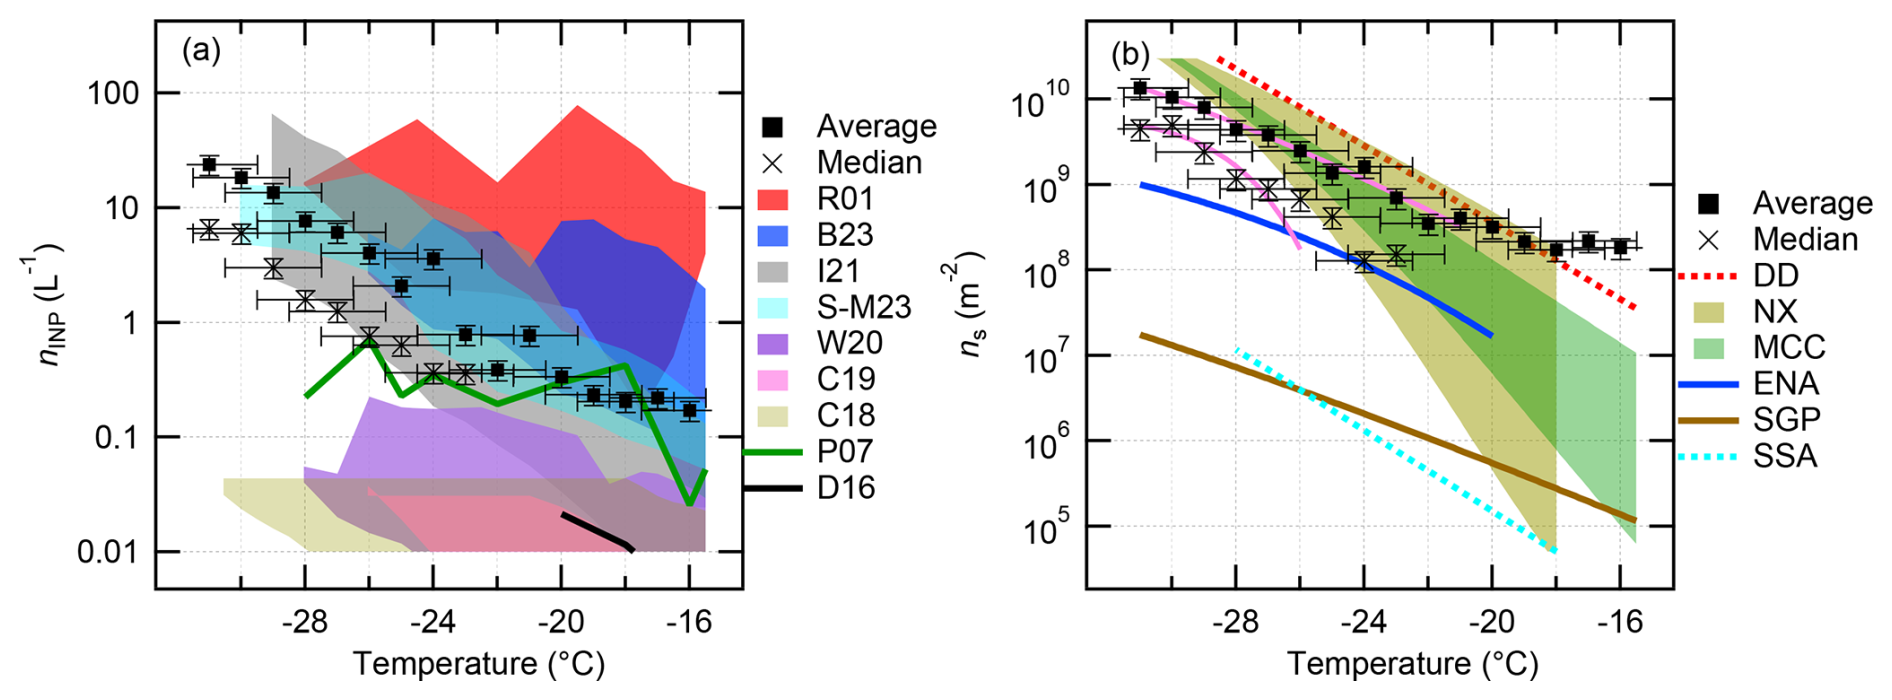
Figure 7Boxplots of the PINE-03-based nINP(T) (a) and ns(T) (b) data from BRW in 1° temperature bins for a statistically validated freezing temperature range (−16 to −31 °C). The “clean” data were used to generate this figure. The boxes represent the average (black solid symbol) and median (black cross symbol) statistics. The color-shaded area in panel (a) shows the maximum and minimum nINP(T) measured by previous INP studies at or in the proximity of BRW (see Table A1 and Sect. 1 for references). The reference ns(T) data in panel (b) are adopted from W24 (Wilbourn et al., 2024, and references therein) for SGP, ENA, desert dust, sea spray aerosol, illite NX, and microcrystalline cellulose. The pink lines are fits to the BRW data from this study. The uncertainties in nINP(T) and ns(T) are also adopted from W24.
The parameterization offered in this study is limited to ≤ −21 °C. Below −21 °C, a constant increase in ns(T) towards low freezing temperatures is seen, whereas a plateau of high ns(T) is found between −21 and −16 °C, at which our INP data are validated within errors discussed in Sect. S2. However, we cautiously note that the flattening of the concentrations warmer than −21 °C is a spurious result, mainly due to the instrument resolution. As described in Sect. 2.2, the minimum resolvable INP value is 0.02 L−1 on a 6 h time average, but the non-time-averaged minimum nINP detection limit is in fact ∼ 0.2 L−1. This floor approximately intersects a plateau region where the data remain remarkably steady near −20 °C (i.e., close to the beginning of the flattening). We would expect a loss of sensitivity to result in an undercounting of values, as mostly 0 s is averaged into data. Nevertheless, it appears likely that the flattening is a consequence of the resolution floor of the system and its operational configuration at BRW.
The comparison between the ns(T) data from this study and the reference spectra shown in Fig. 7b reveals that ice nucleation efficiencies of aerosols collected at ground level at BRW are equivalent to, or higher than, desert dust studied in Ullrich et al. (2017) above −20 °C. This outcome was expected as the aerosol population at BRW is presumably not purely composed of desert dust. Indeed, many previous studies suggest the potential influence of highly active biogenic INP in the region (Inoue et al., 2021; Creamean et al., 2022). While a partial overlap of our ns(T) with illite NX (mineral dust proxy) and microcrystalline cellulose (MCC; non-proteinaceous organic surrogate) spectra is seen in a few temperature bins in the middle range (i.e., −27 °C < T < −19 °C), reference spectra of these compositions cannot solely explain the overall ns(T) trend from BRW. The sea spray aerosol (SSA) ns(T) parameterization spectrum from McCluskey et al. (2018) shows a less active trend and is not comparable to the BRW data, implying that aerosols collected at BRW are different from SSAs seen in McCluskey et al. (2018) and are perhaps predominantly composed of nss and non-SSA compounds. The link between these chemical compounds and INP is not straightforward. Without detailed size-dependent composition and ice residual chemistry data, further discussions cannot be conducted in this study. It is also worth noting that a substantial portion of the PINE-03 measurement period was during winter, when the adjacent ocean was capped by sea ice. Figure 8 below and Fig. S5 (Sect. S6) show seasonal ns parameterizations.
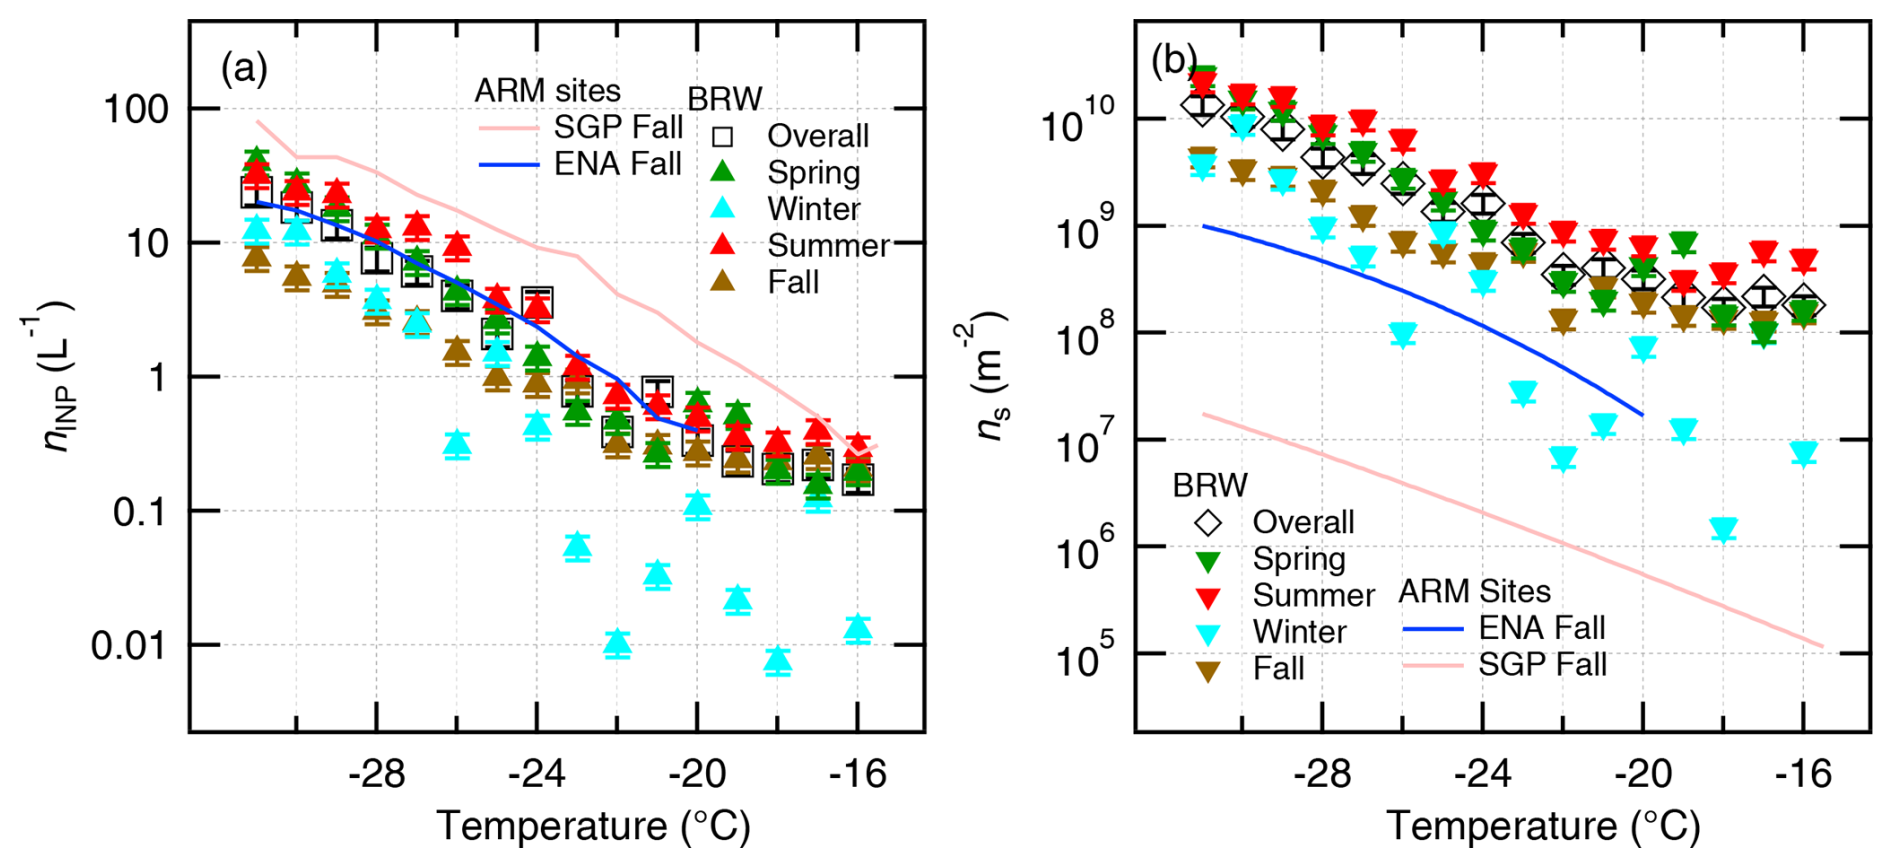
Figure 8Seasonal breakdowns of the PINE-03-based nINP(T) and ns(T) data are shown in panels (a) and (b), respectively. The uncertainties in nINP(T) and ns(T) are also adopted from W24.
Shown in Fig. 8 is the seasonality of the 6 h time-averaged PINE-03-measured nINP(T) and ns(T) data from BRW. When comparing seasonally averaged nINP(T) values (Fig. 8a), it is notable that nINP(T) in spring and summer at BRW is consistently higher than nINP(T) in the other seasons. The observed difference in nINP(T) can in part be attributed to arctic haze episodes that occur during arctic spring (Rogers et al., 2001; Quinn et al., 2007) and local sediment exposure to air after springtime melt (Cox et al., 2019; de Boer et al., 2019), while further quantitative analysis with high-time-resolution data is necessary. Fall nINP(T) data from BRW in comparison to nINP(T) spectra from mid-latitude sites (i.e., SGP and ENA) in the same season suggest that INP abundance is lowest in the Arctic (at least for fall). The maritime nINP(T) represented by the ENA measurements is consistently higher than fall data from BRW and lies towards the upper bound of the overall BRW data. We note that the relative abundance of aerosols at ENA is on average more than twice as high as that observed at BRW for our study period. Continental INPs from SGP exceed BRW nINP(T) below −20 °C. It is worth noting that the high variability in BRW winter data is partially due to the high frequency of zero INP counts collected in this season (≈ 66 %) as compared to other seasons (≈ 21 %–23 %; Fig. 6). PINE-03 is designed to utilize ambient moisture to saturate the chamber during expansion cooling and to maintain the chamber dew point temperature above freezing. Dry winter conditions often lowered the dew point and hindered INP measurements. Regardless, patterns in nINP(T) and ns(T) can still be compared as representative of each season because our temperature-binned nINP(T) and ns(T) data offer at least 22 and 21 data points in each bin (see Figs. S2 and S3).
Seasonal variability in ns(T) is obvious in Fig. 8b. In general, two data subsets (i.e., higher ns(T) in spring and summer and lower ns(T) in fall and winter than the overall data) define the ns(T) characteristics from this study at low temperatures. Surprisingly, BRW ns(T) exceeds SGP and ENA ns(T) values by at least 1 order of magnitude across the freezing temperatures analyzed in this study, suggesting that there are unique INP properties in the region.
Correlations between detectable nINP at selected temperatures (i.e., −20, −25, and −30 °C) and measured variables averaged for 6 h suggest the following: (1) Saer and mBC are correlated well (r = 0.7, p < 0.05), indicating that some BC was externally mixed and available on aerosol surfaces at BRW during the study period, and, (2) at a freezing temperature of −25 °C, there is a positive correlation between nINP and precipitation amount (r = 0.7, p < 0.05; N = 68), which could suggest a contribution of hydrometeors to nINP potentially derived locally in part by blowing snow (Chen et al., 2022). However, the correlation between precipitation amount and INP abundance for other temperatures is weak ( ≲ 0.2, p < 0.05). Therefore, the direct relationship between INP and precipitation at BRW is not conclusive. It is noteworthy that our previous study with PINE-03 from a mid-latitude continental setting showed that nINP values decreased immediately after precipitation events, while IAF and ns remained consistent (Wilbourn et al., 2024).
While 6 h time-averaged data are unavailable from the ion chromatography filter measurements (Sect. 2.3.4), seasonal means of nss SO correlate well with NO (r = 0.7), wind direction (r = 0.7), Saer (r = 0.7), and mBC (r = 0.9). These correlations imply that arctic haze coincidentally delivers nss SO, BC, and NO with large particle surface areas. On the other hand, nss SO shows a reciprocal relationship with temperature (r = −0.7) that is attributed to the winter–spring dominance of arctic haze. Furthermore, seasonal mean nss SO weakly correlates with seasonal precipitation amount (r = 0.5). This implies that wet deposition during arctic haze may contribute to the observed high nss SO via evaporation and/or sublimation of the precipitation near the surface.
3.5 Air mass trajectories and particle abundance
The nINP observations are positively correlated with a regional climate index (r ≈ 0.4 at −31 °C) that encodes the juxtaposition of the Aleutian Low and the Beaufort High (Cox et al., 2019). This indicates that higher INP concentrations tend to be associated with air advecting northward through the Bering Strait before dispersing eastward over the NSA during periods when the dominant easterlies of the Beaufort High are weak or reversed. In this section, we further analyze the source regions using backward trajectories.
Table 1 lists periods of high- and low-INP episodes and the associated ns(T) parameters found at BRW. Since ns(T) accounts for both INP and aggregate aerosol properties, we use it as a representative ice nucleation efficiency index to select high- or low-INP periods in this study. High-INP episodes are defined by ns values exceeding their 75th percentile values at −20, −25, and −30 °C. In contrast, low-INP episodes correspond to ns at the three temperatures below the 25th percentile.
Table 1List of high- and low-INP periods from BRW.
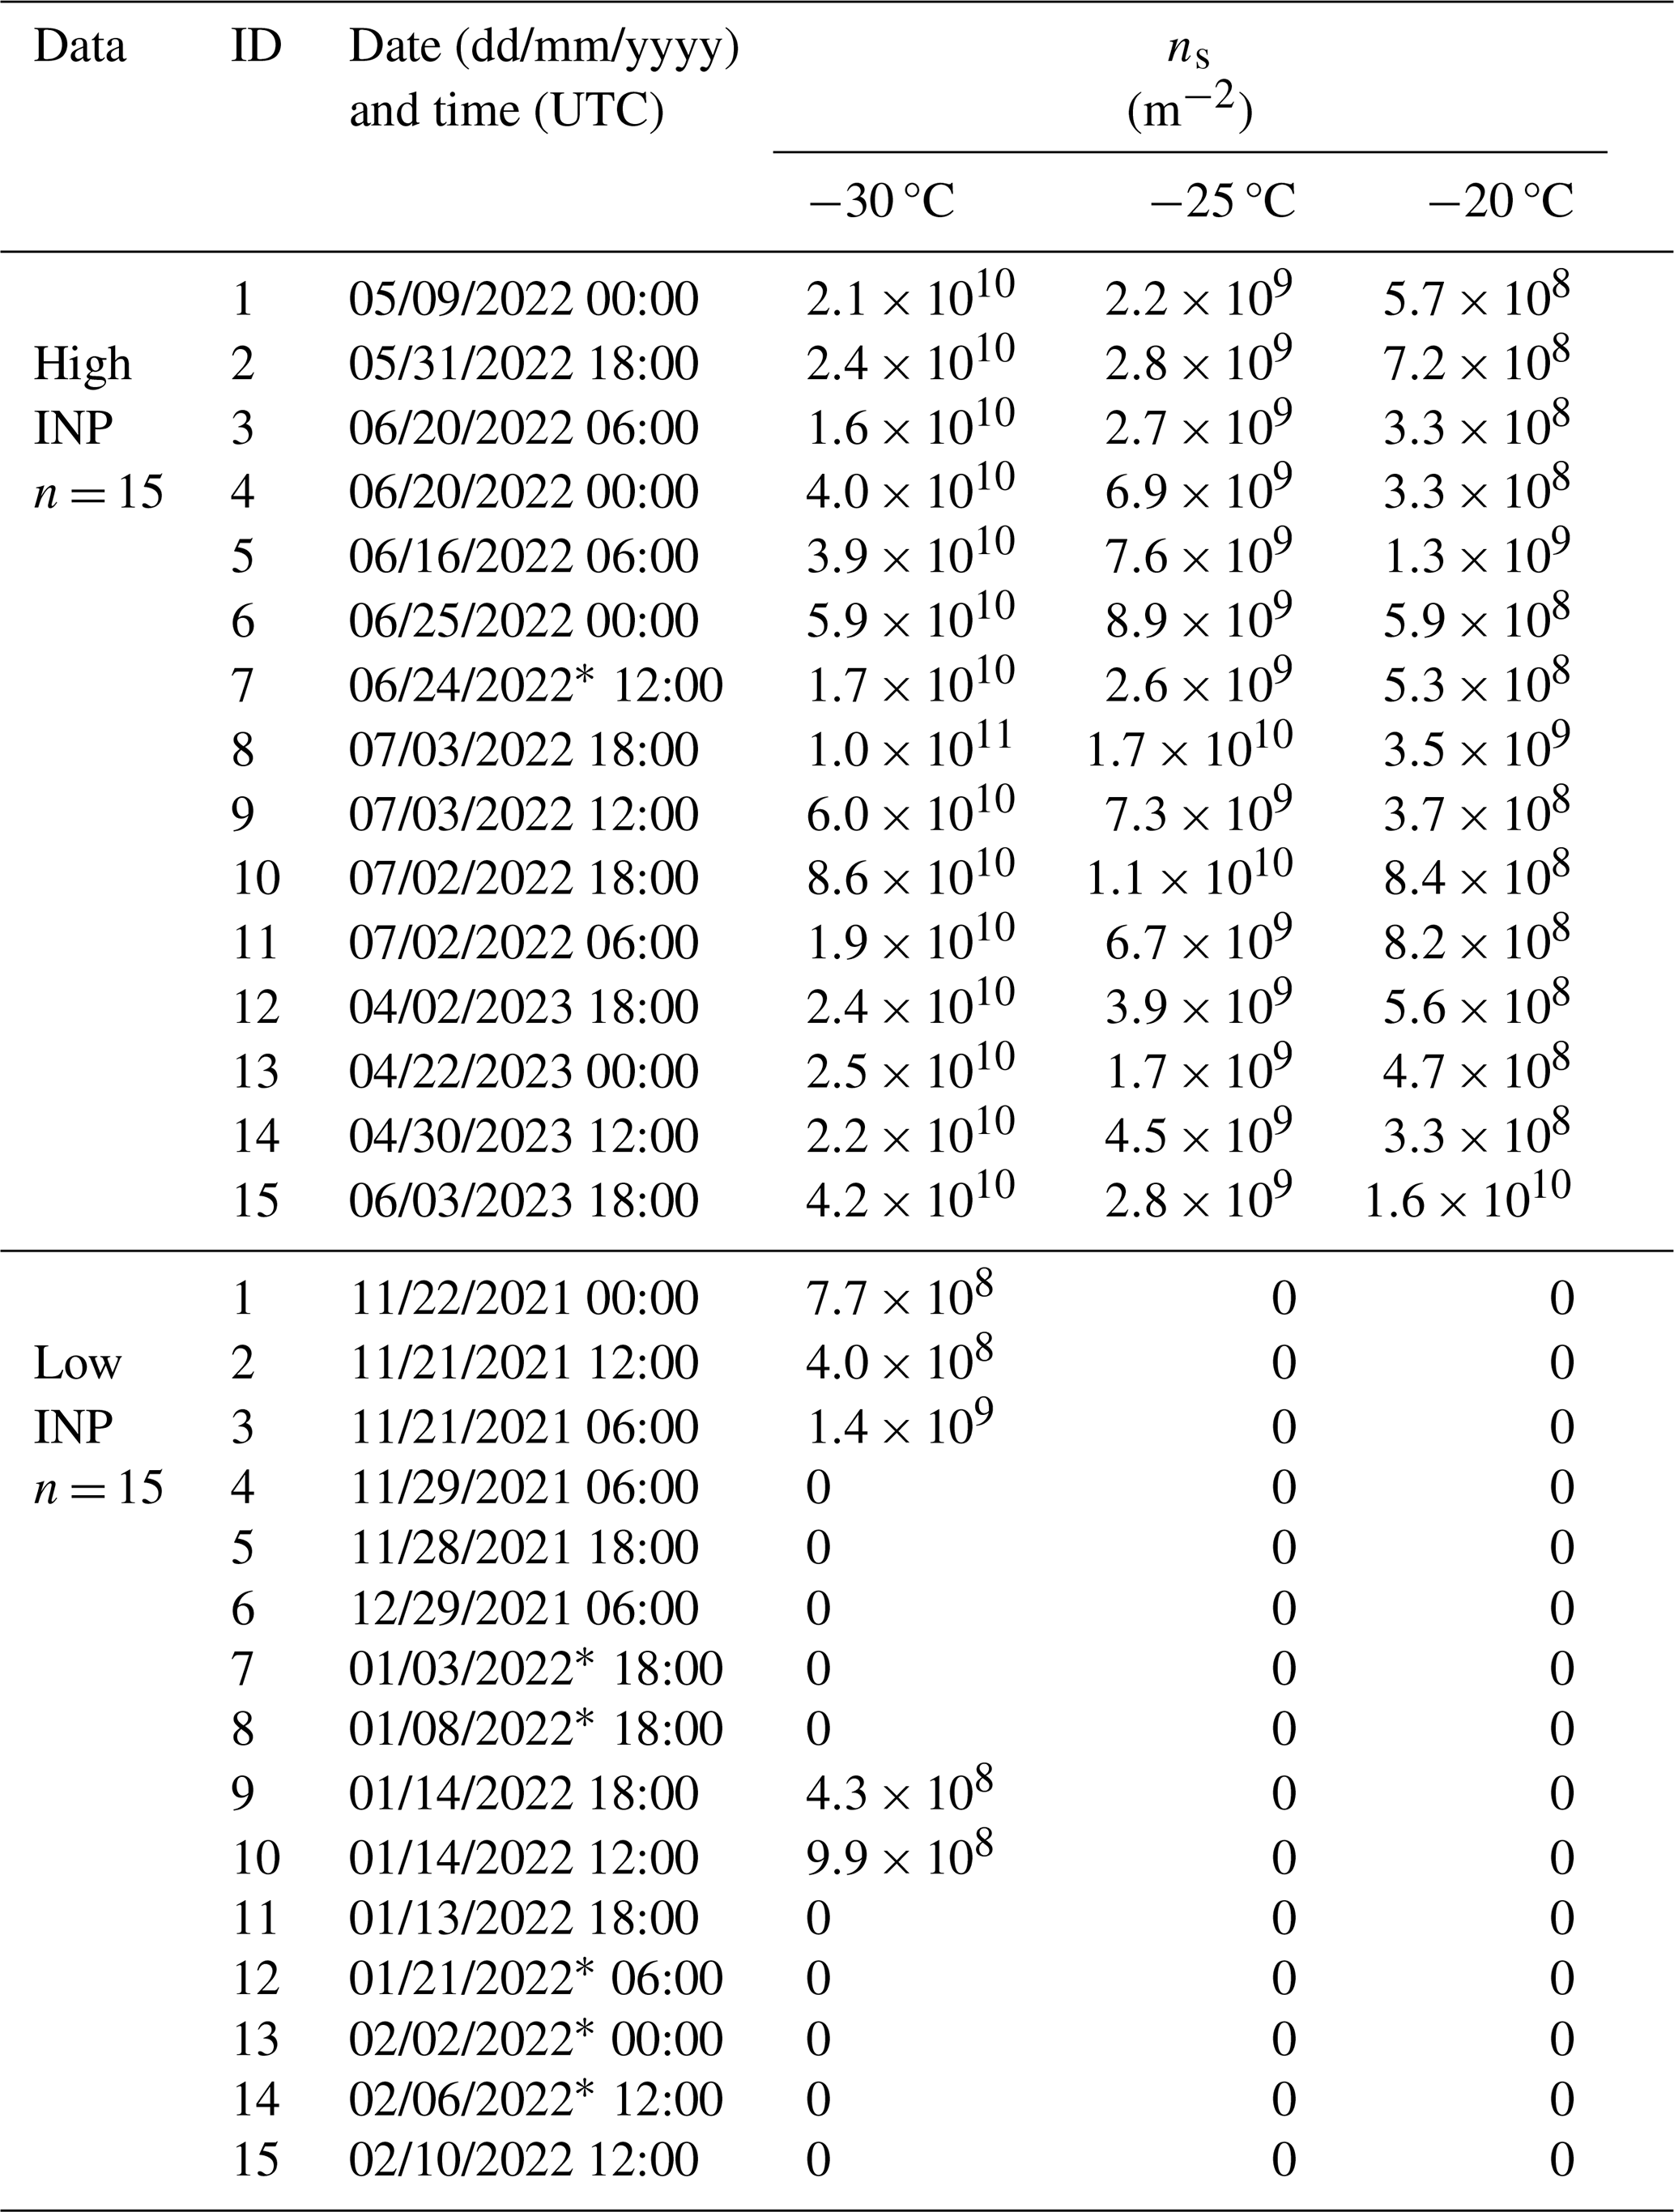
* Clean data (a fully extended table is available in the Supplement in Table S3).
Backward trajectories are plotted in Fig. 9 (for seasonal subsets, see Sect. S7). For our study period, 15 of 3176 trajectories are considered high-INP cases and are displayed in Fig. 9b. Some air masses during the high-INP period show a westward trajectory from northeastern Alaska. While they appear to pass over the Prudhoe Bay oil field region, distinguishing the influence from that region would require further analysis and attention to resolution that is beyond the scope of this study. Besides Prudhoe Bay, maritime contributions originating from the North Pacific Ocean are a significant source of high-INP trajectories at BRW, especially in the summertime (Figs. S6 and S7).
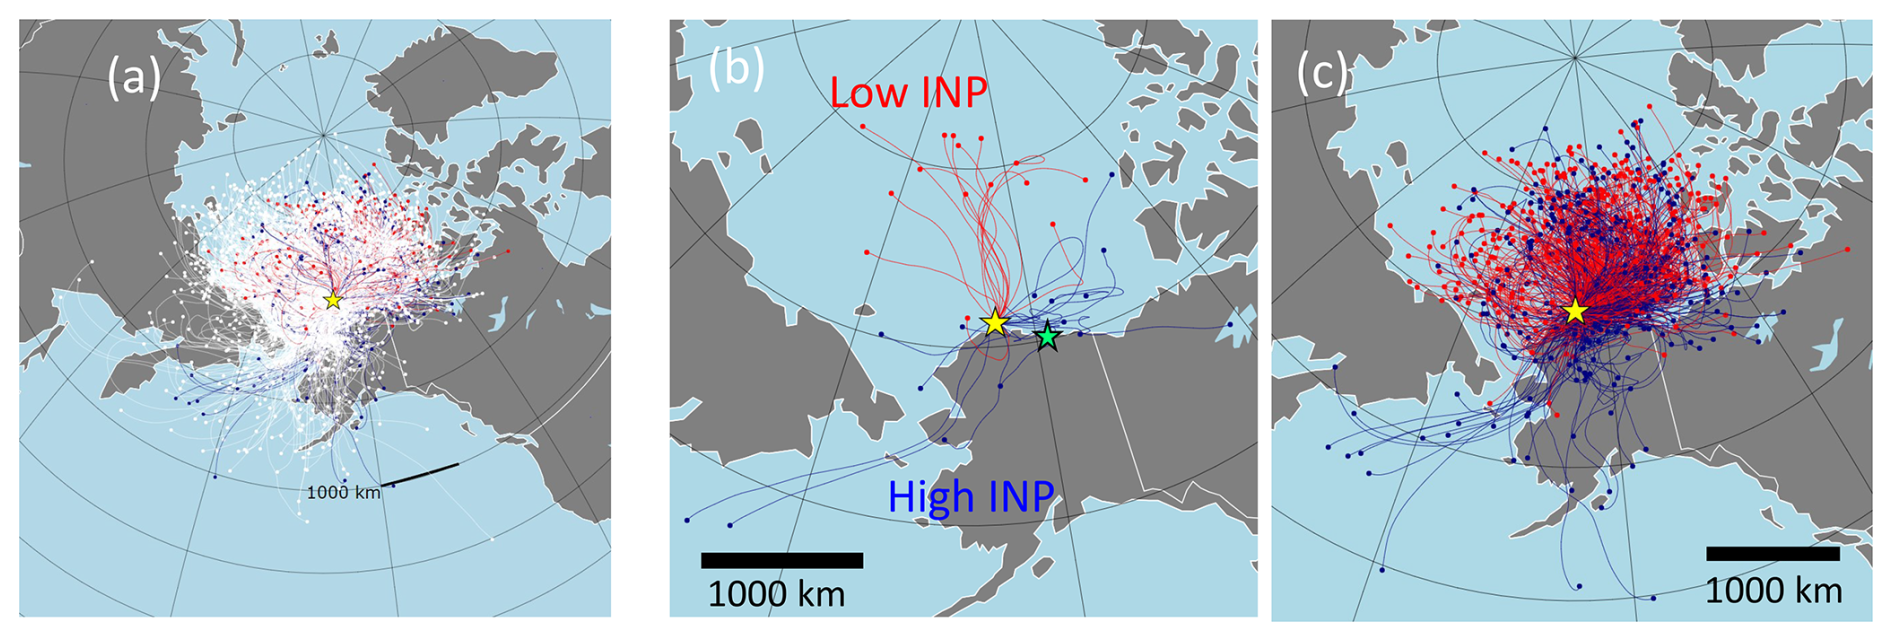
Figure 9Air mass origins and backward trajectories from the inlet height for BRW (yellow star). The Prudhoe Bay location is indicated by the green star in panel (b). All trajectories for the time period October 2021–December 2023 are shown in panel (a). The air mass trajectories during high- and low-INP episodes are shown in blue and red colors. Panel (b) represents the data selected with a low to high threshold of the 25th to 75th percentiles based on ns(T) at all of −30, −25, and −20 °C. Panel (c) represents the data selected with a low to high threshold of the 25th to 75th percentiles based on ns(T) at any of −30, −25, and −20 °C. The details of high- and low-INP episodes are shown in Figs. S6 and S7 in separate panels. The seasonal breakdowns of the trajectory data are shown in Figs. S8 and S9.
The high- and low-INP episodes for any Ts case based on 72 h air mass backward trajectories, as displayed in Fig. 9c, suggest that air mass contributions from the North American (particularly the southern Alaskan region) and Russian (Siberian) coasts are associated with high-INP concentrations. Totals of 291 and 364 trajectories (out of 3176) correspond to high- and low-INP events, respectively (Table S3). These patterns could suggest that terrestrial sources, potentially influenced by transported biomass burning material in spring and summer, are contributing to the elevated INP levels in BRW. While the exact sources of INPs from high latitudes remain uncertain, previous studies point to biogenic aerosols as a possible source in the Arctic (Inoue et al., 2021; Creamean et al., 2022; Sanchez-Marroquin et al., 2023). In comparison, Moffett et al. (2022) identified the influence of transported biomass burning materials from Russia (Siberia) as a key contributor to arctic INP levels, while Irish et al. (2019b) reported the presence of INPs in the sea surface microlayer. Similar high-INP episodes have been observed in other arctic and sub-arctic regions. For instance, a study in Iceland reported INP concentrations of over 100 L−1 at −26 °C (Sanchez-Marroquin et al., 2020), and southern Alaska showed around 6 L−1 (Barr et al., 2023), reinforcing the importance of dust and other terrestrial sources in these regions.
As seen in Fig. 9c, at BRW low-INP episodes coincide with air masses originating from coastal regions of the North American Arctic, and contributions from the high Arctic account for > 60 % as compared to other source regions. As discussed in several previous studies (Creamean et al., 2018a, 2019; DeMott et al., 2016), maritime SSAs are less active as INPs relative to terrestrial dust particles.
To contextualize the source of INPs in northern Alaska and the reason for the 10–1000 times greater efficiency in arctic INPs, local and synoptic meteorological influences on INPs must be investigated. In particular, the roles of local blowing snow, resuspension of surface materials, and synoptic air mass transport from the warm Pacific Ocean in INPs for selected high- and low-INP episodes can be investigated. Assessing relationships between a regional climate index, known large-scale meteorological patterns influencing northern Alaska, and INP properties will provide insight into arctic INP properties. Further efforts to correlate INP properties in fall during identified high-INP periods with other aerosol and atmospheric parameters will shed additional light on arctic INPs. Such an analysis will be important for comprehensively understanding mechanisms and projections of arctic warming beyond the sea ice albedo effect.
Continuous nINP data were measured in the Alaskan Arctic from October 2021 through December 2023. We find a factor of 10–1000 times greater efficiency in the arctic INPs through heterogeneous freezing at sea level during fall compared to those found previously (Wilbourn et al., 2024) at the mid-latitude ARM sites using the same instrumentation. Specifically, we find relatively low concentrations of aerosol surface area (Fig. 3b) and contrasting high-INP concentrations (Fig. 4) at BRW relative to previous observations at ARM's SGP and ENA sites. In each of these studies, the same PINE-03 system was deployed for an extended time period. Thus, while PINE-03 has limitations (e.g., insensitivity to INPs with freezing temperatures > −16 °C), the relative comparisons among these locations are instructive.
Our analysis of this multi-season INP dataset from BRW offered insight into the variability of INP abundance and revealed seasonality in INP properties. Spring showed profound INP abundance and freezing efficiencies, presumably due to arctic haze events. As shown previously, some arctic haze tracers, such as particulate nss sulfate and nitrate, were found to be higher in spring in our study period than in other seasons. From back-trajectory analysis, it is found that air masses connected to high-INP episodes can come from all directions, while low-INP episodes are strictly from the north. More specifically, air masses observed during high-INP episodes in spring tended to come from terrestrial regions (central Alaska).
Our nINP data show very high freezing efficiencies of INPs across the measured temperatures as compared to the previous mid-latitude INP measurements made by the same instrument, together with observed high nINP values above −21 °C throughout the year. These data suggest the persistent presence of high-temperature INPs in Arctic Alaska. Distinct different freezing efficiencies of aerosols observed for the arctic site as compared to the mid-latitude sites indicate the necessity of considering emission source regions yet do not merge whole regions into one because INP data are region-dependent.
Long-term INP datasets, such as that presented here, are lacking in the arctic region but are needed to improve representation of clouds in numerical models. To this end, we developed a parameterization for ice nucleation active surface site density covering −31 to −21 °C. For temperatures higher than −21 °C, INP concentrations were sufficiently low to approach the boundaries of what is detectable given the experimental design, a factor that should be considered for future studies (e.g., examining larger air volumes or recreating particle-laden conditions by virtual air mass concentration). This dataset also complements smaller INP datasets previously created in the same region. It will be useful to improve atmospheric models to simulate cloud feedback and determine their impact on the global radiative energy budget. Whether this parameterization can only be applied to ground-level INPs or whether vertical INP gradients might affect their utility in modeling cloud processes should be verified. Together with the INP data, additional aerosol data, such as coarse-mode size distributions, particle chemical composition and mixing state (deployed at BRW in October 2024), and vertical INP profiles, would allow us to further understand the implications of this dataset for clouds, precipitation, regional weather, and overall ambient ice nucleation abundance in the NSA region.
Arctic INPs have been reported from the NSA region in several previous studies. The present study reports the first nINP data measured at the BRW site. A summary of seven studies that report nINP from or near the NSA is provided in Table A1.
Table A1A summary of the past INP abundance measurements that were made near the BRW monitoring site.
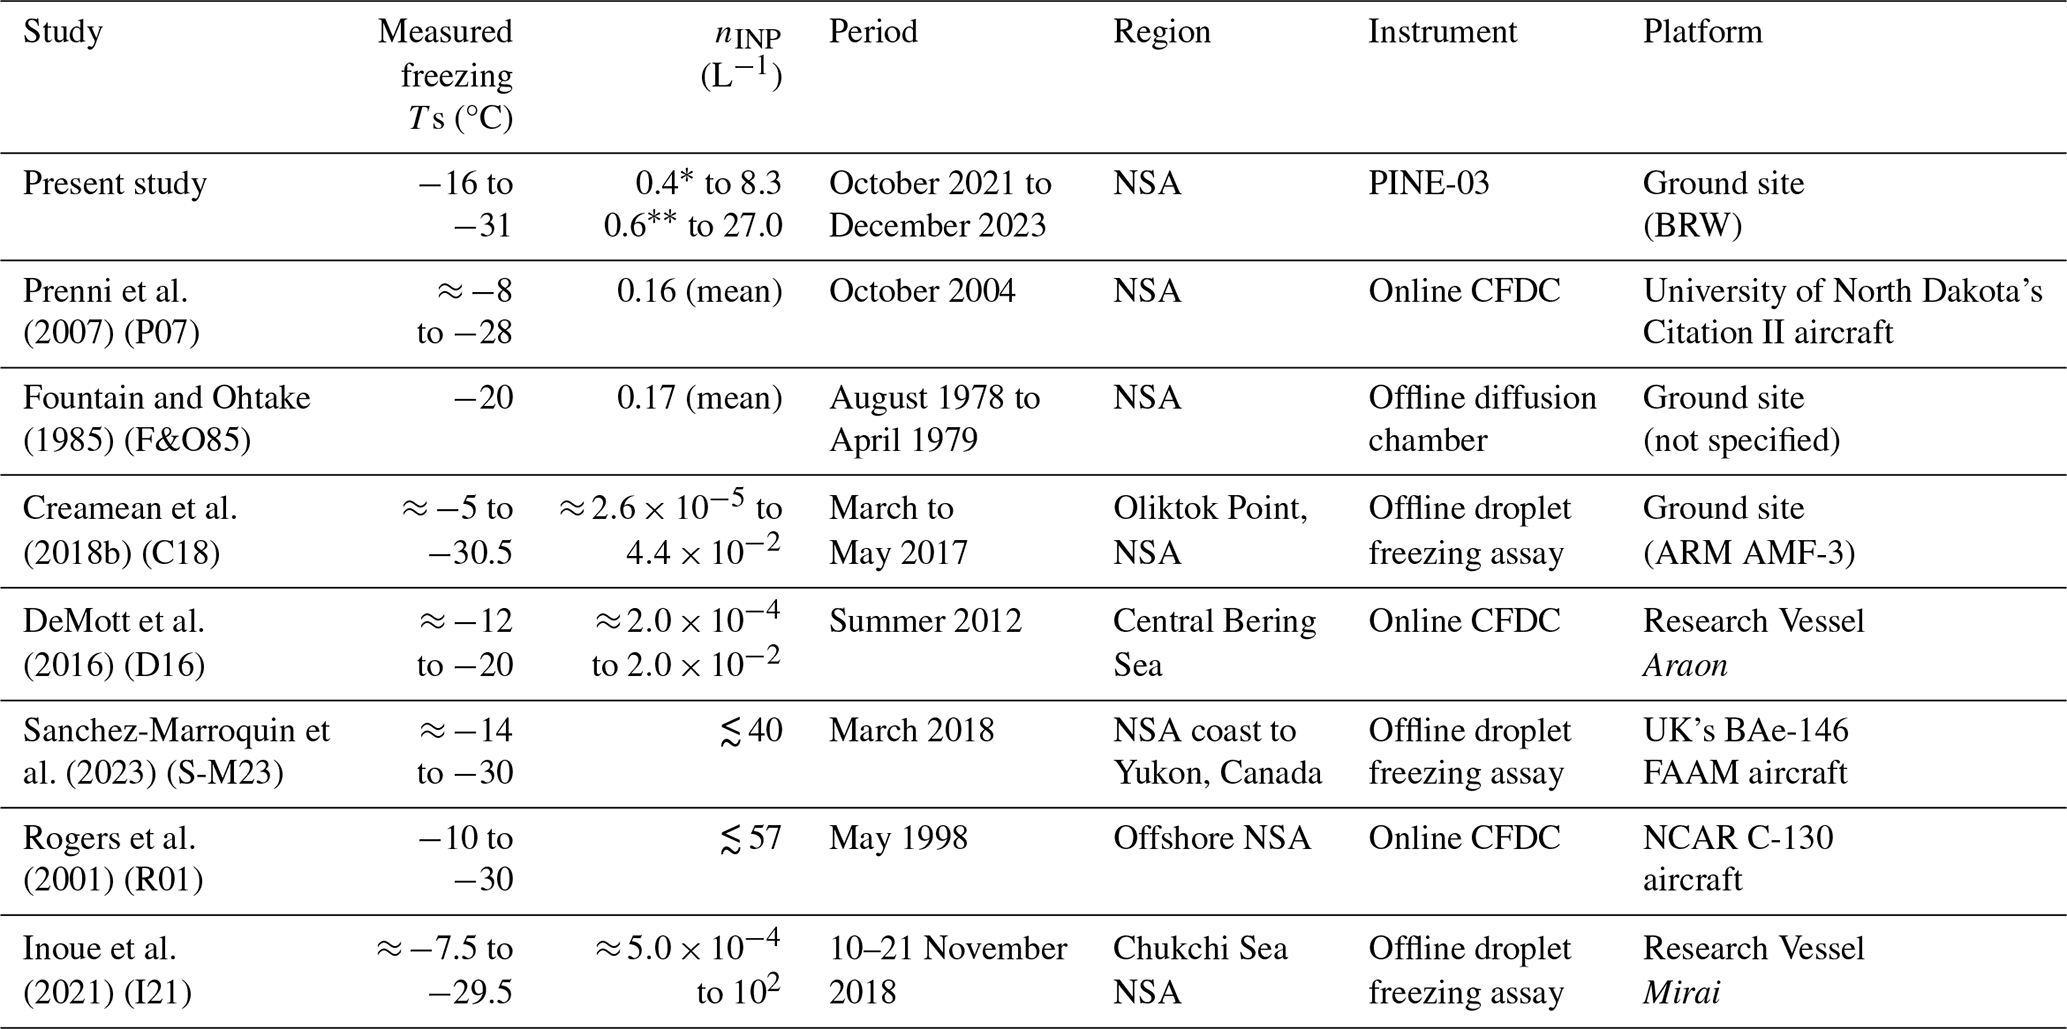
* Clean median. Clean average; the data-screening protocol is described in Sect. 2.5.
Trajectories were based on the Global Data Assimilation System (GDAS) and calculated using the Hybrid Single-Particle Lagrangian Integrated Trajectory (HYSPLIT) model (Rolph et al., 2017; Stein et al., 2015) to compute archive trajectories every 6 h during the sampling period. Each 72 h backward trajectory was calculated at the sampling inlet height (∼ 12 m a.g.l.). Our analysis protocols follow those of Wilbourn et al. (2024). Back-trajectory origins were classified into broad regional categories, including the major oceans and continents, as described in Sect. S12 of Wilbourn et al. (2024).
Source points are assigned to the final back-trajectory locations at 72 h. Besides the land and ocean, we determine whether the source was over an area covered in sea ice. The sum of rainfall is calculated at each height, and if the rainfall amount exceeds 7 mm, the back-trajectory point before exceeding 7 mm in rainfall is used as the source point. If it does not exceed 7 mm, the 72 h point is used. More information on the analysis of air mass travel times over different surface types (land, open water, and ice) and the impact of precipitation (assuming > 7 mm cumulative rainfall can wash out aerosols in air mass by wet scavenging) can also be found in Wilbourn et al. (2024) and Gong et al. (2020).
The processed dataset and codes created for the study will be available at https://doi.org/10.6084/m9.figshare.26615752.v3 (Pantoya and Hiranuma, 2024). Local ambient conditions, such as wind speed, wind direction, temperature, and relative humidity, were obtained from NOAA GML (2024, https://gml.noaa.gov/aftp/data/meteorology/in-situ/brw/). Visibility and time-averaged cumulative precipitation observations were not available at BRW for our study period and were reported from Wiley Post–Will Rogers Memorial Airport (71.285° N, 156.769° W) (automated monitoring station; https://mesowest.utah.edu/cgi-bin/droman/mesomap.cgi?state=AK&rawsflag=3, MesoWest, 2024). The ion analysis data used for estimating the ambient mass concentrations of nss SO and aerosol NO are available from NOAA-PMEL's website (https://saga.pmel.noaa.gov/data/stations/, NOAA-PMEL, 2024). The aerosol data were provided by Elisabeth Andrews (betsy.andrews@noaa.gov). The ARM CPC data were downloaded from https://doi.org/10.5439/1227962 (ARM Data Discovery, 2024). The scattering and aerosol size distribution data from El Arenosillo used to calculate Q were downloaded from the EBAS data archive.
The supplement related to this article is available online at https://doi.org/10.5194/ar-3-253-2025-supplement.
NH designed the concept of this collaborative research. The methodology was developed by ADP, SRS, and NH. The on-site and remote measurements at the BRW site were taken by BDT, RB, and ADP. The formal data analyses were led by ADP with the data processing contributions of SS, EA, CJC, and GdB. ADP, SRS, and NH led the writing of the manuscript with the support of all the authors.
The contact author has declared that none of the authors has any competing interests.
Publisher’s note: Copernicus Publications remains neutral with regard to jurisdictional claims made in the text, published maps, institutional affiliations, or any other geographical representation in this paper. While Copernicus Publications makes every effort to include appropriate place names, the final responsibility lies with the authors.
The authors gratefully acknowledge the NOAA Air Resources Laboratory (ARL) and the Environmental Research Division's Data Access Program (ERDDAP) for the provision of the HYSPLIT transport and dispersion model and/or READY website (https://www.ready.noaa.gov, last access: 10 June 2024) as well as the NOAA/PMEL ion chromatography data used in this publication. A useful discussion regarding the ERDDAP data with NOAA's Lucia Upchurch and Patricia Quinn is also acknowledged. The authors acknowledge Valerie Sparks of Sandia National Labs for her on-site and administrative contributions to the ExINP-NSA campaign. Naruki Hiranuma, Aidan D. Pantoya, and Stephanie R. Simonsen thank Elise Wilbourn, Andebo A. Waza, Jacob Hurst, and Oyshrojo Talukder for their contributions to the PINE-03 operation, maintenance, and error analysis. The authors also acknowledge Amy Solomon, Gourihar Kulkarni, and Matthew Shupe for the useful discussion regarding the data implications.
This research was supported by the U.S. Department of Energy, Office of Science, Office of Biological and Environmental Research (grant no. DE-SC-0018979). Gijs de Boer was supported by the U.S. Department of Energy's Atmospheric System Research (ASR) program under cooperative agreement DE-SC0013306 as well as by the NOAA Physical Sciences Laboratory. Christopher J. Cox received support from NOAA's Global Ocean Monitoring and Observing Program through the Arctic Research Program (FundRef https://doi.org/10.13039/100018302) and the NOAA Physical Sciences Laboratory. Elisabeth Andrews was supported partly by the NOAA cooperative agreement with CIRES (grant no. NA17OAR4320101) and partly by the ARM user facility, a DOE Office of Science user facility managed by the Biological and Environmental Research program.
This paper was edited by Bingbing Wang and reviewed by two anonymous referees.
Andrews, E., Sheridan, P., Ogren, J. A., Hageman, D., Jefferson, A., Wendell, J., Alastuey, A., Alados-Arboledas, L., Bergin, M., Ealo, M., Hallar, A. G., Hoffer, A., Kalapov, I., Keywood, M., Kim, J., Kim, S.-W., Kolonjari, F., Labuschagne, C., Lin, N.-H., Macdonald, A., Mayol-Bracero, O. L., McCubbin, I. B., Pandolfi, M., Reisen, F., Sharma, S., Sherman, J. P., Sorribas, M., and Sun, J.: Overview of the NOAA/ESRL Federated Aerosol Network, B. Am. Meteorol. Soc., 100, 123–135, https://doi.org/10.1175/BAMS-D-17-0175.1, 2019.
ARM Data Discovery: ARM CPC data, ARM User Facility [data set], https://doi.org/10.5439/1227962, 2024.
Barr, S. L., Wyld, B., McQuaid, J. B., Neely III, R. R., and Murray, B. J.: Southern Alaska as a source of atmospheric mineral dust and ice-nucleating particles, Sci. Adv., 9, 3708, https://doi.org/10.1126/sciadv.adg3708, 2023.
Barrett, T. E. and Sheesley, R. J.: Year-round optical properties and source characterization of Arctic organic carbon aerosols on the North Slope Alaska, J. Geophys. Res.-Atmos., 122, 9319–9331, https://doi.org/10.1002/2016JD026194, 2017.
Barry, K. R., Hill, T. C. J., Nieto-Caballero, M., Douglas, T. A., Kreidenweis, S. M., DeMott, P. J., and Creamean, J. M.: Active thermokarst regions contain rich sources of ice-nucleating particles, Atmos. Chem. Phys., 23, 15783–15793, https://doi.org/10.5194/acp-23-15783-2023, 2023.
Bond, T. C., Doherty, S. J., Fahey, D. W., Forster, P. M., Berntsen, T., DeAngelo, B. J., Flanner, M. G., Ghan, S., Kärcher, B., Koch, D., Kinne, S., Kondo, Y., Quinn, P. K., Sarofim, M. C., Schultz, M. G., Schulz, M., Venkataraman, C., Zhang, H., Zhang, S., Bellouin, N., Guttikunda, S. K., Hopke, P. K., Jacobson, M. Z., Kaiser, J. W., Klimont, Z., Lohmann, U., Schwarz, J. P., Shindell, D., Storelvmo, T., Warren, S. G., and Zender, C. S.: Bounding the role of black carbon in the climate system: A scientific assessment, J. Geophys. Res.-Atmos., 118, 5380–5552, https://doi.org/10.1002/jgrd.50171, 2013.
Chen, Q., Mirrielees, J. A., Thanekar, S., Loeb, N. A., Kirpes, R. M., Upchurch, L. M., Barget, A. J., Lata, N. N., Raso, A. R. W., McNamara, S. M., China, S., Quinn, P. K., Ault, A. P., Kennedy, A., Shepson, P. B., Fuentes, J. D., and Pratt, K. A.: Atmospheric particle abundance and sea salt aerosol observations in the springtime Arctic: a focus on blowing snow and leads, Atmos. Chem. Phys., 22, 15263–15285, https://doi.org/10.5194/acp-22-15263-2022, 2022.
Cox, C. J., Walden, V. P., and Rowe, P. M.: A comparison of the atmospheric conditions at Eureka, Canada, and Barrow, Alaska (2006–2008), J. Geophys. Res., 117, D12204, https://doi.org/10.1029/2011JD017164, 2012.
Cox, C. J., Stone, R. S., Douglas, D. C., Stanitski, D. M., Divoky, G. J., Dutton, G. S., Sweeney, C., George, J. C., and Longenecker, D. U.: Drivers and environmental responses to the changing annual snow cycle of northern Alaska, B. Am. Meteorol. Soc., 98, 2559–2577, https://doi.org/10.1175/BAMS-D-16-0201.1, 2017.
Cox, C. J., Stone, R. S., Douglas, D. C., Stanitski, D. M., and Gallagher, M. R.: The Aleutian Low-Beaufort Sea Anticyclone: A climate index correlated with the timing of springtime melt in the Pacific Arctic cryosphere. Geophys. Res. Lett., 46, 7464–7473, https://doi.org/10.1029/2019GL083306, 2019.
Creamean, J. M., Kirpes, R. M., Pratt, K. A., Spada, N. J., Maahn, M., de Boer, G., Schnell, R. C., and China, S.: Marine and terrestrial influences on ice nucleating particles during continuous springtime measurements in an Arctic oilfield location, Atmos. Chem. Phys., 18, 18023–18042, https://doi.org/10.5194/acp-18-18023-2018, 2018a.
Creamean, J. M., Maahn, M., de Boer, G., McComiskey, A., Sedlacek, A. J., and Feng, Y.: The influence of local oil exploration and regional wildfires on summer 2015 aerosol over the North Slope of Alaska, Atmos. Chem. Phys., 18, 555–570, https://doi.org/10.5194/acp-18-555-2018, 2018b.
Creamean, J. M., Cross, J. N., Pickart, R., McRaven, L., Lin, P., Pacini, A., Hanlon, R., Schmale, D. G., Ceniceros, J., Aydell, T., Colombi, N., Bolger, E., and DeMott, P. J.: Ice Nucleating Particles Carried From Below a Phytoplankton Bloom to the Arctic Atmosphere, Geophys. Res. Lett., 46, 8572–8581, https://doi.org/10.1029/2019GL083039, 2019.
Creamean, J. M., Barry, K., Hill, T. C. J., Hume, C., DeMott, P. J., Shupe, M. D., Dahlke, S., Willmes, S., Schmale, J., Beck, I., Hoppe, C. J. M., Fong, A., Chamberlain, E., Bowman, J., Scharien, R., and Persson, O.: Annual cycle observations of aerosols capable of ice formation in central Arctic clouds, Nat. Commun., 13, 3537, https://doi.org/10.1038/s41467-022-31182-x, 2022.
de Boer, G., Cox, C. J., and Creamean, J. M.: Accelerated springtime melt of northern Alaska river systems resulting from niveo-aeolian deposition events, Arctic, 72, 215–335, https://doi.org/10.14430/arctic68654, 2019.
Delene, D. J. and Ogren, J. A.: Variability of aerosol optical properties at four North American surface monitoring sites, J. Atmos. Sci., 59, 1135–1150, https://doi.org/10.1175/1520-0469(2002)059<1135:VOAOPA>2.0.CO;2, 2002.
DeMott, P. J., Hill, T. C., McCluskey, C. S., Prather, K. A., Collins, D. B., Sullivan, R. C., Ruppel, M. J., Mason, R. H., Irish, V. E., Lee, T., Hwang, C. Y., Rhee, T. S., Snider, J. R., McMeeking, G. R., Dhaniyala, S., Lewis, E. R., Wentzell, J. J., Abbatt, J., Lee, C., Sultana, C. M., Ault, A. P., Axson, J. L., Diaz Martinez, M., Venero, I., Santos-Figueroa, G., Stokes, M. D., Deane, G. B., Mayol-Bracero, O. L., Grassian, V. H., Bertram, T. H., Bertram, A. K., Moffett, B. F., and Franc, G. D.: Sea spray aerosol as a unique source of ice nucleating particles, P. Natl. Acad. Sci. USA, 113, 5797–5803, https://doi.org/10.1073/pnas.1514034112, 2016.
Fountain, A. G. and Ohtake, T.: Concentrations and Source Areas of Ice Nuclei in the Alaskan Atmosphere, J. Appl. Meteorol. Clim., 24, 377–382, https://doi.org/10.1175/1520-0450(1985)024<0377:Casaoi>2.0.CO;2, 1985.
Gong, X., Wex, H., Voigtländer, J., Fomba, K. W., Weinhold, K., van Pinxteren, M., Henning, S., Müller, T., Herrmann, H., and Stratmann, F.: Characterization of aerosol particles at Cabo Verde close to sea level and at the cloud level – Part 1: Particle number size distribution, cloud condensation nuclei and their origins, Atmos. Chem. Phys., 20, 1431–1449, https://doi.org/10.5194/acp-20-1431-2020, 2020.
Hande, L. B. and Hoose, C.: Partitioning the primary ice formation modes in large eddy simulations of mixed-phase clouds, Atmos. Chem. Phys., 17, 14105–14118, https://doi.org/10.5194/acp-17-14105-2017, 2017.
Hoose, C. and Möhler, O.: Heterogeneous ice nucleation on atmospheric aerosols: a review of results from laboratory experiments, Atmos. Chem. Phys., 12, 9817–9854, https://doi.org/10.5194/acp-12-9817-2012, 2012.
Inoue, J., Tobo, Y., Taketani, F., and Sato, K.: Oceanic supply of ice-nucleating particles and its effect on ice cloud formation: A case study in the Arctic ocean during a cold-air outbreak in early winter, Geophys. Res. Lett., 48, e2021GL094646, https://doi.org/10.1029/2021GL094646, 2021.
Irish, V. E., Hanna, S. J., Willis, M. D., China, S., Thomas, J. L., Wentzell, J. J. B., Cirisan, A., Si, M., Leaitch, W. R., Murphy, J. G., Abbatt, J. P. D., Laskin, A., Girard, E., and Bertram, A. K.: Ice nucleating particles in the marine boundary layer in the Canadian Arctic during summer 2014, Atmos. Chem. Phys., 19, 1027–1039, https://doi.org/10.5194/acp-19-1027-2019, 2019a.
Irish, V. E., Hanna, S. J., Xi, Y., Boyer, M., Polishchuk, E., Ahmed, M., Chen, J., Abbatt, J. P. D., Gosselin, M., Chang, R., Miller, L. A., and Bertram, A. K.: Revisiting properties and concentrations of ice-nucleating particles in the sea surface microlayer and bulk seawater in the Canadian Arctic during summer, Atmos. Chem. Phys., 19, 7775–7787, https://doi.org/10.5194/acp-19-7775-2019, 2019b.
Kanji, Z. A., Ladino, L. A., Wex, H., Boose, Y., Burkert-Kohn, M., Cziczo, D. J., and Kramer, M.: Overview of Ice Nucleating Particles, in: Ice Formation and Evolution in Clouds and Precipitation: Measurement and Modeling Challenges, edited by: Baumgardner, D., McFarquhar, G. M., and Heymsfield, A. J., Meteorol. Mon., 58, 1.1–1.33, https://doi.org/10.1175/amsmonographs-d-16-0006.1, 2017.
Keene, W. C., Pszenny, A. A. P., Galloway, J. N., and Hawley, M. E.: Sea-salt corrections and interpretation of constituent ratios in marine precipitation, J. Geophys. Res., 91, 6647–6658, 1986.
Kolesar, K. R., Cellini, J., Peterson, P. K., Jefferson, A., Tuch, T., Birmili, W., Wiedensohler, A., and Pratt, K. A.: Effect of Prudhoe Bay emissions on atmospheric aerosol growth events observed in Utqiagvik (Barrow), Alaska, Atmos. Environ., 152, 146–155, https://doi.org/10.1016/j.atmosenv.2016.12.019, 2017.
Knopf, D. A., Barry, K. R., Brubaker, T. A., Jahl, L. G., Jankowski, K. A., Li, J., Lu, Y., Monroe, L. W., Moore, K. A., Rivera-Adorno, F. A., Sauceda, K. A., Shi, Y., Tomlin, J. M., Vepuri, H. S. K., Wang, P., Lata, N. N., Levin, E. J. T., Creamean, J. M., Hill, T. C. J., China, S., Alpert, P. A., Moffet, R. C., Hiranuma, N., Sullivan, R. C., Fridlind, A. M., West, M., Riemer, N., Laskin, A., DeMott, P. J., and Liu, X.: Aerosol-ice formation closure: A Southern Great Plains field campaign, B. Am. Meteorol. Soc., 102, E1952–E1971, https://doi.org/10.1175/Bams-D-20-0151.1, 2021.
Koop, T. and Murray, B. J.: A physically constrained classical description of the homogeneous nucleation of ice in water, J. Chem. Phys., 145, 211915, https://doi.org/10.1063/1.4962355, 2016.
Lacher, L., Adams, M. P., Barry, K., Bertozzi, B., Bingemer, H., Boffo, C., Bras, Y., Büttner, N., Castarede, D., Cziczo, D. J., DeMott, P. J., Fösig, R., Goodell, M., Höhler, K., Hill, T. C. J., Jentzsch, C., Ladino, L. A., Levin, E. J. T., Mertes, S., Möhler, O., Moore, K. A., Murray, B. J., Nadolny, J., Pfeuffer, T., Picard, D., Ramírez-Romero, C., Ribeiro, M., Richter, S., Schrod, J., Sellegri, K., Stratmann, F., Swanson, B. E., Thomson, E. S., Wex, H., Wolf, M. J., and Freney, E.: The Puy de Dôme ICe Nucleation Intercomparison Campaign (PICNIC): comparison between online and offline methods in ambient air, Atmos. Chem. Phys., 24, 2651–2678, https://doi.org/10.5194/acp-24-2651-2024, 2024.
Lee, J., Seifert, P., Hashino, T., Maahn, M., Senf, F., and Knoth, O.: Simulations of the impact of cloud condensation nuclei and ice-nucleating particles perturbations on the microphysics and radar reflectivity factor of stratiform mixed-phase clouds, Atmos. Chem. Phys., 24, 5737–5756, https://doi.org/10.5194/acp-24-5737-2024, 2024.
Li, G., Wieder, J., Pasquier, J. T., Henneberger, J., and Kanji, Z. A.: Predicting atmospheric background number concentration of ice-nucleating particles in the Arctic, Atmos. Chem. Phys., 22, 14441–14454, https://doi.org/10.5194/acp-22-14441-2022, 2022.
Mamouri, R.-E. and Ansmann, A.: Potential of polarization lidar to provide profiles of CCN- and INP-relevant aerosol parameters, Atmos. Chem. Phys., 16, 5905–5931, https://doi.org/10.5194/acp-16-5905-2016, 2016.
Mason, R. H., Si, M., Chou, C., Irish, V. E., Dickie, R., Elizondo, P., Wong, R., Brintnell, M., Elsasser, M., Lassar, W. M., Pierce, K. M., Leaitch, W. R., MacDonald, A. M., Platt, A., Toom-Sauntry, D., Sarda-Estève, R., Schiller, C. L., Suski, K. J., Hill, T. C. J., Abbatt, J. P. D., Huffman, J. A., DeMott, P. J., and Bertram, A. K.: Size-resolved measurements of ice-nucleating particles at six locations in North America and one in Europe, Atmos. Chem. Phys., 16, 1637–1651, https://doi.org/10.5194/acp-16-1637-2016, 2016.
McCluskey, C. S., Ovadnevaite, J., Rinaldi, M., Atkinson, J., Belosi, F., Ceburnis, D., Marullo, S., Hill, T. C. J., Lohmann, U., Kanji, Z. A., O'Dowd, C., Kreidenweis, S. M., and DeMott, P. J.: Marine and Terrestrial Organic Ice-Nucleating Particles in Pristine Marine to Continentally Influenced Northeast Atlantic Air Masses, J. Geophys. Res., 123, 6196–6212, https://doi.org/10.1029/2017JD028033, 2018.
MesoWest: Monitoring Station Data from Wiley Post–Will Rogers Memorial Airport, MesoWest [data set], https://mesowest.utah.edu/cgi-bin/droman/mesomap.cgi?state=AK&rawsflag=3 (last access: 16 May 2025), 2024.
Moffett, C. E., Mehra, M., Barrett, T. E., Gunsch, M. J., Pratt, K. A., and Sheesley, R. J.: Contemporary sources dominate carbonaceous aerosol on the North Slope of Alaska, Sci. Total Environ., 831, 154641, https://doi.org/10.1016/j.scitotenv.2022.154641, 2022.
Möhler, O., Adams, M., Lacher, L., Vogel, F., Nadolny, J., Ullrich, R., Boffo, C., Pfeuffer, T., Hobl, A., Weiß, M., Vepuri, H. S. K., Hiranuma, N., and Murray, B. J.: The Portable Ice Nucleation Experiment (PINE): a new online instrument for laboratory studies and automated long-term field observations of ice-nucleating particles, Atmos. Meas. Tech., 14, 1143–1166, https://doi.org/10.5194/amt-14-1143-2021, 2021.
Moore, K. A., Alexander, S. P., Humphries, R. S., Jensen, J., Protat, A., Reeves, J. M., Sanchez, K. J., Kreidenweis, S. M., and DeMott, P. J.: Estimation of sea spray aerosol surface area over the Southern Ocean using scattering measurements, J. Geophys. Res.-Atmos., 127, e2022JD037009, https://doi.org/10.1029/2022JD037009, 2022.
Morrison, H., de Boer, G., Feingold, G., Harrington, J., Shupe, M. D., and Sulia, K.: Resilience of persistent Arctic mixed-phase clouds, Nat. Geosci., 5, 11–17, https://doi.org/10.1038/ngeo1332, 2012.
Murray, B. J., Carslaw, K. S., and Field, P. R.: Opinion: Cloud-phase climate feedback and the importance of ice-nucleating particles, Atmos. Chem. Phys., 21, 665–679, https://doi.org/10.5194/acp-21-665-2021, 2021.
NOAA Global Monitoring Laboratory (GML): Monitoring Station Data from BRW (71.285° N, 156.769° W), NOAA GML [data set], https://gml.noaa.gov/aftp/data/meteorology/in-situ/brw/ (last access: 16 May 2025), 2024.
NOAA-Pacific Marine Environmental Laboratory (PMEL): Atmospheric Chemistry Pacific Marine Environmental Laboratory, https://saga.pmel.noaa.gov/data/stations/ (last access: 16 May 2025), 2024.
Ogren, J. A., Wendell, J., Andrews, E., and Sheridan, P. J.: Continuous light absorption photometer for long-term studies, Atmos. Meas. Tech., 10, 4805–4818, https://doi.org/10.5194/amt-10-4805-2017, 2017.
Pantoya, A. D. and Hiranuma, N.: The abundance of ground-level atmospheric ice-nucleating particles and aerosol properties in the North Slope of Alaska, figshare [data set], https://doi.org/10.6084/m9.figshare.26615752.v3, 2024.
Polissar, A. V., Hopke, P. K., Paatero, P., Kaufmann, Y. J., Hall, D. K., Bodhaine, B. A., Dutton, E. G., and Harris, J. M.: The aerosol at Barrow, Alaska: long-term trends and source locations, Atmos. Environ., 33, 2441–2458, https://doi.org/10.1016/S1352-2310(98)00423-3, 1999.
Prenni, A. J., Harrington, J. Y., Tjernstrom, M., DeMott, P. J., Avramov, A., Long, C. N., Kreidenweis, S. M., Olsson, P. Q., and Verlinde, J.: Can ice-nucleating aerosols affect Arctic seasonal climate?, B. Am. Meteorol. Soc., 88, 541–550, https://doi.org/10.1175/bams-88-4-541, 2007.
Quinn, P., Coffman, D., Kapustin, V., Bates, V., and Covert, D.: Aerosol optical properties in the marine boundary layer during the First Aerosol Characterization Experiment (ACE 1) and the underlying chemical and physical aerosol properties, J. Geophys. Res.-Atmos., 103, 16547–16563, https://doi.org/10.1029/97JD02345, 1998.
Quinn, P. K., Bates, T. S., Miller, T. L., Coffman, D. J., Johnson, J. E., Harris, J. M., Ogren, J. A., Forbes, G., Anderson, T. L., Covert, D. S., and Rood, M. J.: Surface submicron aerosol chemical composition: What fraction is not sulfate?, J. Geophys. Res., 105, 6785–6806, https://doi.org/10.1029/1999JD901034, 2000.
Quinn, P. K., Miller, T. L., Bates, T. S., Ogren, J. A., Andrews, E., and Shaw, G. E.: A 3-year record of simultaneously measured aerosol chemical and optical properties at Barrow, Alaska, J. Geophys. Res., 107, AAC 8-1–AAC 8-15, https://doi.org/10.1029/2001JD001248, 2002.
Quinn, P. K., Shaw, G., Andrews, E., Dutton, E. G., Ruoho-Airola, T., and Gong, S. L.: Arctic haze: current trends and knowledge gaps, Tellus B, 59, 99–114, https://doi.org/10.1111/j.1600-0889.2006.00238.x, 2007.
Rogers, D. C., DeMott, P. J., Kreidenweis, S. M., and Chen, Y.: A continuous-flow diffusion chamber for airborne measurements of ice nuclei, J. Atmos. Ocean. Tech., 18, 725–741, https://doi.org/10.1175/1520-0426(2001)018<0725:ACFDCF>2.0.CO;2, 2001.
Rolph, G., Stein, A., and Stunder, B.: Real-time Environmental Applications and Display sYstem: READY, Environ. Modell. Softw., 95, 210–228, https://doi.org/10.1016/j.envsoft.2017.06.025, 2017.
Sanchez-Marroquin, A., Arnalds, O., Baustian-Dorsi, K. J., Browse, J., Dagsson-Waldhauserova, P., Harrison, A. D., Maters, E. C., Pringle, K. J., Vergara-Temprado, J., Burke, I. T., McQuaid, J. B., Carslaw, K. S., and Murray, B. J.: Iceland is an episodic source of atmospheric ice-nucleating particles relevant for mixed-phase clouds, Sci. Adv., 6, eaba8137, https://doi.org/10.1126/sciadv.aba8137, 2020.
Sanchez-Marroquin, A., Barr, S. L., Burke, I. T., McQuaid, J. B., and Murray, B. J.: Aircraft ice-nucleating particle and aerosol composition measurements in the western North American Arctic, Atmos. Chem. Phys., 23, 13819–13834, https://doi.org/10.5194/acp-23-13819-2023, 2023.
Schmeisser, L., Backman, J., Ogren, J. A., Andrews, E., Asmi, E., Starkweather, S., Uttal, T., Fiebig, M., Sharma, S., Eleftheriadis, K., Vratolis, S., Bergin, M., Tunved, P., and Jefferson, A.: Seasonality of aerosol optical properties in the Arctic, Atmos. Chem. Phys., 18, 11599–11622, https://doi.org/10.5194/acp-18-11599-2018, 2018.
Sheridan, P., Andrews, E., Schmeisser, L., Vasel, B., and Ogren, J.: Aerosol Measurements at South Pole: Climatology and Impact of Local Contamination, Aerosol Air Qual. Res., 16, 855–872, https://doi.org/10.4209/aaqr.2015.05.0358, 2016.
Shupe, M. D.: Clouds at Arctic Atmospheric Observatories. Part II: Thermodynamic Phase Characteristics, J. Appl. Meteorol. Clim., 50, 645–661, https://doi.org/10.1175/2010jamc2468.1, 2011.
Shupe, M. D. and Intrieri, J. M.: Cloud radiative forcing of the Arctic surface: the influence of cloud properties, surface albedo, and solar zenith angle, J. Climate, 17, 616–628, https://doi.org/10.1175/1520-0442(2004)017<0616:CRFOTA>2.0.CO;2, 2004.
Shupe, M. D., Walden, V. P., Eloranta, E., Uttal, T., Campbell, J. R., Starkweather, S. M., and Shiobara, M.: Clouds at Arctic Atmospheric Observatories. Part I: Occurrence and Macrophysical Properties, J. Appl. Meteorol. Clim., 50, 626–644, https://doi.org/10.1175/2010jamc2467.1, 2010.
Shupe, M. D., Persson, P. O. G., Brooks, I. M., Tjernström, M., Sedlar, J., Mauritsen, T., Sjogren, S., and Leck, C.: Cloud and boundary layer interactions over the Arctic sea ice in late summer, Atmos. Chem. Phys., 13, 9379–9399, https://doi.org/10.5194/acp-13-9379-2013, 2013.
Solomon, A., Morrison, H., Persson, O., Shupe, M., and Bao, J.-W.: Investigations of microphysical parameterizations of snow and ice in Arctic clouds during M-PACE through model-observations comparison, Mon. Weather Rev., 137, 3110–3128, 2009.
Solomon, A., de Boer, G., Creamean, J. M., McComiskey, A., Shupe, M. D., Maahn, M., and Cox, C.: The relative impact of cloud condensation nuclei and ice nucleating particle concentrations on phase partitioning in Arctic mixed-phase stratocumulus clouds, Atmos. Chem. Phys., 18, 17047–17059, https://doi.org/10.5194/acp-18-17047-2018, 2018.
Stein, A. F., Draxler, R. R., Rolph, G. D., Stunder, B. J. B., Cohen, M. D., and Ngan, F.: Noaa's Hysplit atmospheric transport and dispersion modeling system, B. Am. Meteorol. Soc., 96, 2059–2077, https://doi.org/10.1175/Bams-D-14-00110.1, 2015.
Ullrich, R., Hoose, C., Möhler, O., Niemand, M., Wagner, R., Höhler, K., Hiranuma, N., Saathoff, H., and Leisner, T.: A New Ice Nucleation Active Site Parameterization for Desert Dust and Soot, J. Atmos. Sci., 74, 699–717, https://doi.org/10.1175/JAS-D-16-0074.1, 2017.
Vali, G., DeMott, P. J., Möhler, O., and Whale, T. F.: Technical Note: A proposal for ice nucleation terminology, Atmos. Chem. Phys., 15, 10263–10270, https://doi.org/10.5194/acp-15-10263-2015, 2015.
Welti, A., Bigg, E. K., DeMott, P. J., Gong, X., Hartmann, M., Harvey, M., Henning, S., Herenz, P., Hill, T. C. J., Hornblow, B., Leck, C., Löffler, M., McCluskey, C. S., Rauker, A. M., Schmale, J., Tatzelt, C., van Pinxteren, M., and Stratmann, F.: Ship-based measurements of ice nuclei concentrations over the Arctic, Atlantic, Pacific and Southern oceans, Atmos. Chem. Phys., 20, 15191–15206, https://doi.org/10.5194/acp-20-15191-2020, 2020.
Westbrook, C. D. and Illingworth, A. J.: Evidence that ice forms primarily in supercooled liquid clouds at temperatures > −27 °C, Geophys. Res. Lett., 38, L14808, https://doi.org/10.1029/2011gl048021, 2011.
Wilbourn, E. K., Alrimaly, S., Williams, H., Hurst, J., McGovern, G. P., Anderson, T. A., and Hiranuma, N.: Integrated science teaching in atmospheric ice nucleation research: Immersion freezing experiments, J. Chem. Educ., 100, 1511–1522, https://doi.org/10.1021/acs.jchemed.2c01060, 2023.
Wilbourn, E. K., Lacher, L., Guerrero, C., Vepuri, H. S. K., Höhler, K., Nadolny, J., Pantoya, A. D., Möhler, O., and Hiranuma, N.: Measurement report: A comparison of ground-level ice-nucleating-particle abundance and aerosol properties during autumn at contrasting marine and terrestrial locations, Atmos. Chem. Phys., 24, 5433–5456, https://doi.org/10.5194/acp-24-5433-2024, 2024.
Zheng, G., Wang, Y., Aiken, A. C., Gallo, F., Jensen, M. P., Kollias, P., Kuang, C., Luke, E., Springston, S., Uin, J., Wood, R., and Wang, J.: Marine boundary layer aerosol in the eastern North Atlantic: seasonal variations and key controlling processes, Atmos. Chem. Phys., 18, 17615–17635, https://doi.org/10.5194/acp-18-17615-2018, 2018.