the Creative Commons Attribution 4.0 License.
the Creative Commons Attribution 4.0 License.
 | 13 Jun 2025
Sources of ultrafine particles at a rural midland site in Switzerland
Lidia-Marta Amarandi-Netedu
Martine Collaud Coen
Nikolaos Evangeliou
Christoph Hueglin
Nora Nowak
Robin Modini
Martin Steinbacher
Martin Gysel-Beer
Ultrafine particles (UFPs; i.e., atmospheric aerosol particles smaller than 100 nm in diameter) are known to be responsible for a series of adverse health effects as they can deposit in humans' bodies. So far, most field campaigns studying the sources of UFPs have focused on urban environments. This study investigates the outdoor sources of UFPs at the atmospheric monitoring station in Payerne, which represents a typical rural location in Switzerland. We aim to quantify the primary and secondary fractions of UFPs based on specific measurements between July 2020 and July 2021 complementing a series of operational meteorological, trace gas and in situ aerosol observations. To distinguish between primary and secondary contributions, we use a method that relies on measuring the fraction of non-volatile particles as a proxy for primary particles. We further compare our measurement results to previously established methods. We find that primary particles resulting from traffic and residential wood burning (direct emissions – mostly non-volatile BC-rich) contribute less than 40 % to the total number of UFPs, mostly in the Aitken mode. On the other hand, we observe local new particle formation (NPF) events (observed from ∼ 1 nm) evident from the increase in cluster ions (1.5–3 nm) and nucleation-mode particle (2.5–25 nm) concentrations, especially in spring and summer. These events, mediated by sulfuric acid, contribute to increasing the UFP number concentration, especially in the nucleation mode. Besides NPF, the chemical processing of particles emitted from multiple sources (including traffic and residential wood burning) contributes substantially to the nucleation-mode particle concentration. Under the present conditions investigated here, we find that secondary processes mediate the increase in UFP concentration to levels equivalent to those in urban locations, affecting both air quality and human health.
- Article
(5562 KB) - Full-text XML
-
Supplement
(3479 KB) - BibTeX
- EndNote


Atmospheric aerosol particles are known for their adverse effects on human health and their impacts on Earth's climate. Among those, a class, namely ultrafine particles (UFPs – diameter < 100 nm), is critical, given the particles' high number concentrations (and surface area) in the atmosphere and their capability to travel deep into the human body and to deposit onto sensitive body parts, e.g., the brain (Schraufnagel, 2020; Kwon et al., 2020). Therefore, scientists have dedicated a large fraction of research to advance the understanding of the chemical composition, sources and sinks of UFPs (Seinfeld and Pandis, 2016).
UFPs are found to be more abundant close to anthropogenic source locations. Studies conducted in Switzerland have demonstrated the prevalence of UFPs closer to major roads and airports (Meier et al., 2015; Eeftens et al., 2015; Rivas et al., 2020; Bukowiecki et al., 2002), highlighting the contribution of traffic-related emissions as a significant primary source to UFPs. Additionally, Switzerland's proximity to various industrial regions in Europe underscores the role of transboundary pollution in contributing to particulate matter levels (Zotter et al., 2014; FOEN, 2021). Composition-based source apportionment studies are typically done on mass basis for e.g., PM2.5 and PM10 (particulate matter with diameters less than 2.5 and 10 µm, respectively), yet some studies focused on UFP sources by number, utilizing the different patterns and shapes of the measured UFP size distributions (Grange et al., 2021; Trechera et al., 2023; Cai et al., 2024; Chen et al., 2022; Garcia-Marlès et al., 2024a, b; Vörösmarty et al., 2024; Rivas et al., 2020; Kalkavouras et al., 2024).
Moreover, UFPs can form in the atmosphere from gaseous precursors via chemical processing. One example is new particle formation (NPF). This phenomenon is found to produce the dominant fraction of the total particle number concentration in several environments worldwide (Kerminen et al., 2018). The frequency and intensity of such events depend on various factors including meteorology, the availability of gaseous precursors and the levels of the preexisting particles acting as sinks (Nieminen et al., 2018). Previous studies on NPF have shown that sulfuric acid is the major precursor vapor contributing to the early steps of NPF within the boundary layer, especially in the presence of stabilizing bases such as ammonia and amines (Yan et al., 2021; Almeida et al., 2013; Kürten et al., 2016; Sihto et al., 2006; Dada et al., 2023). The latter are usually associated with agricultural and husbandry activities, although other sources such as traffic and industry have been reported in polluted megacities (Zhu et al., 2022). Given the abundance of agricultural activities in Switzerland, NPF is expected to be a major process and contributor to UFP. However, NPF field studies in Switzerland have been limited to short-term measurements in high-Alpine environments (at Jungfraujoch, 3580 m a.s.l.) (Bianchi et al., 2016; Manninen et al., 2010) leaving large gaps in our understanding of NPF in rural Switzerland and its contribution to the size distribution of UFPs.
The contribution of the different sources to the size classes of UFPs (cluster mode: 1.5–3 nm, nucleation mode: 2.5–25 nm, and Aitken mode: 25–100 nm) can vary depending on the type of the source, the location and the time of year. For instance, combustion processes, including vehicle emissions, industrial activities and biomass burning, typically produce UFPs rich in elemental carbon (soot) and organic compounds in the size range > 10 nm (Cai et al., 2020). Unfiltered diesel – gasoline direct injection – and gas turbine engines are known to emit a significant fraction of UFPs in the smaller size range, down to even a few nanometers, due to their high combustion efficiency (Rönkkö et al., 2017; Maricq et al., 1999; Durdina et al., 2017) but also due to lube oil ash residues and nucleating volatile material (Kittelson et al., 2004). Other sources, natural or anthropogenic, e.g., road-dust resuspension, dust storms, wind-blown pollen and plant debris, can mechanically produce coarse particles that have little to no contribution to UFPs. On the other hand, vapors associated with natural and anthropogenic activities contribute to secondary aerosol formation and growth, substantially affecting the number size distribution of UFPs (Kulmala et al., 2004; Ma and Birmili, 2015; Sun et al., 2024).
In this study, we delve deeper into the outdoor sources of UFPs observed in Payerne, a typical rural location in Switzerland. We go beyond the traditional characterization of the site based on PM2.5 by identifying and quantifying the sources of UFPs, be it primary or secondary. For doing so, we rely on comprehensive long-term particle (and ions) number distribution measurements at the location, starting from ∼ 1 nm particle diameter. To distinguish between the size-segregated primary and secondary particles, we applied a measurement technique that uses a catalytic stripper. Together with available measurements of meteorological parameters and trace gases, we could characterize (secondary) NPF events at Payerne and quantify their frequency and intensity, as well as the role of agriculture in providing the vapors responsible for their occurrence, and the contribution of such events to the UFPs at the location. Besides NPF, the secondary fraction of particles resulting from the atmospheric processing of available particles (be it primary or secondary) was quantified. The identification and quantification of primary and secondary sources of UFPs, in such a typical rural location in Switzerland, are pivotal steps allowing for targeted interventions to control UFP emissions and reduce pollution and thus exposure risks.
2.1 Measurement location
The measurements were conducted at MeteoSwiss aerological station Payerne (46.812° N, 6.942° E; 491 m a.s.l.) in the canton of Vaud, Switzerland. The station hosts long-term observations for a variety of programs like SwissMetNet, ACTRIS (The Aerosol, Clouds and Trace Gases Research Infrastructure), NABEL (National Air Pollution Monitoring Network), BSRN (Baseline Surface Radiation Network), GAW (Global Atmosphere Watch Program) and GRUAN (GCOS Reference Upper-Air Network). The station is about 1 km southeast of the village of Payerne and roughly 500 m north of a major regional road and about 4 km south of the national highway (A-1) and Payerne military airport (Fig. S1a in the Supplement). In 2023, the village of Payerne had a total area of 24.19 km2 and a population of roughly 10 500 people. The Tropospheric Ozone Assessment Report Activity categorized the Payerne station as a rural site, based on satellite-retrieved NO2 column concentrations, the surrounding population density and the intensity of nighttime lights (Schultz et al., 2017). The Payerne site is also part of the European Monitoring and Evaluation Programme (EMEP) (Tørseth et al., 2023). EMEP's siting criteria require large spatial representativeness, meaning that monitoring sites are only little influenced by local processes such as emissions, sinks or topographic features (EMEP/CCC, 2001). Consequently, lower aerosol mass concentration compared to the other urban and suburban stations of the NABEL network is observed – an average hourly PM2.5 concentration of 9.2 ± 8.0 µg m−3 during our measurement period. As for the site itself, shown from the land use map (Fig. S1b), croplands and grasslands surround the measurement station resulting in contributions from agricultural practices. The station is located slightly uphill and elevated (∼ 40 m) above the adjacent emission sources (village, roads and airport).
2.2 Measurement instrumentation and details
A summary of all instruments used for this study is shown in Table S1 in the Supplement. The investigated period covers the time between July 2020 and July 2021 when routinely performed monitoring activities were complemented by additional aerosol number size distribution and NPF analyses. All data shown below are reported in central European time (CET; i.e., UTC+1).
2.2.1 Meteorology and boundary layer height
In situ global radiation, temperature, precipitation, wind speed and wind direction data were obtained from the SwissMetNet (https://opendata.swiss/de/dataset/automatische-meteorologische-bodenmessstationen, last access: 26 September 2024), the automatic measurement network of MeteoSwiss. Temperature and wind speed profiles originate from the EMER-Met (Emergency Response Meteorology) network. The mixing layer height (MLH) was estimated from the temperature profile measured by the MicroWave Radiometer (MWR; HATPRO-G2, produced by RPG Radiometer Physics GmbH) and the wind speed profiles measured by the Radar Wind Profiler (WP; PCL1300, produced by Degreane) by the bulk Richardson method that takes potential energy and wind shear into account (Collaud Coen et al., 2014). During nighttime, when the MLH is lower than the first level of measurement of the MWR, the data are unavailable, resulting in a slight overestimation of the average MLH.
2.2.2 Trace gases
A suite of trace gases such as ozone (O3), nitrogen dioxide (NO2), sulfur dioxide (SO2) and ammonia (NH3) were measured at Payerne (Bundesamt für Umwelt, 2023). For the period of interest here, surface O3 was monitored by UV absorption photometry (Thermo Scientific 49i), NO2 was measured by chemiluminescence (Thermo Scientific 42i TL), SO2 was measured by UV fluorescence (Thermo Scientific 43i TLE) and NH3 was detected by cavity ring-down spectroscopy (Picarro Inc., G2103). Details about the measurement procedures for the individual species can be found in the NABEL's technical report (EMPA and BAFU, 2023). The terminology “concentration” used throughout the paper refers to the mixing ratio of the trace gases (in ppb) unless specified otherwise.
2.2.3 Particle number size distribution measurements
The particle number size distribution between 2.5 and 470 nm was measured using a neutral cluster and air ion spectrometer (NAIS) and a scanning mobility particle sizer (SMPS) placed in parallel. The NAIS measured the particle number size distributions between 2.5 and 42 nm, whereas the SMPS (TSI3034) measured the size range between 10 and 487 nm, in 3 min time resolution. A condensation particle counter (CPC 3022) was also deployed, with a lower cut-of diameter (D50 %) of 7 nm and 1 s time resolution. In addition, the number size distribution of naturally charged positive and negative ions in the size range of 0.8–42 nm was measured using the NAIS.
The SMPS data inversion software accounted for multiply charged particles. Furthermore, a size-dependent correction factor for the CPC counting efficiency and particle losses within the instrument and inlet lines was applied to the data (Durand et al., 2023). The NAIS is expected to overestimate the particle concentration by up to a factor of 10, with charging being the major source of uncertainty (Kangasluoma et al., 2020; Gagné et al., 2011). Here, the ratio of SMPS to NAIS in the overlapping size range 20–30 nm (highest detection efficiency size range for both instruments) was used to derive a correction factor for the NAIS. Based on the 50 % cumulative distribution function of the ratio, the NAIS was found to overestimate the concentration by a factor 3.5 (25th and 75th percentiles were 2.5 and 5.8, respectively). For consistency, a constant factor of 3.5 was applied to the entire NAIS data set before combining the data with the SMPS. An example during an NPF event and another during a nonevent day are shown in Fig. S2, respectively. The complete size distribution was obtained by combining NAIS data at small particle diameters with SMPS data at larger diameters. The cut-off diameter was chosen to be 25 nm until 31 May and 12 nm after that due to unreliable data from the NAIS for diameters > 12 nm, resulting from a dirty, malfunctioning electrometer. NAIS data were available between 9 October 2020 and 31 July 2021. Please refer to Table S1 for data availability.
We define four classes of particles based on the combined size distribution measurements. Ultrafine particles are defined as all particles with diameters less than 100 nm, Aitken-mode particles have diameters between 25 and 100 nm, nucleation-mode particles have diameters between 2.5 and 25 nm, and cluster ions have diameters between 1.5 and 3 nm.
2.2.4 Particle number size distribution of non-volatile particles
An additional SMPS (TSI3938) was placed behind a catalytic stripper to measure the non-volatile particles in the size range 6–110 nm, in 1 min time resolution. The catalytic stripper (CS015, Catalytic Instruments GmbH) has an operating gas temperature of 350 °C, which evaporates the volatile particles, allowing the fraction of non-volatile particles to be measured by the SMPS. The design of the instrument used is based on a design widely used in emissions measurements in the automotive industry, where strict requirements exist for volatile removal to report solid particle numbers. This instrument can remove more than 99.9 % of 30 nm tetracontane particles at inlet mass concentrations up to 1 mg m−3 (Andersson et al., 2007). While such extreme exhaust conditions – characterized by very low volatility material and high particle concentrations – are not observed in Payerne, the volatile removal efficiency is expected to be even higher for the data we report. The catalytic stripper was combined with an automated switching system that alternated, automatically, between total and non-volatile particle measurements every 5 min. Non-volatile size-distribution data were available between 19 December 2020 and 3 March 2021. Please refer to Table S1 for data availability.
2.2.5 Equivalent black carbon
Equivalent black carbon concentrations were determined from an aethalometer (Model AE31; Magee Scientific Inc.) measuring at seven wavelengths (370, 470, 520, 590, 660, 880, and 950 nm), with a time resolution of 5 min. In this study, we use the 880 nm channel, hereafter referred to as black carbon (BC). Data processing followed GAW/ACTRIS recommendations and included corrections for filter loading and multi-scattering effects (Zanatta et al., 2016).
3.1 Brightness parameter
The brightness parameter (B) is a parameter used to estimate the degree of cloudiness at a certain location. It is defined by the fraction of the total solar radiation reaching the measurement site where the only blockage considered is existing clouds (Dada et al., 2017; Sánchez et al., 2012). Hence, the ratio of the measured global radiation to the theoretical maximum solar radiation at the top of the atmosphere is used to calculate B:
The larger the B value, the fewer clouds are in the sky and the more radiation arrives at ground level. Complete cloud cover is defined as B < 0.3, and clear sky is defined as B > 0.7.
3.2 BC concentration as a tracer for primary particles
For determining the relative contributions of primary and secondary particles to the size-segregated particle concentrations over the full year of measurements, we use the empirical method suggested by Rodríguez and Cuevas (2007) and modified by Kulmala et al. (2016) that uses BC mass concentration as a tracer for primary particles. Using this method, the concentration of primary particles, Nprimary, is estimated from measured BC concentrations using the following equation:
Here, S1 is the semi-empirical scaling factor derived from the ratio of particle concentration to BC. S1 is determined as the minimal N-to-BC ratio or a low percentile (e.g., 0.1 %, 1 % or 5 %) of all observed N-to-BC ratios. The concentration of secondary particles, Nsecondary, is obtained from the difference of total particle number concentration in the selected mode (N) and the primary fraction (Nprimary):
The fractions of primary and secondary ultrafine- and accumulation-mode particles derived from this method were compared to the corresponding fractions determined by the non-volatile particle measurement method described in Sect. 2.2.4 over the 3-month period when the catalytic stripper (Sect. 2.2.4) was deployed.
3.3 New particle formation event classification
Days in Payerne were classified into NPF event or nonevent days depending on the evolution of their particle number size distributions. Here, we followed the traditional method introduced by Dal Maso et al. (2005) and modified by Dada et al. (2018) to distinguish between local and transported events based on the size distributions below 3 nm. Here, we combined both aforementioned methods yet tailored them to fit our measurement location better, which is subject to traffic emissions, as the previous two methods were developed for the boreal forest environment. Our classification scheme is shown in Fig. S3. In brief, NPF events are recognized by the appearance of particles in the nucleation mode exhibiting signs of growth. Five classes were defined in our study. Local events (1) are those observed to start in the sub-3 nm range (i.e., hourly averaged concentration of 1.5–3 nm ions > 20 cm−3), while transported events (2) are those observed starting at larger sizes (i.e., hourly averaged concentration of 7–25 nm particles > 3000 cm−3), indicating their transportation to the measurement location (horizontally or vertically). Alternatively, some events are observed to start at small sizes (sub-3 nm) but fail to grow past a couple of nanometers. These events are referred to as bumps (3). Days during which none of the aforementioned phenomena were observed are considered nonevent days (4). Days which are affected by rain (rain rate > 0 mm) or high traffic influence (determined as NO2 concentrations > 3 ppb) are classified as undefined days (5), as an NPF event cannot be visually inferred. We note that the traditional regional events known as “banana-shaped” events could be either (a) local + transported, i.e., we observe the evolution of the particles starting from the sub-3 nm diameters and growing into the shape of the banana where they merge with regional NPF events, or (b) only transported to our site where they are observed as a regional event but do not have a tail extending to the sub-3 nm region. In the case of Payerne, we did not observe any events that did not extend to the sub-3 nm size range, and hence all regional events are a combination of local nucleation and transported events.
3.4 Condensation and coagulation sinks
The condensation sink, CS, is the rate at which gaseous precursors are lost to preexisting particles. Here, the CS for sulfuric acid was calculated using the SMPS data following the method described in Kulmala et al. (2001, 2012). The coagulation sink (CoagS) describes the rate at which freshly formed particles are lost to preexisting particles. In this study, the CoagS was calculated using the combined size distribution (see Sect. 2.2.3) following the method described in Kulmala et al. (2001) and was used as an input for the calculation of particle formation rates (Sect. 3.6). The equations for calculating the CS and CoagS are shown in the Supplement.
3.5 Particle growth rates
Particle apparent growth rates (GRs) were calculated using the 50 % appearance time method from the positive ions' number size distribution data measured by the NAIS (Dada et al., 2020a). Positive ions were chosen for the GR calculation as those have been found to be more important than the negative ion when it comes to ion-induced nucleation from biogenic precursors (Baalbaki et al., 2021; Bianchi et al., 2021). In addition, in a location such as Payerne, where the dominant nucleation mechanism is neutral H2SO4–amine clustering (shown later in Sect. 4.4.3), the transition from charged to neutral clusters is very short, resulting in little to no difference between the growth rates retrieved from charged particles and those retrieved from total (charged + neutral) particles (Huang et al., 2022; Gonzalez Carracedo et al., 2022). The method relies on determining the times when the concentration in each size bin reaches 50 % of the maximum concentration. In this study, the GRs for the size classes 1.5–3, 3–7 and 7–15 nm were determined. The growth rates were also used in the formation rates' calculation in the next section.
3.6 Particle formation rates
Particle formation rates at 2.5 nm (J2.5) were calculated using the balance equation described in Kulmala et al. (2012) where the change in concentration of particles within a certain size bin (here 2.5–7 nm) depends on the particle sources (NPF) and the available sinks, here coagulation sink (CoagSDp) and growth out of the size bin.
Dp represents the lower diameter of the bin (here 2.5 nm), NDp is the particle number concentration inside the size bin (2.5–7 nm), and GR is the growth rate of particles out of the bin (GR7). ΔDp is the difference between the upper and lower ends of the size bin of interest (here ΔDp = 4.5 nm). However, during the events for which a GR could not be calculated, given the change of air mass or the interruption of the growth, or during nonevent days, we used a median growth rate of all the events in the same month to estimate the formation rate. Such an estimation is valid given the similarity in particle GR regardless of the occurrence or intensity of NPF; see also Kulmala et al. (2022).
3.7 Extrapolation of particle formation rates
The particle formation rates at J1.5 were extrapolated from J2.5 following the analytical formula derived by Kerminen and Kulmala (2002):
where γ is a coefficient with an approximate value of 0.23 m3 nm2 s−1 derived from the ratio between GR and CS′ (Eqs. 11 and 13 in Kerminen and Kulmala, 2002). Here, Dp1 = 1.5 nm, Dp2 = 2.5, and GR between 1.5 and 3 nm is calculated as GR2.5−7 divided by 3 (Kulmala et al., 2013). In addition, CS′ = 4, where CS is the condensation sink, described in Sect. 3.4, and D is the sulfuric acid diffusion coefficient.
We find that the exponent term in our case, where CSaverage = 0.005 and GR2.5−7 nm(average) = 3.4 nm h−1, is 1.0002 and hence expect that J2.5 ∼ J1.5. In Fig. S4, we show a histogram of the ratio of J1.5 to J2.5 in 5 min time steps and find that the ratio falls between 1 and 1.04, concentrated at 1. Therefore, for the rest of the analysis, J1.5 is approximated as measured J2.5.
3.8 Sulfuric acid proxy (H2SO4,proxy)
The sulfuric acid proxy was calculated based on the sources and sinks of sulfuric acid in a rural environment setting as discussed in Dada et al. (2020b). The main source of H2SO4 in the gas phase is the oxidation of SO2 by the hydroxyl radical (OH), while its sinks are mainly the loss of H2SO4 onto preexisting particles, CS, as well as its loss to cluster/particle formation (Dada et al., 2020b). Since OH concentrations were not measured due to instrument limitations, global radiation was used as an OH proxy (Dada et al., 2020b; Petäjä et al., 2009). The equation is as follows:
where k1 and k3 are coefficients specific for rural locations, representing the H2SO4 production from SO2 in the presence of radiation and loss of H2SO4 to clustering, and are 0.92 × 10⁻⁸ m2 W−1 s−1 and 2.21 × 10⁻⁹ cm3 s−1, respectively (Dada et al., 2020b).
3.9 Contribution of NPF to UFP
The contribution of NPF events to UFP concentration could be calculated as suggested by Sun et al. (2024):
where denotes the integrated diurnal of the difference between UFP concentration between events and nonevents under high radiation (low radiation). nNPF−HR (nNPF−LR) and nNON−HR (nNON−LR) denote the number of high-radiation (low-radiation) days with and without NPF events, respectively. We note that similar to Sun et al. (2024), days are separated into high-solar-radiation and low-solar-radiation days by a threshold of daily average global radiation of 100 W m−2.
4.1 Characterization of the Payerne site
4.1.1 Meteorology
Payerne, a typical rural location in Swiss midlands, experiences a temperate climate characterized by distinct seasonal variations in terms of temperature and precipitation (Figs. S5–S6). Winter, between December and February, is relatively dry compared to spring, between March and May, which witnesses increased precipitation and the emergence of blooming vegetation. Summer, spanning June to August, is occasionally interrupted by short bursts of heavy rain from thunderstorms occurring mostly in the afternoon. Autumn, covering September to November, experiences increased precipitation, as temperatures cool. Solar radiation and cloudiness levels follow the seasonal pattern, with higher levels in summer and lower levels in winter and autumn (Figs. S5–S6).
4.1.2 Variability of trace gases
The diurnal cycles (Fig. 1) and the time series (Fig. S7) of the trace gases with dominant sources from fossil fuel combustion, traffic, residential wood burning and industrial activities (NO2, SO2) reflect the rural conditions at Payerne. Concentrations are lower compared to the ones observed at urban locations within the Swiss national network (Bundesamt für Umwelt, 2023). However, short-term variability in the time series and the diurnal patterns indicates some influence from local to regional processes.
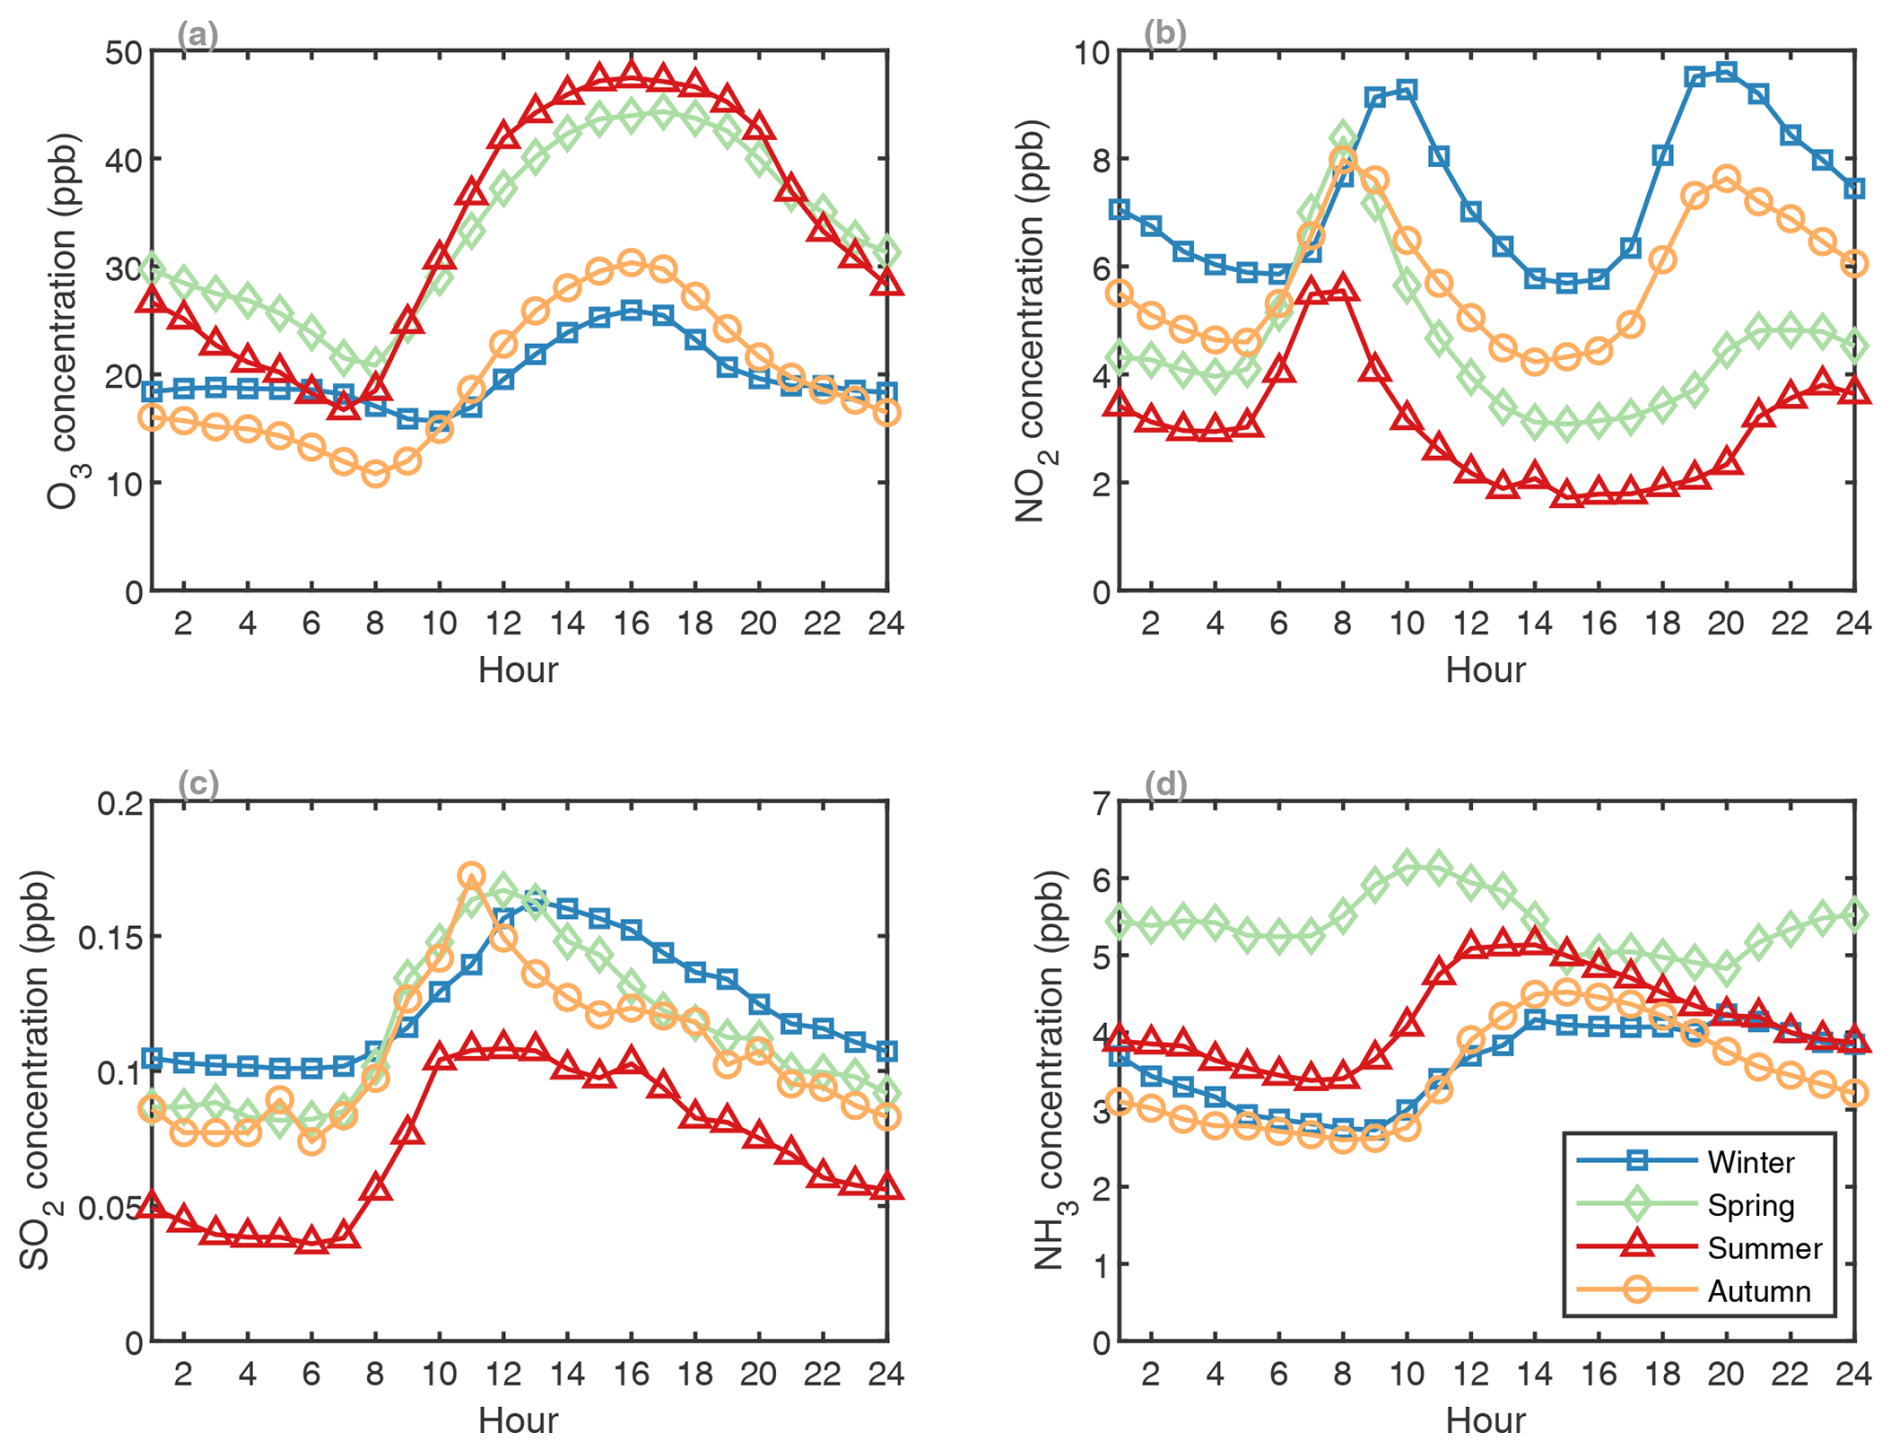
Figure 1Seasonal diurnal averages of trace gases in Payerne. See Fig. S6 for the full-year time series.
Ozone concentrations are influenced by various factors, such as sunlight, temperature and concentrations of other pollutants such as volatile organic compounds and NO2, with generally higher levels observed in spring and summer. For the gaseous pollutants NO2 and SO2, it is common for rural areas to have lower concentrations compared to urban environments (EEA, 2023), yet their concentration can be influenced by various factors, including agricultural practices, traffic, local industrial activities and long-range transport (Jion et al., 2023; EEA, 2023). Traffic emissions are a major source of NO2 indicated by the sharp increase in NO2 during the morning and evening rush hour (Figs. 1, S7), although other sources such as residential wood burning and use of fertilizers in agriculture could affect the concentration (Jion et al., 2023). NO2 is observed in higher concentrations on workdays compared to weekends, in line with the higher traffic volumes on workdays (Fig. S8b), further confirming the major contribution of traffic emissions to NO2 concentration in Payerne. The variation between the different seasons is attributed to a shallower boundary layer in winter, leading to accumulation of NO2, compared to better dispersion and vertical mixing during summer (Fig. S9).
Compared to nitrogen oxides, SO2 concentrations are influenced by fossil fuel combustion but also long-range transport (Vestreng et al., 2007). Given the proximity of Payerne Airport to our measurement location, we inspected the direct contribution of airport emissions on SO2 concentrations. We note that Payerne Airport handles an average of 754 civil flights per year, significantly fewer than Zurich Airport, which accommodates around 22 300 flights annually (averages for 2019–2021, Business Aviation Study Switzerland 2022). However, Payerne is the major military airport of Switzerland and has a lot military flight operations. Specifically, we did the following:
-
compared the SO2 concentrations during workdays and weekends (Fig. S8a);
-
inspected the SO2 concentration when the wind direction arriving at our measurement station was from the airport (Fig. S8c);
-
studied the SO2 concentrations during periods of airport holidays (Fig. S8d); and
-
compared the concentrations of SO2 in Payerne to those at Rigi-Seebodenalp, which is approximately 185 km away from Payerne and at an altitude of 1031 m a.s.l. (Fig. S8e).
Our results show that while we cannot completely rule out the contribution of the airport activities on SO2 concentrations observed at Payerne station, the evidence indicates that there is no substantial enhancement of SO2 when airport activities are taking place. For instance, we observe similar levels of SO2 on workdays and weekends (Fig. S8a), compared to the lower median NOx concentrations on weekends compared to workdays (Fig. S8b), which are associated with a decrease in traffic intensity. However, we do observe a decrease in the extreme concentrations of SO2 on weekends compared to workdays (Fig. S8a). Moreover, although wind arriving from the airport direction (NW: 300–340°) does show elevated SO2 concentrations, the higher concentrations are not exclusively related to this particular wind direction (Fig. S8c), as the village of Payerne is also located north-northwest of our measurement site (Fig. S1). Similar to our observation during weekends, SO2 concentrations do not drop significantly during airport shutdown periods (Fig. S8d), particularly during 2020. Overall, these observations point towards other sources of SO2 emissions, mostly related to energy use and supply (EEA, 2023). The latter conclusion is further verified by a direct comparison between SO2 concentrations in Payerne and Rigi-Seebodenalp. Similar SO2 levels are observed at the two sites throughout the year except during winter, when higher concentrations are observed in Payerne due to a shallower mixing layer height (Fig. S9) together with increased local SO2 emissions from heating sources (EEA, 2023).
On the other hand, ammonia (NH3) is expected to show higher concentrations in rural environments subject to agricultural practices, such as manure and fertilizer applications (Reche et al., 2022; Grange et al., 2023). In Payerne, the highest NH3 concentrations are observed in spring, with a sharp peak in March when farmers prepare the first fertilization after winter and snow melt (Figs. 1, S7). In addition, warmer temperatures and longer days promote the release of ammonia (Fig. S10) (Pedersen et al., 2021). The distinct diurnal pattern of NH3 concentrations during spring, i.e., earlier morning peak and increase during nighttime, could be attributed to farming activities such as fertilization and grazing, which peak at dawn and dusk. In autumn, as harvesting is completed, we observe a decrease in ammonia emissions, although post-harvest practices and the decomposition of crop residues can still contribute to the overall NH3 concentration. Winter generally witnesses reduced agricultural activity, leading to lower ammonia emissions. The colder temperatures limit volatilization from soil and other surfaces; however, other sources such as traffic and fossil fuel combustion which emit NH3 as a byproduct might become more important (Reche et al., 2022).
4.2 Ultrafine particles at Payerne
UFPs in Payerne have multiple sources, some of which are primary (e.g., traffic) and some of which are secondary (e.g., NPF). Such sources are expected to have a strong diurnal and day-to-day variability as we observe a strong variation in the number concentration within each month sometimes exceeding 2 orders of magnitude (Fig. S11). Regardless, throughout the year, we observe a constant background of ∼ 4000 cm−3 UFPs (Fig. 2a) along with distinct diurnal patterns on top of this background, suggesting considerable contribution from local UFP sources. Our measured UFP concentrations resemble those measured in rural and suburban locations around Europe (Trechera et al., 2023). The Aitken mode contributes around half of the total UFP background and shows very little seasonal variability (Fig. 2c). In contrast, the nucleation mode, which also contributes about half to the UFP background, exhibits a distinct increase during daytime, making it the dominant contributor to total UFP and driving the variability in UFP concentration, especially in spring (62.4 %) (Fig. 2b). This observation indicates an important role of nearby emissions and secondary aerosol formation relative to long range transport. During all seasons, the morning and evening peaks are concurrent with rush hours and could be attributed to traffic emissions, also visible both in the nucleation mode and to a lesser extent in the Aitken mode, in line with previous studies showing the contribution of traffic emissions to these size classes (Zhou et al., 2020; Rönkkö et al., 2017). An additional midday peak in the UFP concentration, driven by nucleation-mode particles, is observed in spring and summer, indicative of NPF events taking place in warmer seasons. This conclusion is further verified by the increase in cluster ions in these months (Fig. 2d), which are indicative of local NPF, usually more abundant in spring (Dada et al., 2023, 2017) following the onset of vegetation, warmer temperatures and increased solar radiation (Fig. S6). A detailed analysis of NPF events is presented in Sect. 4.4. Although UFP number concentration data for autumn are incomplete (no data are available for the months of August and September), we expect a midday peak in the UFP concentration as observed in the Aitken-mode particles in August (Fig. S12). Given the nature of the location in Payerne (see Fig. S1), we expect the harvesting season to affect the concentration not only of the coarse particles but also of the ultrafine ones. In addition, earlier studies have shown a second wave of NPF events occurring during autumn when temperatures decrease, allowing for better condensation of gases into the particle phase (Dada et al., 2017). In the next sections we quantify the contribution of the primary and secondary sources to the total UFP concentrations.
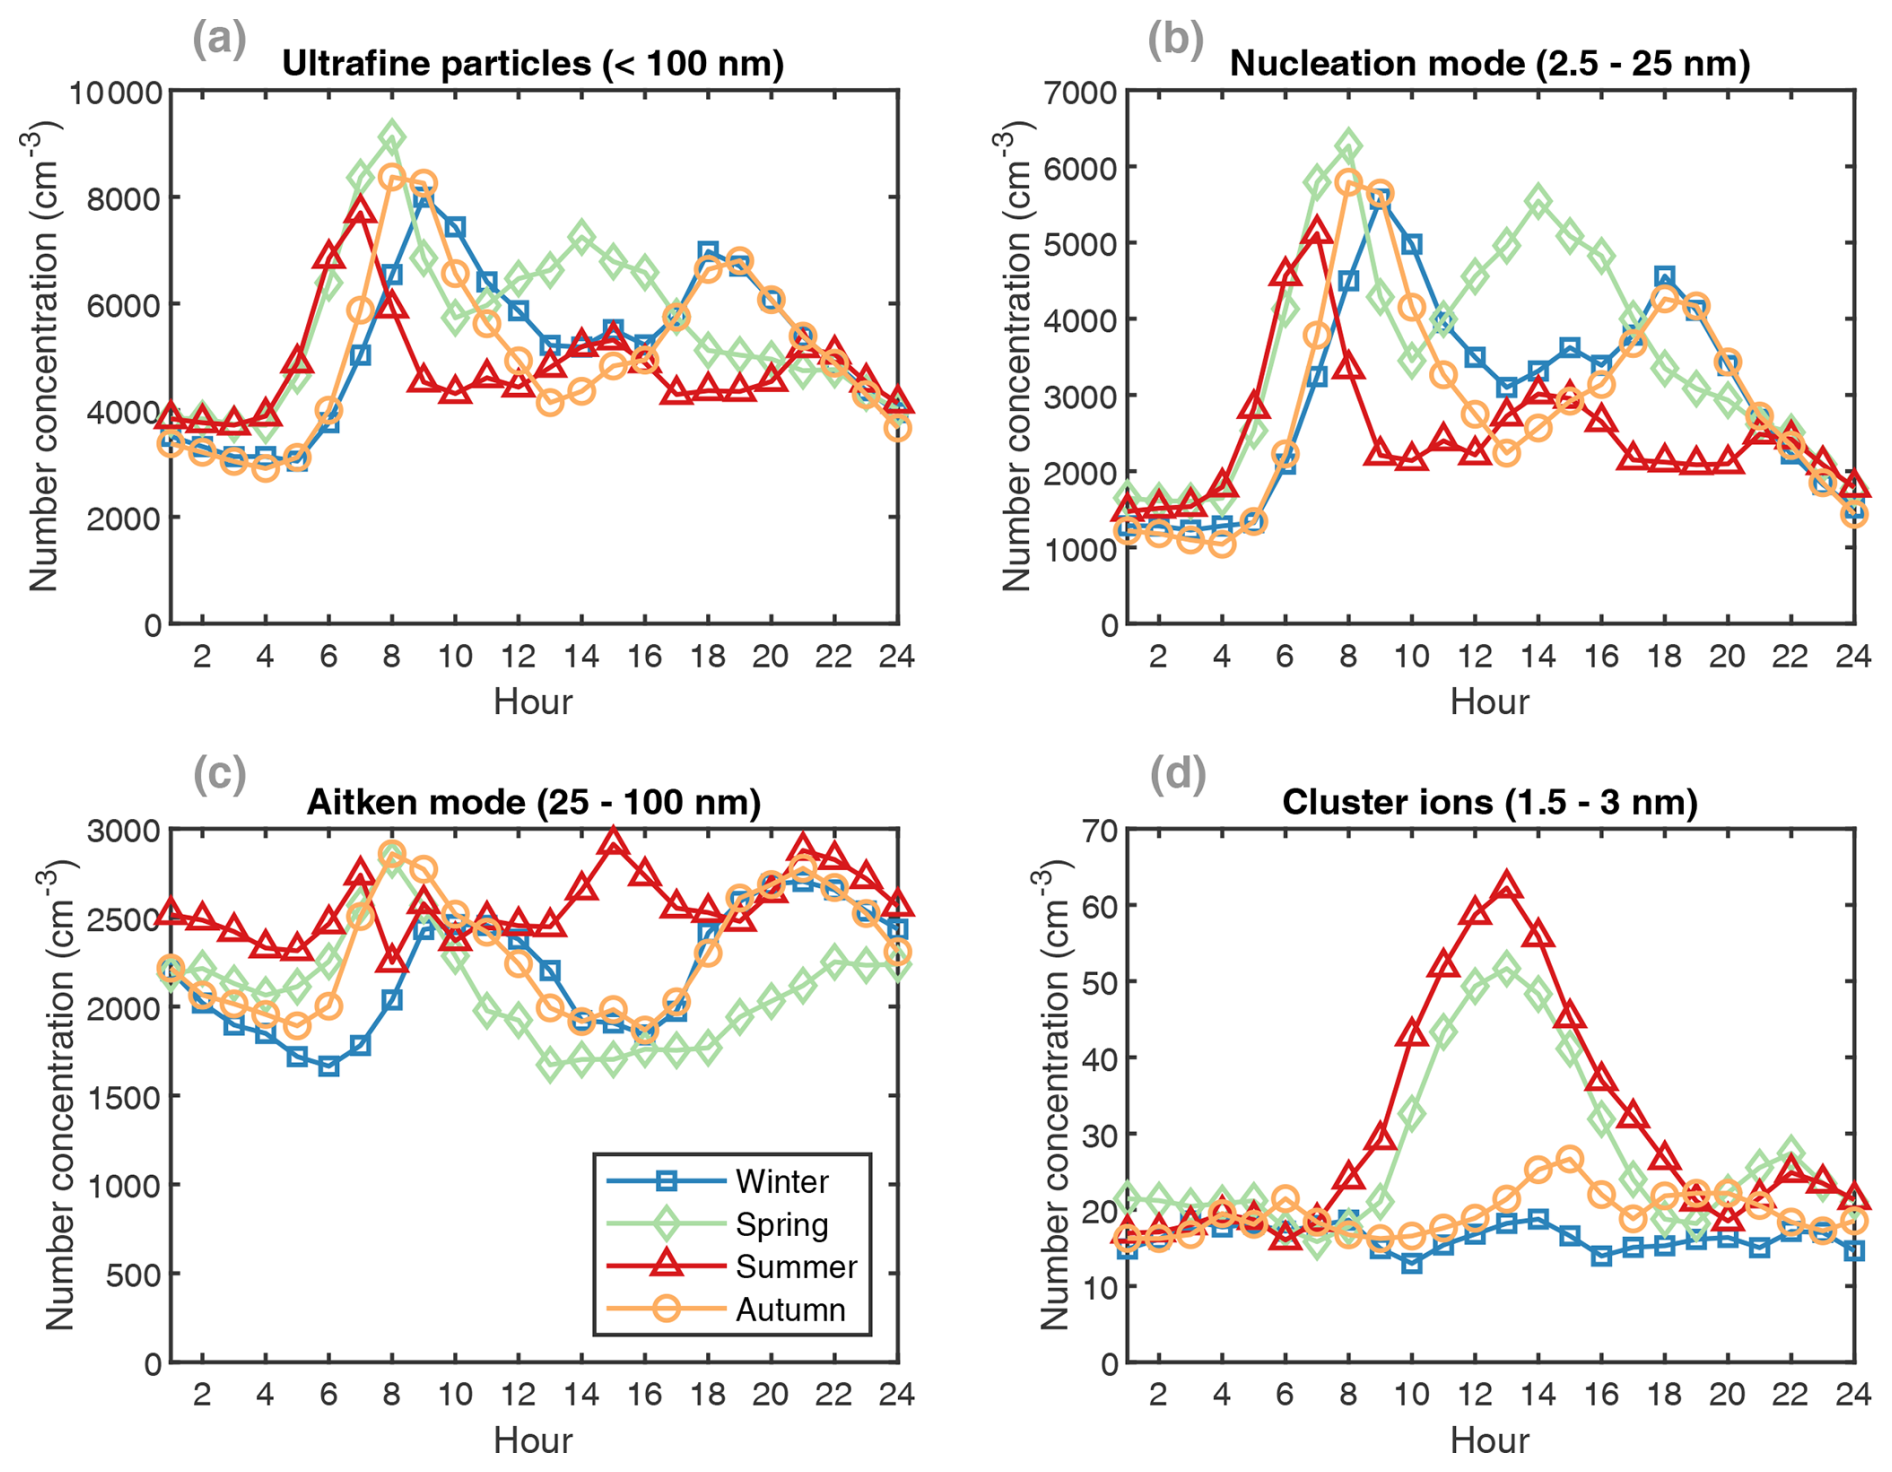
Figure 2Seasonal diurnal average concentrations of (a) ultrafine-, (b) nucleation- and (c) Aitken-mode particles and (d) cluster ions (positive) in Payerne. No data from August and September are available for the ultrafine- and nucleation-mode particles or cluster ions. For the Aitken-mode particles, July includes 2020 and 2021 concentrations. Data included in ultrafine-, nucleation- and cluster-ion-mode concentrations are in 5 min time steps (NAIS time stamp), while the Aitken-mode concentrations are in 3 min time steps (SMPS time stamp). See monthly diurnal variations in Fig. S11.
4.3 Primary UFPs at Payerne
4.3.1 Non-volatile particles
The exact differentiation between primary and secondary particles is difficult at a receptor site because it depends on a lot of factors such as residence time and precursors. Nevertheless, the size-segregated number concentration measurement with the catalytic stripper allows for a rough estimation of primary particles, since these non-volatile particles are expected to consist mainly of refractory black carbon from incomplete combustion processes (Wang et al., 2018), mostly from traffic and wood burning emissions. In this study the secondary particles are approximated as the difference between total and non-volatile particles. However, this approximation results in an overestimation of the secondary particles, since not all volatile particles are necessarily secondary in nature; for example, traffic also emits primary volatile and semi-volatile UFPs (Baltensperger et al., 2002; Saarikoski et al., 2023). In Fig. 3, we show the particle number size distribution data retrieved from the total measurement, the non-volatile measurement and their difference (secondary particles) for an example day with a strong NPF event (17 February 2021). Based on our observation, morning and evening traffic rush hour considerably increases the concentration of non-volatile particles consistent with our expectations that traffic emits black carbon particles.
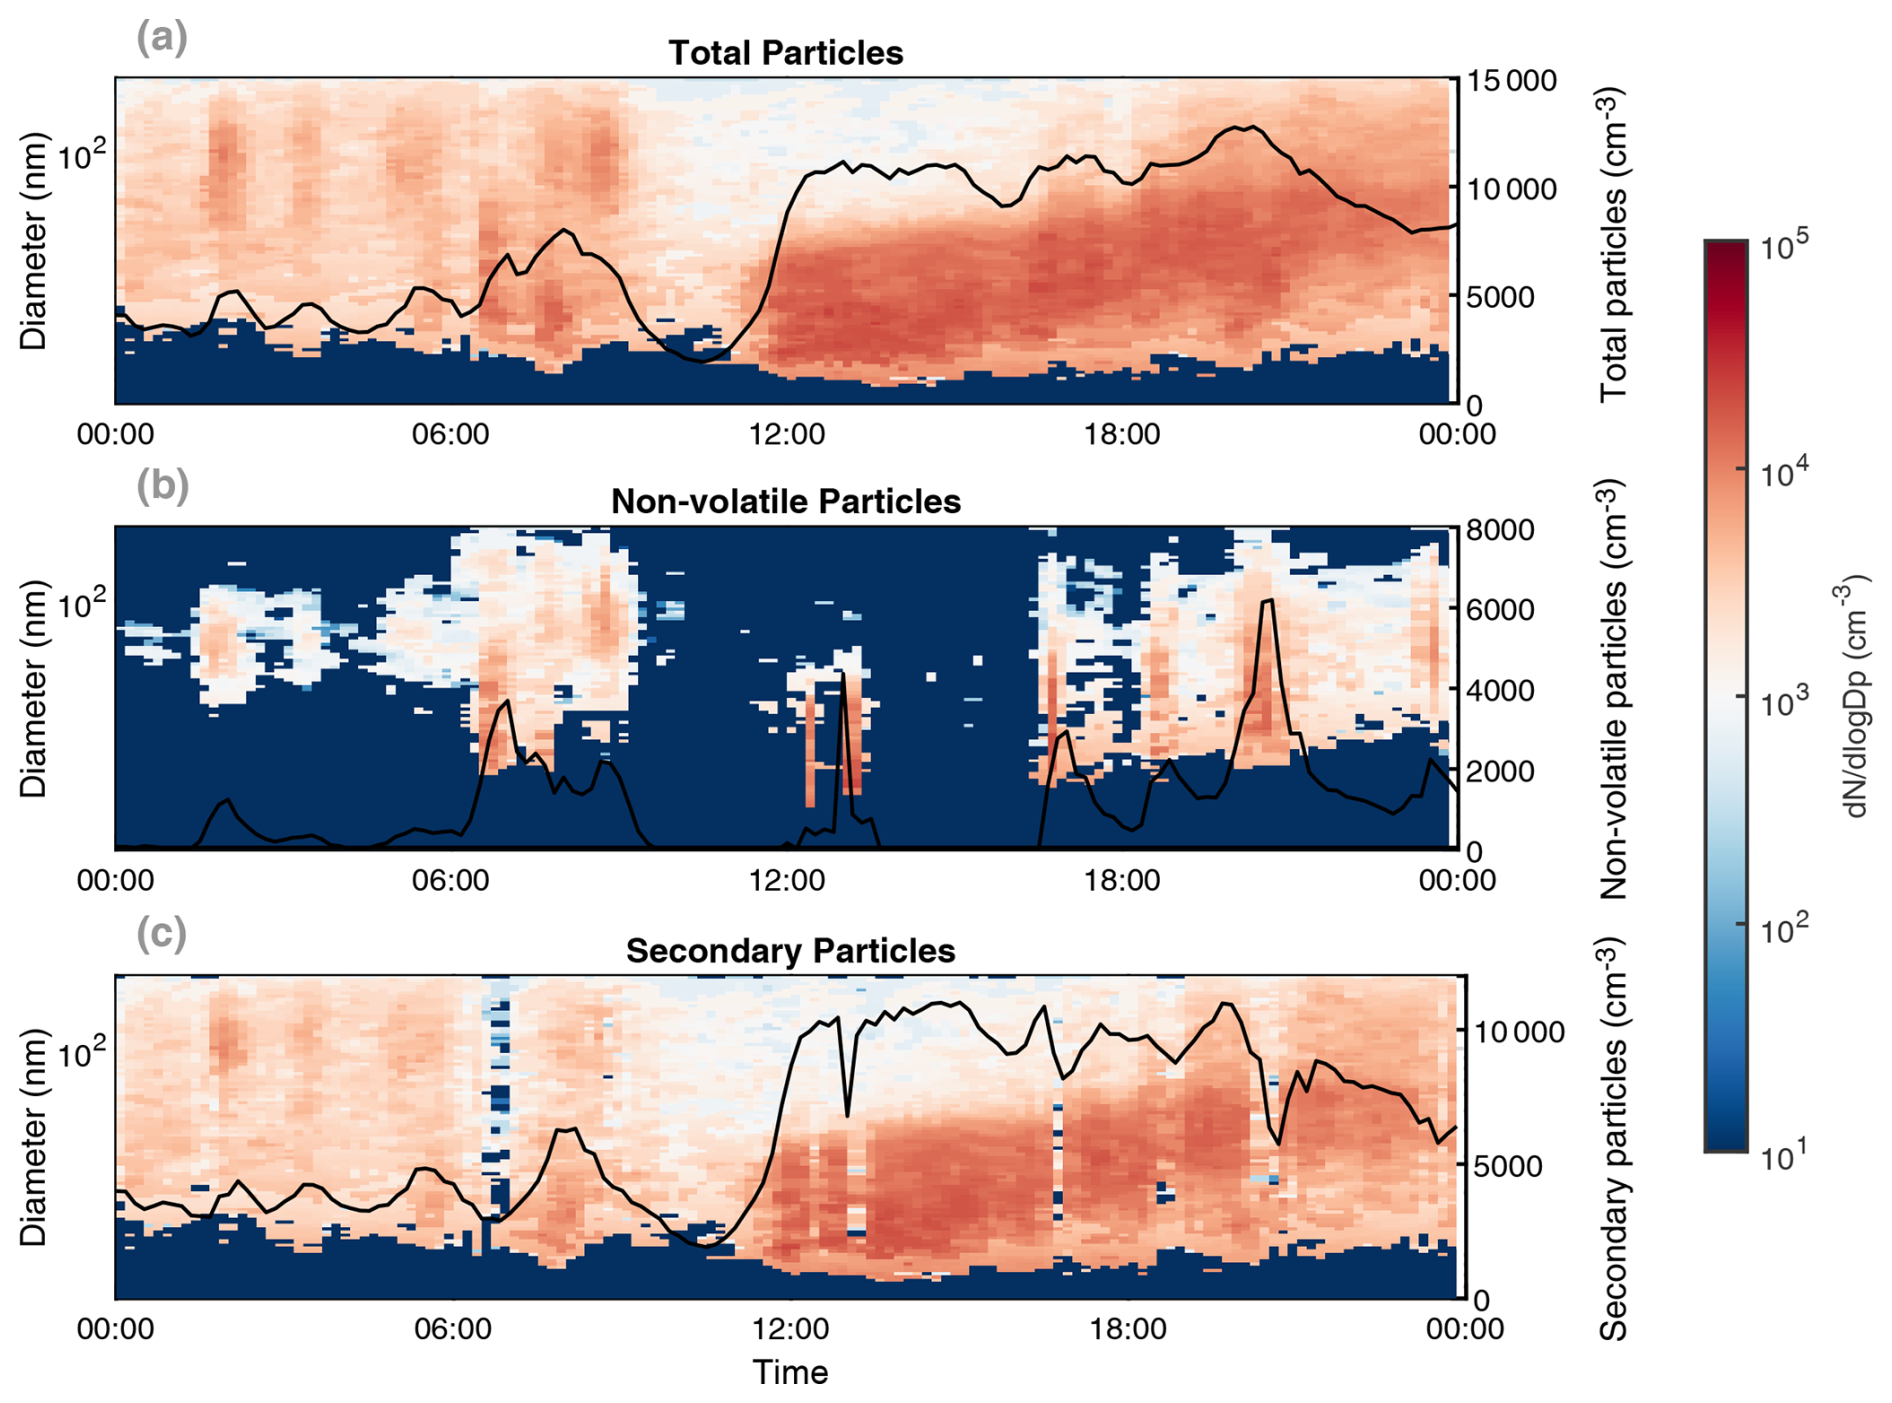
Figure 3Particle number size distribution from (a) the total measurement, (b) the non-volatile measurement and (c) their difference (secondary particles) during a strong NPF event on 17 February 2021. The solid black lines relevant for the right axis show integrated number concentrations.
Photo-chemically driven NPF starting before noon causes a distinct increase of total UFP concentration (Fig. 3a), which is entirely dominated by volatile particles as expected (see difference plot in Fig. 3c). The size distributions of the non-volatile and secondary particles show distinct behavior in which the secondary particles contribute to smaller particles' concentration in the nucleation mode and reach higher diameters because of condensational growth. Secondary processes involving condensation facilitate the growth of particles until they reach climate relevant sizes, where they can contribute to regional-scale phenomena, e.g., regional NPF and cloud condensation nuclei (Zhou et al., 2021; Dai et al., 2017).
Using the ∼ 3 months of available measurements (19 December 2020–3 March 2021), we quantified the contribution of primary particles to the total UFPs and to each of the modes (Figs. 4, S13). We find a dominance of the secondary particles on most days, except for a few cases (discussed in detail in Sect. 4.3.3). However, this method is subject to limitations including the following:
- 1.
Uncertainty on primary particles' number. Quantifying primary particles through non-volatile particle measurements produces in general a systematic low bias in estimated primary particle number as primary volatile particles are misclassified as secondary particles. However, with a smaller likelihood, under certain circumstances, the uncertainty of the primary fraction could be further compounded the opposite way by the presence of very low volatility secondary particles that survive temperatures greater than 350 °C (Wu et al., 2017; Kalberer et al., 2004).
- 2.
Uncertainty on the size distribution. Denuding volatile particulate matter from internally mixed particles with a non-volatile core reduces their diameter. This affects the size distribution of secondary particle calculated as the difference from total and non-volatile particle size distributions. Specifically, small secondary particles may be underestimated, whereas larger secondary particles may be overestimated if a substantial fraction of internally mixed primary non-volatile particles with a secondary coating is present.
- 3.
Short period. Measurements only during a short period in winter might not be representative of the full year.
Given the limitations of this method, in the next section we compare it to a previously established method which uses BC as a tracer for primary particles.
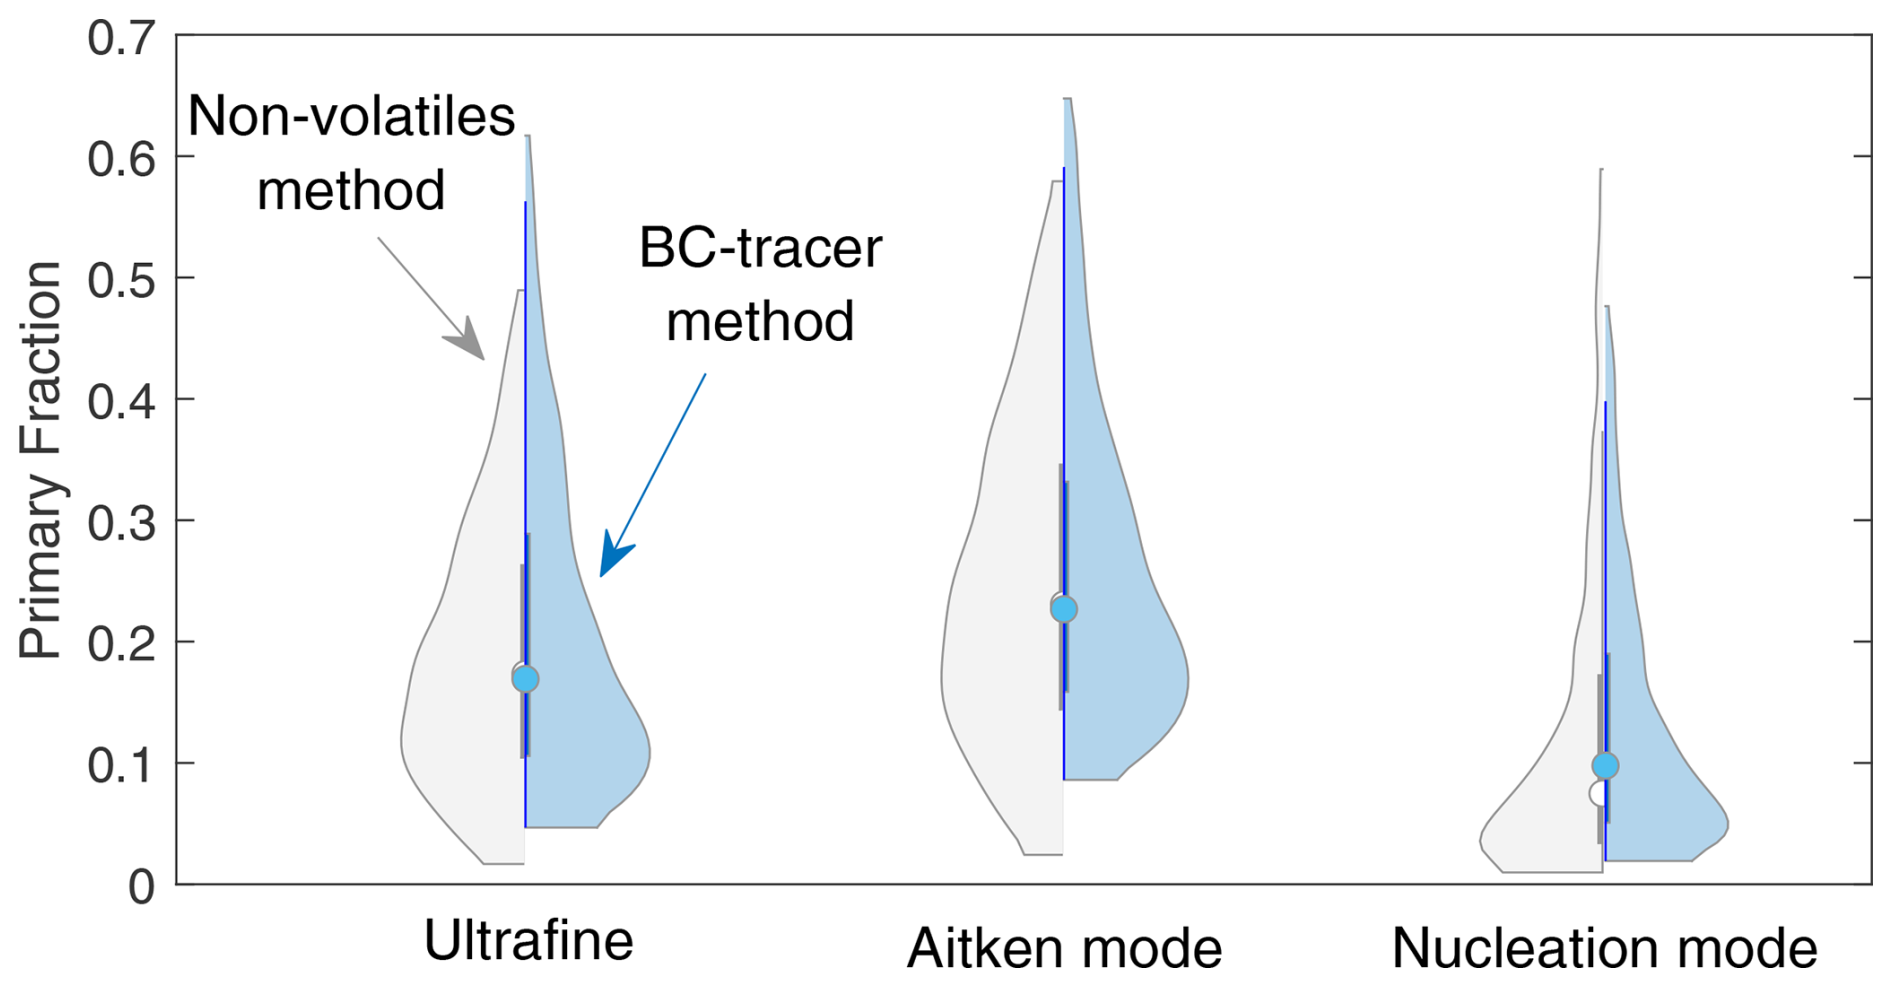
Figure 4Fraction of primary particles in the ultrafine, Aitken and nucleation modes using the non-volatile particle measurements in grey and using the BC tracer method in blue. Violin plots are a combination of box plot and a kernel distribution function on each side of the box plots. The white circles define the median of the distribution, and the edges on the inner grey boxes refer to the 25th and 75th percentiles, respectively. Plots include winter hourly averages; outliers below the 5th percentile or above the 95th percentile are excluded.
4.3.2 BC tracer method
In this section, we used BC concentration as a tracer for estimating the number fraction of primary particles (Sect. 3.2). We first compare this method to the non-volatile measurements (Sect. 4.3.1) and then extend the analyses of primary and secondary particles to the full-year measurement period. For optimizing the BC tracer method for Payerne, we assessed the sensitivity of choosing different percentiles (e.g., 0.1 %, 0.5 %, 1 % and 2 %) of observed N-to-BC ratios to infer the S1 factor in Eq. (2). The value of S1 showed low sensitivity to percentile changes, as observed in previous locations (Rodríguez and Cuevas, 2007). Since S1 is a simple factor used to estimate the number of primary particles per nanogram of BC, the low sensitivity of S1 to different percentiles directly translates to high precision of the estimated primary particle fraction (Fig. S14b). This approach does not systematically misclassify the primary volatile particles as secondary particles, but it has its own limitations. The approach is biased towards primary particle sources with the lowest NUFP-to-BC ratio, e.g., traffic-related particles (Rodríguez and Cuevas, 2007). A recent study estimated that the method leads to an overestimation of the primary vehicle exhaust particles concentrations by 18 % and 26 % in urban and suburban sites, respectively, but with no impact on secondary particles (Casquero-Vera et al., 2021). Given that traffic also has a dominant contribution to BC mass at this site (Grange et al., 2020), a potential overestimation in the traffic contribution to the total primary particles is also possible in this study. However, it must be noted that the underlying assumption of a constant NUFP-to-BC ratio will never provide accurate results in an environment where the contributions of different primary sources and the age of plumes show great diurnal and seasonal variations.
In a next step, we compared the results from both methods (Figs. 4, S15). Both methods show the best agreement when the first percentile of the NUFP-to-BC ratios is chosen as S1. The results shown in Fig. 4 demonstrate the general consistency between the results for the common measurement period, in winter, for all three size-segregated fractions. However, despite the overall agreement, certain discrepancies remain when considering time-resolved data, e.g., in diurnal patterns and time series, and are attributed to the limitations of both methods. Both approaches likely represent a low estimate of the primary particle fraction. Our results, from both methods combined, suggest that, on average, 25 % of the UFPs in winter in Payerne originate from primary processes (Fig. 4), while the remaining are formed in the atmosphere following the oxidation of precursor gases or chemical processing of available aerosol particles. Based on the BC tracer method, 2.15 (× 106) cm−3 primary particles are observed for 1 ng m−3 of BC. Our results are in line (slightly lower given the nature of our measurement location) with previous measurements in Switzerland with 3.1 × 10⁶ and 3.6 × 106 cm−3 primary particles for 1 ng m−3 of BC observed in an urban background location in Lugano and an urban location in Bern, respectively (Reche et al., 2011), although differences in vehicle fleet between locations and changes over time due to more stringent emission regulations are expected to influence this ratio. In comparison, fewer primary particles for 1 ng m−3 BC are found in Payerne compared to other European cities such as Milan, Barcelona and Santa Cruz de Tenerife, with values exceeding 4.5 (× 106) cm−3 primary particles for 1 ng m−3 of BC (Rodríguez and Cuevas, 2007). In the next section, we extend the analyses over the full year of measurements using the BC tracer method.
4.3.3 Seasonality of size-segregated primary and secondary UFPs
The longer-term results are not different from the wintertime observations: secondary particles dominate over primary ones (Fig. 5). In addition, during all seasons and for all size fractions, the higher particle concentration is associated with a higher secondary particle concentration, demonstrating the contribution of secondary processes to increasing the number of particles in the atmosphere (Fig. S16). The primary UFPs' peak in the morning and evening is concurrent with traffic rush hours, while the secondary particles show morning and evening peaks and additionally a midday peak during the spring and summer seasons (Fig. 5d). While the diurnal variability of primary UFPs is controlled by both the nucleation- and Aitken-mode particles, the seasonal and diurnal variability of secondary UFPs is driven by the nucleation-mode particles, which show a much higher contribution and variability.
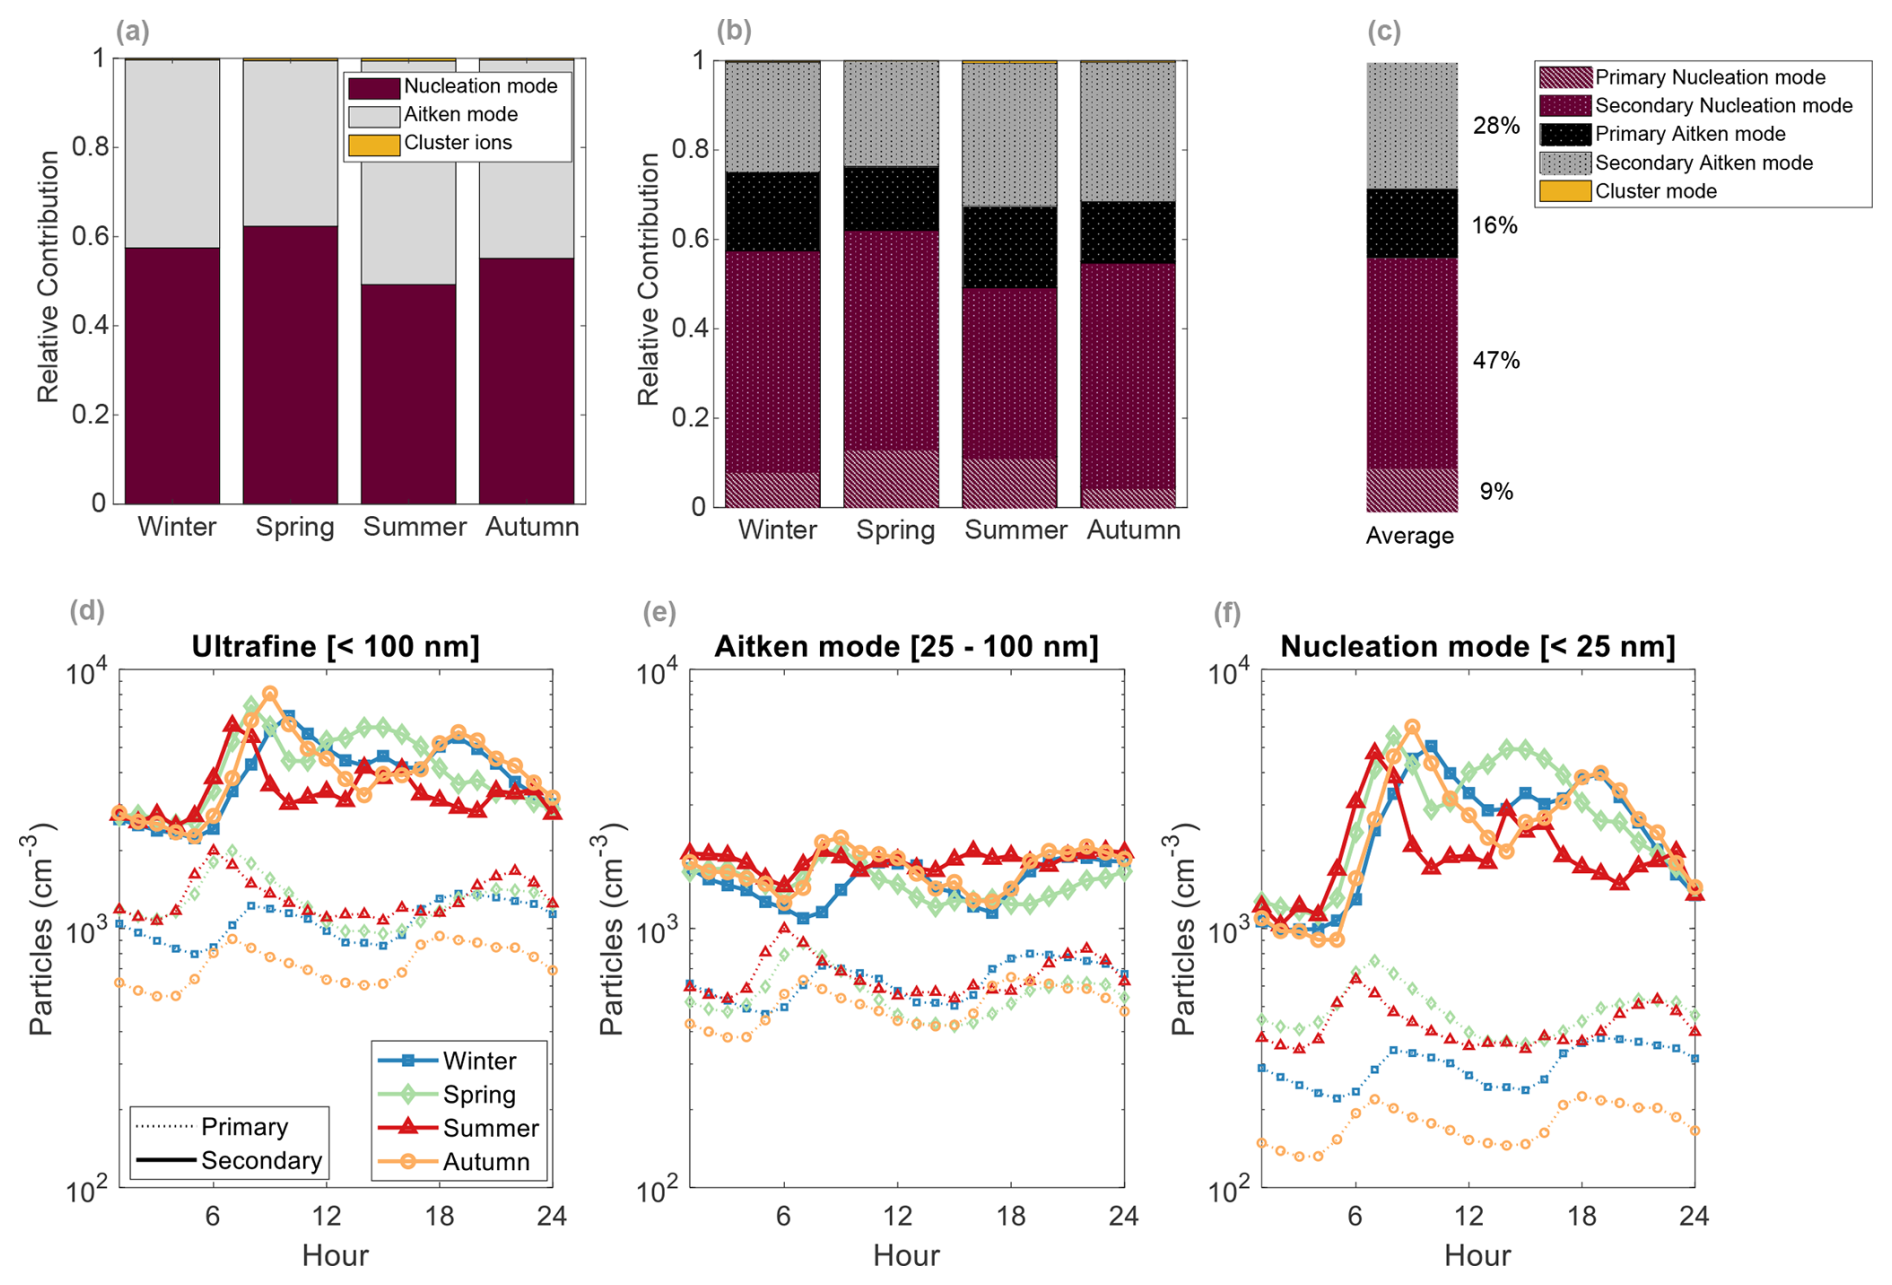
Figure 5(a) Relative contribution of each of the nucleation- and Aitken-mode particles and cluster ions to total ultrafine particle concentrations. No data from August and September are available for the nucleation-mode particles or cluster ions, affecting summer and autumn means. For the Aitken-mode particles, summer July includes 2020 and 2021 concentrations. Data included in nucleation-mode and cluster-ion-mode concentrations are in 5 min time steps (NAIS time stamp), while the Aitken-mode concentrations are in 3 min time steps (SMPS time stamp). (b) Similar to panel (a) but with the inclusion of primary and secondary fractions. (c) Similar to panel (b) for the yearly average. For panels (a), (b) and (c), the color refers to the size fraction, while the shading pattern refers to the primary and secondary fractions. (d) The particle number concentration of the primary (dashed lines) and secondary (solid lines) in the ultrafine-, (e) Aitken- and (f) nucleation-mode diurnal averages.
We find that the nucleation mode is dominated by secondary particles, with an average fraction of 84 % contribution to the nucleation mode and 47 % contribution to the total UFP (Fig. 5b–c). The primary nucleation-mode particles are about 2 times higher in concentration in spring and summer compared to the colder seasons, with two peaks related to traffic rush hour as observed for the UFPs (Rönkkö et al., 2017), consistent with increased traffic volume in summer (FEDRO, 2021). In comparison, the secondary fraction shows distinct seasonal patterns with a peak during midday only during warm seasons. Midday peaks are attributed to NPF events which are most intense during daytime – peak solar radiation (more details in Sect. 4.4). Besides the NPF related peak during midday in warm seasons, the nucleation mode also exhibits a morning (all seasons) and evening peak (fall and winter season). The evening peak could be caused by biomass burning, especially in winter (Casquero-Vera et al., 2021; Grange et al., 2020). The morning maximum of nucleation-mode secondary particles occurs 1 to 2 h after the peak of non-volatile primary traffic particles, which suggests their atmospheric processing (Fig. 5f). The time lag indicates that it is not dominated by nucleation happening immediately after emission as the hot exhaust cools. Instead, it requires the accumulation of emitted vapors and/or chemical processing of these vapors.
In the Aitken mode, compared to the nucleation mode, we observe a higher contribution of primary particles, although the average fraction does not exceed 25 % (Fig. 5c). In addition, while the primary Aitken-mode particles display rush hour peaks, the secondary particles show a rather constant diurnal cycle (Fig. 5e). Primary Aitken-mode particles originate from anthropogenic sources, i.e., traffic and residential wood burning. The secondary fraction is expected to comprise processed secondary particles emitted within a much larger spatial area (Seinfeld and Pandis, 2016).
4.3.4 Sources of primary particles in Payerne
The BC-rich particles observed at Payerne can be attributed to wood burning and fossil fuel combustion emissions and are found in the fine mode, with diameters smaller than 300 nm (Motos et al., 2020; Zotter et al., 2017; Grange et al., 2020). BC concentrations in Payerne are higher during winter compared to summer (Figs. S17–S18), attributed to the higher contribution of wood burning for heating purposes together with a shallower boundary layer (Fig. S9). Traffic is another source of BC, which is depicted in our data as two daily peaks during rush hour: morning and evening (Fig. S17). Due to the proximity of our measurement site to the airport, BC-rich particles might also be potentially attributed to airport emissions. In Fig. S18, we assess this potential influence of airport activities on the measured BC concentrations. However, like SO2, as discussed in Sect. 4.1.2, the airport contribution to BC cannot be quantified, given the complexity of the sources around the measurement site. For instance, although the BC concentration drops by a factor of 1.3 during the daytime on weekends, this decrease could be attributed to a lower road traffic density. Additionally, BC concentrations do not decrease substantially during airport shutdown periods (Fig. S18), and in general, wind arriving from the direction of the airport (NW: 300–340°) does not show elevated BC concentrations. These observations point toward a rather low influence of the airport to our BC measurements. Our findings fall in line with Grange et al. (2020), who attributed BC concentrations observed in Payerne, over the last decade, to residential wood burning and traffic emissions.
4.4 Secondary UFPs at Payerne: the role of new particle formation events
4.4.1 Frequency of NPF events
A total of 266 d were classified into the event classes (defined in Sect. 3.2) as shown in Fig. S19. Among those, 154 d were classified as nonevent constituting 57 % of the total days. Fifty-four days (20 %) were classified as local NPF event days, where the particle formation is observed starting from the smallest particles (sub-3 nm cluster ions) representing local processes. On 18 d (7 %), an increase in ions concentration was observed with no increase in the larger particles or obvious signs of growth, these days were referred to as ion bumps. Both local NPF and ion bump events tended to occur more frequently during the warmer months, with local NPF events even occurring on most days (∼ 70 %) in May, while nonevent days occurred more frequently during the colder months (Fig. S20). The remainder of the days which did not fit the categories of either nonevent, local NPF or ion bump were left undefined as these were affected either by precipitation or nearby traffic and thus elevated NO2 concentrations. We note that we did not observe any transport events at the site without a local NPF event.
4.4.2 Size-segregated growth rates
The particles formed in Payerne could grow to sizes greater than a few nanometers in most cases (local events). The median growth rates were 1.3, 3.4 and 5.0 nm h−1 for the size ranges 1.5–3, 3–7 and 7–15 nm, respectively (Fig. S19). The GRs were comparable during the seasons within the same size fraction (Fig. S21). However, although slightly higher GRs are observed in summer compared to spring, this conclusion is not certain given the low statistics (Fig. S21). Still, higher growth rates are to be expected in warmer seasons given the increased emissions of biogenic volatile organic compounds (BVOCs; in the case that the condensation sink values are similar), especially in areas surrounded by vegetation as in Payerne.
Our measured GRs in the smallest size fractions (1.5–3 and 3–7 nm) are within the range of those observed in other rural environments, such as in Puy de Dôme, France (Manninen et al., 2010); Vavihill, Sweden (Manninen et al., 2010); and the boreal forest in Hyytiälä, Finland (Yli-Juuti et al., 2011). However, the GRs of the larger sizes exceed those observed in rural background locations and resemble more rural polluted locations such as Melpitz, Germany, and K-Puszta, Hungary (Manninen et al., 2010). This observation might be attributed to the participation of anthropogenic sources (residential heating and highway close to Payerne) to the growth (Fig. S1), together with a lower CS (median CSevents = 2.6 × 10⁻³ s−1; see Fig. 6), compared to the rural polluted locations mentioned (median CSevents (K-Puszta) = 6.6 × 10⁻³ s−1 and CSevents (Melpitz) = 8.4 × 10⁻³ s−1) (Manninen et al., 2010).
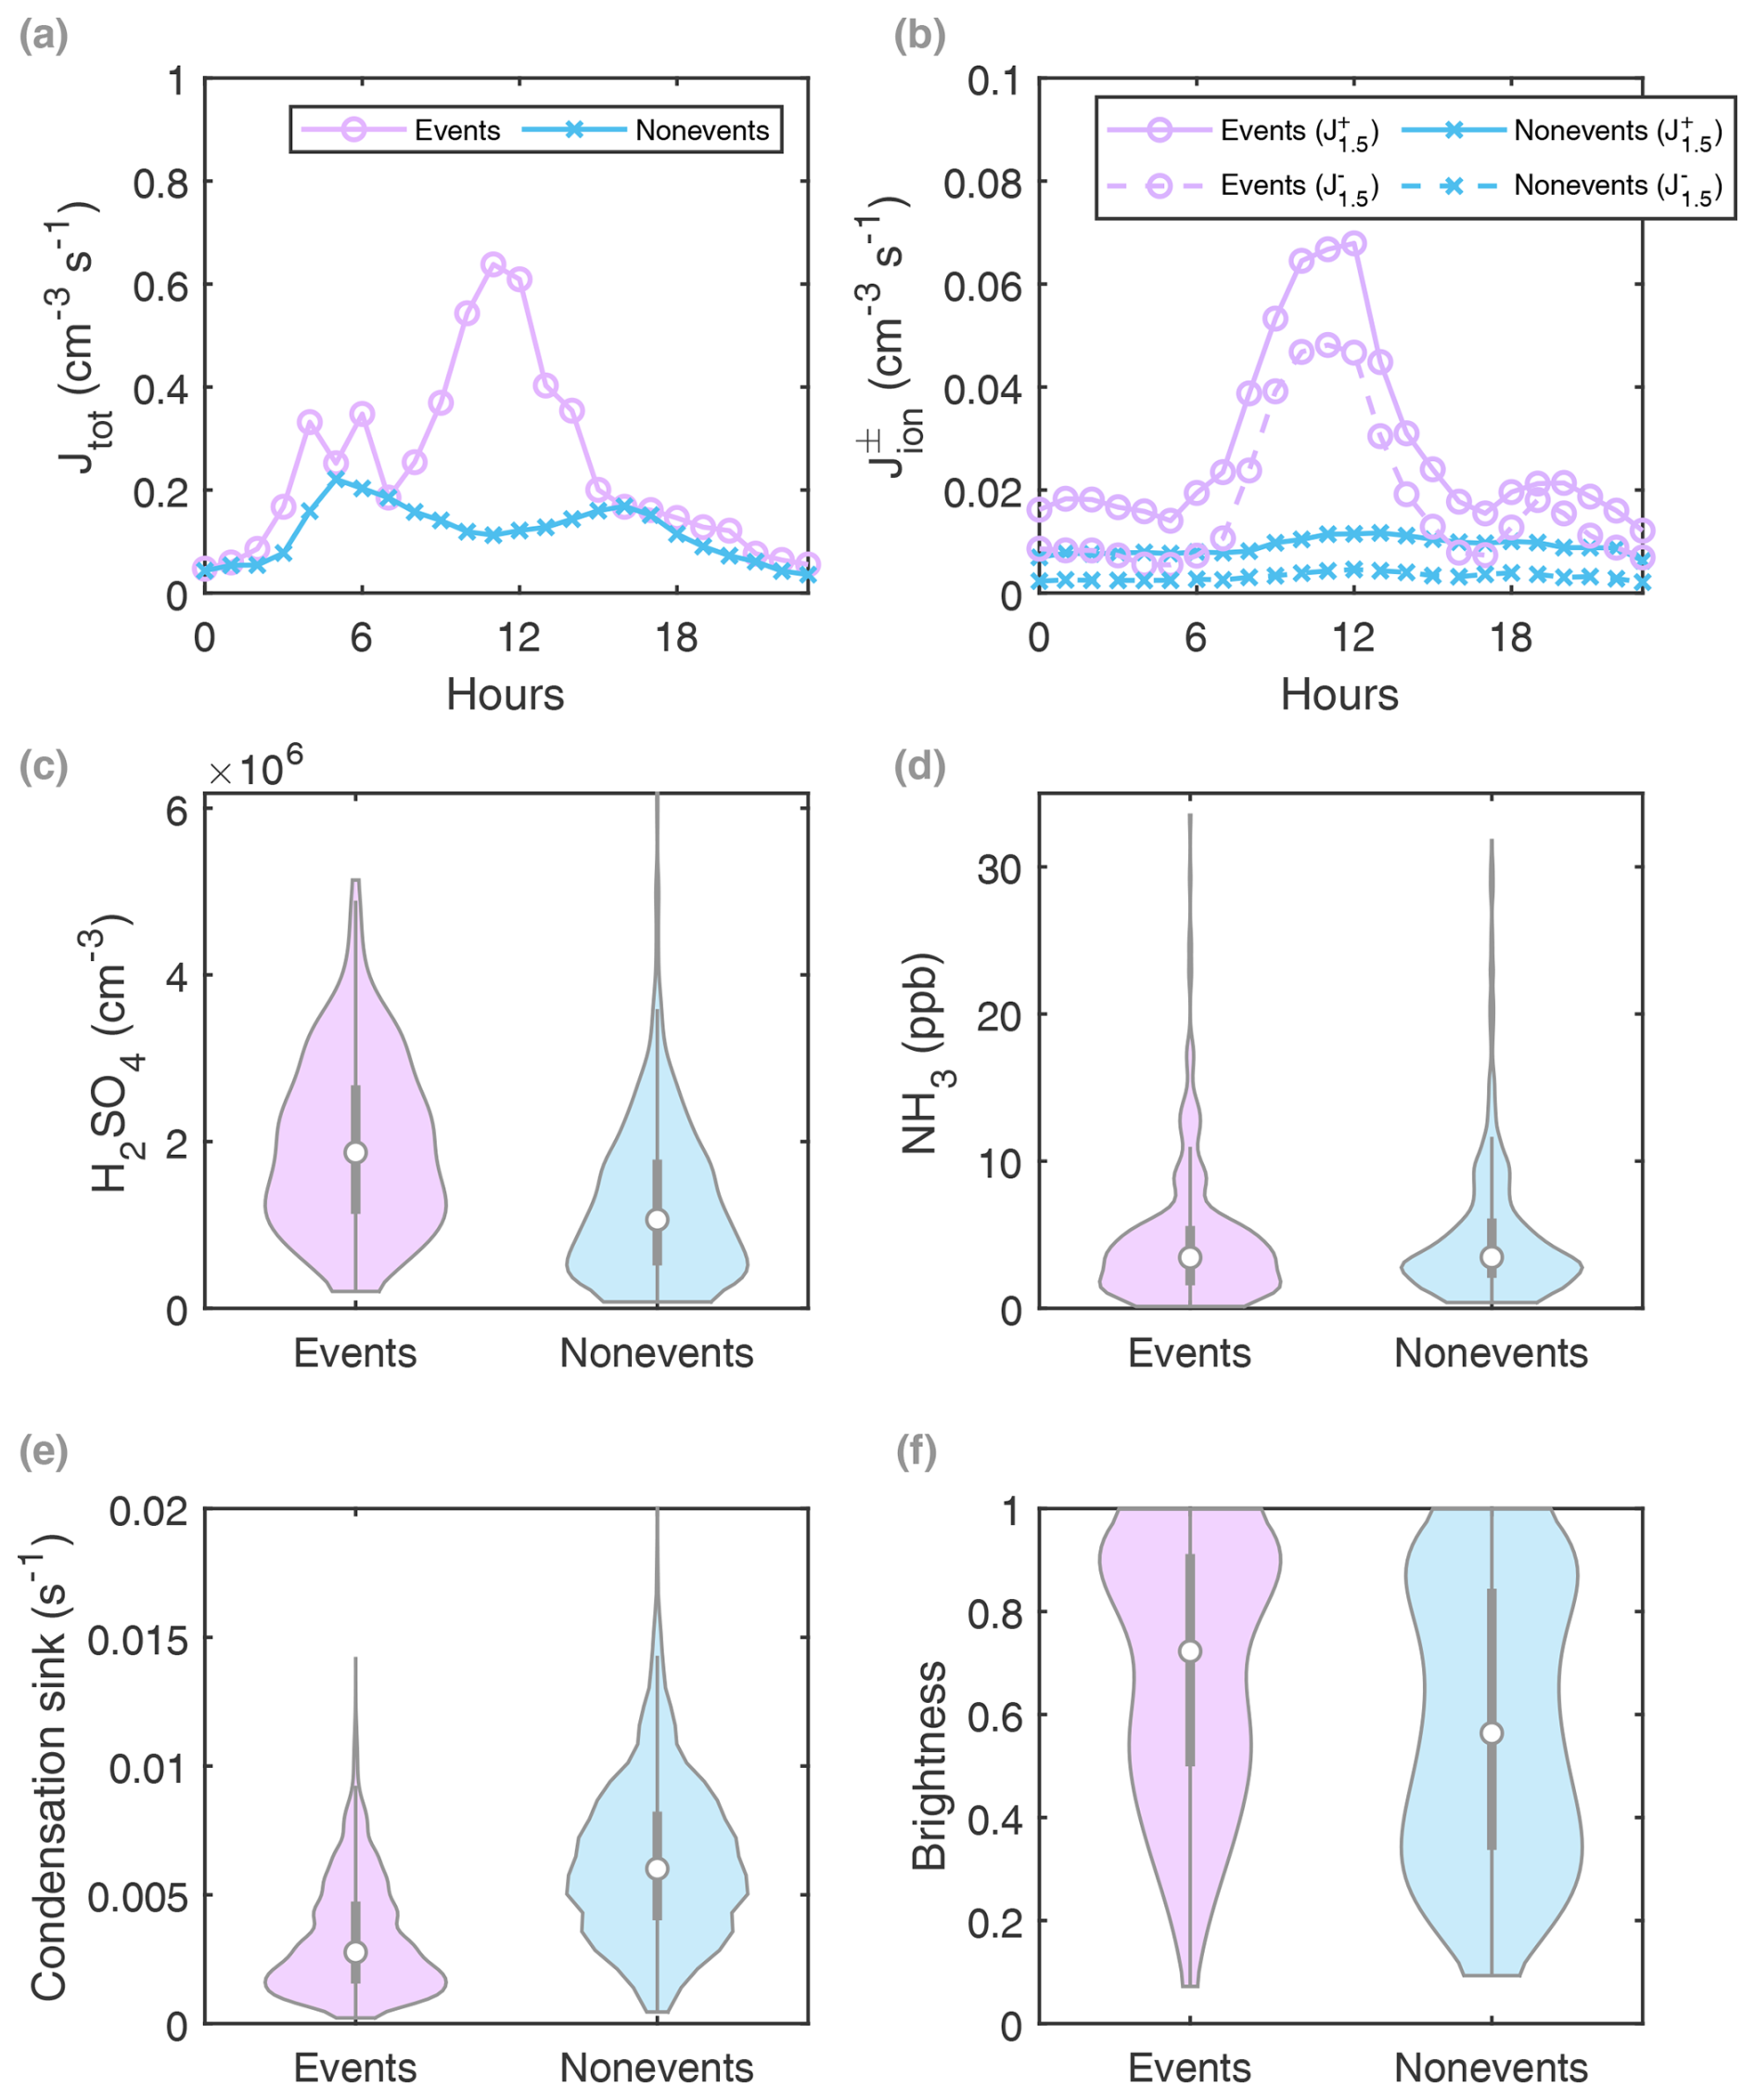
Figure 6(a) Total (J2.5) and (b) ion-induced (J1.5) formation rates on event (pink) and nonevent days (blue). (c) H2SO4 proxy concentration, (d) NH3 concentration, (e) condensation sink and (f) brightness (clear-sky parameter) on event (pink) and nonevent days (blue) shown as violin plots. Violin plots are a combination of box plot and a kernel distribution function on each side of the box plots. The white circles define the median of the distribution, and the edges on the inner grey boxes refer to the 25th and 75th percentiles, respectively.
4.4.3 Precursor vapors driving NPF at Payerne
A clear enhancement in the particle formation rate (total and ion-induced) is observed on NPF event days compared to nonevent days. The median J2.5 on event days is on average 2 times higher and during the peak up to 7 times higher than J2.5 on nonevent days (Fig. 6a). The highest J2.5 values are observed during spring, with the highest peak occurring in March and reaching up to 3 cm−3 s−1 (Fig. S22). These particle formation rates fall in the same range as other rural and rather vegetation-dominated locations such as in Hyytiälä, Finland (Kulmala et al., 2013); Jarvseljä, Estonia (Vana et al., 2016); and Hohenpeissenberg, Germany (Birmili et al., 2003). The ion-induced formation rates ( and ) show a similar trend as J2.5, peaking around noon (Fig. 6b), especially in spring (Fig. S22). Similarly, is 3 times and is 5 times on average higher on event days than on nonevent days. During peak time, is 6 times and is 12 times higher on event days than on nonevent days. The factor of 2 difference between and could be attributed to the composition of air (Mohnen, 1976). As for J2.5, average and fall in the range of ion-induced formation rates measured in rural locations in Europe; see Manninen et al. (2010) and references therein.
At most locations in the continental boundary layer, sulfuric acid (H2SO4) mediates NPF events, especially in the presence of fixing bases such as amines or ammonia (Yao et al., 2018; Dada et al., 2023; Almeida et al., 2013; Kürten et al., 2016; Aktypis et al., 2024). At Payerne, NPF events are observed on days with significantly enhanced H2SO4 concentrations (calculated as a proxy from SO2; see Sect. 3.4 – median events = 1.88 × 106 cm−3, median nonevents 1.07 × 106 cm−3, p < 0.05 using Wilcoxon's rank-sum and signed-rank tests), while SO2 levels are similar on event and nonevent days (Figs. 6c, S23). Interestingly, ammonia does not show a similar behavior but an equal median concentration and distribution regardless of whether an NPF event was observed or not (Fig. 6d). This observation allows us to conclude that while H2SO4 could be the factor controlling NPF in Payerne, ammonia is not the limiting factor. On the other hand, a clear difference between CS levels is observed on events and nonevent days, as is the case for the cloudiness (median CSevents = 2.7 × 10⁻³ s−1, Bevents = 0.72; median CSnonevents = 5.9 × 10⁻³ s−1, Bnonevents = 0.56) (Fig. 6e–f). The two aforementioned factors control H2SO4 formation, and hence an increased CS or cloudy conditions inhibit the occurrence of NPF events. Based on these results, we can hypothesize that the limited H2SO4 formation (due to high CS or cloudiness) could be the limiting factor for NPF in Payerne.
To confirm our hypothesis, we plot the observed NPF probability as a function of H2SO4 and CS in Fig. 7. We find that events occurred most frequently under high H2SO4 exceeding 4 × 105 cm−3 and CS below 0.01 s−1 (Fig. 7). The highest probability is observed in the lower-right corner of Fig. 7, under high H2SO4 concentration and the lowest CS. As H2SO4 formation depends on the level of solar radiation, summer conditions favor H2SO4 formation; see also Fig. S24. SO2, which is always available in the regional background air, has similar concentrations on event and nonevent days (Fig. S23), and higher concentrations are associated with air masses arriving from the northeast, passing over the town of Payerne (Fig. S25). During less cloudy conditions (high B), SO2 oxidation is favored, producing higher concentrations of H2SO4. At the same time, cleaner conditions (low CS) favor NPF occurrence in two ways. First, the loss of H2SO4 to preexisting particles is decreased, favoring an increased lifetime of the precursor gas needed for NPF (see Eq. 6). Second, besides H2SO4, fewer freshly formed particles and precursor vapors needed for particle growth are lost to preexisting background particles, increasing the probability of NPF.
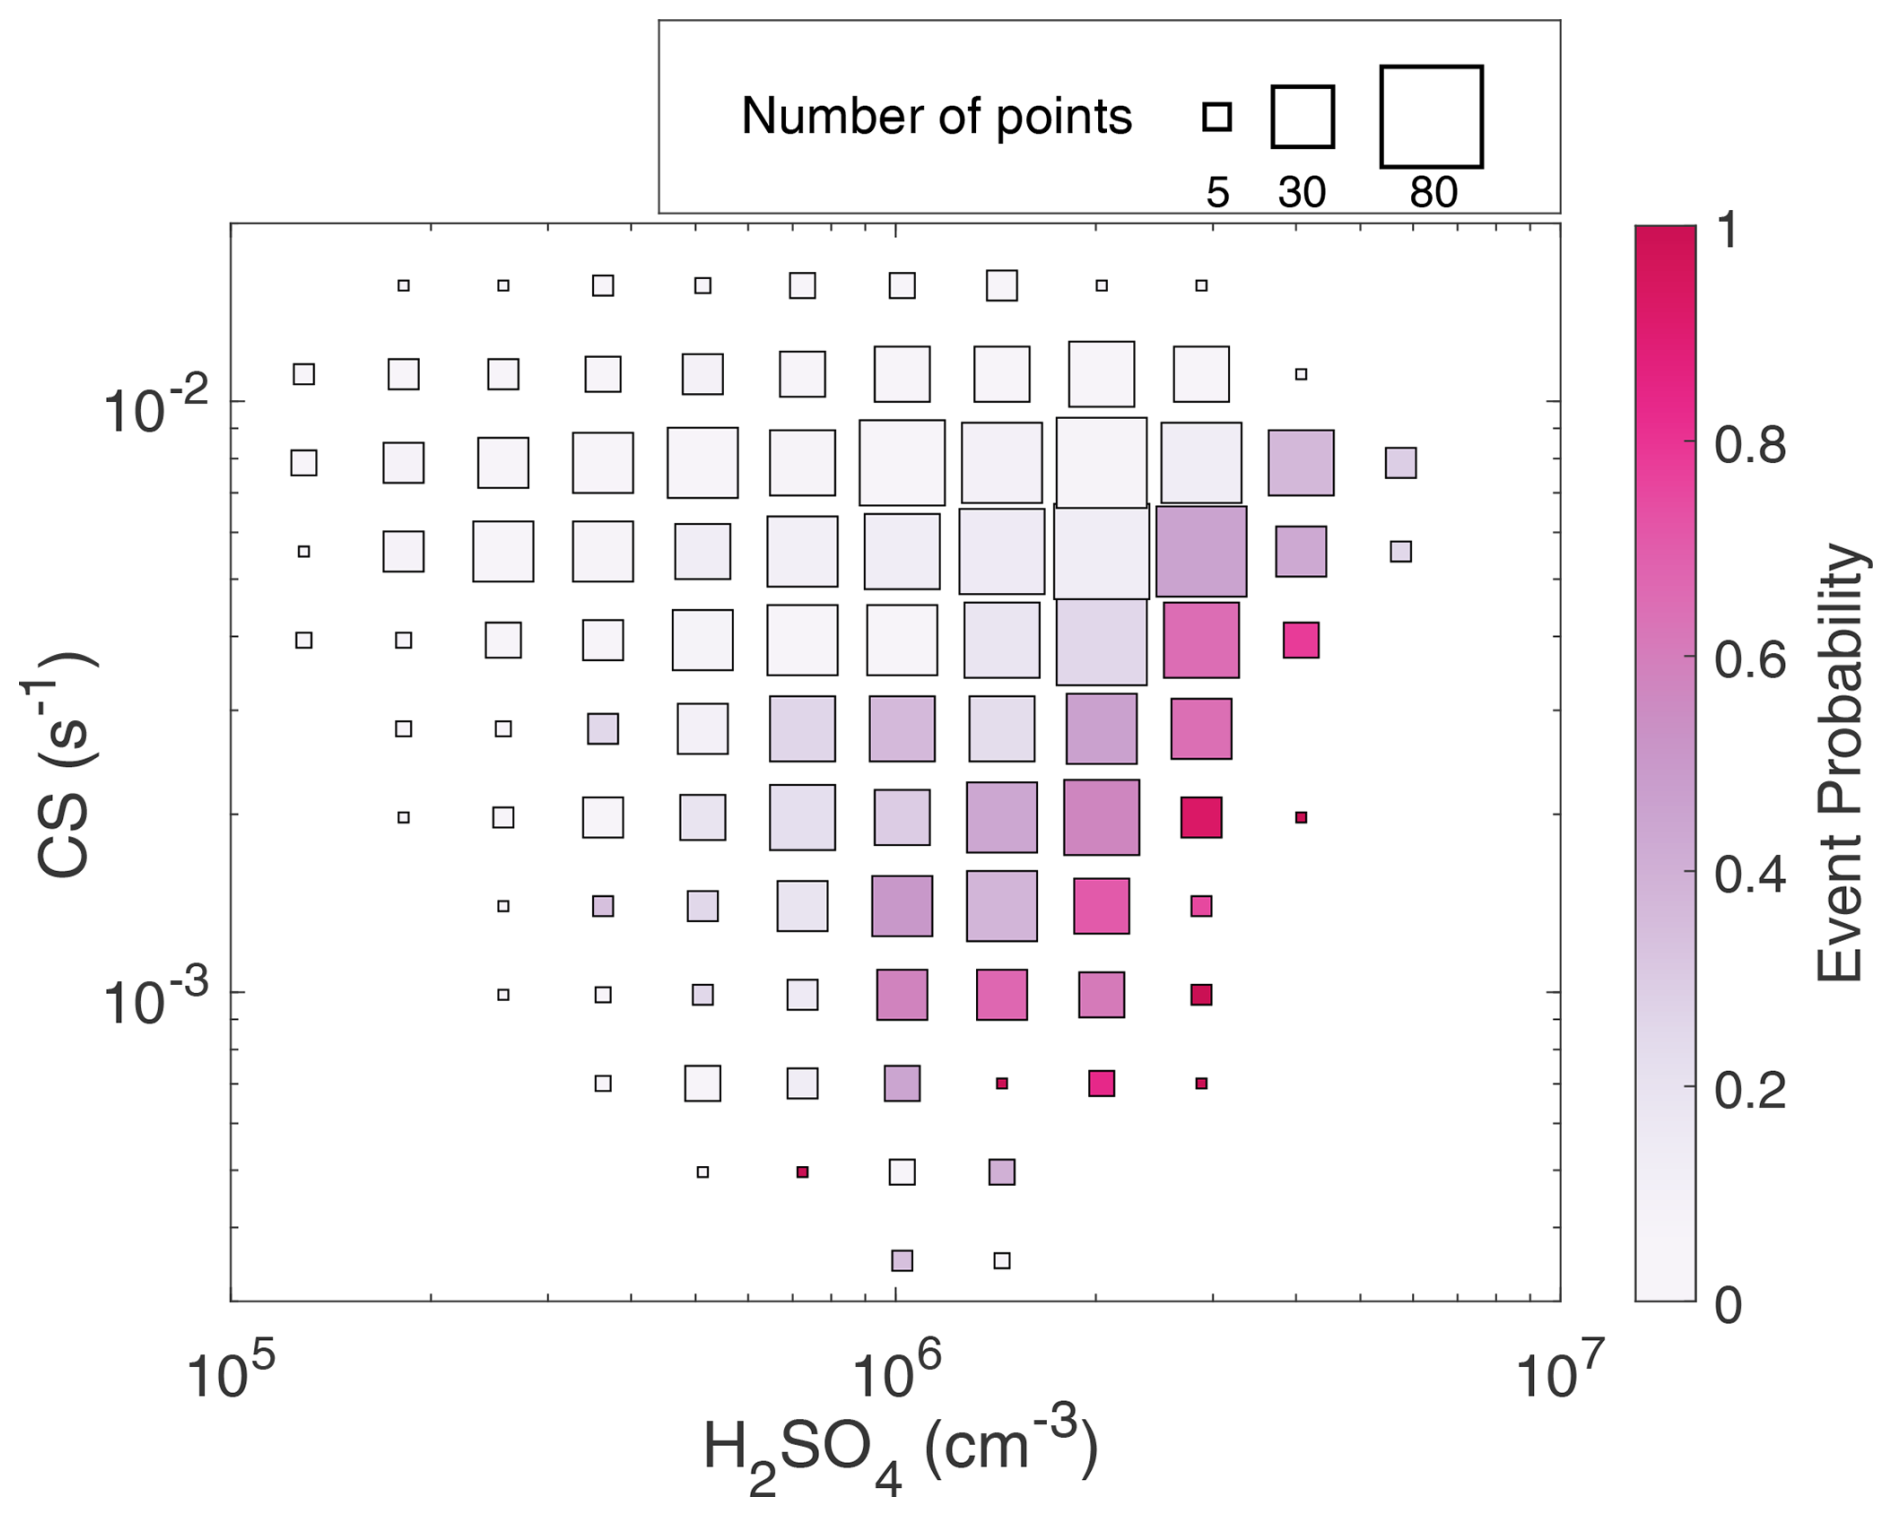
Figure 7Event probability distribution at Payerne based on the CS and sulfuric acid proxy hourly concentrations during the daytime (08:00–17:00 CET). Marker size indicates number of days included in the probability calculation within every cell.
In Payerne, NPF events occurred most frequently when the wind arrived from the southwest areas dominated by vegetation (grasslands and croplands) and associated with a lower CS suitable for NPF events to occur (Figs. S25–S26). Besides H2SO4, stabilizing bases are needed for NPF to occur in boundary layer conditions. In Switzerland, NH3 and amines originate from agricultural practices, specifically from animal housing and manure storage and spreading especially in the central and western parts (Reidy et al., 2008). Wind carried similar NH3 concentrations from all directions at our measurement site, as expected given the area's proximity to agricultural areas and croplands (Fig. S25). As mentioned earlier, the NH3 concentrations are also similar on NPF events and nonevent days; they are also sufficiently high to not limit NPF on days when sufficient H2SO4 is available. Although we have no amine measurements available, the wind direction carrying NH3 is likely carrying amines as well. Amines such as methylamine, dimethylamine (DMA) and trimethylamine are expected to be abundant in rural locations in the vicinity of agricultural activities (Kürten et al., 2016; Ge et al., 2011).
By comparing our observations to previous field measurements and chamber experiments, we find that the data points from Payerne fall in the middle between all other measurement sites, boreal, rural and agricultural, showing the complexity of the different sources (Fig. 8). During warmer periods, our data points fall in line with the measurements from the Po Valley, during spring. The authors of the Po Valley study report H2SO4–DMA as the main mechanism of NPF in this location aided by other bases such as NH3 and estimate the NH3 and DMA concentrations to be 10.6 ppb and less than 10 ppt, respectively (Cai et al., 2024). Moreover, our data points fall at a slightly higher slope than those measured in an agricultural land in Finland (Qvidja – yellow circles (temperature from 5 to 25 °C)) which were found to be mediated by H2SO4–NH3 and extremely low volatility organic vapors of biogenic origin (Dada et al., 2023; Olin et al., 2022). Our data points fall on the same line as the H2SO4–DMA line (4 ppt DMA), based on kinetic-model parametrization at 25 °C from chamber experiments and are higher than those parametrized from H2SO4–NH3 experiments (Xiao et al., 2021). The scatter of the points and deviation from the exact line can be largely attributed to the variable concentration of DMA as well as the contribution of other vapors in the nucleation and growth process, e.g., biogenic and anthropogenic organics, which cannot be excluded.
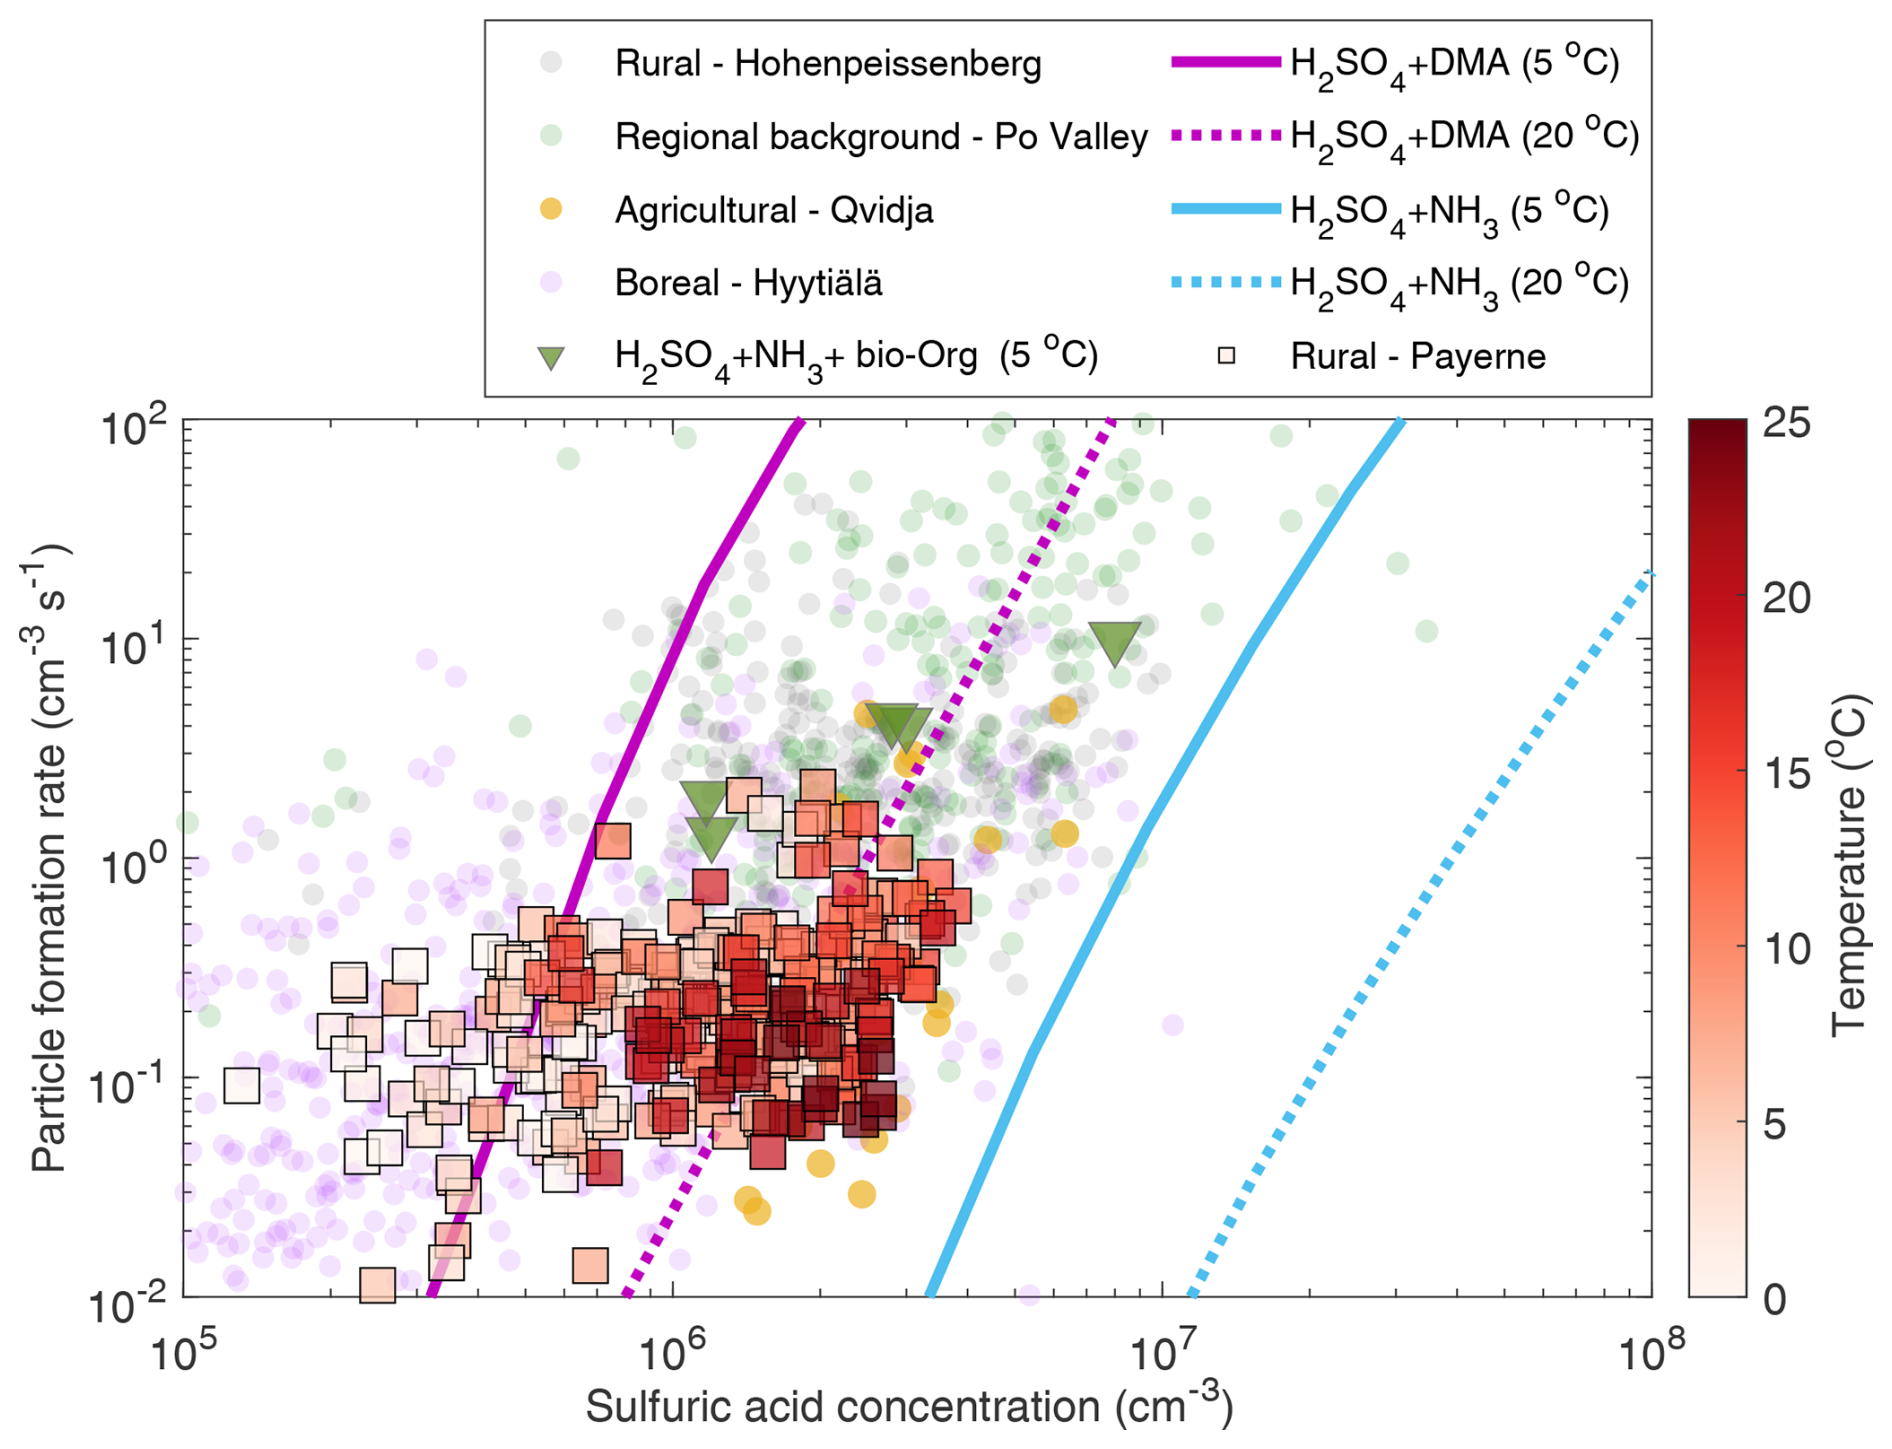
Figure 8Particle formation rates as a function of H2SO4 concentration; daily averages (08:00–17:00 CET) (squares) are colored with ambient temperature. Parametrizations based on chamber measurements of H2SO4 + NH3 (2 ppbv) ammonia at 5 °C (solid cyan line) and 20 °C (dotted cyan line) are shown (Xiao et al., 2021). Similarly, parametrizations based on chamber measurements of H2SO4 + dimethylamine (DMA – 4 pptv) at 5 °C (solid magenta line) and 20 °C (dotted magenta line) are shown (Xiao et al., 2021). Green triangles are H2SO4 + NH3 (0.1–1 ppbv) at 5 °C in the presence of constant monoterpenes (α-pinene and Δ-3-carene) and NOx from Lehtipalo et al. (2018). Filled translucent points in the background are atmospheric measurements from the boreal forest (pink), rural location in Germany (grey) (Birmili et al., 2003), a regional background in Italy (green) (Cai et al., 2024) and an agricultural land (yellow) (Dada et al., 2023). Particle formation rates from chamber measurements are at 1.7 nm, while field observations are either measured at 1.5 nm or extrapolated to 1.5 nm using the Kerminen and Kulmala equation (Kerminen and Kulmala, 2002) (see Sect. 3.7). For Payerne, H2SO4 concentrations are derived from proxy calculations (see Sect. 3.8).
Under colder temperature conditions, data points in Payerne coincide with measurements from Hyytiälä, where the average H2SO4 concentrations are rather low, accompanied by a low average ammonia and DMA concentrations, of 0.066 ppb and below the detection limit, respectively (Hemmilä et al., 2018). However, the CS levels are also comparably low (CSevents = 1.4 × 10⁻³ s−1), together with colder temperatures, favoring NPF events at these low concentrations. Hyytiälä forest site is also surrounded by a belt of trees emitting monoterpenes, further supporting particle nucleation and growth (Rinne et al., 2005). Similar to periods with warmer temperatures, the points from Payerne fall on the same line as the H2SO4–DMA line (4 pptv DMA), based on kinetic-model parametrization at 5 °C from chamber experiments and at a higher slope than H2SO4–NH3 chamber experiments (Xiao et al., 2021; Lehtipalo et al., 2018).
Based on these observations, we can conclude that NPF events in Payerne are mediated by H2SO4–DMA supported by ammonia, with the availability of H2SO4 (and low CS) being the decisive factor. Given the environment surrounding our measurement location, we can speculate that both biogenic and anthropogenic organic vapors contribute to the growth of the freshly formed particles. However, such conclusions can only be fully verified with additional measurements of precursor vapors.
4.4.4 Contribution of NPF particles to UFP
The analyses performed within the German Ultrafine Aerosol Network (GUAN) show that the contribution of NPF to UFPs was about 13 %, 21 % and 7 % for the urban background, regional background and low mountain range, respectively (Sun et al., 2024). We applied similar analyses to our data, though our results might be subject to uncertainty due to low statistics, especially during low radiation autumn or winter (Fig. S27). We found that the overall NPF contribution to the UFP was 5.07 %. However, if we limit our analysis to the NPF time window (11:00 to 18:00 CEST), we find that the contribution of NPF to total UFP increased to 13.04 %. Limiting our analysis further to the 3 h peak NPF window, the contribution of NPF to total UFP increased to 20.4 %. By combining the information on the secondary UFP fraction (Sect. 4.3.3) with this analysis, we find that NPF explains an average of 6.8 % of the secondary UFP. A main reason for this low fraction is that the secondary particles also contain a substantial portion of volatile particles peaking shortly after the traffic rush hour, which are not counted in the NPF contribution.
We also performed the same analysis on the size-segregated particles and found an overall contribution of NPF to nucleation-mode particles of 9.32 % up to 21.3 % during the NPF time window (11:00 to 18:00 CEST) and 32.1 % during the 3 h NPF peak. These results translate to ∼ 20 % contribution of NPF to secondary nucleation-mode particles. On the other hand, the overall contribution of NPF to Aitken-mode particles is near 0, even during the NPF time window. Such an observation is expected, as the Aitken-mode particles are rather transported particles and not formed via local processes; see also Sect. 4.3.3.
Understanding the sources of UFP in rural environments is crucial for assessing air quality, public health impacts, and the influence of both natural and anthropogenic emissions on regional atmospheric chemistry. In this work, we investigate the outdoor sources of UFPs at Payerne, an ACTRIS and NABEL site in rural Switzerland. Although UFPs in rural areas have not been as extensively studied as those in urban settings, our research demonstrates that secondary processes can elevate UFP concentrations in rural environments to levels similar to those found in urban areas. First, we identify and quantify primary and secondary UFP sources using long-term particle and ion number size distribution measurements starting from ∼ 1 nm. By combining measurements of non-volatile particles and long-term BC concentrations, used as tracers for primary particles, we find that secondary particles dominate over primary particles in all size fractions. A higher secondary fraction is observed at higher particle concentrations, demonstrating the role of atmospheric processing in increasing the number concentration of particles in the atmosphere.
Primary particles in Payerne comprise those originating from traffic and wood burning, mostly non-volatile and BC-rich. While the concentrations are relatively similar between the different seasons, the diurnal pattern shows the unique peaks concurrent with the morning and evening traffic rush hour. In comparison, secondary particles originate from NPF events and processing of primary particles. UFPs' diurnal and seasonal variability is determined by the nucleation-mode particles dominating in spring and summer due to local emissions and secondary aerosol formation. NPF happens in spring and summer and contributes largely to the nucleation mode (∼ 20 %). Based on several lines of evidence, we find that NPF events in Payerne are driven by H2SO4 and stabilizing bases, likely DMA supported by ammonia, with the availability of H2SO4 in combination with sufficiently low CS being the decisive factor. Given the location and multitude of sources, it is likely that both biogenic and anthropogenic organic vapors contribute to the growth of the newly formed particles, especially under favorable meteorological conditions. However, additional measurements of precursor vapors are needed to fully verify these conclusions.
Global radiation, temperature, precipitation, wind speed and wind direction data can be obtained from the MeteoSwiss open database (https://www.meteoswiss.admin.ch/services-and-publications/applications/ext/download-data-without-coding-skills.html, MeteoSwiss, 2025). Trace gas data are available open-access on the National Air Pollution Monitoring Network (NABEL) website (https://www.bafu.admin.ch/bafu/en/home/topics/air/luftbelastung/data/data-query-nabel.html, Federal Office for the Environment, 2024). All other data can be provided from the corresponding authors upon request.
The supplement related to this article is available online at https://doi.org/10.5194/ar-3-315-2025-supplement.
LD: conceptualization. MGB, BB: fundraising. BB, MCC, CH, MS: data collection. BB, NN, LA, LD, MCC, CH, MS: data analysis. All: data interpretation and scientific discussions. LD: writing. All: review and commenting.
The contact author has declared that none of the authors has any competing interests.
Publisher’s note: Copernicus Publications remains neutral with regard to jurisdictional claims made in the text, published maps, institutional affiliations, or any other geographical representation in this paper. While Copernicus Publications makes every effort to include appropriate place names, the final responsibility lies with the authors.
We acknowledge Maxime Hervo, Alexander Häfele and Phillippe Overney from MeteoSwiss in Payerne for providing the infrastructure access and support with the measurements. We further acknowledge MeteoSwiss collaborators at Payerne for the operational SMN and EMER-Met measurements. Nicolas Bukowiecki is further acknowledged for his contribution to the fundraising of the GAW-CH science project that initiated the aerosol in situ measurements in Payerne. Günther Wehrle, Pascal Schneider and Levi Folghera are acknowledged for the technical support of the aerosol in situ observations. We thank the Swiss National Air Pollution Monitoring Network NABEL (BAFU/Empa) for providing data on gaseous air pollutants. We also thank Kaspar R. Daellenbach for scientific discussions.
Initial pilot implementation of aerosol in situ measurements at the Payerne observatory received financial support from MeteoSwiss through a science project in the framework of the Swiss contribution to the Global Atmosphere Watch Programme (GAW-CH) of the World Meteorological Organization. Further upgrades and operation of the ACTRIS observations at Payerne were funded by the Swiss State Secretariat for Education and Research and Innovation (SERI) in the framework of ACTRIS Switzerland. Further operation support was received from topical centers of the ACTRIS ERIC. Lubna Dada has received funding from the SNSF (grant no. 216181). Nikolaos Evangeliou has been supported by the cross-atmospheric research infrastructure services provided by ATMO-ACCESS (EU grant agreement no. 101008004).
This paper was edited by Annele Virtanen and reviewed by three anonymous referees.
Aktypis, A., Kaltsonoudis, C., Patoulias, D., Kalkavouras, P., Matrali, A., Vasilakopoulou, C. N., Kostenidou, E., Florou, K., Kalivitis, N., Bougiatioti, A., Eleftheriadis, K., Vratolis, S., Gini, M. I., Kouras, A., Samara, C., Lazaridis, M., Chatoutsidou, S.-E., Mihalopoulos, N., and Pandis, S. N.: Significant spatial gradients in new particle formation frequency in Greece during summer, Atmos. Chem. Phys., 24, 65–84, https://doi.org/10.5194/acp-24-65-2024, 2024.
Almeida, J., Schobesberger, S., Kurten, A., Ortega, I. K., Kupiainen-Maatta, O., Praplan, A. P., Adamov, A., Amorim, A., Bianchi, F., Breitenlechner, M., David, A., Dommen, J., Donahue, N. M., Downard, A., Dunne, E., Duplissy, J., Ehrhart, S., Flagan, R. C., Franchin, A., Guida, R., Hakala, J., Hansel, A., Heinritzi, M., Henschel, H., Jokinen, T., Junninen, H., Kajos, M., Kangasluoma, J., Keskinen, H., Kupc, A., Kurten, T., Kvashin, A. N., Laaksonen, A., Lehtipalo, K., Leiminger, M., Leppa, J., Loukonen, V., Makhmutov, V., Mathot, S., McGrath, M. J., Nieminen, T., Olenius, T., Onnela, A., Petaja, T., Riccobono, F., Riipinen, I., Rissanen, M., Rondo, L., Ruuskanen, T., Santos, F. D., Sarnela, N., Schallhart, S., Schnitzhofer, R., Seinfeld, J. H., Simon, M., Sipila, M., Stozhkov, Y., Stratmann, F., Tome, A., Trostl, J., Tsagkogeorgas, G., Vaattovaara, P., Viisanen, Y., Virtanen, A., Vrtala, A., Wagner, P. E., Weingartner, E., Wex, H., Williamson, C., Wimmer, D., Ye, P. L., Yli-Juuti, T., Carslaw, K. S., Kulmala, M., Curtius, J., Baltensperger, U., Worsnop, D. R., Vehkamaki, H., and Kirkby, J.: Molecular understanding of sulphuric acid-amine particle nucleation in the atmosphere, Nature, 502, 359–363, https://doi.org/10.1038/nature12663, 2013.
Andersson, J., Giechaskiel, B., Munoz-Bueno, R., Sandbach, E., and Dilara, P.: Particle measurement programme (PMP) light-duty inter-laboratory correlation exercise (ILCE_LD) final report, European Commission Joint Research Centre Institute for Environment and Sustainability, ISSN 1018-5593, https://www.transportpolicy.net/wp-content/uploads/2021/08/7386-PMP_LD_final.pdf (last access: 5 June 2025), 2007.
Baalbaki, R., Pikridas, M., Jokinen, T., Laurila, T., Dada, L., Bezantakos, S., Ahonen, L., Neitola, K., Maisser, A., Bimenyimana, E., Christodoulou, A., Unga, F., Savvides, C., Lehtipalo, K., Kangasluoma, J., Biskos, G., Petäjä, T., Kerminen, V.-M., Sciare, J., and Kulmala, M.: Towards understanding the characteristics of new particle formation in the Eastern Mediterranean, Atmos. Chem. Phys., 21, 9223–9251, https://doi.org/10.5194/acp-21-9223-2021, 2021.
Baltensperger, U., Streit, N., Weingartner, E., Nyeki, S., Prévôt, A. S. H., Van Dingenen, R., Virkkula, A., Putaud, J.-P., Even, A., ten Brink, H., Blatter, A., Neftel, A., and Gäggeler, H. W.: Urban and rural aerosol characterization of summer smog events during the PIPAPO field campaign in Milan, Italy, J. Geophys. Res.-Atmos., 107, LOP 6-1–LOP 6-14, https://doi.org/10.1029/2001JD001292, 2002.
Bianchi, F., Tröstl, J., Junninen, H., Frege, C., Henne, S., Hoyle, C., Molteni, U., Herrmann, E., Adamov, A., Bukowiecki, N., Chen, X., Duplissy, J., Gysel, M., Hutterli, M., Kangasluoma, J., Kontkanen, J., Kürten, A., Manninen, H. E., Münch, S., Peräkylä, O., Petäjä, T., Rondo, L., Williamson, C., Weingartner, E., Curtius, J., Worsnop, D. R., Kulmala, M., Dommen, J., and Baltensperger, U.: New particle formation in the free troposphere: A question of chemistry and timing, Science, 352, 1109–1112, https://doi.org/10.1126/science.aad5456, 2016.
Bianchi, F., Junninen, H., Bigi, A., Sinclair, V. A., Dada, L., Hoyle, C. R., Zha, Q., Yao, L., Ahonen, L. R., Bonasoni, P., Buenrostro Mazon, S., Hutterli, M., Laj, P., Lehtipalo, K., Kangasluoma, J., Kerminen, V. M., Kontkanen, J., Marinoni, A., Mirme, S., Molteni, U., Petäjä, T., Riva, M., Rose, C., Sellegri, K., Yan, C., Worsnop, D. R., Kulmala, M., Baltensperger, U., and Dommen, J.: Biogenic particles formed in the Himalaya as an important source of free tropospheric aerosols, Nat. Geosci., 14, 4–9, https://doi.org/10.1038/s41561-020-00661-5, 2021.
Birmili, W., Berresheim, H., Plass-Dülmer, C., Elste, T., Gilge, S., Wiedensohler, A., and Uhrner, U.: The Hohenpeissenberg aerosol formation experiment (HAFEX): a long-term study including size-resolved aerosol, H2SO4, OH, and monoterpenes measurements, Atmos. Chem. Phys., 3, 361–376, https://doi.org/10.5194/acp-3-361-2003, 2003.
Bukowiecki, N., Dommen, J., Prévôt, A. S. H., Richter, R., Weingartner, E., and Baltensperger, U.: A mobile pollutant measurement laboratory–measuring gas phase and aerosol ambient concentrations with high spatial and temporal resolution, Atmos. Environ., 36, 5569–5579, https://doi.org/10.1016/S1352-2310(02)00694-5, 2002.
Bundesamt für Umwelt (BAFU): Luftqualität 2022: Messresultate des Nationalen Beobachtungsnetzes für Luftfremdstoffe (NABEL), https://www.bafu.admin.ch/bafu/de/home/themen/luft/publikationen-studien/publikationen/nabel-luftqualitaet.html (last access: 7 March 2025), 2023.
Cai, J., Chu, B., Yao, L., Yan, C., Heikkinen, L. M., Zheng, F., Li, C., Fan, X., Zhang, S., Yang, D., Wang, Y., Kokkonen, T. V., Chan, T., Zhou, Y., Dada, L., Liu, Y., He, H., Paasonen, P., Kujansuu, J. T., Petäjä, T., Mohr, C., Kangasluoma, J., Bianchi, F., Sun, Y., Croteau, P. L., Worsnop, D. R., Kerminen, V.-M., Du, W., Kulmala, M., and Daellenbach, K. R.: Size-segregated particle number and mass concentrations from different emission sources in urban Beijing, Atmos. Chem. Phys., 20, 12721–12740, https://doi.org/10.5194/acp-20-12721-2020, 2020.
Cai, J., Sulo, J., Gu, Y., Holm, S., Cai, R., Thomas, S., Neuberger, A., Mattsson, F., Paglione, M., Decesari, S., Rinaldi, M., Yin, R., Aliaga, D., Huang, W., Li, Y., Gramlich, Y., Ciarelli, G., Quéléver, L., Sarnela, N., Lehtipalo, K., Zannoni, N., Wu, C., Nie, W., Kangasluoma, J., Mohr, C., Kulmala, M., Zha, Q., Stolzenburg, D., and Bianchi, F.: Elucidating the mechanisms of atmospheric new particle formation in the highly polluted Po Valley, Italy, Atmos. Chem. Phys., 24, 2423–2441, https://doi.org/10.5194/acp-24-2423-2024, 2024.
Casquero-Vera, J. A., Lyamani, H., Titos, G., Minguillón, M. C., Dada, L., Alastuey, A., Querol, X., Petäjä, T., Olmo, F. J., and Alados-Arboledas, L.: Quantifying traffic, biomass burning and secondary source contributions to atmospheric particle number concentrations at urban and suburban sites, Sci. Total Environ., 768, 145282, https://doi.org/10.1016/j.scitotenv.2021.145282, 2021.
Chen, G., Canonaco, F., Tobler, A., Aas, W., Alastuey, A., Allan, J., Atabakhsh, S., Aurela, M., Baltensperger, U., Bougiatioti, A., De Brito, J. F., Ceburnis, D., Chazeau, B., Chebaicheb, H., Daellenbach, K. R., Ehn, M., El Haddad, I., Eleftheriadis, K., Favez, O., Flentje, H., Font, A., Fossum, K., Freney, E., Gini, M., Green, D. C., Heikkinen, L., Herrmann, H., Kalogridis, A.-C., Keernik, H., Lhotka, R., Lin, C., Lunder, C., Maasikmets, M., Manousakas, M. I., Marchand, N., Marin, C., Marmureanu, L., Mihalopoulos, N., Močnik, G., Nęcki, J., O'Dowd, C., Ovadnevaite, J., Peter, T., Petit, J.-E., Pikridas, M., Matthew Platt, S., Pokorná, P., Poulain, L., Priestman, M., Riffault, V., Rinaldi, M., Różański, K., Schwarz, J., Sciare, J., Simon, L., Skiba, A., Slowik, J. G., Sosedova, Y., Stavroulas, I., Styszko, K., Teinemaa, E., Timonen, H., Tremper, A., Vasilescu, J., Via, M., Vodička, P., Wiedensohler, A., Zografou, O., Cruz Minguillón, M., and Prévôt, A. S. H.: European aerosol phenomenology – 8: Harmonised source apportionment of organic aerosol using 22 Year-long ACSM/AMS datasets, Environ. Int., 166, 107325, https://doi.org/10.1016/j.envint.2022.107325, 2022.
Collaud Coen, M., Praz, C., Haefele, A., Ruffieux, D., Kaufmann, P., and Calpini, B.: Determination and climatology of the planetary boundary layer height above the Swiss plateau by in situ and remote sensing measurements as well as by the COSMO-2 model, Atmos. Chem. Phys., 14, 13205–13221, https://doi.org/10.5194/acp-14-13205-2014, 2014.
Dada, L., Paasonen, P., Nieminen, T., Buenrostro Mazon, S., Kontkanen, J., Peräkylä, O., Lehtipalo, K., Hussein, T., Petäjä, T., Kerminen, V.-M., Bäck, J., and Kulmala, M.: Long-term analysis of clear-sky new particle formation events and nonevents in Hyytiälä, Atmos. Chem. Phys., 17, 6227–6241, https://doi.org/10.5194/acp-17-6227-2017, 2017.
Dada, L., Chellapermal, R., Buenrostro Mazon, S., Paasonen, P., Lampilahti, J., Manninen, H. E., Junninen, H., Petäjä, T., Kerminen, V.-M., and Kulmala, M.: Refined classification and characterization of atmospheric new-particle formation events using air ions, Atmos. Chem. Phys., 18, 17883–17893, https://doi.org/10.5194/acp-18-17883-2018, 2018.
Dada, L., Lehtipalo, K., Kontkanen, J., Nieminen, T., Baalbaki, R., Ahonen, L., Duplissy, J., Yan, C., Chu, B., Petäjä, T., Lehtinen, K., Kerminen, V.-M., Kulmala, M., and Kangasluoma, J.: Formation and growth of sub-3-nm aerosol particles in experimental chambers, Nat. Protoc., 15, 1013–1040, https://doi.org/10.1038/s41596-019-0274-z, 2020a.
Dada, L., Ylivinkka, I., Baalbaki, R., Li, C., Guo, Y., Yan, C., Yao, L., Sarnela, N., Jokinen, T., Daellenbach, K. R., Yin, R., Deng, C., Chu, B., Nieminen, T., Wang, Y., Lin, Z., Thakur, R. C., Kontkanen, J., Stolzenburg, D., Sipilä, M., Hussein, T., Paasonen, P., Bianchi, F., Salma, I., Weidinger, T., Pikridas, M., Sciare, J., Jiang, J., Liu, Y., Petäjä, T., Kerminen, V.-M., and Kulmala, M.: Sources and sinks driving sulfuric acid concentrations in contrasting environments: implications on proxy calculations, Atmos. Chem. Phys., 20, 11747–11766, https://doi.org/10.5194/acp-20-11747-2020, 2020b.
Dada, L., Okuljar, M., Shen, J., Olin, M., Wu, Y., Heimsch, L., Herlin, I., Kankaanrinta, S., Lampimäki, M., Kalliokoski, J., Baalbaki, R., Lohila, A., Petäjä, T., Maso, M. D., Duplissy, J., Kerminen, V.-M., and Kulmala, M.: The synergistic role of sulfuric acid, ammonia and organics in particle formation over an agricultural land, Environmental Science: Atmospheres, 3, 1195–1211, https://doi.org/10.1039/D3EA00065F, 2023.
Dai, L., Wang, H., Zhou, L., An, J., Tang, L., Lu, C., Yan, W., Liu, R., Kong, S., Chen, M., Lee, S., and Yu, H.: Regional and local new particle formation events observed in the Yangtze River Delta region, China, J. Geophys. Res.-Atmos., 122, 2389–2402, https://doi.org/10.1002/2016JD026030, 2017.
Dal Maso, M., Kulmala, M., Riipinen, I., Wagner, R., Hussein, T., Aalto, P. P., and Lehtinen, K. E. J.: Formation and growth of fresh atmospheric aerosols: eight years of aerosol size distribution data from SMEAR II, Hyytiala, Finland, Boreal Environ. Res., 10, 323–336, 2005.
Durand, E., Durdina, L., Smallwood, G., Johnson, M., Spirig, C., Edebeli, J., Roth, M., Brem, B., Sevcenco, Y., and Crayford, A.: Correction for particle loss in a regulatory aviation nvPM emissions system using measured particle size, J. Aerosol Sci., 169, 106140, https://doi.org/10.1016/j.jaerosci.2023.106140, 2023.
Durdina, L., Brem, B. T., Setyan, A., Siegerist, F., Rindlisbacher, T., and Wang, J.: Assessment of Particle Pollution from Jetliners: from Smoke Visibility to Nanoparticle Counting, Environ. Sci. Technol., 51, 3534–3541, https://doi.org/10.1021/acs.est.6b05801, 2017.
EEA: Switzerland – air pollution country fact sheet, https://www.eea.europa.eu/themes/air/country-fact-sheets/2023-country-fact-sheets/switzerland-air-pollution-country (last access: 3 March 2025), 2023.
Eeftens, M., Phuleria, H. C., Meier, R., Aguilera, I., Corradi, E., Davey, M., Ducret-Stich, R., Fierz, M., Gehrig, R., Ineichen, A., Keidel, D., Probst-Hensch, N., Ragettli, M. S., Schindler, C., Künzli, N., and Tsai, M.-Y.: Spatial and temporal variability of ultrafine particles, NO2, PM2.5, PM2.5 absorbance, PM10 and PMcoarse in Swiss study areas, Atmos. Environ., 111, 60–70, https://doi.org/10.1016/j.atmosenv.2015.03.031, 2015.
EMEP/CCC: EMEP manual for sampling and chemical analysis, https://projects.nilu.no/ccc/manual/download/cccr1-95rev.pdf (last access: 14 October 2024), 2001.
EMPA and BAFU: Technischer Bericht zum Nationalen Beobachtungsnetz für Luftfremdstoffe (NABEL) 2023, https://www.bafu.admin.ch/dam/bafu/de/dokumente/luft/fach info-daten/technischer_berichtzumnationalenbeobachtungsnetz fuerluftfremdsto.pdf.download.pdf/technischer_berichtzum nationalenbeobachtungsnetzfuerluftfremdsto.pdf (last access: 7 March 2025), 2023.
Federal Office for the Environment (FOEN): National Air Pollution Monitoring Network (NABEL), FOEN, https://www.bafu.admin.ch/bafu/en/home/topics/air/luftbelastung/data/data-query-nabel.html, last access: 14 October 2024.
FEDRO: Swiss Federal Roads Office, ROADS AND TRAFFIC 2021: Developments, facts and figures, http://www.astra.admin.ch/ (last access: 7 March 2025), 2021.
FOEN: Air Quality and Pollution Control in Switzerland, Swiss Federal Office for the Environment, https://www.bafu.admin.ch (last access: 7 March 2025), 2021.
Gagné, S., Lehtipalo, K., Manninen, H. E., Nieminen, T., Schobesberger, S., Franchin, A., Yli-Juuti, T., Boulon, J., Sonntag, A., Mirme, S., Mirme, A., Hõrrak, U., Petäjä, T., Asmi, E., and Kulmala, M.: Intercomparison of air ion spectrometers: an evaluation of results in varying conditions, Atmos. Meas. Tech., 4, 805–822, https://doi.org/10.5194/amt-4-805-2011, 2011.
Garcia-Marlès, M., Lara, R., Reche, C., Pérez, N., Tobías, A., Savadkoohi, M., Beddows, D., Salma, I., Vörösmarty, M., Weidinger, T., Hueglin, C., Mihalopoulos, N., Grivas, G., Kalkavouras, P., Ondráček, J., Zíková, N., Niemi, J. V., Manninen, H. E., Green, D. C., Tremper, A. H., Norman, M., Vratolis, S., Eleftheriadis, K., Gómez-Moreno, F. J., Alonso-Blanco, E., Wiedensohler, A., Weinhold, K., Merkel, M., Bastian, S., Hoffmann, B., Altug, H., Petit, J.-E., Favez, O., Dos Santos, S. M., Putaud, J.-P., Dinoi, A., Contini, D., Timonen, H., Lampilahti, J., Petäjä, T., Pandolfi, M., Hopke, P. K., Harrison, R. M., Alastuey, A., and Querol, X.: Inter-annual trends of ultrafine particles in urban Europe, Environ. Int., 185, 108510, https://doi.org/10.1016/j.envint.2024.108510, 2024a.
Garcia-Marlès, M., Lara, R., Reche, C., Pérez, N., Tobías, A., Savadkoohi, M., Beddows, D., Salma, I., Vörösmarty, M., Weidinger, T., Hueglin, C., Mihalopoulos, N., Grivas, G., Kalkavouras, P., Ondracek, J., Zikova, N., Niemi, J. V., Manninen, H. E., Green, D. C., Tremper, A. H., Norman, M., Vratolis, S., Diapouli, E., Eleftheriadis, K., Gómez-Moreno, F. J., Alonso-Blanco, E., Wiedensohler, A., Weinhold, K., Merkel, M., Bastian, S., Hoffmann, B., Altug, H., Petit, J.-E., Acharja, P., Favez, O., Santos, S. M. D., Putaud, J.-P., Dinoi, A., Contini, D., Casans, A., Casquero-Vera, J. A., Crumeyrolle, S., Bourrianne, E., Poppel, M. V., Dreesen, F. E., Harni, S., Timonen, H., Lampilahti, J., Petäjä, T., Pandolfi, M., Hopke, P. K., Harrison, R. M., Alastuey, A., and Querol, X.: Source apportionment of ultrafine particles in urban Europe, Environ. Int., 194, 109149, https://doi.org/10.1016/j.envint.2024.109149, 2024b.
Ge, X., Wexler, A. S., and Clegg, S. L.: Atmospheric amines – Part I. A review, Atmos. Environ., 45, 524–546, https://doi.org/10.1016/j.atmosenv.2010.10.012, 2011.
Gonzalez Carracedo, L., Lehtipalo, K., Ahonen, L. R., Sarnela, N., Holm, S., Kangasluoma, J., Kulmala, M., Winkler, P. M., and Stolzenburg, D.: On the relation between apparent ion and total particle growth rates in the boreal forest and related chamber experiments, Atmos. Chem. Phys., 22, 13153–13166, https://doi.org/10.5194/acp-22-13153-2022, 2022.
Grange, S. K., Lötscher, H., Fischer, A., Emmenegger, L., and Hueglin, C.: Evaluation of equivalent black carbon source apportionment using observations from Switzerland between 2008 and 2018, Atmos. Meas. Tech., 13, 1867–1885, https://doi.org/10.5194/amt-13-1867-2020, 2020.
Grange, S. K., Fischer, A., Zellweger, C., Alastuey, A., Querol, X., Jaffrezo, J.-L., Weber, S., Uzu, G., and Hueglin, C.: Switzerland's PM10 and PM2.5 environmental increments show the importance of non-exhaust emissions, Atmospheric Environment: X, 12, 100145, https://doi.org/10.1016/j.aeaoa.2021.100145, 2021.
Grange, S. K., Sintermann, J., and Hueglin, C.: Meteorologically normalised long-term trends of atmospheric ammonia (NH3) in Switzerland/Liechtenstein and the explanatory role of gas-aerosol partitioning, Sci. Total Environ., 900, 165844, https://doi.org/10.1016/j.scitotenv.2023.165844, 2023.
Hemmilä, M., Hellén, H., Virkkula, A., Makkonen, U., Praplan, A. P., Kontkanen, J., Ahonen, L., Kulmala, M., and Hakola, H.: Amines in boreal forest air at SMEAR II station in Finland, Atmos. Chem. Phys., 18, 6367–6380, https://doi.org/10.5194/acp-18-6367-2018, 2018.
Huang, X., Ge, X., Liu, D., Tong, L., Nie, D., Shen, F., Yang, M., Wu, Y., Xiao, H., and Yu, H.: Atmospheric particle number size distribution and size-dependent formation rate and growth rate of neutral and charged new particles at a coastal site of eastern China, Atmos. Environ., 270, 118899, https://doi.org/10.1016/j.atmosenv.2021.118899, 2022.
Jion, M. M. M. F., Jannat, J. N., Mia, M. Y., Ali, M. A., Islam, M. S., Ibrahim, S. M., Pal, S. C., Islam, A., Sarker, A., Malafaia, G., Bilal, M., and Islam, A. R. M. T.: A critical review and prospect of NO2 and SO2 pollution over Asia: Hotspots, trends, and sources, Sci. Total Environ., 876, 162851, https://doi.org/10.1016/j.scitotenv.2023.162851, 2023.
Kalberer, M., Paulsen, D., Sax, M., Steinbacher, M., Dommen, J., Prevot, A. S. H., Fisseha, R., Weingartner, E., Frankevich, V., Zenobi, R., and Baltensperger, U.: Identification of Polymers as Major Components of Atmospheric Organic Aerosols, Science, 303, 1659–1662, https://doi.org/10.1126/science.1092185, 2004.
Kalkavouras, P., Grivas, G., Stavroulas, I., Petrinoli, K., Bougiatioti, A., Liakakou, E., Gerasopoulos, E., and Mihalopoulos, N.: Source apportionment of fine and ultrafine particle number concentrations in a major city of the Eastern Mediterranean, Sci. Total Environ., 915, 170042, https://doi.org/10.1016/j.scitotenv.2024.170042, 2024.
Kangasluoma, J., Cai, R., Jiang, J., Deng, C., Stolzenburg, D., Ahonen, L. R., Chan, T., Fu, Y., Kim, C., Laurila, T. M., Zhou, Y., Dada, L., Sulo, J., Flagan, R. C., Kulmala, M., Petäjä, T., and Lehtipalo, K.: Overview of measurements and current instrumentation for 1–10 nm aerosol particle number size distributions, J. Aerosol Sci., 148, 105584, https://doi.org/10.1016/j.jaerosci.2020.105584, 2020.
Kerminen, V.-M. and Kulmala, M.: Analytical formulae connecting the “real” and the “apparent” nucleation rate and the nuclei number concentration for atmospheric nucleation events, J. Aerosol Sci., 33, 609–622, https://doi.org/10.1016/S0021-8502(01)00194-X, 2002.
Kerminen, V.-M., Chen, X., Vakkari, V., Petäjä, T., Kulmala, M., and Bianchi, F.: Atmospheric new particle formation and growth: review of field observations, Environ. Res. Lett., 13, 103003, https://doi.org/10.1088/1748-9326/aadf3c, 2018.
Kittelson, D. B., Watts, W. F., Johnson, J. P., Remerowki, M. L., Ische, E. E., Oberdörster, G., Gelein, R. M., Elder, A., Hopke, P. K., Kim, E., Zhao, W., Zhou, L., and Jeong, C. H.: On-Road Exposure to Highway Aerosols. 1. Aerosol and Gas Measurements, Inhal. Toxicol., 16, 31–39, https://doi.org/10.1080/08958370490443024, 2004.
Kulmala, M., Dal Maso, M., Makela, J. M., Pirjola, L., Vakeva, M., Aalto, P., Miikkulainen, P., Hameri, K., and O'Dowd, C. D.: On the formation, growth and composition of nucleation mode particles, Tellus B, 53, 479–490, https://doi.org/10.1034/j.1600-0889.2001.d01-33.x, 2001.
Kulmala, M., Vehkamäki, H., Petäjä, T., Dal Maso, M., Lauri, A., Kerminen, V.-M., Birmili, W., and McMurry, P. H.: Formation and growth rates of ultrafine atmospheric particles: a review of observations, J. Aerosol Sci., 35, 143–176, https://doi.org/10.1016/j.jaerosci.2003.10.003, 2004.
Kulmala, M., Petaja, T., Nieminen, T., Sipila, M., Manninen, H. E., Lehtipalo, K., Dal Maso, M., Aalto, P. P., Junninen, H., Paasonen, P., Riipinen, I., Lehtinen, K. E. J., Laaksonen, A., and Kerminen, V. M.: Measurement of the nucleation of atmospheric aerosol particles, Nat. Protoc., 7, 1651–1667, https://doi.org/10.1038/nprot.2012.091, 2012.
Kulmala, M., Kontkanen, J., Junninen, H., Lehtipalo, K., Manninen, H. E., Nieminen, T., Petaja, T., Sipila, M., Schobesberger, S., Rantala, P., Franchin, A., Jokinen, T., Jarvinen, E., Aijala, M., Kangasluoma, J., Hakala, J., Aalto, P. P., Paasonen, P., Mikkila, J., Vanhanen, J., Aalto, J., Hakola, H., Makkonen, U., Ruuskanen, T., Mauldin, R. L., Duplissy, J., Vehkamaki, H., Back, J., Kortelainen, A., Riipinen, I., Kurten, T., Johnston, M. V., Smith, J. N., Ehn, M., Mentel, T. F., Lehtinen, K. E. J., Laaksonen, A., Kerminen, V. M., and Worsnop, D. R.: Direct Observations of Atmospheric Aerosol Nucleation, Science, 339, 943–946, https://doi.org/10.1126/science.1227385, 2013.
Kulmala, M., Luoma, K., Virkkula, A., Petaja, T., Paasonen, P., Kerminen, V. M., Nie, W., Qi, X. M., Shen, Y. C., Chi, X. G., and Ding, A. J.: On the mode-segregated aerosol particle number concentration load: contributions of primary and secondary particles in Hyytiala and Nanjing, Boreal Environ. Res., 21, 319–331, 2016.
Kulmala, M., Junninen, H., Dada, L., Salma, I., Weidinger, T., Thén, W., Vörösmarty, M., Komsaare, K., Stolzenburg, D., Cai, R., Yan, C., Li, X., Deng, C., Jiang, J., Petäjä, T., Nieminen, T., and Kerminen, V.-M.: Quiet New Particle Formation in the Atmosphere, Frontiers in Environmental Science, 10, 912385, https://doi.org/10.3389/fenvs.2022.912385, 2022.
Kürten, A., Bergen, A., Heinritzi, M., Leiminger, M., Lorenz, V., Piel, F., Simon, M., Sitals, R., Wagner, A. C., and Curtius, J.: Observation of new particle formation and measurement of sulfuric acid, ammonia, amines and highly oxidized organic molecules at a rural site in central Germany, Atmos. Chem. Phys., 16, 12793–12813, https://doi.org/10.5194/acp-16-12793-2016, 2016.
Kwon, H.-S., Ryu, M. H., and Carlsten, C.: Ultrafine particles: unique physicochemical properties relevant to health and disease, Exp. Mol. Med., 52, 318–328, https://doi.org/10.1038/s12276-020-0405-1, 2020.
Lehtipalo, K., Yan, C., Dada, L., Bianchi, F., Xiao, M., Wagner, R., Stolzenburg, D., Ahonen, L. R., Amorim, A., Baccarini, A., Bauer, P. S., Baumgartner, B., Bergen, A., Bernhammer, A.-K., Breitenlechner, M., Brilke, S., Buchholz, A., Mazon, S. B., Chen, D., Chen, X., Dias, A., Dommen, J., Draper, D. C., Duplissy, J., Ehn, M., Finkenzeller, H., Fischer, L., Frege, C., Fuchs, C., Garmash, O., Gordon, H., Hakala, J., He, X., Heikkinen, L., Heinritzi, M., Helm, J. C., Hofbauer, V., Hoyle, C. R., Jokinen, T., Kangasluoma, J., Kerminen, V.-M., Kim, C., Kirkby, J., Kontkanen, J., Kürten, A., Lawler, M. J., Mai, H., Mathot, S., Mauldin, R. L., Molteni, U., Nichman, L., Nie, W., Nieminen, T., Ojdanic, A., Onnela, A., Passananti, M., Petäjä, T., Piel, F., Pospisilova, V., Quéléver, L. L. J., Rissanen, M. P., Rose, C., Sarnela, N., Schallhart, S., Schuchmann, S., Sengupta, K., Simon, M., Sipilä, M., Tauber, C., Tomé, A., Tröstl, J., Väisänen, O., Vogel, A. L., Volkamer, R., Wagner, A. C., Wang, M., Weitz, L., Wimmer, D., Ye, P., Ylisirniö, A., Zha, Q., Carslaw, K. S., Curtius, J., Donahue, N. M., Flagan, R. C., Hansel, A., Riipinen, I., Virtanen, A., Winkler, P. M., Baltensperger, U., Kulmala, M., and Worsnop, D. R.: Multicomponent new particle formation from sulfuric acid, ammonia, and biogenic vapors, Science Advances, 4, eaau5363, https://doi.org/10.1126/sciadv.aau5363, 2018.
Ma, N. and Birmili, W.: Estimating the contribution of photochemical particle formation to ultrafine particle number averages in an urban atmosphere, Sci. Total Environ., 512–513, 154–166, https://doi.org/10.1016/j.scitotenv.2015.01.009, 2015.
Manninen, H. E., Nieminen, T., Asmi, E., Gagné, S., Häkkinen, S., Lehtipalo, K., Aalto, P., Vana, M., Mirme, A., Mirme, S., Hõrrak, U., Plass-Dülmer, C., Stange, G., Kiss, G., Hoffer, A., Törő, N., Moerman, M., Henzing, B., de Leeuw, G., Brinkenberg, M., Kouvarakis, G. N., Bougiatioti, A., Mihalopoulos, N., O'Dowd, C., Ceburnis, D., Arneth, A., Svenningsson, B., Swietlicki, E., Tarozzi, L., Decesari, S., Facchini, M. C., Birmili, W., Sonntag, A., Wiedensohler, A., Boulon, J., Sellegri, K., Laj, P., Gysel, M., Bukowiecki, N., Weingartner, E., Wehrle, G., Laaksonen, A., Hamed, A., Joutsensaari, J., Petäjä, T., Kerminen, V.-M., and Kulmala, M.: EUCAARI ion spectrometer measurements at 12 European sites – analysis of new particle formation events, Atmos. Chem. Phys., 10, 7907–7927, https://doi.org/10.5194/acp-10-7907-2010, 2010.
Maricq, M. M., Podsiadlik, D. H., Brehob, D. D., and Haghgooie, M.: Particulate Emissions from a Direct-Injection Spark-Ignition (DISI) Engine, SAE International, https://doi.org/10.4271/1999-01-1530, 1999.
Meier, R., Eeftens, M., Aguilera, I., Phuleria, H. C., Ineichen, A., Davey, M., Ragettli, M. S., Fierz, M., Schindler, C., Probst-Hensch, N., Tsai, M.-Y., and Künzli, N.: Ambient Ultrafine Particle Levels at Residential and Reference Sites in Urban and Rural Switzerland, Environ. Sci. Technol., 49, 2709–2715, https://doi.org/10.1021/es505246m, 2015.
Mohnen, V. A.: Formation, Nature, and Mobility of Ions of Atmospheric Importance, in: Electrical Processes in Atmospheres, edited by: Dolezalek, H., Reiter, R., and Landsberg, H. E., Steinkopff, 1–17, https://doi.org/10.1007/978-3-642-85294-7_1, 1976.
Motos, G., Corbin, J. C., Schmale, J., Modini, R. L., Bertò, M., Kupiszewski, P., Baltensperger, U., and Gysel-Beer, M.: Black Carbon Aerosols in the Lower Free Troposphere are Heavily Coated in Summer but Largely Uncoated in Winter at Jungfraujoch in the Swiss Alps, Geophys. Res. Lett., 47, e2020GL088011, https://doi.org/10.1029/2020GL088011, 2020.
Nieminen, T., Kerminen, V.-M., Petäjä, T., Aalto, P. P., Arshinov, M., Asmi, E., Baltensperger, U., Beddows, D. C. S., Beukes, J. P., Collins, D., Ding, A., Harrison, R. M., Henzing, B., Hooda, R., Hu, M., Hõrrak, U., Kivekäs, N., Komsaare, K., Krejci, R., Kristensson, A., Laakso, L., Laaksonen, A., Leaitch, W. R., Lihavainen, H., Mihalopoulos, N., Németh, Z., Nie, W., O'Dowd, C., Salma, I., Sellegri, K., Svenningsson, B., Swietlicki, E., Tunved, P., Ulevicius, V., Vakkari, V., Vana, M., Wiedensohler, A., Wu, Z., Virtanen, A., and Kulmala, M.: Global analysis of continental boundary layer new particle formation based on long-term measurements, Atmos. Chem. Phys., 18, 14737–14756, https://doi.org/10.5194/acp-18-14737-2018, 2018.
Olin, M., Okuljar, M., Rissanen, M. P., Kalliokoski, J., Shen, J., Dada, L., Lampimäki, M., Wu, Y., Lohila, A., Duplissy, J., Sipilä, M., Petäjä, T., Kulmala, M., and Dal Maso, M.: Measurement report: Atmospheric new particle formation in a coastal agricultural site explained with binPMF analysis of nitrate CI-APi-TOF spectra, Atmos. Chem. Phys., 22, 8097–8115, https://doi.org/10.5194/acp-22-8097-2022, 2022.
Pedersen, J., Nyord, T., Feilberg, A., and Labouriau, R.: Analysis of the effect of air temperature on ammonia emission from band application of slurry, Environ. Pollut., 282, 117055, https://doi.org/10.1016/j.envpol.2021.117055, 2021.
Petäjä, T., Mauldin, III, R. L., Kosciuch, E., McGrath, J., Nieminen, T., Paasonen, P., Boy, M., Adamov, A., Kotiaho, T., and Kulmala, M.: Sulfuric acid and OH concentrations in a boreal forest site, Atmos. Chem. Phys., 9, 7435–7448, https://doi.org/10.5194/acp-9-7435-2009, 2009.
Reche, C., Querol, X., Alastuey, A., Viana, M., Pey, J., Moreno, T., Rodríguez, S., González, Y., Fernández-Camacho, R., de la Rosa, J., Dall'Osto, M., Prévôt, A. S. H., Hueglin, C., Harrison, R. M., and Quincey, P.: New considerations for PM, Black Carbon and particle number concentration for air quality monitoring across different European cities, Atmos. Chem. Phys., 11, 6207–6227, https://doi.org/10.5194/acp-11-6207-2011, 2011.
Reche, C., Pérez, N., Alastuey, A., Cots, N., Pérez, E., and Querol, X.: 2011–2020 trends of urban and regional ammonia in and around Barcelona, NE Spain, Chemosphere, 304, 135347, https://doi.org/10.1016/j.chemosphere.2022.135347, 2022.
Reidy, B., Rhim, B., and Menzi, H.: A new Swiss inventory of ammonia emissions from agriculture based on a survey on farm and manure management and farm-specific model calculations, Atmos. Environ., 42, 3266–3276, https://doi.org/10.1016/j.atmosenv.2007.04.036, 2008.
Rinne, J., Ruuskanen, T. M., Reissell, A., Taipale, R., Hakola, H., and Kulmala, M.: On-line PTR-MS measurements of atmospheric concentrations of volatile organic compounds in a European boreal forest ecosystem, Boreal Environ. Res., 10, 425–436, 2005.
Rivas, I., Beddows, D. C. S., Amato, F., Green, D. C., Järvi, L., Hueglin, C., Reche, C., Timonen, H., Fuller, G. W., Niemi, J. V., Pérez, N., Aurela, M., Hopke, P. K., Alastuey, A., Kulmala, M., Harrison, R. M., Querol, X., and Kelly, F. J.: Source apportionment of particle number size distribution in urban background and traffic stations in four European cities, Environ. Int., 135, 105345, https://doi.org/10.1016/j.envint.2019.105345, 2020.
Rodríguez, S. and Cuevas, E.: The contributions of “minimum primary emissions” and “new particle formation enhancements” to the particle number concentration in urban air, J. Aerosol Sci., 38, 1207–1219, https://doi.org/10.1016/j.jaerosci.2007.09.001, 2007.
Rönkkö, T., Kuuluvainen, H., Karjalainen, P., Keskinen, J., Hillamo, R., Niemi, J. V., Pirjola, L., Timonen, H. J., Saarikoski, S., Saukko, E., Jarvinen, A., Silvennoinen, H., Rostedt, A., Olin, M., Yli-Ojanpera, J., Nousiainen, P., Kousa, A., and Dal Maso, M.: Traffic is a major source of atmospheric nanocluster aerosol, P. Natl. Acad. Sci. USA, 114, 7549–7554, https://doi.org/10.1073/pnas.1700830114, 2017.
Saarikoski, S., Hellén, H., Praplan, A. P., Schallhart, S., Clusius, P., Niemi, J. V., Kousa, A., Tykkä, T., Kouznetsov, R., Aurela, M., Salo, L., Rönkkö, T., Barreira, L. M. F., Pirjola, L., and Timonen, H.: Characterization of volatile organic compounds and submicron organic aerosol in a traffic environment, Atmos. Chem. Phys., 23, 2963–2982, https://doi.org/10.5194/acp-23-2963-2023, 2023.
Sánchez, G., Serrano, A., and Cancillo, M.: Effect of cloudiness on solar global, solar diffuse and terrestrial downward radiation at Badajoz (Southwestern Spain), Optica Pura y Aplicada, 45, 33–38, 2012.
Schraufnagel, D. E.: The health effects of ultrafine particles, Exp. Mol. Med., 52, 311–317, https://doi.org/10.1038/s12276-020-0403-3, 2020.
Schultz, M. G., Schröder, S., Lyapina, O., Cooper, O. R., Galbally, I., Petropavlovskikh, I., von Schneidemesser, E., Tanimoto, H., Elshorbany, Y., Naja, M., Seguel, R. J., Dauert, U., Eckhardt, P., Feigenspan, S., Fiebig, M., Hjellbrekke, A.-G., Hong, Y.-D., Kjeld, P. C., Koide, H., Lear, G., Tarasick, D., Ueno, M., Wallasch, M., Baumgardner, D., Chuang, M.-T., Gillett, R., Lee, M., Molloy, S., Moolla, R., Wang, T., Sharps, K., Adame, J. A., Ancellet, G., Apadula, F., Artaxo, P., Barlasina, M. E., Bogucka, M., Bonasoni, P., Chang, L., Colomb, A., Cuevas-Agulló, E., Cupeiro, M., Degorska, A., Ding, A., Fröhlich, M., Frolova, M., Gadhavi, H., Gheusi, F., Gilge, S., Gonzalez, M. Y., Gros, V., Hamad, S. H., Helmig, D., Henriques, D., Hermansen, O., Holla, R., Hueber, J., Im, U., Jaffe, D. A., Komala, N., Kubistin, D., Lam, K.-S., Laurila, T., Lee, H., Levy, I., Mazzoleni, C., Mazzoleni, L. R., McClure-Begley, A., Mohamad, M., Murovec, M., Navarro-Comas, M., Nicodim, F., Parrish, D., Read, K. A., Reid, N., Ries, L., Saxena, P., Schwab, J. J., Scorgie, Y., Senik, I., Simmonds, P., Sinha, V., Skorokhod, A. I., Spain, G., Spangl, W., Spoor, R., Springston, S. R., Steer, K., Steinbacher, M., Suharguniyawan, E., Torre, P., Trickl, T., Weili, L., Weller, R., Xiaobin, X., Xue, L., and Zhiqiang, M.: Tropospheric Ozone Assessment Report: Database and metrics data of global surface ozone observations, Elementa: Science of the Anthropocene, 5, 58, https://doi.org/10.1525/elementa.244, 2017.
Seinfeld, J. H. and Pandis, S.: Atmospheric Chemistry and Physics: From Air Pollution to Climate Change, 3rd edn., John Wiley & Sons, Inc., ISBN: 978-1-118-94740-1, 2016.
Sihto, S.-L., Kulmala, M., Kerminen, V.-M., Dal Maso, M., Petäjä, T., Riipinen, I., Korhonen, H., Arnold, F., Janson, R., Boy, M., Laaksonen, A., and Lehtinen, K. E. J.: Atmospheric sulphuric acid and aerosol formation: implications from atmospheric measurements for nucleation and early growth mechanisms, Atmos. Chem. Phys., 6, 4079–4091, https://doi.org/10.5194/acp-6-4079-2006, 2006.
Sun, J., Hermann, M., Weinhold, K., Merkel, M., Birmili, W., Yang, Y., Tuch, T., Flentje, H., Briel, B., Ries, L., Couret, C., Elsasser, M., Sohmer, R., Wirtz, K., Meinhardt, F., Schütze, M., Bath, O., Hellack, B., Kerminen, V.-M., Kulmala, M., Ma, N., and Wiedensohler, A.: Measurement report: Contribution of atmospheric new particle formation to ultrafine particle concentration, cloud condensation nuclei, and radiative forcing – results from 5-year observations in central Europe, Atmos. Chem. Phys., 24, 10667–10687, https://doi.org/10.5194/acp-24-10667-2024, 2024.
MeteoSwiss: SwissMetNet, https://www.meteoswiss.admin.ch/services-and-publications/applications/ext/download-data-without-coding-skills.html, last access: 12 June 2025.
Tørseth, K., Aas, W., and Solberg, S.: The European Monitoring and Evaluation Programme (EMEP) – A Coordinated Effort to Provide Harmonized Observation of Air Pollution and Atmospheric Composition, in: Handbook of Air Quality and Climate Change, edited by: Akimoto, H. and Tanimoto, H., Springer Nature Singapore, Singapore, 149–156, https://doi.org/10.1007/978-981-15-2760-9_10, 2023.
Trechera, P., Garcia-Marlès, M., Liu, X., Reche, C., Pérez, N., Savadkoohi, M., Beddows, D., Salma, I., Vörösmarty, M., Casans, A., Casquero-Vera, J. A., Hueglin, C., Marchand, N., Chazeau, B., Gille, G., Kalkavouras, P., Mihalopoulos, N., Ondracek, J., Zikova, N., Niemi, J. V., Manninen, H. E., Green, D. C., Tremper, A. H., Norman, M., Vratolis, S., Eleftheriadis, K., Gómez-Moreno, F. J., Alonso-Blanco, E., Gerwig, H., Wiedensohler, A., Weinhold, K., Merkel, M., Bastian, S., Petit, J.-E., Favez, O., Crumeyrolle, S., Ferlay, N., Martins Dos Santos, S., Putaud, J.-P., Timonen, H., Lampilahti, J., Asbach, C., Wolf, C., Kaminski, H., Altug, H., Hoffmann, B., Rich, D. Q., Pandolfi, M., Harrison, R. M., Hopke, P. K., Petäjä, T., Alastuey, A., and Querol, X.: Phenomenology of ultrafine particle concentrations and size distribution across urban Europe, Environ. Int., 172, 107744, https://doi.org/10.1016/j.envint.2023.107744, 2023.
Vana, M., Komsaare, K., Horrak, U., Mirme, S., Nieminen, T., Kontkanen, J., Manninen, H. E., Petaja, T., Noe, S. M., and Kulmala, M.: Characteristics of new-particle formation at three SMEAR stations, Boreal Environ. Res., 21, 345–362, 2016.
Vestreng, V., Myhre, G., Fagerli, H., Reis, S., and Tarrasón, L.: Twenty-five years of continuous sulphur dioxide emission reduction in Europe, Atmos. Chem. Phys., 7, 3663–3681, https://doi.org/10.5194/acp-7-3663-2007, 2007.
Vörösmarty, M., Hopke, P. K., and Salma, I.: Attribution of aerosol particle number size distributions to main sources using an 11-year urban dataset, Atmos. Chem. Phys., 24, 5695–5712, https://doi.org/10.5194/acp-24-5695-2024, 2024.
Wang, J., Wu, Y., Ge, X., Shen, Y., Ge, S., and Chen, M.: Characteristics and sources of ambient refractory black carbon aerosols: Insights from soot particle aerosol mass spectrometer, Atmos. Environ., 185, 147–152, https://doi.org/10.1016/j.atmosenv.2018.05.011, 2018.
Wu, Z. J., Ma, N., Größ, J., Kecorius, S., Lu, K. D., Shang, D. J., Wang, Y., Wu, Y. S., Zeng, L. M., Hu, M., Wiedensohler, A., and Zhang, Y. H.: Thermodynamic properties of nanoparticles during new particle formation events in the atmosphere of North China Plain, Atmos. Res., 188, 55–63, https://doi.org/10.1016/j.atmosres.2017.01.007, 2017.
Xiao, M., Hoyle, C. R., Dada, L., Stolzenburg, D., Kürten, A., Wang, M., Lamkaddam, H., Garmash, O., Mentler, B., Molteni, U., Baccarini, A., Simon, M., He, X.-C., Lehtipalo, K., Ahonen, L. R., Baalbaki, R., Bauer, P. S., Beck, L., Bell, D., Bianchi, F., Brilke, S., Chen, D., Chiu, R., Dias, A., Duplissy, J., Finkenzeller, H., Gordon, H., Hofbauer, V., Kim, C., Koenig, T. K., Lampilahti, J., Lee, C. P., Li, Z., Mai, H., Makhmutov, V., Manninen, H. E., Marten, R., Mathot, S., Mauldin, R. L., Nie, W., Onnela, A., Partoll, E., Petäjä, T., Pfeifer, J., Pospisilova, V., Quéléver, L. L. J., Rissanen, M., Schobesberger, S., Schuchmann, S., Stozhkov, Y., Tauber, C., Tham, Y. J., Tomé, A., Vazquez-Pufleau, M., Wagner, A. C., Wagner, R., Wang, Y., Weitz, L., Wimmer, D., Wu, Y., Yan, C., Ye, P., Ye, Q., Zha, Q., Zhou, X., Amorim, A., Carslaw, K., Curtius, J., Hansel, A., Volkamer, R., Winkler, P. M., Flagan, R. C., Kulmala, M., Worsnop, D. R., Kirkby, J., Donahue, N. M., Baltensperger, U., El Haddad, I., and Dommen, J.: The driving factors of new particle formation and growth in the polluted boundary layer, Atmos. Chem. Phys., 21, 14275–14291, https://doi.org/10.5194/acp-21-14275-2021, 2021.
Yan, C., Yin, R., Lu, Y., Dada, L., Yang, D., Fu, Y., Kontkanen, J., Deng, C., Garmash, O., Ruan, J., Baalbaki, R., Schervish, M., Cai, R., Bloss, M., Chan, T., Chen, T., Chen, Q., Chen, X., Chen, Y., Chu, B., Dällenbach, K., Foreback, B., He, X., Heikkinen, L., Jokinen, T., Junninen, H., Kangasluoma, J., Kokkonen, T., Kurppa, M., Lehtipalo, K., Li, H., Li, H., Li, X., Liu, Y., Ma, Q., Paasonen, P., Rantala, P., Pileci, R. E., Rusanen, A., Sarnela, N., Simonen, P., Wang, S., Wang, W., Wang, Y., Xue, M., Yang, G., Yao, L., Zhou, Y., Kujansuu, J., Petäjä, T., Nie, W., Ma, Y., Ge, M., He, H., Donahue, N. M., Worsnop, D. R., Kerminen, V.-M., Wang, L., Liu, Y., Zheng, J., Kulmala, M., Jiang, J., and Bianchi, F.: The Synergistic Role of Sulfuric Acid, Bases, and Oxidized Organics Governing New-Particle Formation in Beijing, Geophys. Res. Lett., 48, e2020GL091944, https://doi.org/10.1029/2020GL091944, 2021.
Yao, L., Garmash, O., Bianchi, F., Zheng, J., Yan, C., Kontkanen, J., Junninen, H., Mazon, S. B., Ehn, M., Paasonen, P., Sipila, M., Wang, M. Y., Wang, X. K., Xiao, S., Chen, H. F., Lu, Y. Q., Zhang, B. W., Wang, D. F., Fu, Q. Y., Geng, F. H., Li, L., Wang, H. L., Qiao, L. P., Yang, X., Chen, J. M., Kerminen, V. M., Petaja, T., Worsnop, D. R., Kulmala, M., and Wang, L.: Atmospheric new particle formation from sulfuric acid and amines in a Chinese megacity, Science, 361, 278–281, https://doi.org/10.1126/science.aao4839, 2018.
Yli-Juuti, T., Nieminen, T., Hirsikko, A., Aalto, P. P., Asmi, E., Hõrrak, U., Manninen, H. E., Patokoski, J., Dal Maso, M., Petäjä, T., Rinne, J., Kulmala, M., and Riipinen, I.: Growth rates of nucleation mode particles in Hyytiälä during 2003−2009: variation with particle size, season, data analysis method and ambient conditions, Atmos. Chem. Phys., 11, 12865–12886, https://doi.org/10.5194/acp-11-12865-2011, 2011.
Zanatta, M., Gysel, M., Bukowiecki, N., Muller, T., Weingartner, E., Areskoug, H., Fiebig, M., Yttri, K. E., Mihalopoulos, N., Kouvarakis, G., Beddows, D., Harrison, R. M., Cavalli, F., Putaud, J. P., Spindler, G., Wiedensohler, A., Alastuey, A., Pandolfi, M., Sellegri, K., Swietlicki, E., Jaffrezo, J. L., Baltensperger, U., and Laj, P.: A European aerosol phenomenology-5: Climatology of black carbon optical properties at 9 regional background sites across Europe, Atmos. Environ., 145, 346–364, https://doi.org/10.1016/j.atmosenv.2016.09.035, 2016.
Zhou, Y., Dada, L., Liu, Y., Fu, Y., Kangasluoma, J., Chan, T., Yan, C., Chu, B., Daellenbach, K. R., Bianchi, F., Kokkonen, T. V., Liu, Y., Kujansuu, J., Kerminen, V.-M., Petäjä, T., Wang, L., Jiang, J., and Kulmala, M.: Variation of size-segregated particle number concentrations in wintertime Beijing, Atmos. Chem. Phys., 20, 1201–1216, https://doi.org/10.5194/acp-20-1201-2020, 2020.
Zhou, Y., Hakala, S., Yan, C., Gao, Y., Yao, X., Chu, B., Chan, T., Kangasluoma, J., Gani, S., Kontkanen, J., Paasonen, P., Liu, Y., Petäjä, T., Kulmala, M., and Dada, L.: Measurement report: New particle formation characteristics at an urban and a mountain station in northern China, Atmos. Chem. Phys., 21, 17885–17906, https://doi.org/10.5194/acp-21-17885-2021, 2021.
Zhu, S., Yan, C., Zheng, J., Chen, C., Ning, H., Yang, D., Wang, M., Ma, Y., Zhan, J., Hua, C., Yin, R., Li, Y., Liu, Y., Jiang, J., Yao, L., Wang, L., Kulmala, M., and Worsnop, D. R.: Observation and Source Apportionment of Atmospheric Alkaline Gases in Urban Beijing, Environ. Sci. Technol., 56, 17545–17555, https://doi.org/10.1021/acs.est.2c03584, 2022.
Zotter, P., Ciobanu, V. G., Zhang, Y. L., El-Haddad, I., Macchia, M., Daellenbach, K. R., Salazar, G. A., Huang, R.-J., Wacker, L., Hueglin, C., Piazzalunga, A., Fermo, P., Schwikowski, M., Baltensperger, U., Szidat, S., and Prévôt, A. S. H.: Radiocarbon analysis of elemental and organic carbon in Switzerland during winter-smog episodes from 2008 to 2012 – Part 1: Source apportionment and spatial variability, Atmos. Chem. Phys., 14, 13551–13570, https://doi.org/10.5194/acp-14-13551-2014, 2014.
Zotter, P., Herich, H., Gysel, M., El-Haddad, I., Zhang, Y., Močnik, G., Hüglin, C., Baltensperger, U., Szidat, S., and Prévôt, A. S. H.: Evaluation of the absorption Ångström exponents for traffic and wood burning in the Aethalometer-based source apportionment using radiocarbon measurements of ambient aerosol, Atmos. Chem. Phys., 17, 4229–4249, https://doi.org/10.5194/acp-17-4229-2017, 2017.