the Creative Commons Attribution 4.0 License.
the Creative Commons Attribution 4.0 License.
 | 02 Jul 2025
Development and characterization of an aircraft inlet system for broader quantitative particle sampling at higher altitudes: aerodynamic lenses, beam and vaporizer diagnostics, and pressure-controlled inlets
Dongwook Kim
Pedro Campuzano-Jost
Hongyu Guo
Douglas A. Day
Da Yang
Suresh Dhaniyala
Leah Williams
Philip Croteau
John Jayne
Douglas Worsnop
Rainer Volkamer
Jose L. Jimenez
Field-deployable real-time aerosol mass spectrometers (AMSs) typically use an aerodynamic lens as an inlet that collimates aerosols into a narrow beam over a wide range of particle sizes. Such lenses need constant upstream pressure to work consistently. Deployments in environments where the ambient pressure changes, e.g., on aircraft, typically use pressure-controlled inlets (PCIs). These have performed less well for supermicron aerosols, such as the larger particles in stratospheric air and some urban hazes. In this study, we developed and characterized a new PCI design (“CU PCI-D”) coupled with a recently developed PM2.5 aerodynamic lens, with the goal of sampling the full accumulation mode of ambient aerosols with minimal losses up to upper troposphere and lower stratosphere (UTLS) altitudes. A new computer-controlled lens alignment system and a new 2D particle beam imaging device that improves upon the Aerodyne aerosol beam width probe (BWP) have been developed and tested. These techniques allow for fast automated aerosol beam width and position measurements and ensure the aerodynamic lens is properly aligned and characterized for accurate quantification, in particular for small sizes that are hard to access with monodisperse measurements. The automated lens alignment tool also allows position-dependent thermal decomposition to be investigated on the vaporizer surface. The CU PCI-D was tested on the TI3GER campaign aboard the NCAR/NSF G-V aircraft. Based on comparisons with the co-sampling UHSAS particle sizer, the CU aircraft AMS with the modified PCI consistently measured ∼ 89 % of the accumulation-mode particle mass in the UTLS.
- Article
(5735 KB) - Full-text XML
-
Supplement
(16347 KB) - BibTeX
- EndNote


Aerosols play an important role in the atmosphere's radiative balance via direct and indirect forcing (IPCC, 2014; Seinfeld and Pandis, 2016). In the upper troposphere, condensable vapors formed from convected precursors create new particles, helped by the low temperature and low condensational sink, providing cloud condensation nuclei to the lower troposphere (Williamson et al., 2019). Stratospheric aerosols have a significant radiative forcing due to their long lifetime. Most stratospheric aerosols are sulfate or carbonaceous. A minor portion of stratospheric aerosols originate from meteors and spacecraft (Murphy et al., 1998, 2023). Some geoengineering proposals suggest the injection of sulfur into the stratosphere to form sulfate aerosols that would scatter incoming solar radiation and combat global warming (Crutzen, 2006; Robock et al., 2009; Keith et al., 2016). Aerosols also provide a medium for heterogeneous reactions that enhance the reactive chlorine budget, which causes ozone destruction (Fahey et al., 1993). More recently, Solomon et al. (2023) suggested that organic aerosols originating from biomass burning enhance stratospheric chlorine activation, leading to further ozone destruction. Annual mean ozone in the lower stratosphere (LS; from tropopause to ∼ 30 hPa) has decreased for the last few decades, a trend not captured by models (Ball et al., 2020). Recent studies have suggested that short-lived halogen compounds (Villamayor et al., 2023), including iodine cycling between both the gas and particle phases (Koenig et al., 2020), may contribute to ozone destruction in the LS. However, quantitative observations of the chemical composition of stratospheric aerosol by in situ instruments are rare due to the challenges of reaching and operating at these high altitudes.
Field-deployable aerosol mass spectrometers measure aerosol chemical composition in real-time using a specialized inlet, typically an aerodynamic lens (ADL), which focuses particles over a relatively large range of sizes into a narrow particle beam with minimal losses. These spectrometers include the Aerodyne aerosol mass spectrometer (AMS; Aerodyne Research) (Canagaratna et al., 2007), single-particle mass spectrometers such as particle analysis by laser mass spectrometry (PALMS) and aerosol time-of-flight mass spectrometry (ATOFMS) instruments, the Aircraft-based Laser ABlation Aerosol Mass Spectrometer (ALABAMA) (Pratt et al., 2009; Clemen et al., 2020; Jacquot et al., 2024), and the chemical analysis of aerosol online (CHARON) instrument (Müller et al., 2017; Piel et al., 2019). The standard Liu type lens (also commonly referred to as the PM1 lens, where PM1 means particulate matter below 1 µm diameter) has been the most widely used ADL in the past decades (Liu et al., 1995a, b, 2007; Zhang et al., 2002, 2004b). The particle transmission efficiency (TE) through an ADL depends not only on the physical design but also on the operating pressures, the size of the critical orifice used upstream of the ADL, and the solid angle of the particle beam that overlaps with the detector area (Huffman et al., 2005; Murphy, 2007). A particle relaxation chamber can be added to reduce particle losses after critical orifices (Wang and McMurry, 2007). The PM1 lens transmits most particles in the range of ∼ 50–800 nm vacuum aerodynamic diameter (dva), encompassing most of the accumulation-mode aerosols in the troposphere (Guo et al., 2021). However, the PM1 lens can miss a significant fraction of aerosol mass when the accumulation mode grows very large, e.g., in highly polluted environments (Elser et al., 2016) and in the stratosphere (Brock et al., 2019; Guo et al., 2021). Two other ADL designs developed at Aerodyne, the high-pressure lens (HPL) (Williams et al., 2013) and the PM2.5 lens (Peck et al., 2016; Xu et al., 2017), significantly extended the transmittable aerosol size range beyond 1 µm dva by increasing the operating pressures. A custom-designed ADL with conical-shaped orifices enabled supermicron aerosol sampling in the ALABAMA instrument (Clemen et al., 2020).
In an AMS, the particle beam collimated by an ADL is flash-vaporized on a porous tungsten inverted cone (standard vaporizer, SV; 3.8 mm o.d.) at ∼ 600 °C. The depth of the inverted cone is 4 mm (Hu et al., 2017a). The vaporized molecules can be ionized by electron ionization (EI; ∼ 70 eV) and detected by time-of-flight mass spectrometry (Canagaratna et al., 2007). Both the thermal vaporization and the hard ionization often cause molecular fragmentation. Analysis of the fragmentation patterns allows characterization of organic aerosols (e.g., oxygenated versus hydrocarbon-like organic aerosol) (Ng et al., 2011) and in some cases sulfate (e.g., inorganic versus organic sulfate) (Chen et al., 2019; Song et al., 2019; Schueneman et al., 2021). Apportionment of organic vs. inorganic nitrate has been attempted based on the low observed NO ratio (NO NO+) from organic nitrates compared to NH4NO3 (Farmer et al., 2010; Day et al., 2022). Day et al. (2022) summarized the AMS instrumental variabilities of the NO ratio from NH4NO3 and organic nitrates and demonstrated that the NO ratio variability from organic nitrates can be corrected by the NO ratio of NH4NO3. While the particles (or vaporized gases) likely interact more with the hot vaporizer surface when the particle beam impacts near the center of the SV due to its conical geometry, this effect has not been thoroughly investigated. It is typically assumed that the location of particle beam impaction on the vaporizer does not significantly affect the thermal decomposition of vaporized molecules.
Maximizing the particle transmission efficiency (TE) of an inlet requires careful ADL alignment so that the overlap of the particle beam with the vaporizer surface is maximized. Conventionally, an ADL is aligned manually in an iterative process of positioning a monodisperse particle beam (typically size-selected 300 nm NH4NO3 particles) near the center of the vaporizer relying on the particle signal vs. lens movement to find the edges, which can be time-consuming and prone to human error. It is assumed that the particle beam from an ADL is well collimated across the particle diameters of interest and that the variability in particle beam center position of different particle sizes is negligible. Regular beam position measurements of monodisperse aerosols are recommended to be able to detect any changes in beam position over time, which have been observed occasionally when shipping the instrument and/or on mobile platforms. Some AMS instruments are equipped with a capture vaporizer (CV) to fully vaporize particles (Xu et al., 2017). Compared to the standard vaporizer, more careful alignment is needed when using a CV whose cavity entrance diameter is smaller (2.5 mm o.d., so 44 % of the cross-sectional area of the standard vaporizer, perpendicular to the beam path).
Manufacturing ADLs requires tight mechanical tolerances, and at times, particle beam focusing and pointing are imperfect (Williams et al., 2013). One way to monitor the beam-focusing ability of an ADL is by taking a photograph of the particle deposition pattern of polydisperse aerosols on a flat surface located in front of the vaporizer. However, this method does not provide the beam information of particles of specific diameter. A beam width probe (BWP; Aerodyne Research) has been used previously to diagnose the aerosol beam width and center position relative to the main AMS axis (Huffman et al., 2005; Salcedo et al., 2007). The BWP consists of a thin wire (typically 0.5 mm thick) that is moved in steps in front of the skimmer upstream of the vaporizer/ionizer. AMS concentration measurements from a stable particle source are used to quantify the position-dependent signal attenuation of the particle beam by the wire, which is used to derive aerosol beam width and position (Huffman et al., 2005). The particle beam width produced by the PM1 lens for most particle types appears to be narrow enough to fully overlap the AMS vaporizer (Huffman et al., 2005). Thorough size-dependent beam width/position analyses of aerosol beams from the PM1 lens, PM2.5 lens, and HPL lens have not been reported to date. Moreover, previous BWP measurements were performed in only one dimension. Potentially, ADL imperfections may cause elliptical or irregularly shaped particle beams. To diagnose the homogeneity in particle beam width and position, BWP measurement in both dimensions orthogonal to the beam path are preferable.
While sampling aerosols on aircraft platforms, aerosols are drawn into the airplane through a dedicated inlet (e.g., HIAPER Modular Inlet, HIMIL, https://www.eol.ucar.edu/content/air-sample-inlets, last access: 22 November 2024) that uses one or several diffusers to slow down the airspeed to reduce particle losses in the sampling lines downstream. Once in the aircraft, the particle-containing airflow is delivered to the instrument at a pressure typically close to that outside the aircraft, which varies substantially with altitude. To achieve consistent particle-focusing performance, the lens entry pressure needs to be kept within ∼ 10 %–15 % of the design value. When the lens operating pressure changes beyond that range, the particle TE changes substantially, with lower (higher) pressures favoring the TE of smaller (larger) particles (Bahreini et al., 2003; Liu et al., 2007). The first reported pressure-controlled inlet (PCI) for an AMS (Bahreini et al., 2008) maintained a constant ADL upstream pressure up to ∼ 6.5 km altitude. That PCI consisted of a small cylindrical volume upstream of the lens between two critical orifices (COs) kept at constant pressure by a PID-controlled valve pumping the excess flow from the volume. Further improvements to this PCI design with larger COs and a newly designed expansion volume between the CO downstream of the PCI and the ADL enabled stable particle sampling up to 12 km altitude over the 50–750 nm dva range (Guo et al., 2021). As noted in Guo et al. (2021), that PCI design (CU PCI-C) is not suitable to be operated at lower input pressures (larger COs and lower PCI operating pressure) without major particle losses, and it does not benefit from the new, wider size-transmission ADLs that have been recently demonstrated (Williams et al., 2013; Xu et al., 2017) due to its own limited particle transmission. Hence a new PCI design that addresses these shortcomings while keeping residence times small is needed.
Recently, an alternative PCI was developed using a pinched O-ring as a flow restriction, which can operate at up to 20 km altitude (Molleker et al., 2020) and was tested with a PM2.5 lens. This system may be more compact and lighter since an additional pump for the PCI excess flow is not required. However, limitations on the reproducibility of the O-ring diameter and shape can lead to significant particle losses that are hard to diagnose (Molleker et al., 2020). Clemen et al. (2020) demonstrated an improved aircraft inlet for the Aircraft-based Laser ABlation Aerosol MAss spectrometer (ALABAMA) by combining the PCI of Molleker et al. (2020) with a newly designed aerodynamic lens that significantly enhanced particle transmission (50 % TE at ∼ 3 µm dva) compared to the aircraft inlets described above. These studies, however, did not investigate the transmission of small particles through the inlet, which is important for sampling particle growth events in both urban plumes (Allan et al., 2003b) and the upper free troposphere (Williamson et al., 2019). Sampling small particles (below ∼ 100 nm dva) has been a weakness of ADLs designed for large particle transmission (Williams et al., 2013; Xu et al., 2017).
Here we present a newly developed inlet system, consisting of a redesigned PCI and incorporating a PM2.5 lens. Several new diagnostics tools were developed to more accurately characterize the inlet both during development and later as part of the in-field quality control of inlet performance. These include a lens scanning stage that allows a quick and accurate lens alignment, a two-dimensional BWP (2D-BWP) system that measures particle beam position and width vs. particle size, and an improved calibration particle generation system for particles below 100 nm diameter. Lens scanning provides unique opportunities to investigate the variability in molecular fragmentation depending on the location of particle impaction on the vaporizer. A 2D Gaussian aerosol beam model was developed to estimate particle loss by beam broadening and irregular pointing. We use these systems to characterize the aircraft inlet in combination with several ADLs. We characterized the performance of the entire aircraft inlet system during the Technological Innovation Into Iodine for Gulfstream V (GV) Environmental Research (TI3GER) field campaign, which reached the lower stratosphere. Finally, for a full picture of particle losses in the aircraft sampling system, we also characterized the flow field inside the HIAPER Modular Inlet (HIMIL) (Stith et al., 2009) using a wind tunnel facility.
2.1 Experimental setups for inlet characterizations in the laboratory
Monodisperse aerosols of a range of particle sizes (nominally 30–850 nm mobility diameter, dm) were generated. Figure 1 illustrates the experimental setups used for aerosol generation and sampling. Inorganic salts (NH4NO3, (NH4)2SO4, and NH4I) dissolved in water were used to generate test and calibration aerosols of dm = 250 to 850 nm. These mobility diameters cover a range of dva up to ∼ 1800 nm. Inorganic aerosols were generated with an atomizer (TSI, model 3076) and then dried with a Nafion dryer (Perma Pure, model MD-110-72). The size was selected by a differential mobility analyzer (DMA; TSI, model 3081), which was operated with an impactor to minimize/eliminate the contribution of larger multiply charged particles to the test aerosol. The DMA was calibrated using polystyrene latex spheres (PSLs). The resolution of the DMA was ∼ 10 (, where Δdm refers to the full width at half-maximum of the distribution in log diameter space).

Figure 1Schematic of the experimental setups for inlet characterizations in the laboratory. Monodisperse inorganic or oleic acid aerosols were used for most of the tests and calibrations. CPC particle dilution was enabled during the oleic acid particle generation below 100 nm diameter. Polydisperse aerosols (NH4NO3) were used for 2D-BWP experiments. FM stands for flow meter. When operating both the TSI and 3D-printed atomizers, the zero air pressure was set to ∼ 2.4 bar (∼ 35 psi).
For smaller monodisperse particle generation (dm ∼ 30–300 nm), an evaporation–condensation aerosol generator was used (Sect. S1 in the Supplement). Oleic acid was evaporated in a heated glass bulb and then quenched with zero air (ZA) to generate a monomodal particle size distribution via condensational narrowing of the distribution. An impactor was not used here to reduce the potential for multiply charged particles. Instead, the aerosol generation system was tuned to produce relatively small particle modes, so that the desired size to select was at the right shoulder of size distribution. Consequently, larger particles that would be transmitted as doubly charged were minimal (see Sect. S1).
A TSI condensation particle counter (CPC model 3010, flow rate = 1 L min−1) was used to measure particle number concentration. Sampling line pressure and temperature were monitored and logged continuously, so that CPC counts could be converted to number concentration at standard temperature and pressure (scm−3) for direct comparison to AMS-measured mass concentrations (µg sm−3). The prefix “s” stands for standard temperature (273 K) and pressure (1013 hPa) conditions, per NASA convention (sometimes denoted as “µg m−3 STP”). When generating monodisperse oleic acid particles of < 70 nm, very high number concentrations need to be generated to achieve usable but still modest mass concentrations, leading to saturation of the CPC (nominally designed for up to 104 particles cm−3, although in practice some saturation can often be observed at slightly lower concentrations). To avoid this problem, a particle dilution assembly was used upstream of CPC. The assembly consists of a short section (30 cm) of thin stainless steel tubing (i.d. = 0.89 mm) in parallel with a filter (Model 30/25, Balston Inc.) (Fig. 1). Most of the flow goes through the filter, which allows a large majority of the particles to be removed reproducibly (∼ 96 %, equivalent to ∼ 25 × dilution). The dilution factor is computed based on a 10 Hz flowmeter measurement of the filter flow and was regularly confirmed by rapid back-to-back concentration measurements (Fig. S2.1).
Polydisperse aerosols were used for the size-resolved BWP (SR-BWP) measurements (Sect. 3.2). They were generated by nebulizing an NH4NO3 solution (∼ 0.05 M, mol L−1). The SR-BWP analysis requires a stable high concentration of aerosols with a broad size distribution. To increase the stability of the size distribution (in both shape and overall concentration), a mixing/buffer volume (13 L with a residence time of ∼ 1 min) was incorporated into the setup. The AMS and a scanning mobility particle sizer (SMPS; Classifier model 3080 with CPC 3775) were used to monitor the stability of polydisperse aerosol size distribution. A Grimm optical particle counter (OPC; model 1.109) was also used to provide supplementary size distribution measurements. A 3D-printed nebulizer, a modified, larger version (Fig. S7.1b) of the one described in Rösch and Cziczo (2020) with different fittings and critical orifice mounting, was used for these experiments. The peak diameter in the volume distribution from the nebulizer was ∼ 800 nm dva, which greatly improved signal to noise when performing 2D-BWP analysis. The peak diameter from the TSI nebulizer was ∼ 220 nm dva for the NH4NO3 solution concentrations used here (∼ 0.05 M, Fig. S7.1c). Nebulized aerosols were dried by mixing with a flow of dry zero air (dry ZA and nebulizer flows were 12.5 and 3.5 vlpm, respectively).
2.2 Aerodyne aerosol mass spectrometer (AMS)
An AMS measures the chemical composition of non-refractory aerosols. The particles are collimated by the ADL into a narrow beam, followed by flash vaporization on a 600 °C porous tungsten vaporizer. Vaporized gases are subject to electron ionization, and the mass-to-charge ratio of the ions produced is measured by high-resolution time-of-flight mass spectrometry (DeCarlo et al., 2006; Canagaratna et al., 2007). AMS sensitivity to nitrate was calibrated with monodisperse NH4NO3 single particles in event trigger (ET) mode (DeCarlo, 2009; Kimmel, 2016). Compared to mass-based calibration, ET calibrations are independent of any inlet losses (plumbing or otherwise). Note that mass-based IE calibration is more straightforward to carry out and generally recommended. The fact that ∼ 100 % of transmission efficiency is measured with NH4NO3 particles (Table S9.4) indicates that IE from ET calibration is consistent with that from mass-based calibration. Sensitivity to other species was quantified by the relative ionization efficiency (RIE) to nitrate as measured in regular MS mode (Canagaratna et al., 2007):
where Cs is the mass concentration of species s (µg m−3), and MWs are the molecular weights of nitrate and species s (g mol−1), CE is the particle collection efficiency, RIEs is the relative (to nitrate) ionization efficiency of species s, is the ionization efficiency of nitrate-based on NO+ and NO only, is the relative ionization efficiency of nitrate-based on all fragmentation ions, Q is the volume flow rate into the AMS (cm3 s−1), NA is Avogadro's number, Is,i is the ion signal from ion i produced from species s (Hz), and the 1012 factor accounts for unit conversions.
The particle collection efficiency (CE) is defined as
where ES is the shape transmission factor, which accounts for the particle loss caused by additional beam width broadening due to non-spherical particle shapes (Huffman et al., 2005). In this study, we assume ES = 1 following Huffman et al. (2005) and Salcedo et al. (2007), who showed that ES ∼ 1 for ambient and typical laboratory particles. EL is the lens transmission efficiency for spherical particles, which depends on the ADL design. The EL term includes particle losses inside the ADL and losses due to the particles that exit the ADL but fail to hit the vaporizer. Eb is the composition and phase-dependent particle bounce loss correction factor, due to particle bounce at the surface of the standard AMS vaporizer (Middlebrook et al., 2012).
An AMS can measure mass size distributions using the particle time-of-flight (PToF) mode (Jayne et al., 2000; Jimenez et al., 2003; Drewnick et al., 2005). The particle dva is quantified by measuring the particle time-of-flight (tp) between the opening of a chopper slit and the chemical detection. PToF parameters depend on the ADL operating pressure (PLens). Particle speed (vp) vs. dva should be calibrated for each lens and operating lens pressure. The particle velocity calibration equation (Allan et al., 2003a; Bahreini et al., 2003) is
where Lc (m) is the particle flight length between the chopper and the vaporizer (0.293 m in this study), tp (s) is the measured particle time-of-flight, vg (m s−1) is a fitting parameter typically interpreted as the gas velocity at the exit the nozzle at the end of the lens, and vl (m s−1) is the gas velocity within the aerodynamic lens. D∗ (nm) and b (unitless) are additional fitting parameters. vp as a function of dva is obtained by fitting the measured vp vs. dva points using the latter part of Eq. (4). We constrain vl (to values from the literature, Table S9.3) and vg (by measuring the time of flight of the air signal at 28), then D∗ and b are fitted. dva of the calibration particles is calculated from the particle-volume-equivalent and mobility diameters as (DeCarlo et al., 2004)
where ρp is the particle density (g cm−3), ρ0 is the density of water (1 g cm−3), dve is the volume-equivalent diameter (nm), χv is the vacuum (i.e., free-molecular regime) dynamic shape factor (= 1 for spheres and > 1 for non-spherical particles), ρm is the material density (g cm−3), S is the Jayne shape factor, and dm is the DMA mobility diameter (nm) (Jayne et al., 2000; DeCarlo et al., 2004). S can be estimated by comparing dva measured by AMS in PToF mode and dva estimated by the latter part of Eq. (5) if the bulk density of the material is known. In this work, both regular mode (single-slit) and efficient PToF mode (ePToF), which uses a multiple-slit configuration with a much higher duty cycle than the standard chopper (50 % vs. 2 %), were used. The parameters in Eq. (4) were calibrated for both PToF and ePToF.
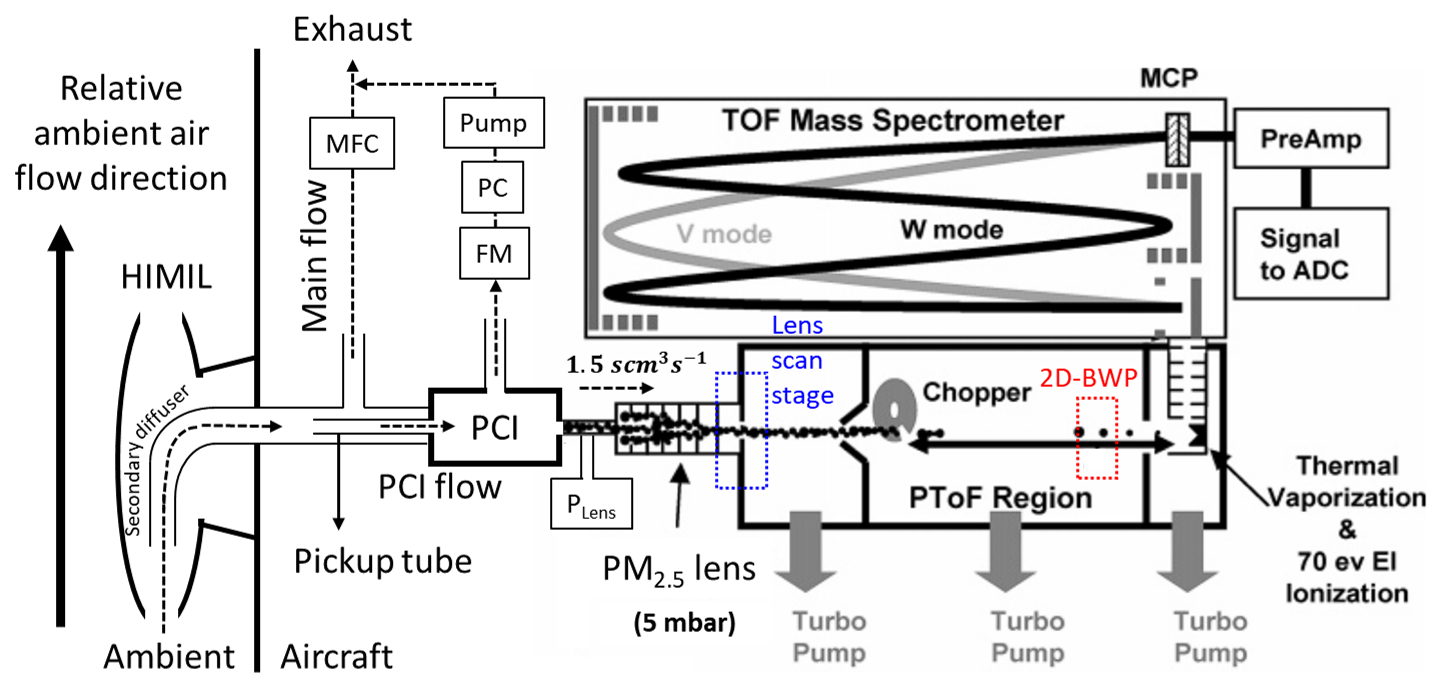
Figure 2Simplified schematic diagram of the CU-HR-AMS setup for aircraft sampling. The AMS schematic is from DeCarlo et al. (2006). Ambient air is drawn into the aircraft through the HIMIL inlet (Fig. S20.1). Part of the air is drawn into the PCI before the AMS. Additional air is exhausted to reduce inlet residence time. PCI pressure (PPCI) is measured and controlled by a pressure controller (PC), and the flow through PC is monitored by a flow meter (FM). In the AMS, aerosols are collimated into a narrow beam followed by vaporization and ionization for mass spectrometry. More detailed schematic diagrams for the lens scan stage and 2D-BWP unit can be found in Fig. 3.
In this study, the highly customized University of Colorado high-resolution time-of-flight aerosol mass spectrometer (CU HR-AMS; hereinafter AMS for short) (Nault et al., 2018; Schroder et al., 2018; Guo et al., 2021) was used both in the laboratory (without HIMIL, Fig. 2) and for field measurements during the TI3GER campaign (Sect. 2.6). For ambient aerosol measurements, the composition-dependent collection efficiency (Matthew et al., 2008; Middlebrook et al., 2012) was applied to account for the particle bouncing efficiency (Eb), assuming that aerosols were internally mixed, which is typical of accumulation-mode aerosol in remote locations (Murphy et al., 2006). If aerosols are externally mixed (e.g., sea salt mode in the marine boundary layer), this can cause higher uncertainty.
Ambient aerosol volume concentration (µm3 sm−3) was estimated from the AMS chemical composition (Vchem, Eq. 6) and compared with the physical aerosol volume (Vphys) measured from the UHSAS (Sect. 2.6.2) measurements, assuming an internally mixed aerosol distribution.
Aerosol chemical components (µg sm−3) were measured by the AMS. Sea salt density (1.45 g cm−3) was taken from Guo et al. (2021), assuming partially deliquesced particles (Brock et al., 2019). Sea salt mass concentration was quantified following Ovadnevaite et al. (2012) using a custom calibration factor ( vs. in Ovadnevaite et al. (2012)). However, the uncertainty in the fractional volume of sea salt due to mixing state (external vs. internal) and the strong sensitivity to the shape of the transmission curve are significant. For that reason, when comparing Vchem vs. Vphys, we focus on the altitude above 3 km where the sea salt influence is minimal. Density of non-refractory chloride was adopted from Salcedo et al. (2006), based on NH4Cl literature values. Organic aerosol (OA) density (ρOA, g cm−3) was estimated from O C and H C ratios (Kuwata et al., 2012). O C and H C ratios were calculated using improved ambient elemental analysis (Canagaratna et al., 2015). 10−6 is the unit conversion factor. During TI3GER, Vchem was estimated without rBC (refractory black carbon) since that measurement was not available. The contribution of rBC to PM1 particle mass is low, typically below ∼ 2 % in the Northern Hemisphere during ATom campaigns (Hodzic et al., 2020; Brock et al., 2021).
2.3 New tools for lens alignment and aerosol beam diagnostics
2.3.1 2D lens scan imaging stage
We have developed a new, fully automated ADL alignment stage that provides fast, accurate, and reproducible lens alignment. The original alignment stage (that is installed on standard commercial AMSs) was replaced with a custom-built 2D lens scan stage that consists of a linear xy stage (Thorlabs Mod XYT1) with stronger, custom springs and a new vacuum interface (Fig. 3 and Sect. S5). The manual actuators were replaced with electronic stepper motor linear actuators (Thorlabs Inc., model ZFS13B) in the two orthogonal directions to the particle beam (x and y axes). Note that the x–y axes of the lens scanning stage are offset 15° from the x–y axes of the BWP due to mechanical limitations. For the vacuum interface, a custom tube of edge-welded bellows provides both secure vacuum sealing and a sufficient range of motion for the ADL (about 5 mm). The electronic actuators are computer-controlled and can do a full 2-dimensional scan of the vaporizer in ∼ 25 min. The precision/reproducibility of the electronic actuators is < 50 µm, which translates to a positional reproducibility of better than 125 µm when projected on the AMS vaporizer.
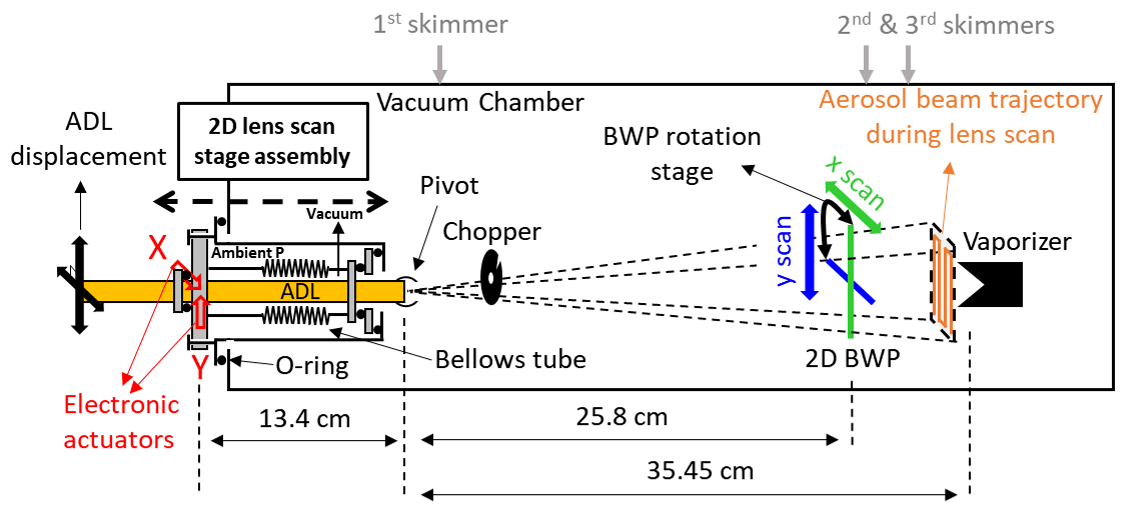
Figure 3Schematic of lens scan stage and its scanning area. This diagram is not to scale, and the range of lens scanning angles is exaggerated here for clarity. During the lens scanning process, the chopper is in the continuously open position, and the BWP is positioned outside the lens scanning range. Details of the 2D BWP system are described in Sect. 2.3.2. The lens scan x–y coordinate is offset 15° from the BWP x–y coordinate (Fig. S6.1–S6.2).
2.3.2 Size-resolved beam width probe in two dimensions (2D-SR-BWP)
The BWP provides information on the particle beam position and width (Jayne et al., 2000; Huffman et al., 2005). Previously reported BWP analyses derived the particle beam width and beam center positions of monodisperse particles along one axis (hereafter 1D-BWP). 1D-BWP has been used to diagnose beam broadening due to particle morphology (ES) (Jayne et al., 2000; Huffman et al., 2005; Salcedo et al., 2007; Docherty et al., 2013; Willis et al., 2014). The 1D-BWP was also used to monitor the pointing and focusing stability of an ADL inlet on aircraft campaigns (Guo et al., 2021). Hence, previous efforts made to model the aerosol beam (beam position and width as a function of particle sizes) using 1D BWP assumed a symmetric Gaussian beam model since the beam profile (BP) measurements were available along only one axis (Huffman et al., 2005).
A rotational stage was built (Fig. 3, Sect. S6) for the Aerodyne BWP assembly so that BWP scans can be performed along two perpendicular directions (2D-BWP). 2D-BWP measurement of monodisperse aerosols provides both beam position and width in a 2-dimensional plane. The rotation stage consists of a high torque servo (Bilda Mod 2000) controlled by a USB servo controller (Polulu Micro-Maestro 6-ch USB controller) and a custom-built gear drive that allows up to a 135° turn of the BWP unit.
Additionally, instead of recording total mass signals during 2D-BWP operation, particle size distributions can be recorded continuously in AMS PToF mode. This way, one can obtain size-resolved (SR) particle beam information along the two orthogonal axes (2D-SR-BWP) with one set of measurements. PToF measurements were carried out for 9 s at each BWP position. For aerosol input, stable polydisperse NH4NO3 particle distributions were generated (see Sect. 2.1) with a typical modal diameter of dva ∼ 800 nm.
Typically, the BWP is scanned in 0.1 (or 0.05) mm intervals with a total of 27 (or 54) steps on each axis. Systematic scan-to-scan offsets on BWP position (due to hysteresis in the stepper motor and normally within ±0.2 mm) can be identified using the BWP air beam position and corrected post-acquisition (Fig. S16.2). The BWP positions that correspond to the vaporizer center were measured for both axes and the offsets were applied to our data (Sect. S6) to put both the lens and BWP scan on a consistent coordinate system. For visualization, aerosol attenuation factors (Eq. 7) are constructed as a function of BWP position and dva. Then the attenuation factors vs. BWP position at a given particle size are fitted with Gaussian curves and normalized, giving the normalized attenuation factor (A).
where Sref is the aerosol signal when BWP is not blocking the beam, and Sblock is the aerosol signal when BWP is blocking the aerosol beam partially (or completely) at a certain BWP position.
2.3.3 Particle beam profile model
A model was developed to estimate the fraction of particles existing from the ADL that impact the vaporizer. Following the methods of Huffman et al. (2005), the model simulates the particle beam, assuming a 2D Gaussian distribution, and is fitted to the results of 2D-SR-BWP measurements. The measured beam width (σ1DG, following the convention from Huffman et al., 2005) of the particle beam is defined as 1 standard deviation from the Gaussian fitting of signal attenuation along the BWP wire positions. When the Gaussian fitting fails due to high noise for a given dva size bin, the raw data are median-smoothed by two steps to up to a quarter of the original BWP positional resolution, and then the Gaussian fit is performed.
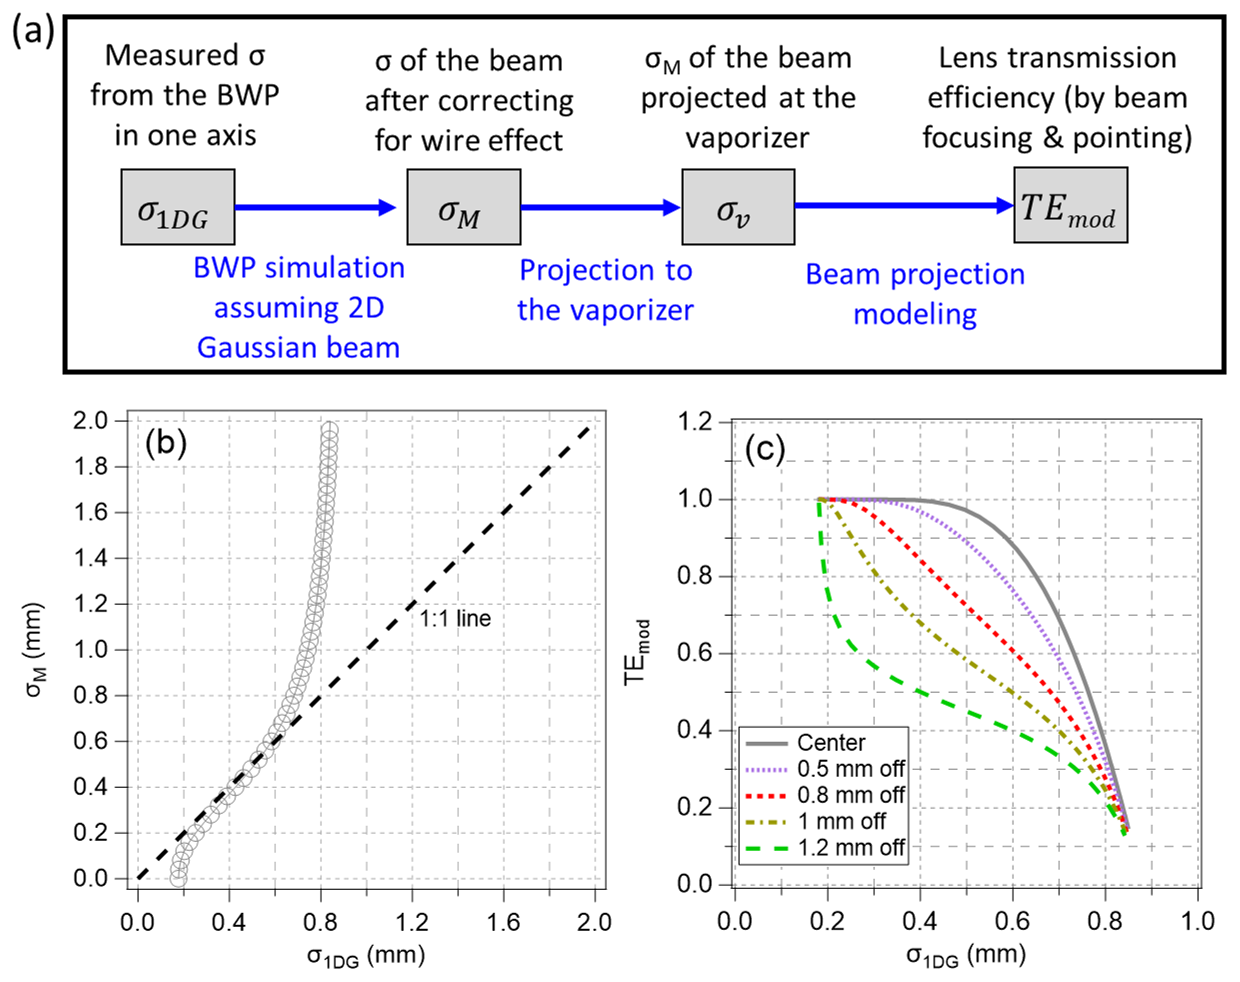
Figure 4Particle transmission modeling procedure with input from 2D-SR-BWP measurements. (a) Beam width conversion flow chart for TE estimation as a function of σ1DG. (b) Modeled Gaussian beam width after correcting for the beam broadening due to BWP wire thickness (σG) vs. measured width by BWP (σ1DG) (c) Modeled TE vs. σ1DG at different beam center positions relative to the center of the vaporizer. In these examples, a perfectly symmetric circular Gaussian beam is assumed.
σ1DG differs from the actual particle beam width due to the convolution effect with the BWP wire width (0.5 mm). In the model, the relationship between Gaussian beam width without the wire effect (σM) and the width reported by BWP measurement (σ1DG) is found by simulating the same wire movement as in the measurements (Fig. 4). When the beam width is narrow (< 0.2 mm σM), BWP measurement reports ∼ 0.2 mm σ1DG due to the wire effect. Over the 0.2–0.6 mm σM range, σ1DG does not exhibit significant bias. For σM larger than 0.6 mm, σ1DG is biased low since a fraction of particles is not captured by the vaporizer.
Since the beam width measurements by BWP are done upstream of the vaporizer, an additional linear correction is necessary to account for particle beam width broadening between the BWP plane and the vaporizer surface. Given the constant radial speed of aerosol particles in the vacuum chamber,
where σv is the particle beam width at the vaporizer plane, and LNV (length from lens exit nozzle to the vaporizer) and LNB (length from lens exit nozzle to BWP) were 35.45 and 25.8 cm, respectively (Fig. 3). The apertures of the three skimmers (, 1.39 × 10⁻⁴, and 1.17 × 10⁻⁴ sr for the first, second, and third skimmers) between ADL and vaporizer have a larger beam angle than that of the vaporizer ( sr); thus those skimmers should not affect BWP measurements, as long as they are properly aligned. In this study, the vaporizer appears to be misaligned that the vaporizer was partially blocked by the third skimmer (Fig. S5.8), which should not significantly affect the beam width measurements and modeling.
After obtaining the particle beam width (σv) along both perpendicular axes as a function of dva, we used a general 2D Gaussian probability density function to simulate the beam profile. This allows the modeling of beams with elliptical cross-sections:
where σx and σy are σv in the x and y directions, x0 and y0 are the beam center positions in the x and y axes relative to the center of the vaporizer, and dv is the diameter of the vaporizer. In the model, transmission efficiency (TEmod accounting for transmission between ADL and vaporizer) is calculated as the fraction of the integrated 2D Gaussian function inside the vaporizer perimeter. Note that the modeled transmission efficiency does not account for particle losses inside and upstream of ADL. The main difference from Huffman et al. (2005) is that the BWP measurements are available for two perpendicular axes in this work. Thus, the assumption used by Huffman et al. (2005) that the beam cross-section is circular is not needed here. Also, unlike Huffman et al. (2005), where x0 and y0 are assumed to be zero, we measured these parameters as a function of dva. The model is used to diagnose the beam pointing/focusing characteristics of a given lens as a function of dva(Sect. 3.2.3) and to optimize the alignment of the lens so that EL is maximized across the widest possible range of particle sizes. See Sect. S8 for the experimental validations of the particle beam model.
2.4 Measurement of particle transmission efficiency (TE)
For laboratory measurements, overall particle TE of a given inlet system using monodisperse particles was calculated by comparing AMS-based mass (AMSmass) to CPC-based mass (CPCmass) following Eqs. (10)–(11):
where NCPC is the particle number concentration measured by CPC, and the term ρm×S in Eq. (10) stands for the effective particle density (g cm−3) (DeCarlo et al., 2004). The S for laboratory-generated dry NH4NO3 is 0.8 (Jayne et al., 2000), and the S for dried NH4I was 0.83 ± 0.07 (Table S4.1). As noted in Sect. 2.1, oleic acid was used for TE measurements below 300 nm dva, and inorganic compounds (NH4NO3, (NH4)2SO4, NH4I) were used for larger diameters. Data were typically averaged for 5 min per TE point. The 1 min acquisition sequence used in this work for the AMS consists of 6 s chopper closed, 46 s chopper open, and 8 s ePToF cycles, as typically used in aircraft campaigns (Nault et al., 2018).
On aircraft platforms, CE from Eq. (3) can be expanded, accounting for the particle transmission of the aircraft inlet (EI), of the tubing between the aircraft inlet and the PCI (ET), and of the PCI (EPCI), as
ET for our aircraft plumbing configuration was estimated from sample flows and tubing dimensions and shapes (Guo et al., 2021; Bourgeois et al., 2022) (Sect. S18). EI is the transmission efficiency as particles enter the HIMIL which is close to unity (Stith et al., 2009). The measured TE of the inlet system in the laboratory after correcting for Eb is hence the product of the TEs of the inlet components that particles travel through during the measurement:
ET in the laboratory plumbing configuration was estimated to be close to 1 by comparing two particle counters upstream and downstream of the plumbing line between AMS and CPC (see Sect. S3). When measuring TE without PCI installed, EPCI = 1. By comparing dva calculated from Eq. (5) vs. the AMS measurements, potential evaporation and the presence of doubly charged particles were routinely monitored.
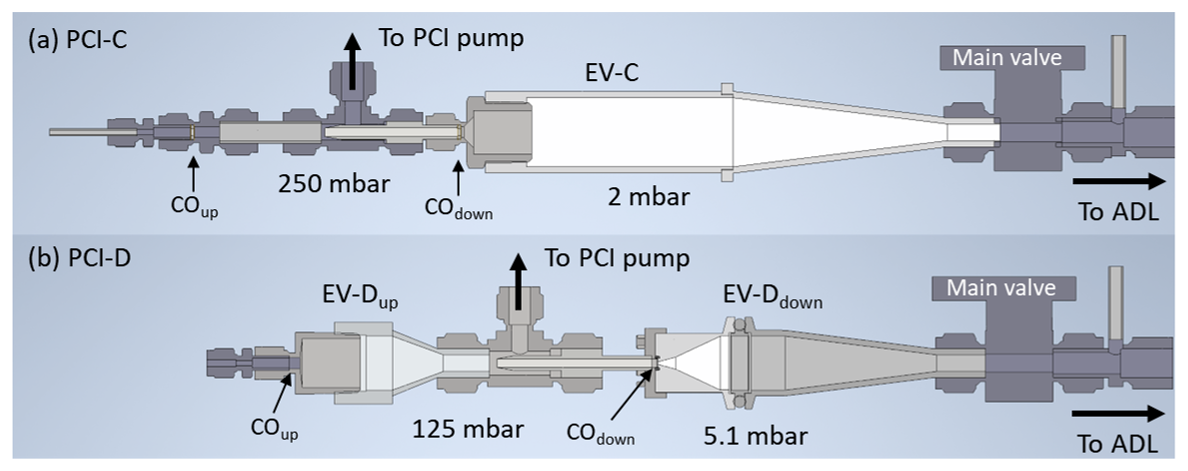
Figure 53D model cross-sections of the PCI designs tested in this work. (a) CU PCI-C (Guo et al., 2021) and (b) CU PCI-D (this work). The pressure in the IPV (between COup and COdown) is actively controlled to be constant during flights. CO diameters are shown in Table 1. The PPCI for CU PCI-D shown in the figure is when dCO,down = 300 µm. The inner diameter of EV-Dup and EV-Ddown is 16 mm.
When measuring the TE of standalone ADLs, PM1 lens, PM2.5 lens ( = 66), and HPL ( = 12) (Sect. 3.3.1), TE is equivalent to EL. A critical orifice (CO) with a 120 µm diameter was installed upstream of the system as it resulted in the optimal lens entry pressure at Boulder, Colorado altitude (∼ 800 hPa), where all the laboratory experiments were conducted. Hereafter, a critical orifice in a standard AMS configuration (e.g., without PCI) will be referred to as COstd. Orifices used in this study are made of platinum, 6.35 × 0.125 mm dimension (diameter × thickness), and the aperture is conically drilled (PerkinElmer Inc.). An expansion volume (EV) version C (EV-C, Fig. 5a) was used as a relaxation chamber (Wang and McMurry, 2007) between the COstd and ADL to minimize potential particle losses after the supersonic expansion at the COstd. An expansion volume is not part of the standard AMS configuration.
2.5 Pressure-controlled inlet (PCI) designs tested
A constant pressure in the ADL ensures consistent aerodynamic focusing of the aerosol onto the AMS vaporizer (Zhang et al., 2004b). Without active pressure control, variable ambient pressure as altitude changes leads to changes in lens pressure during aircraft deployments. This results in a change in size calibration parameters, lens transmission efficiency vs. size, and air flow rate into the AMS (Bahreini et al., 2003). A PCI is a device to maintain constant pressure upstream of the aerodynamic lens during flights. Two critical orifices are used, the first critical orifice at the inlet of the PCI (COup) operating between ambient pressure and the intermediate-pressure volume (IPV) and the second critical orifice (COdown) at the IPV exit. Note that COdown replaces COstd in the standard AMS configuration. The IPV is pumped by a vacuum pump (Vacuubrand MD1 in this work). The pressure at the IPV is referred to as PPCI. The pump flow is controlled by a pressure controller (Mod PC3P Alicat Scientific Inc.), which keeps PPCI constant. COup must be large enough to ensure enough excess flow (besides the inlet flow strictly needed by the AMS) at all altitudes; a larger COup will shorten the overall residence time, so ultimately the limitation is the pumping capacity of the pump at PPCI. PPCI needs to be maintained below the lowest inlet line pressure (accounting for effects of ram pressure, inlet line pressure drops, and – for the NASA DC-8 installation – lower over the wing pressure) that will be sampled, in order to always be able to draw air into the PCI system. COdown size is chosen to maintain the required AMS flow and lens pressure, given a constant PPCI. However, lower PPCI is more prone to the loss of large particles during and after expansion (Chen et al., 2007; Guo et al., 2021) due to impaction on either the backside of COdown or the wall downstream of the COdown. Thus, when using the larger COdown needed for lower PPCI, careful design of the downstream EV is key to minimizing particle losses.
Table 1Nominal components and operating conditions of the CU PCI-C and CU PCI-D during field deployments. refers to the diameter of the critical orifice up/downstream of the IPV.
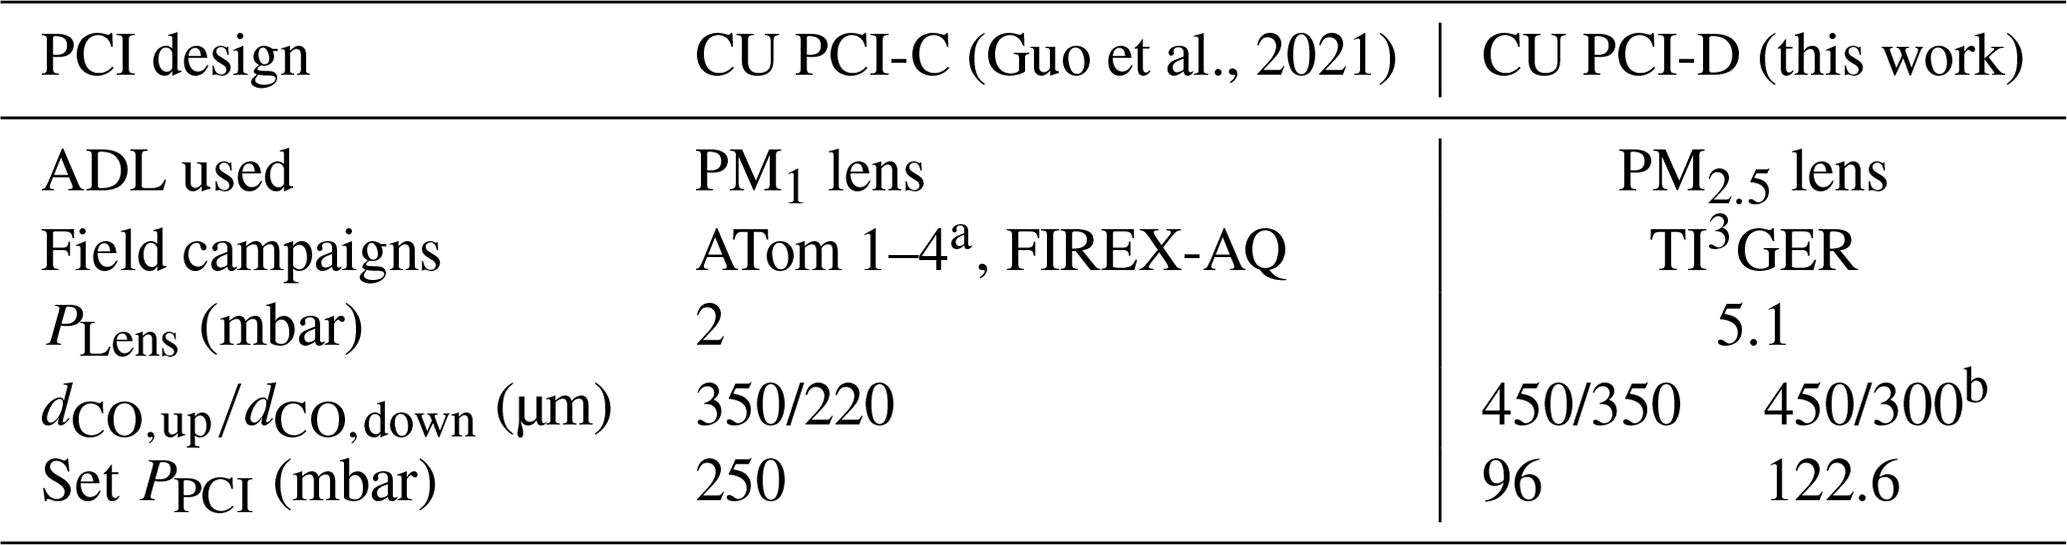
a CU PCI-C was used for the later part of the ATom-1 campaign. For the earlier part, the PCI design was the same as the KORUS-AQ campaign (CU PCI-B). More detailed comparisons of previous CU PCIs can be found in Sect. S11. b During the NASA ASIA-AQ 2024 campaign, CU PCI-D with 400/300 µm (, PPCI = 122.6 mbar) was used, and a PM2.5 lens with improved nozzle design (Nault et al., 2025) was deployed (PLens = 5.6 mbar).
The performance of the previous PCI designs (CU PCI-A, B, C) used as part of the CU-HR-AMS during NASA airborne missions is further described in Sect. S11. In this section, we compare the two most recent University of Colorado PCI designs used for the ATom and FIREX-AQ campaigns (Fig. 5a, CU PCI-C) with the newly designed PCI in this work (Fig. 5b, CU PCI-D). Hereafter, all PCIs are referred to without CU for brevity. PCI-C has a single EV (EV-C) downstream of COdown. When operated at lower PPCI, TE of the PCI-C was significantly reduced (Sect. 3.3.2). To minimize particle losses at lower PPCI, PCI-D was designed with two EVs downstream of COup and COdown (EV-Dup and EV-Ddown). The EV-Ddown was newly designed with a conical shape motivated by Hwang et al. (2015) to minimize air recirculation and thus minimize particle loss after the supersonic expansion at COdown. The chosen cone angle and dimensions of EVdown were informed by computational fluid dynamic (CFD) modeling. The particle transmission of the PCI was then found to be limited by the particle losses at the COup. The EV-Dup was empirically designed to provide a particle relaxation volume after COup and reduce particle losses. In the laboratory, PCI-C and PCI-D were further tested with several orifice sizes (besides the nominal COs in Table 1) and PPCI (Sect. 3.3.2).
2.6 Airborne aerosol measurement during the TI3GER field study
The Technological Innovation Into Iodine for Gulfstream V (GV) Environmental Research (TI3GER) field campaign focused on technical advancements for airborne in situ measurements up to the lower stratosphere (Yang et al., 2024a, b). The TI3GER campaign was conducted over Colorado (two flights) and the Northern Pacific Ocean (six flights) on board the NSF/NCAR GV aircraft, on 2–29 April 2022 (https://www.eol.ucar.edu/field_projects/ti3ger, last access: 6 December 2022). Flight altitude ranged from sea level to 14 km, and latitude ranged 3–60° N. Aerosol measurements relevant to this study are the CU aircraft AMS for accumulation-mode aerosol chemical composition, the NCAR ultra-high sensitivity aerosol spectrometer (UHSAS) for submicron particle size distribution (in-cabin), and the NCAR Cloud Droplet Probe (CDP) for supermicron aerosol/cloud droplet measurement (under the wing). Ancillary data including temperature, pressure, and wind speed were provided by NCAR using standard sensors on the GV aircraft.
2.6.1 CU Aircraft HR-ToF-AMS
A general description of AMS can be found in Sect. 2.2. During the TI3GER campaign, absolute sensitivity calibrations (Sect. S15) and inlet diagnostics for the AMS were performed after each flight as well as between flights when possible (Sect. S16). For AMS particle sampling, as shown in Fig. 2, ambient air was drawn into the airplane (3–14 slpm, actively controlled, depending on aircraft altitude) through a HIMIL. The HIMIL inlet used during the TI3GER campaign is the “tall version” (12 in./30.48 cm tall). HIMIL was located at the left side ceiling of the GV, ∼ 10 m behind the nose of GV (Fig. S20.1). See Sect. S20 for more details on HIMIL. The main flow into the inlet was controlled by the main mass flow controller (MFC), the flow rate of which was adjusted to maintain near-isokinetic sampling at the secondary diffuser (Sect. S20). The flow toward the PCI goes through the pickup tube (Fig. 2). PCI-D was used to maintain a constant pressure upstream of the PM2.5 lens (Plens = 5.1 mbar) allowing for a constant flow (1.5 scm3 s−1) into the lens. The extra PCI flow is dumped into the exhaust by the GV venturi system. More details on PCI operation can be found in Sect. 2.5. The plumbing line from HIMIL to the pickup tube is 6.35 mm o.d. (4.57 mm i.d.) stainless steel tubing, with a total length of 142 cm and a cumulative bending angle of 335°. The tubing from the pickup tube to the PCI is in. stainless steel (2.13 mm i.d.) with a total of 34 cm and 270° cumulative turn.
2.6.2 NCAR UHSAS
The Ultra-High Sensitivity Aerosol Spectrometer (UHSAS; Droplet Measurement Technologies, Longmont, CO) illuminates particles with an intracavity laser (1054 nm) and relates the single-particle light scattering intensity and count rate measured over a wide solid angle (33–147°) to the size-dependent particle concentration (Kupc et al., 2018; Moore et al., 2021). During TI3GER, an in-cabin UHSAS was operated by the National Center for Atmospheric Research (NCAR). The UHSAS pulled 10 vlpm flow through a HIMIL (located on the plane belly side of GV) inlet outfitted with a stainless steel tubing line with a 90° turn inside the HIMIL followed by 0.48 cm i.d. conductive flexible silicone tubing (TSI) having a total of 697° of cumulative turns. Particle number concentrations between ∼ 55 and ∼ 1000 nm optical diameters (dopt) are reported in this work.
Each UHSAS bin of scattered light intensity can be converted to particle size, based on the real part of the refractive index (RI) of the dry polystyrene latex spheres (PSLs) used for its calibration (nD = 1.595). Ambient particles have a different RI than PSLs causing either an over- or underestimation in particle sizes. The largest uncertainty arises in the estimation of the actual refractive index of ambient particles, discussed below (Brock et al., 2011). Then the optical diameter is calculated from the measured light scattering following the Mie theory. Total volume can be estimated from the size and particle number concentration assuming spherical particles.
We have corrected the dopt from UHSAS using ambient RI estimated from aerosol chemical composition measured by the AMS. RI values of 1.527, 1.554, and 1.64 were used for dry (NH4)2SO4, NH4NO3, and NH4Cl components, respectively (Brock et al., 2021). We used 1.52 for the organic component RI following Aldhaif et al. (2018).
The effective real part RI () of ambient aerosols was calculated as the volume-weighted mean real part RI of each component (n) (Sokolik and Toon, 1999; Aldhaif et al., 2018).
where ø, c, and ρ refer to the volume fraction, mass concentration, and bulk density of the chemical component. Chemical components were excluded from Eqs. (14) and (15) when the concentrations were below their detection limits. Then each UHSAS dopt bin is updated with the estimated based on Mie scattering code (Jimenez Group GitLab, 2024) which originates from Bohren and Huffman (1998). When applying the estimated to UHSAS dopt size bins, it is assumed that the measured ambient particles were internally mixed, and the contribution of BC is negligible. This assumption can cause additional uncertainty in the marine boundary layer (MBL), where sea spray aerosols are typically externally mixed with accumulation-mode aerosols.
3.1 Lens scan imaging of the AMS vaporizer
3.1.1 Lens scanning procedure and particle beam width measurement
A typical lens scan and its processed outputs are shown in Fig. 6. The details of the lens scan stage system are described in Sect. 2.3.1. A typical lens scan takes ∼ 25 min, allowing for faster, more accurate, and reproducible lens alignment compared to the traditional manual alignment process. In this example, 350 nm dm monodisperse NH4NO3 particles were used to locate the perimeter and the center position of the vaporizer with a PM1 lens. To correct for the potential variations in aerosol source during lens scans, signals were normalized to CPC particle counts (Fig. 6a). In Fig. 6c, aerosol signals were mapped inside the vaporizer perimeter. The diameter of the perimeter has an effective diameter of 3.6 mm, as measured from the lens scan. This diameter is smaller than the physical diameter (3.8 mm) likely due to misalignment of vaporizer position and some blockage by the third skimmer (Fig. S5.8). The resolution of the vaporizer imaging is limited by the scanning path setup and the width of the particle beam. The latter is why a lens scan with a PM1 lens is typically sharper than with a PM2.5 lens (see Sect. 3.1.2). In this study, we found that the aerosol beam center position can depend on the particle size (Fig. 16). In such cases, we used this method to align the lens to the position where the overall lens transmission efficiency is maximized. Alignment was refined subsequently using information from the 2D-BWP (Sect. 3.2.1).
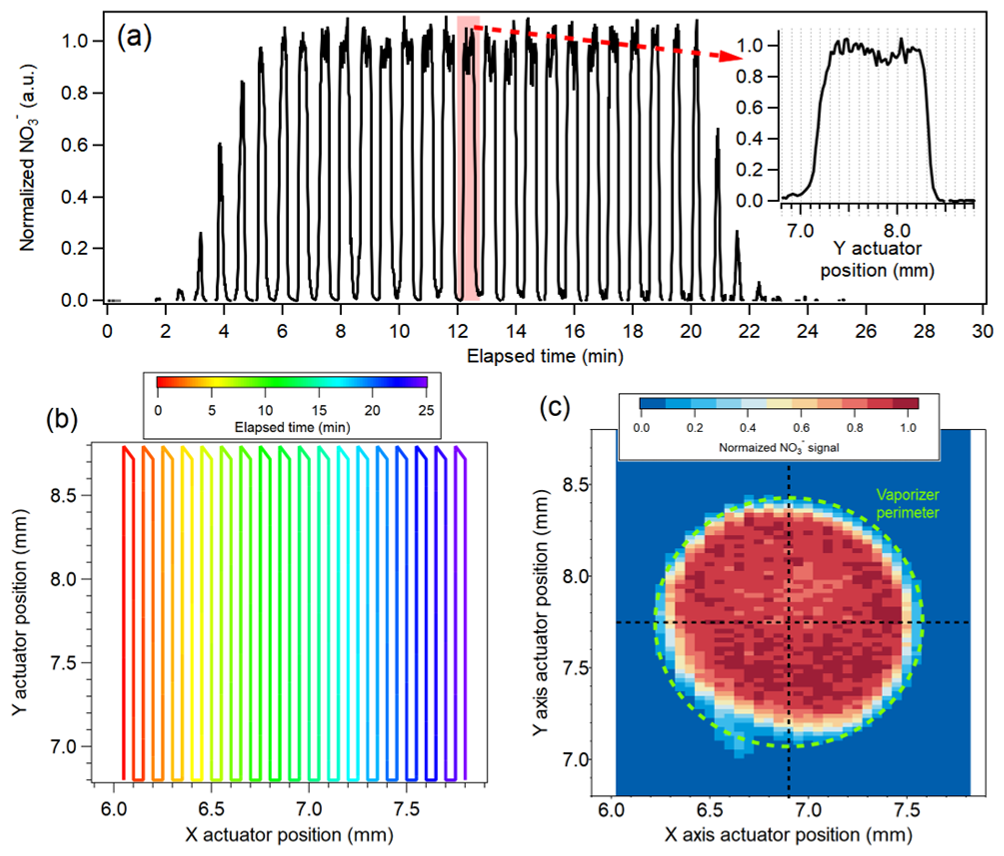
Figure 6(a) Time series of the AMS nitrate signal for a lens scan with 350 nm dm NH4NO3 particles with a PM1 lens. The particle signal was normalized by CPC counts to correct for any variations of particle number during the scan. (b) The trajectory of X and Y actuator sweeps is colored by time. The top inset magnifies the data in panel (a) for a short period, and the time axis was converted to the Y actuator position during one sweep where the x axis actuator was fixed, pointing to the center of the vaporizer. (c) 2D lens scan image of the vaporizer colored by normalized particle signal. The dotted green line represents the perimeter of the vaporizer projected to the actuator plane. For this scan, 1 pixel is 126 × 63 µm (x×y axes) resolution on the vaporizer plane.
Besides the accurate location of the center and perimeter of the vaporizer, lens scanning provides information on beam width. As the particle beam is pointed towards the vaporizer edge, the aerosol signal is attenuated due to partial impaction outside the vaporizer. The narrower the beam width, the sharper the signal attenuation on the edge of the vaporizer. In this case, an even sharper edge is provided by the third skimmer (Fig. S5.8). As an alternative to the thin wire type BWP, Huffman et al. (2005) evaluated a “knife-edge”-type BWP, i.e., a flat plate moved sequentially through the beam to block an aerosol beam which was demonstrated previously in Liu et al. (1995a). In this case, the aerosol beam pointing outside of the vaporizer is the same process as being blocked by the knife-edge-type BWP as long as the beam width is significantly narrower than the vaporizer diameter. Assuming the knife-edge model, σ1DG can be obtained by fitting the attenuation curve with a sigmoidal function, assuming a Gaussian beam (Fig. S5.7). Similarly, Clemen et al. (2020) measured particle beam width by two vertical aligned detection lasers in the ALABAMA instrument. They moved the particle beam outside of the detection region by tilting the ADL and calculated the beam width based on the signal attenuation and the laser beam width.
The inset in Fig. 6a illustrates an example of signal attenuation as a function of Y actuator position. In this example, applying the knife-edge method, the σ1DG in the BWP plane is 0.035 mm (Figs. 6a and S5.7a–b). The advantage of this technique compared to using the BWP is that the measurable beam width is not limited by the width of the wire itself (Fig. 4), allowing finer beam width measurement, mostly limited by the resolution of the lens scan (about 0.13 mm in the vaporizer plane). However, when the beam width is too broad (> ∼ 0.25 mm in BWP plane), the outer side of the vaporizer edge (or third skimmer perimeter) does not provide an ideal flat plate underestimating the beam width (Fig. S5.7c–d). In combination with the BWP measurements which cannot quantify widths below ∼ 0.2 mm (in the BWP plane), lens scans can provide supplemental measurements of the beam width for smaller beam sizes (below ∼ 0.25 mm; Fig. 11).
3.1.2 Position-dependent decomposition on a standard vaporizer
On the surface of the vaporizer, the thermal decomposition of NH4NO3 particles produces a mixture of gases including NH3(g), HNO3(g), NO2(g), NO(g), and H2O(g) (Drewnick et al., 2015). Electron ionization of HNO3(g) and NO2(g) results (after some additional fragmentation) in NO and NO+, which are the main ions detected by the AMS from aerosol nitrate (Canagaratna et al., 2007; Hu et al., 2017b). NO(g) produces only NO+ ions. Thus, for higher vaporizer temperatures leading to higher thermal decomposition of NH4NO3, the NO ratio (NO to NO+ signal ratio) measured by the AMS decreases. In this section, we used the lens scan technique to investigate the position-dependent decomposition patterns on the standard vaporizer for NH4NO3 and oleic acid. Figure 7 shows lens scan images of standard vaporizers using monodisperse NH4NO3 particles with PM1 and PM2.5 lenses as well as the HPL colored by NO ratio.
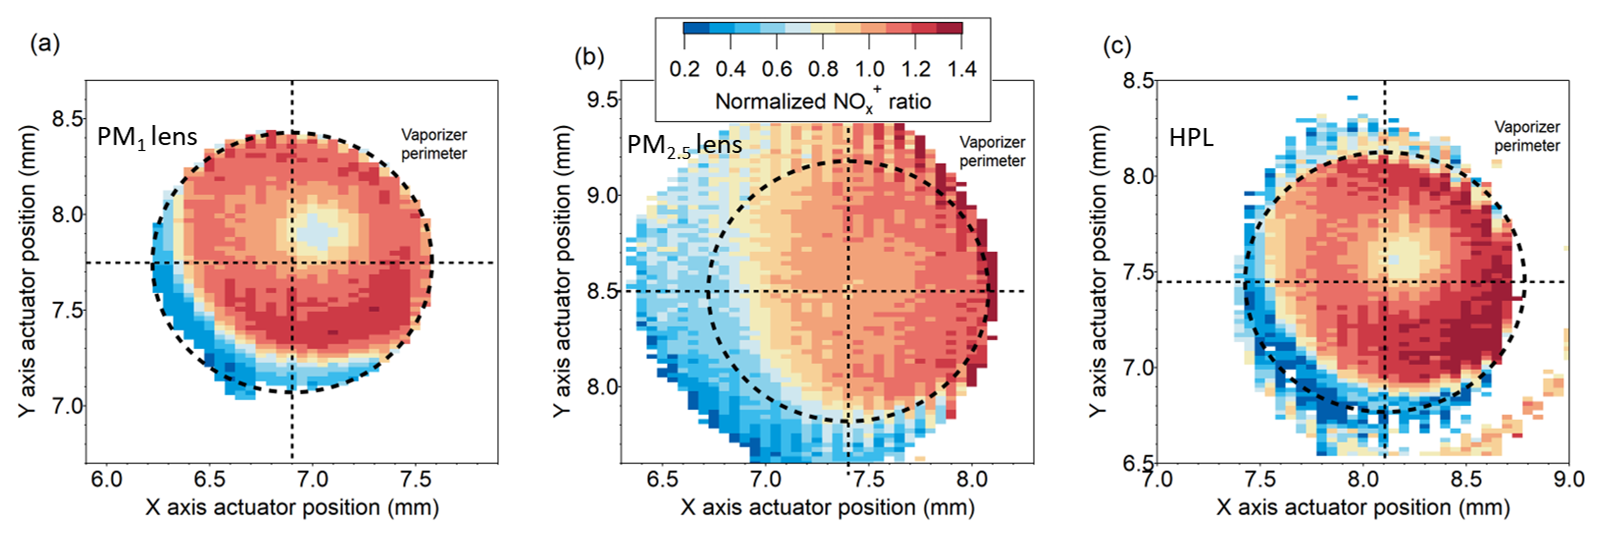
Figure 7Lens scan images of NO NO+ ratio (NO ratio) normalized by the NO ratio at the center of the vaporizer perimeter, as a proxy for surface temperature obtained with monodisperse NH4NO3 particles from a (a) PM1 lens (350 nm dm), (b) PM2.5 lens (350 nm dm), and (c) HPL (800 nm dm). The length scale is the same for all the plots. Only the data with nitrate concentration above 10 µg sm−3 are displayed. For better visualization, the data are normalized by the ratio at the nominal center of the vaporizer.
The results with the PM1 lens and HPL show a spot near the nominal center of the vaporizer where the NO ratio is lower, indicating higher fragmentation of nitrate. There are two explanations for higher degrees of thermal decomposition of NH4NO3 (including also higher H2O+ fraction, discussed below) at the center of the vaporizer. When particles impact the center of the vaporizer, the gas-phase molecules have a higher chance of another collision with the hot vaporizer surface (and thermal decomposition) before ionization (“geometry effect”). Also, potentially, the vaporizer temperature (Tv) on the center of the vaporizer is slightly higher, causing higher thermal decomposition (“temperature effect”). Hu et al. (2017b) showed that the NO ratio decreased (∼ 25 %–30 %) as the Tv setting increased from 200 to 650 °C for a standard AMS vaporizer. However, a qualitative observation of vaporizer surface temperature did not exhibit noticeable temperature gradient. Furthermore, the change in the NO ratio due to temperature effect in Hu et al. (2017b) can not explain the variability observed during lens scan (a factor of 2). Therefore, the position-dependent decomposition on SV in Fig. 7 is likely caused mainly by the geometry effect. Although not investigated as thoroughly, a brand new standard vaporizer installed for the TI3GER campaign exhibited the same feature as the vaporizer shown here (Fig. S5.3), indicating that position-dependent decomposition is likely a general feature of standard vaporizers.
As noted, the vaporizer center also exhibits a higher water signal (Fig. S5.4). The (background-signal-corrected) H2O+ to NO signal (≡ NO+ + NO) ratio was as high as 0.15 at the center, while the ratio ranged 0.05–0.08 on other parts of the vaporizer surface (Fig. S5.4). Note that unlike for typical AMSs, the background water signal in the CU AMS is negligible due to the use of a cryopump, allowing for precise water signal measurements. Drewnick et al. (2015) reported H2O+ NO ∼ 0.23 from NH4NO3. The H2O+ signal is more likely from water formed from the thermal decomposition of HNO3(g) rather than particle water molecules remaining inside the dried calibration particle. If the majority of the water signal were coming from particle water, the H2O+ signal would be homogeneously distributed like the total nitrate signal. In contrast, when measuring nitrate in ET mode (single particle detection), H2O+ NO was ∼ 3 % (∼ 3 times lower than in MS mode; Fig. S5.4). In ET mode, the timescale (210 µs) is not long enough to measure the full decay and enhanced background of the H2O+ signal. Since apparent inhomogeneities of the total nitrate signal were not observed (Fig. S5.2a–c), the effect of position-dependent nitrate decomposition on the calibration of AMS with NH4NO3 particles is limited. However, as discussed in Sect. 3.1.2, the yield of NO signal from NH4NO3 decreases up to 3 %–4 % for a lower NO ratio (higher thermal decomposition) for SV.
In Fig. 7b, the normalized NO ratio is nominally measured outside of the vaporizer perimeter. This is because the particle beam width is wider in the PM2.5 lens, and substantial aerosol signal (> 10 µg sm−3 of nitrate) was detected even when the ADL was pointing outside of the vaporizer. Lens scans with the PM2.5 lens do not show such an apparent center spot of a low NO ratio because the particle beam width is wider than for the PM1 lens and HPL (see Sect. 3.2.3) smoothing the gradient of the NO ratio. The disparity between the locations of the nominal vaporizer center (center position of the projected vaporizer perimeter) and the actual vaporizer center (indicated by NO ratio) asymmetricity of the NO ratio image suggests that the vaporizer was tilted/misaligned (Fig. S5.8) during or after vaporizer installation.
When a CV is used and the particle beam is fully captured by the CV entrance, it is unlikely that the capture vaporizer exhibits position-dependent decomposition since the particles bounce inside the cavity for ∼ 0.5 ms ensuring nearly full thermal equilibrium. However, when the particle beam hits near the edge where the temperature is supposedly colder, particles may bounce back and only partially vaporize with different fragments. At the vaporizer edge, the NO ratio increases to 0.6–0.8 which is ∼ 10 times higher than the center of CV and within the range of nominal NO ratio with SV (Hu et al., 2017b; Xu et al., 2017).
Implications of position-dependent decomposition for AMS organic nitrate quantification
The NO ratio from other forms of nitrates, such as organic nitrates (pRONO2) and NaNO3, is lower than that of NH4NO3 and is often used to identify and quantify organic nitrate (Farmer et al., 2010; Fry et al., 2013; Day et al., 2022). In many previous chamber and field studies using the AMS with a PM1 lens, NO ratios from NH4NO3 ranged from 0.2 to 1 (Day et al., 2022). In this study, the majority of observed NO ratios during the lens scan with PM1 lens ranged from 0.5 to 1 (when excluding vaporizer edge, Figs. S5.2d and S5.5). On the vaporizer edge (or slightly outside of the edge, left bottom side in Fig. 7a), the low NO ratio was lower (< 0.5). Only ∼ 40 % of the vaporizer edge was identified, probably due to the misaligned vaporizer and blockage by the third skimmer (Fig. S5.8). This suggests that the position-dependent AMS response to nitrate fragmentation could partially account for the wide variability of the NO ratio in previous studies. Day et al. (2022) presented the linearity between NO ratios from pRONO2 and NH4NO3 in previous studies with AMS. In that study, the variability of the NO ratio from pRONO2 and NH4NO3 among previous studies was tentatively attributed to vaporizer bias voltage drifts or different MS tuning which can shift the NO ratio of NH4NO3 by a factor of ∼ 2. Day et al. (2022) proposed a ratio of ratio (RoR) method that normalizes the NO ratio from pRONO2 by that of NH4NO3 in order to minimize instrumental variability that led to a more consistent NO ratio among a variety of pRONO2 species and mixtures.
We hypothesize that the literature variability in the NO ratio also had a contribution from position-dependent decomposition. The linearity of NO between pRONO2 and NH4NO3 reported by Day et al. (2022) suggests that when the particle beam impacts on or near the SV center (off-center), both pRONO2 and NH4NO3 would be more (less) thermally decomposed by the SV. This hypothesis can be investigated by future work with lens scans using both monodisperse pRONO2 and NH4NO3 particles and by observing the linearity of the position-dependent NO ratio between the pRONO2 and NH4NO3.
Apportionment of aerosol species based on ion ratios requires that calibrations are done routinely, and the species of interest interact with the vaporizer consistently. Changes in ion fragmentation ratios due to changes in the aerosol beam position and/or width can be a potential source of errors in aerosol apportionment. This could happen if the ADL was moved to a different alignment after calibration or if the calibration and sample particle beam overlaps on the vaporizer changes due to the variability in particle beam width and/or beam position (i.e., due to changes in particle sizes; see Fig. 11a). When using the PM2.5 lens, due to its broader beam width compared to the PM1 lens (Fig. 11), the NO ratio is less sensitive to the position-dependent decomposition effect (Fig. 7b), and the uncertainty of pRONO2 quantification due to this effect would also be less significant. If aerosol apportionment is of interest and lens scanning is not available, our results suggest that it would be useful to periodically calibrate the AMS with multiple monodisperse test particle sizes to confirm a consistent response.
Takeuchi et al. (2024) reported that the nitrogen-containing moiety mass concentrations in pRONO2 from AMS and CPC were best matched when CPC-based mass was calculated based on the –NO2 group, not the –ONO2 group. This observation ultimately translates to ∼ 35 % lower AMS nitrate sensitivity to pRONO2 (i.e., ∼ 35 % lower NO signal per nitrate mass) than for equivalent NH4NO3. They discussed that the thermal decomposition of pRONO2 on the vaporizer yields mostly NO2(g) (hence lower NO ratio, 0.1–0.3 in that study), while NH4NO3 yields more HNO3(g) (higher NO ratio, 0.6 in that study). They attributed the cause of lower nitrate sensitivity to the nitrogen moiety being NO2 (not NO3) after thermal decomposition and suggested that the measured nitrate from pRONO2 needs to be scaled up by ∼ 35 % to properly represent the mass of the –ONO2 group. After the thermal decomposition, NO2 might yield lower NO signal than for HNO3 since ionization efficiency of EI tends to be proportional to molecular weight (Jimenez et al., 2003).
We evaluated the relative sensitivity of nitrate using the NO ratio as a proxy for the degree of thermal decomposition and the resulting distribution of nitrogen oxides. In Fig. S5.5, nitrate mass normalized by ammonium was plotted against the NO ratio from a lens scan of a SV and a manual lens scan of a CV (Hu et al., 2017b) with NH4NO3. Ammonium does not show signs of thermal fragmentation in the AMS (indicated by the stability of the ion ratios of the NHx family), while the NO ratio varied by an order of magnitude. Hence, the metric (nitrate normalized by ammonium) was used to track the change of nitrate sensitivity due to thermal decomposition. The CV entrance edge and off-center positions of the SV showed a similar NO ratio (∼ 0.65–1). The SV center (NO ratio ∼ 0.5–0.65) and CV inner cavity (NO ratio ∼ 0.05–0.1) showed ∼ 3 % and ∼ 10 % lower nitrate sensitivity, respectively, compared to SV off-center positions. Thus, increasing thermal decomposition may lead to slightly lower sensitivity of nitrate. This suggests that, if pRONO2 predominantly yields NO2(g) after thermal decomposition on SV (yielding NO ratio ∼ 0.1), the sensitivity of nitrate from pRONO2 would be 7 %–10 % lower than NH4NO3. However, that 7 %–10 % estimated lower sensitivity is not consistent with the ∼ 35 % lower nitrate sensitivity of pRONO2 compared to NH4NO3 reported by Takeuchi et al. (2024). This discrepancy suggests that there may be factors, other than NO2(g) being the primary source for NO ions, that caused the lower nitrate sensitivity from pRONO2 observed by Takeuchi et al. (2024). Thus, the AMS nitrate sensitivity to pRONO2 requires further evaluation by additional laboratory studies and intercomparisons with instruments with fundamentally different working principles (Fry et al., 2013; Kenagy et al., 2021; Day et al., 2022).
The implication of position-dependent decomposition for OA characterization
During a lens scan using oleic acid particles, higher and (fraction of H2O+ and CO ion among the organic aerosol ions) values were observed at the vaporizer center (Fig. S5.6). (f44 in unit mass resolution) is used as an indicator of OA oxidation or age (Ng et al., 2011) and used for parameterization for the atomic O C ratio of ambient organic aerosol (Aiken et al., 2008; Canagaratna et al., 2015). Canagaratna et al. (2015) showed that , , and of OA standards depended on SV temperature, with their response varying among the tested compounds.
Given the observed higher thermal decomposition of NH4NO3 at the center of the vaporizer, the increase in could be attributed analogously to more efficient thermal decarboxylation of oleic acid. At the center, went up to 0.09. During the lens scan, and the O C ratio (parameterized from ) varied by up to a factor of ∼ 4 and a factor of ∼ 2, respectively, reaching a maximum at the center of the vaporizer. On the other hand, the 55 fraction (f55, mostly C4H), which is often used as an indicator of cooking OA, was not noticeably affected by the location of particle impact (Fig. S5.6e).
Ambient OA may be subject to position-dependent decomposition as well. For example, f44 was systematically higher for CV compared to SV AMSs for ambient OA from various field campaigns (Hu et al., 2018), indicating the enhanced thermal decomposition of oxidized OA increased f44 further. Since the enhanced thermal decomposition at the SV center has a similar effect of increased f44 in OA measurements, this effect might have contributed to the observed variability of f44 across multiple SV-equipped ACSM/AMSs when sampling the same ambient aerosol (Crenn et al., 2015; Fröhlich et al., 2015). More studies are needed to better understand the implications of position-dependent decomposition for the characterization of ambient OA.
3.2 Particle beam profiling using the 2D-SR-BWP method
3.2.1 Analysis of 2D-SR-BWP profiles
The 2D-SR-BWP analysis provides a novel and fast, quantitative measurement of the particle beam profile, i.e., the particle beam width and center position along two orthogonal axes (“X” and “Y”, corresponding to a rotation of the BWP stage of 0 and 90°, respectively; see Sect. S6). Figure 8 shows results from 2D-SR-BWP measurements for a PM2.5 lens coupled to a PCI (PCI-C) using polydisperse NH4NO3 using 17 ion (NH). Figure 8a–b show the time series of the particle size distribution during the BWP wire scan for the X and Y BWP axes. At each internal wire position, the beam may be partially or completely blocked, and then the wire moves away from the beam path to measure the reference distribution of the aerosol source. The resulting particle signal attenuation factor (A; see Eq. 7) as a function of dva at each BWP wire position wire is shown in Fig. 8c–d as well as particle mass size distribution generated from the nebulizer measured by AMS PToF mode. Above ∼ 1.5 µm dva, signal is limited by inlet transmission, with substantially decreasing signal to noise (note that the nebulizer aerosol output spans beyond 1.5 µm dva, as shown in Fig. S7.1c).
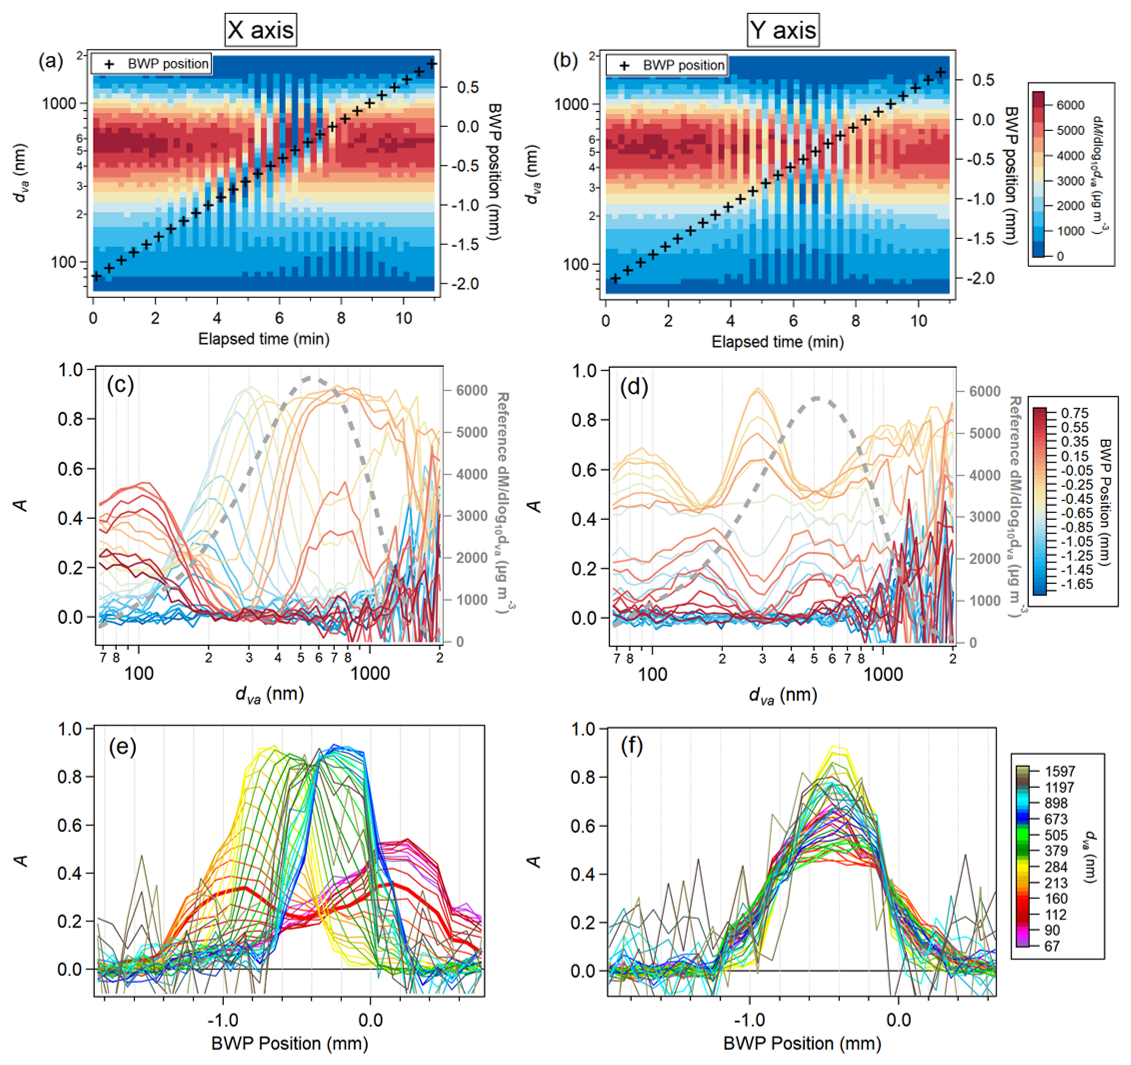
Figure 8(a, b) Time series of aerosol mass distribution at 17 (NH, a major ammonium fragment ion) for a 2D-SR-BWP measurement with a PM2.5 lens using polydisperse NH4NO3 particles. (c, d) Normalized signal attenuation factor (A) at each BWP position as a function of dva, while scanning along the x (c) and y (d) BWP axes. The dotted grey line represents the reference NH4NO3 size distribution (when the BWP wire is not blocking the beam) measured by PToF mode. (e, f) Normalized signal attenuation for each particle diameter bin along the x (e) and y (f) BWP axes as a function of BWP wire position. Panels (e) and (f) illustrate that the particle beam width and center position can vary depending on particle size traveling through an ADL. The BWP position is the BWP wire position whose zero position is aligned with the vaporizer center (Sect. S6). For diameters where the input concentrations are higher, the signal-to-noise of the measured attenuation factor is higher. The stability of the aerosol source on a per-size-bin basis was within 10 % (1σ) below 1300 nm dva (Fig. S7.2).
Beam position differences up to ∼ 0.2 mm (∼ 0.27 mm on the vaporizer plane) were observed previously between two different sizes (110 nm vs. 320 nm dva) for (NH4)2SO4, NH4NO3, and oleic acid particles when using a PM1 lens (Huffman et al., 2005). More recently, the beam position shift vs. particle size has also been observed with a custom-designed ADL although not quantified (Clemen et al., 2020). In Fig. 8e–f, the beam center positions varied significantly (up to ∼ 1 mm) depending on the particle diameter over the x axis, while along the y axis the beam center barely changed. This indicates that BWP measurement along only one axis could fail to capture the variability in particle beam position and width. The particle beam along the x axis was separated into two beams having double peaks ∼ 160 nm dva (see the thick red line in Fig. 8e). The measured beam widths were broader at smaller diameters on the x axis, while the widths on the y axis varied less compared to the x axis over the measurable size range. In Sect. 3.2.3, we show that variations in beam center position and beam width vs. particle size are observed for all ADLs tested.
3.2.2 Comparison of the beam width obtained from regular BWP and SR-BWP
Figure 9 shows particle beam widths for the PM1 lens measured in two ways, as a size-resolved BWP (SR-BWP) with polydisperse particles in both PToF and ePToF modes and as a regular BWP measurement with monodisperse particles. Both BWP and SR-BWP were conducted along only one axis. Oleic acid, NH4NO3, and PSLs were used for monodisperse BWP measurements, and polydisperse NH4NO3 was used for SR-BWP measurements. Oleic acid particles below 120 nm dva were generated from the evaporation-condensation system and DMA (Sect. S1) and allowed us to characterize particle beam width all the way down to the ADL's transmission limit. The monodisperse NH4NO3 particles included some multiply charged particles. The presence of multiply charged particles (larger diameter and narrower beam width) will reduce the apparent beam width, while the different beam positions for different sizes (Fig. 11b) may increase the measured width. In Fig. 9, bold X's indicate BWP measurements that were minimally influenced by multiply charged particles (multiply charged mass was less than 15 % of singly charged mass), while light X's indicate measurements with more multiply charged particles. There is good agreement between the measurements with more or less multiply charged contribution. In addition, the width from DMA-generated NH4NO3 showed a reasonable agreement with oleic acid particles.
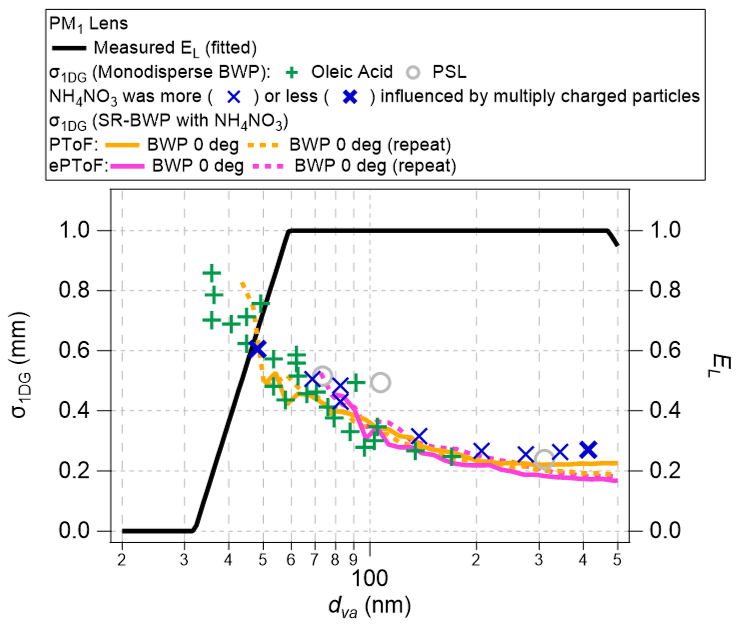
Figure 9Particle beam width measurements with a PM1 lens (left axis) by BWP using monodisperse PSLs, oleic acid, and NH4NO3 particles. Also shown is the SR-BWP data obtained from polydisperse NH4NO3 particles, confirming the good agreement between the two techniques. The EL for this PM1 lens (per Fig. 12) is shown on the right axis. The BWP measurement with monodisperse particles was done with a PM1 lens coupled with PCI-C, and SR-BWPs were conducted with the same PM1 lens but without PCI. Monodisperse particle beam width measurements of NH4NO3 particles are influenced by multiply charged particles (Fig. S1.3). The decrease in EL when the measured beam width (σ1DG) increases above 0.5 is consistent with the model prediction (Fig. 4c). The agreement between the SR-BWP NH4NO3 and monodisperse oleic acid BWP results suggests that the particle transmission below dva < 100 nm can be inferred by performing SR-BWP measurements in the laboratory or in the field.
The beam widths measured from monodisperse BWP and NH4NO3 from SR-BWP agreed well. Thus, the use of PToF mode for BWP measurements, which involves a very high concentration of aerosol input (typically several mg sm−3) vs. BWP with monodisperse input (a few to tens of µg sm−3), does not appear to bias the results. Also, the SR-BWP results with PToF and ePToF were nearly identical, indicating that the different size information reduction procedures (Fig. 9) do not affect the results. The SR-BWP results shown in the later sections are performed in PToF mode (rather than ePToF) due to the lower retrieval noise (and hence higher per-bin stability). SR-BWP analysis provides the same beam width information as obtained from the conventional monodisperse BWP operation but has significant benefit in that it provides size-resolved information, in particular for small sizes that are difficult to access with monodisperse measurements.
Figure 9 shows the fit to the measured EL for the PM1 lens (Fig. 12a). The measured EL decreases as beam width increases (σ1DG above ∼ 0.5 mm) at lower dva. EL is 50 % around 45 nm dva where σ1DG is 0.6–0.8 mm (0.75–0.8 mm with SR-BWP). These are consistent with beam modeling results (Fig. 4c) where the estimated transmission efficiency starts decreasing above ∼ 0.5 mm σ1DG and is 50 % at ∼ 0.77 mm σ1DG, assuming the beam center position is close to the vaporizer center. These results show that the EL of the PM1 lens below 100 nm dva is mainly driven by the beam widening of small particles at the lens nozzle.
3.2.3 Particle beam profiles for different ADLs
Figure 10 shows 2D-SR-BWP attenuation vs. BWP wire position and dva. Particle beam profiles from the PM1 lens, PM2.5 lens, and HPL were calculated using 2D-SR-BWP measurements, at PLens of 2, 5.1, and 21 mbar, respectively. Here, the beam profile refers to a Gaussian fit to the attenuation data at each dva bin (e.g., Fig.8e–f). See Fig. S10.1 for the signal attenuation prior to Gaussian fitting. The lenses were tested with a single critical orifice (dCO,std = 120 µm), without pressure-controlled inlets. The 2D-SR-BWP measurements were conducted along the X and Y BWP axes for the PM2.5 lens and HPL, while the measurements from the PM1 lens are available only for the x axis and an axis at 30° from the x axis. Figure 11 summarizes the measured beam widths (σ1DG) and the relative beam center positions.
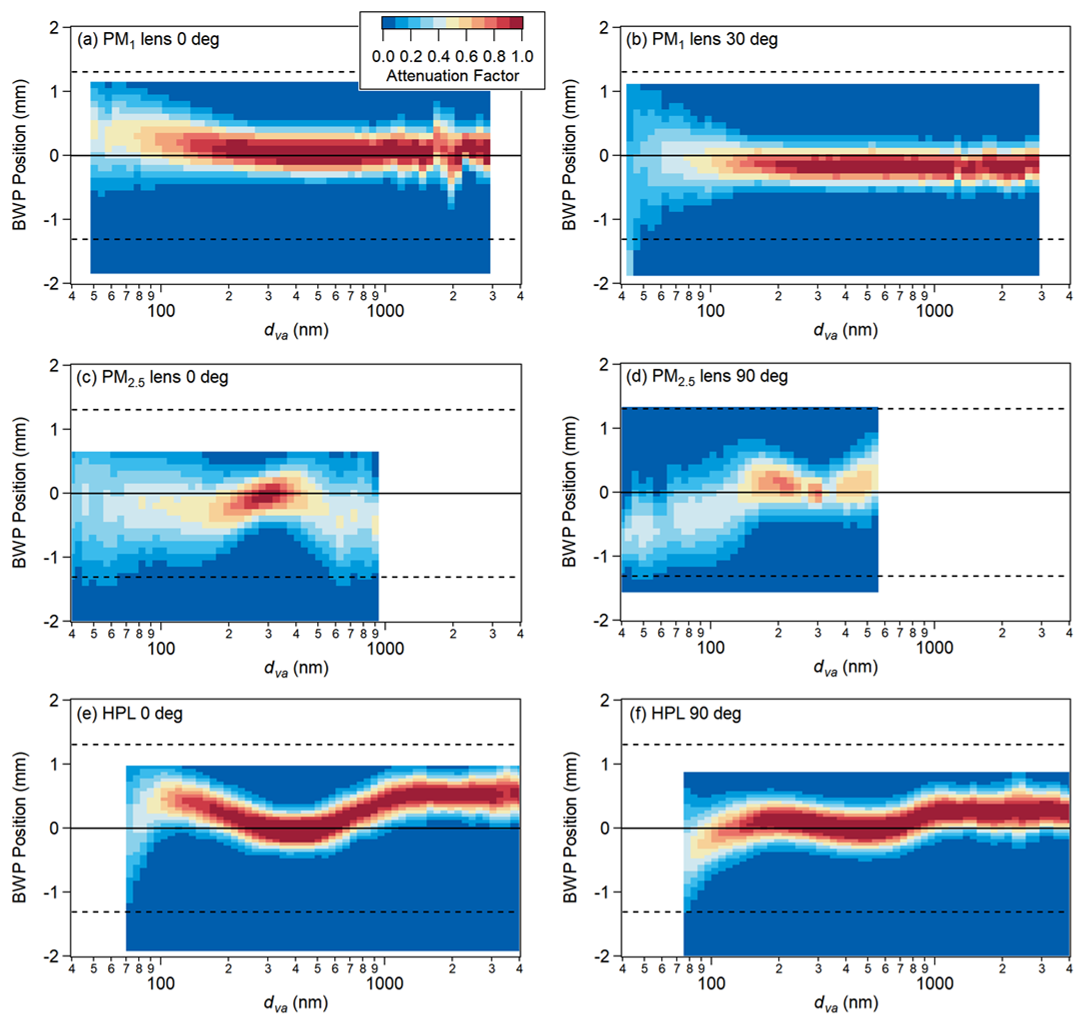
Figure 102D-SR-BWP signal attenuation measured with polydisperse NH4NO3 using a PM1 lens (a, b), PM2.5 lens (c, d), and HPL (e, f) in the x (left column, without BWP stage rotation) and y (right column, BWP stage 90° rotated, except for PM1 lens) axis. The first row of the right column is only at a 30° rotation from the x axis of the PM1 lens. Here, measured signal attenuations were fitted with a Gaussian fit (see Fig. S10.1 for results without Gaussian fit). The dotted lines represent the vaporizer edges projected to the BWP plane.
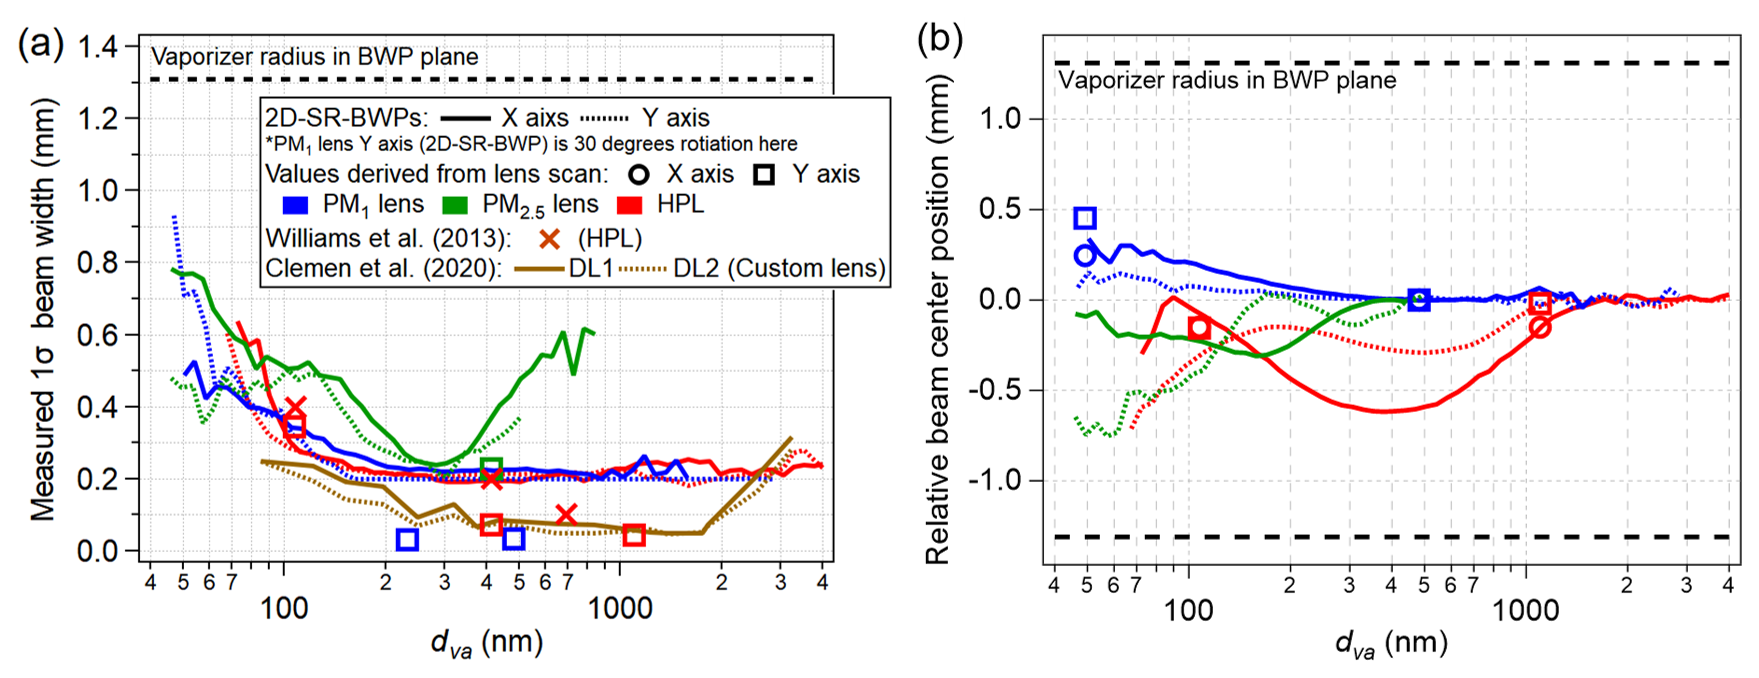
Figure 11Compilation of (a) beam width (σ1DG) and (b) relative beam center position (relative to largest measured particles) as a function of dva for the PM1, PM2.5, and HPL lenses, measured on the x and y axis at the BWP plane. Beam width measurements using a custom-designed ADL (Clemen et al., 2020) and PSL particles are shown for comparison width ADLs from Aerodyne. Clemen et al. (2020) measured beam width by mechanically tilting lens and the aerosol beam in two perpendicularly aligned detection lasers (DL1 and DL2). The widths from Clemen-ADL were scaled to reproduce the width after traveling the same distance as the ADLs in this work. In panel (b), the relative beam positions measured using a lens scan of larger particles were matched to the relative position from 2D-SR-BWP of the same dva.
The PM1 lens data show the tendency of beam broadening at smaller particle sizes due to Brownian motion at the nozzle expansion while showing better beam collimation at larger sizes (Fig. 11a). The beam center position shifted as a function of dva, up to ∼ 0.3 mm (Fig. 11b), which is equivalent to ∼ 0.4 mm shift at the vaporizer (11 % of vaporizer diameter). This is not negligible, considering the transmission efficiency (Fig. 4c) and position-dependent fragmentation on the vaporizer (Fig. 7a). However, the shift in beam center position for the PM1 lens was smaller than for the HPL and the PM2.5 lenses discussed next.
The results for the PM2.5 lenses show large variation in both beam width and center position as a function of dva. The particle beam position from the PM2.5 lens shifted up to ∼ 0.65 mm (∼ 0.9 mm in the vaporizer plane and hence ∼ 25 % of the vaporizer diameter), similar to the HPL. Interestingly, unlike the PM1 lens and HPL, the PM2.5 lens exhibited an increased beam width above ∼ 400 nm dva (see also Figs. S10.3c and S16.1c–d). This indicates that optimizing the lens alignment is important not only for maximizing the small particle transmission but also for midrange sizes (300–700 nm dva) as well. The different beam widths from the PM2.5 lens along the X and Y BWP axes indicate that the cross-section of these particle beams is elliptical (especially for dva < 80 nm and dva > 400 nm). Note that the data quality of 2D-SR-BWP results for the PM2.5 lens in a single critical orifice setup was compromised compared to the results from the PM1 lens and HPL in terms of particle size range, due to issues operating the aerosol source at large sizes during those experiments (Fig. S10.1c–d). The reproducibility of the BWP wire control during the y-axis measurements adds additional uncertainty to this measurement (Fig. S10.1d). However, the comparison with repeated measurements (Figs. S10.2–S10.3) suggests that the beam broadening in the 300–700 nm dva range and the large shift in beam center position are the features of the PM2.5 lens. These features were also observed from a different Aerodyne PM2.5 lens with improved nozzle design with ruby orifice (data not shown). More details about the PM2.5 lens with ruby exit nozzle can be found in Nault et al. (2025).
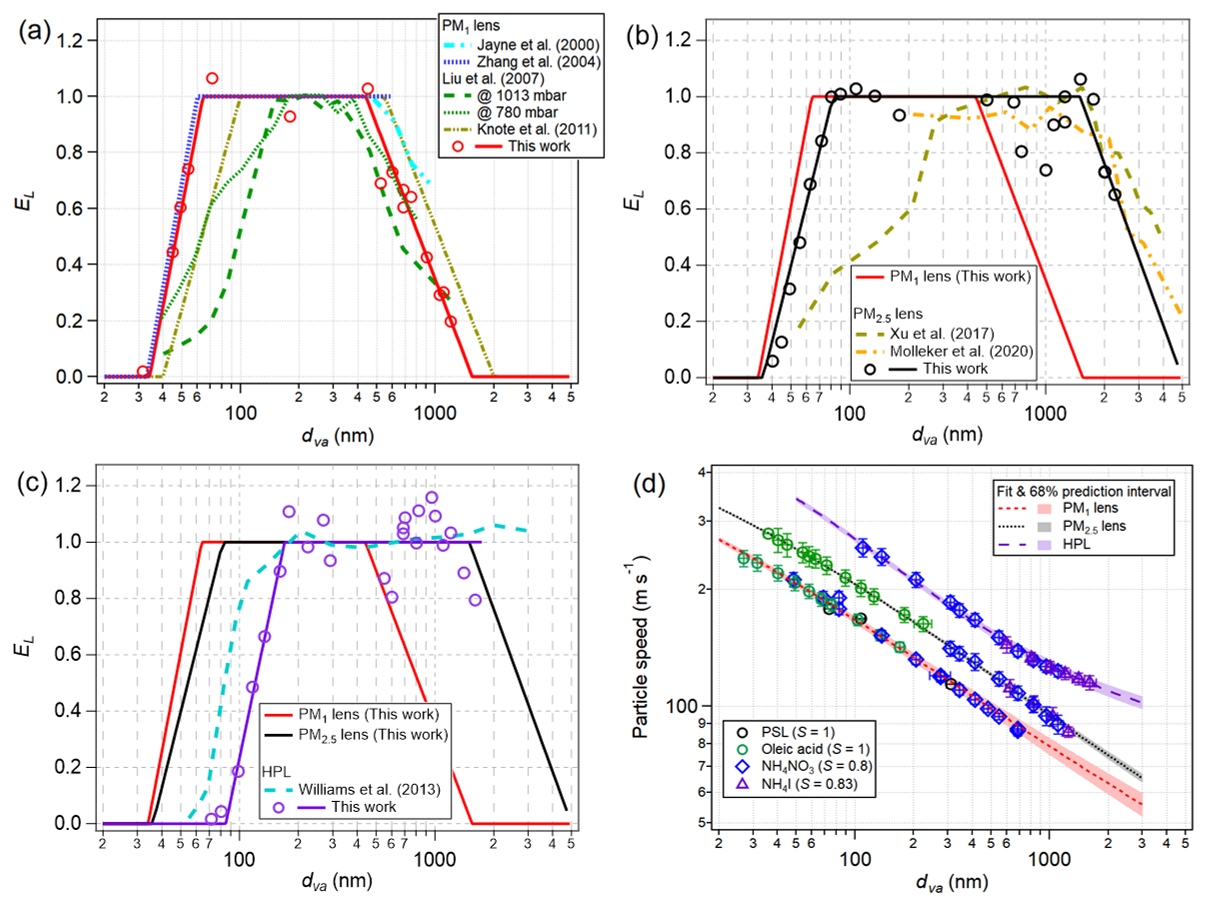
Figure 12Measured and literature EL of standalone (a) PM1 lens, (b) PM2.5 lens, and (c) HPL. (a) PM1 lens EL from Zhang et al. (2004a) was estimated from field measurements. EL values shown by Liu et al. (2007) are their measurements at 780 and 1013 mbar ambient pressure. EL from Knote et al. (2011) is a recommendation based on the average EL used in several studies (DeCarlo et al., 2004; Park et al., 2004; Cross et al., 2007; Vaden et al., 2011). (b) PM2.5 lens EL from Xu et al. (2017) was measured by the Aerodyne Aerosol Chemical Speciation Monitor with a capture vaporizer. Molleker et al. (2020) used the ERICA (ERC Instrument for Chemical composition of Aerosols; ERC – European Research Council) (Hünig et al., 2022) and CPI (see Sect. 3.3.2). (c) The HPL used in Williams et al. (2013) and in this study are the same physical lens. More details can be found in Sect. S9. (d) Particle speed vs. dva during ePToF calibration of the three lenses with oleic acid, PSL, NH4NO3, and NH4I. For details of S of NH4I, see Sect. S4. The measured particle speeds were faster for lenses with higher operating pressure, for the particles of the same dva.
The HPL again shows a monotonic decrease in beam width for larger particles, as for the PM1 lens. Below 100 nm, the particle beam from the HPL was broader than for the PM1 lens, which is consistent with the lower EL of the HPL in that particle size range (Fig. 12c). The particle beam position from the HPL shifted noticeably depending on the particle size, up to ∼ 0.65 mm, which is equivalent to ∼ 0.9 mm at the vaporizer (∼ 25 % of the vaporizer diameter). Thus, for small particle transmission, the center shift would be as important as the beam broadening. Maximizing particle transmission for the broad range of particle sizes accessible with the HPL will benefit from both information on the beam profile in two dimensions and an accurate lens alignment tool.
The shifts in beam focusing and pointing may depend on the ADL design, operating pressure, upstream plumbing (e.g., use of PCI vs. single critical orifice), and other factors. The beam widths of the PM2.5 lens coupled with PCI-D were very similar to those without a PCI, indicating the use of PCI-D does not significantly influence the beam focusing of the ADL (Fig. S16.1c). Direct comparison of the relative beam position with the bare PM2.5 lens is complex since the bare lens measurements were conducted before the TI3GER campaign, and the rotational orientation of the PM2.5 lens is likely different, which means the axes in Fig. S16.1d with and without PCI are not the same. Even for the same type of ADL, imperfections in the machining process could lead to such irregular beam focusing/pointing, although some features may remain qualitatively the same, such as beam broadening of ∼ 500 nm dva particles from PM2.5 lens.
In BWP measurements, the measured σ1DG cannot be narrower than a certain width (σ1DG,min ∼ 0.18 mm, Fig. 4b) because the width of the wire itself limits the minimum width that can be measured (Sect. 2.3.3). In other words, a beam width narrower than σ1DG,min will appear as σ1DG,min in the BWP measurements (Fig. 11a). Although the actual beam width can be estimated through modeling, as was done in this work (Fig. 4b) and Huffman et al. (2005), the modeled estimation becomes more uncertain for σ1DG < 0.25 mm. On the other hand, beam width measurement based on lens scans can be more sensitive to narrower beam widths providing complementary measurements to SR-BWP (Sect. 3.1.1 and Fig. S5.7). The lens-scan-based beam width measurement shows that the beam width from the PM1 lens can be as narrow as 0.035 mm (at ∼ 480 nm dva), which is about an order of magnitude narrower than the beam width from the PM2.5 lens. The relative center positions of monodisperse particles from lens scans (Fig. 11b) were also measured from lens scans with monodisperse particles of different dva (Fig S5.6c). The beam position shift vs. dva observed from lens scan and 2D-SR–BWP were similar (Fig. 11b).
Clemen et al. (2020) measured particle beam width for multiple PSL sizes by mechanically tilting the lens, conceptually similar to the lens scanning in this study. They characterized a custom-designed ADL consisting of conical orifices for particle collimation. The aerosol beam width measurement by two perpendicularly aligned detection lasers (DL1 and DL2) provided beam width information along the two perpendicular axes. The beam width comparison between the PM1 lens and that custom ADL shows the beam width of the PM1 lens to be similar to or narrower than the width of the custom ADL in the 200–500 nm dva range (Fig. 11a). The beam width measurement from a PM2.5 lens in Clemen et al. (2020, Fig. 16 in that paper) increased at dva > 300 nm which is qualitatively consistent with our results. Beam width from HPL was similar to that from the custom ADL in 400–1200 nm dva range.
3.3 Laboratory tests for characterization of the aircraft inlet
3.3.1 EL of standalone PM1, PM2.5, and HPL lenses
EL of three standalone ADLs (PM1, PM2.5, and HPL) at 2, 5.1, and 21 mbar PLens, respectively, were measured with monodisperse particles of different compositions (Sect. 2.1 and 2.4). Typical atmospheric pressure in Boulder was ∼ 820 mbar, and the pressure in the AMS aerosol sampling line was ∼ 790 mbar. A single CO (dCO,std = 120 µm) was used coupled with EV-C to minimize particle losses after the COstd (Fig. S3.2). EL was calculated by comparing the aerosol mass measured by AMS and CPC (Sect. 2.4). The particle speed calibration curve was fitted following Eq. (4). In this work, measured EL linearly increases in log(dva) space as dva increases (usually below 200 nm dva) and plateaus afterward around 1 and then linearly decreases. Hereafter, dva where TE is 50 % are referred to as () on the lower (higher) side of the TE curve.
The measured for the PM1 lens in this work ( ∼ 47 nm) was lower than the reported value by Knote et al. (2011) ( ∼ 63 nm, as calculated from the geometric mean of and in the paper), which is an averaged value from multiple studies (DeCarlo et al., 2004; Park et al., 2004; Cross et al., 2007; Vaden et al., 2011). Zhang et al. (2004a) reported ∼ 45 nm, which is consistent with this work, using data from a very strong new particle growth event. The measured of the PM1 lens in this work was noticeably lower than the value reported by Liu et al. (2007) ( ∼ 63 and 95 nm for 780 mbar and 1013 mbar ambient pressures, respectively) (Fig. 12a). It is unclear what causes the observed differences, with possible explanations including differences between different actual lenses, larger deviations for beam pointing of small particles for some lenses, and/or measurement inaccuracies. The measured ∼ 830 nm in this work was lower than the value used by Knote et al. (2011) ( ∼ 1060 nm). It was higher than measured at 1013 mbar (650 nm) and similar to measured at 780 mbar (900 nm) reported in Liu et al. (2007). On the other hand, it is close to the lower EL PCI setup used during SEAC4RS reported in Hu et al. (2017b) and Guo et al. (2021).
The PM2.5 lens shows slightly worse transmission for small particles than the PM1 lens (Fig. 12b), which is consistent with the relative beam widths determined for small particles (Fig. 11a). Xu et al. (2017) reported ∼ 150 nm, significantly worse than the measurements in this study ( ∼ 55 nm). Although the exact reasons behind the difference are unclear, it is possible that the lens alignment in Xu et al. (2017) might not have been in an optimal position for small particle sampling. The EL measurements in Xu et al. (2017) were performed with the Aerosol Chemical Speciation Monitor with a capture vaporizer, whose particle entrance diameter is smaller (2.54 mm) than for the standard vaporizer (3.8 mm). Given the use of a vaporizer with a smaller acceptance angle and the fact that the PM2.5 lens can have more variation in position vs. dva compared to the PM1 lens (Fig. 11b), the particle beams for smaller diameters might not have been well captured by the capture vaporizer in Xu et al. (2017). The PM2.5 lens shows much better transmission for large particles ( ∼ 2.5 µm) than the PM1 lens, consistent with previous measurements (Xu et al., 2017; Molleker et al., 2020). In certain urban environments, aerosol mass measurements with a PM2.5 lens were up to ∼ 30 % higher than measurements with a PM1 lens due to the broader particle transmission size range (Elser et al., 2016; Joo et al., 2021; Li et al., 2023; Liu et al., 2024).
The HPL operates at the highest Plens (21 mbar) followed by the PM2.5 lens (5.1 mbar) and PM1 lens (2 mbar). The measured particle speeds in vacuum were generally higher for lenses with higher PLens, with particles exiting the HPL being the fastest (Fig. 12d). The PLens in this work was ∼ 14 % higher than the PLens in Williams et al. (2013) (Table S9.1) for the same lens flow. The EL of small particles ( ∼ 120 nm, Fig. 12c) was worse than for Williams et al. (2013), which is consistent with the laboratory tests that showed larger when PLens is higher (Fig. S13.2). The high transmission for large particles ( > 1500 nm) was consistent with Williams et al. (2013).
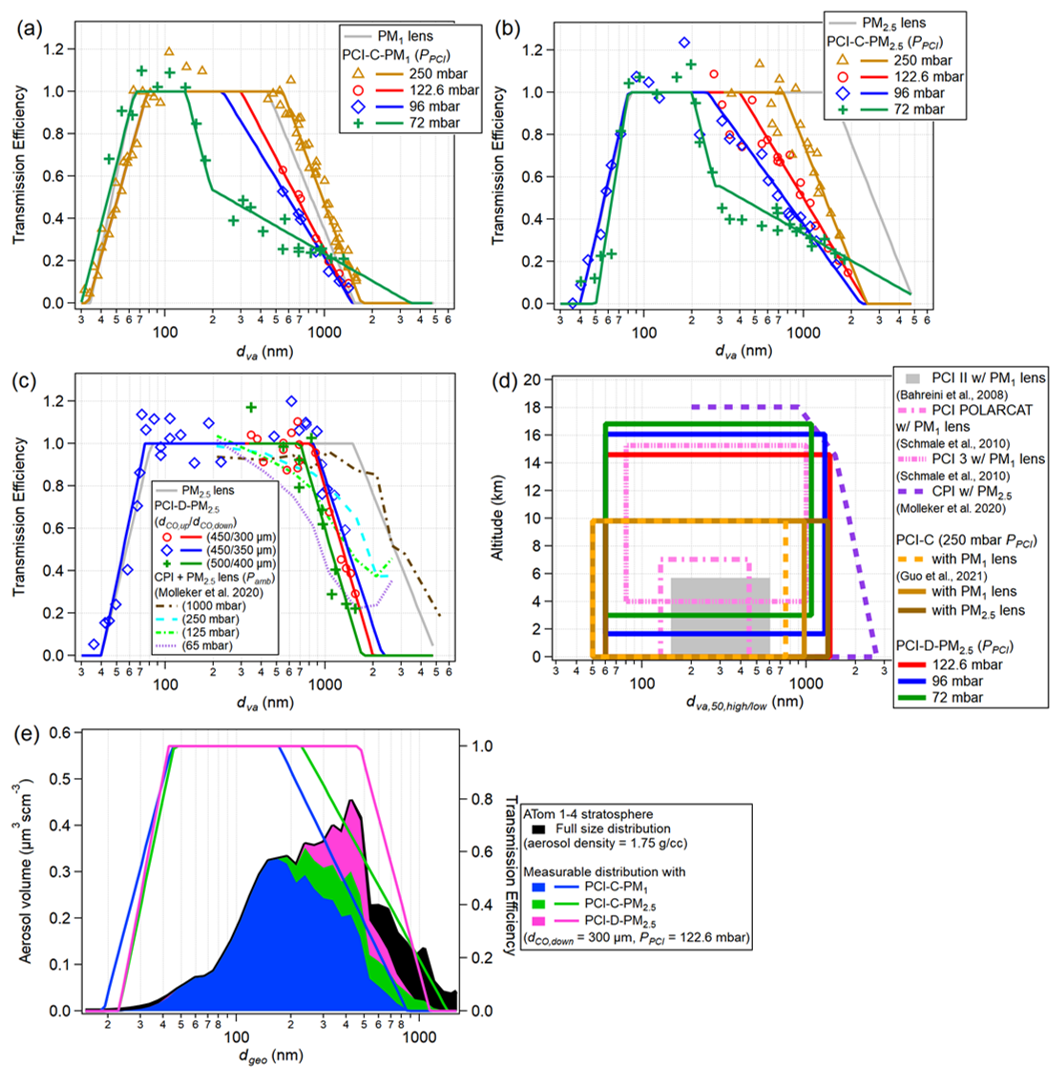
Figure 13TE measurements of (a) PM1 lens coupled with PCI-C (PCI-C-PM1), (b) PM2.5 lens coupled with PCI-C (PCI-C-PM2.5) and (c) PM2.5 lens coupled with PCI-D (PCI-D-PM2.5) at various PPCI (various dCO,down). For 220, 300, 350, and 400 µm dCO,down, PPCI values were set to 250, 125, 96, and 72 mbar, respectively (see Table S11.2 for dCO,up sizes), in order to maintain the nominal PLens (2 mbar for PM1 lens and 5.1 mbar for PM2.5 lens). Solid lines in panels (a)–(c) guide the eye for the measured data using trapezoidal shapes in log(dva) space. (d) to range and optimal operational altitude range of inlet systems characterized in this study and in previous studies. The dva range where TE ∼ 1 is shown for “PCI II” with PM1 lens since dva,50 was not measured. The of CPI with PM2.5 lens was not measured. The of PCI-C-PM1 from Guo et al. (2021) is 750 nm for the ATom 1–3 campaigns (as shown in the figure) and 950 nm for the ATom 4 campaign. (e) TEs of tested aircraft inlet systems and their measurable particle distribution in the lowermost stratosphere vs. geometric diameter (dgeo). The size distribution shown is an average of all the stratospheric data (using the criteria discussed in Koenig et al., 2020) reported by the NOAA Aerosol Microphysical Properties instrument during the NASA ATom 1–4 campaigns (Brock et al., 2019). Aerosol density was assumed to be 1.75 g cm−3 since the majority of the stratospheric particle composition is sulfuric acid with some aged organics.
Williams et al. (2013) modeled the difference in EL between the HPL with and without an EV (or relaxation chamber), which significantly enhanced the transmission above 1 µm dva. In this study, while the particle transmission of the EV-C (a different volume than in Williams et al., 2013; Fig. 5a) was not experimentally characterized, EL from the HPL coupled with EV-C appeared to be similar (up to ∼ 1.5 µm dva) to the EL result from Williams et al. (2013). Additionally, fluid dynamic modeling of particle transmission of the EV-C with 120 µm COstd at 5, 13, and 17 mbar PLens suggests that for this expansion volume is > 4500 nm (Fig. S3.2), indicating the measured EL of the HPL and the PM2.5 lens reported here was likely not limited by the transmission of EV-C. For the PM1 lens, the reported here was smaller by ∼ 150 nm than the of the PM1 lens equipped with PCI-C as reported by Guo et al. (2021) and confirmed by this work (Fig. 13a, d). This suggests that the transmission of EV-C operated at ∼ 2 mbar (with 120 µm COstd) potentially limits the large particle transmission of the PM1 lens. Additionally, particle losses inside plumbing upstream of the COstd could affect the (Liu et al., 2007). In general, the large particle transmission is affected by the geometry of the plumbing setup upstream of ADL, and thus, the differences in the measurements of (Fig. 12a–b) can be partially attributed to the plumbing geometry upstream of ADL.
3.3.2 Transmission efficiencies of ADL coupled with PCI
Figure 13a–c show the measured TE vs. dva with PCI-C + PM1 lens, PCI-C + PM2.5 lens, and PCI-D + PM2.5 lens inlet setups, respectively. Hereafter, these combinations of PCI and ADL will be referred to as PCI-ADL, for example, PCI-C-PM1, PCI-C-PM2.5, and PCI-D-PM2.5. These inlet setups were tested with various choices for the bottom critical orifice, 220, 300, 350, and 400 µm dCO,down, resulting in 250, 125, 96, and 72 mbar for PPCI, respectively, to maintain the nominal Plens (2 mbar for PM1 lens and 5.1 mbar for PM2.5 lens). The use of a PCI did not noticeably affect low-end particle transmission, indicating that the residence time was short enough to prevent diffusional losses. Maximum TE plateaus at 1 within the precision of the measurements (same as standalone ADL cases), suggesting there was no significant under-/oversampling or evaporation of test particles at the pickup tube inside the IPV (Fig. 5). The particle transmission efficiencies shown in this section are equal to ().
PCI-C-PM1 configurations for higher-altitude sampling with larger dCO,down and hence lower PPCI were tested in this study (Fig. 13a). Lower PPCI sharply reduced larger particle transmission, with being ∼ 950, 650, 600, and 250 nm for 220, 300, 350 and 400 µm dCO,down, respectively. The detailed characterization of PCI-C-PM1 configuration ( = 350/220 µm) and comparison with other aerosol instruments during the NASA ATom mission were described in Guo et al. (2021). During the ATom mission, of the inlet was ∼ 750 nm for ATom 1–3 and ∼ 950 nm for ATom-4 (Guo et al., 2021), respectively. For PCI-C-PM2.5, the trend was similar, but the upper-end particle transmissions, , were ∼ 1500, 1000, 750, and 400 nm (for the same set of PPCI), higher than PCI-C-PM1 due to the improved large particle transmission of the PM2.5 lens (Fig. 13b). This suggests that, for PCI-C-PM1, the is mainly limited by EL of the PM1 lens especially when PPCI is higher (dCO,down is smaller). In the PCI-C-PM2.5 setup, is mainly limited by the particle transmission of PCI-C since all the measured values with PCI were worse than those of the standalone PM2.5 lens. Thus, for further improvement of the overall inlet TE with a PM2.5 lens, the PCI transmission needs to be significantly improved. Figure 13c shows the transmission efficiency of PCI-D (designed as a part of this work) with a PM2.5 lens. As discussed in Sect. 2.5, the addition of EVup downstream of COup in PCI-D enhanced the transmission efficiency of large particles significantly, although the reason for the improvement is not clear. Unlike PCI-C, using larger COdown only marginally reduced (∼ 1370, 1300, 1100 nm for 125, 96, 72 mbar PPCI). For the inlet configurations with the PM1 lens and PM2.5 lens coupled with PCI-C, D, the was nearly identical to that of a standalone lens (Fig. 13a–c), indicating that the diffusion losses of small particles in PCI-C, D (30–100 nm dva) were negligible.
The optimal operation altitude ranges and their dva,50 ranges of the multiple PCI-ADL combinations in this work and previous studies are compared in Fig. 13d (see Table S11.1 for PCI setups and reported TEs). Here, optimal operating altitude is defined as the altitude where the ambient pressure is sufficiently high to ensure that the pressure upstream of COup is higher than PPCI, so that the PCI can maintain its nominal PPCI. The upper limit of the optimal operating altitude is determined by the set PCI pressure, and the lower limit is determined by the pumping capacity of the PCI pump. Note that the input pressure at the inlet can differ slightly from ambient pressure. For example, when the sampling inlet is located over the wing, the sampling line pressure can be 50–100 mbar lower than ambient. An additional 50–100 mbar pressure drop occurs inside the sampling line. However, the pressure upstream of the PCI (sampling line pressure) tends to be higher than the ambient pressure during flights due to the ram pressure on the sampling inlet into the aircraft. These additional effects do impact the actual operational altitude (Fig. S17.2).
The “PCI II” with PM1 lens from Bahreini et al. (2008) was one of the first PCI designs deployed for AMS aircraft operation with optimal operation up to ∼ 6 km (PPCI = 467 mbar). In that study, while and were not measured, TE was near unity in the range of 150–650 nm dva. Thus its dva,50 range is wider than what is shown in Fig. 13d. Schmale et al. (2010) deployed the same PCI design with different dCO,up/dCO,down setups (380/250 and 400/160 µm with PPCI = 110 and 387 mbar, respectively). While the 110 mbar PPCI setup (“PCI 3”) had a good dva50 range (80–1000 nm) up to ∼ 15 km altitude, PPCI was not kept constant below 4 km altitude due to pumping limitations. The 387 mbar PPCI setup (“PCI POLARCAT”) had a narrower dva,50 range (130–450 nm) but could maintain the nominal PPCI from sea level up to ∼ 7 km altitude.
The PCI-C-PM1 inlet was deployed during the NASA ATom and FIREX-AQ campaigns maintaining nominal PPCI up to a pressure altitude of about 9 km. The PCI-C-PM1 configuration increased both the dva,50 range and operational altitude range compared to the previous inlets. While not ideal, this configuration guaranteed that even at maximum NASA DC-8 altitude (∼ 12.5 km), the pressure in the PM1 aerodynamic lens stayed above 1.3 mbar, and hence the aerodynamic focusing into the vaporizer was not substantially impacted. Rather, overall TE appeared to be slightly improved in such conditions potentially due to sub-isokinetic sampling at the secondary diffuser during ATom (Guo et al., 2021). Under these conditions, the flow rate in the ADL decreases, resulting in a lower sampling rate and hence slightly lower sensitivity of the AMS. Thus, an inlet that can maintain a constant PPCI (and hence a constant PLens) at the maximum altitude at a given aircraft campaign is desired.
Unlike the PCI designs discussed above, the constant pressure inlet (CPI) controls pressure upstream of ADL with a single pinched orifice by adjusting the diameter of the orifice actively during a flight (Molleker et al., 2020). Laboratory experiments showed a decreasing trend for at lower ambient pressures (i.e., larger orifice diameter) and TE vs. dva has a more gentle slope than for the PCIs (Fig. 13c). for CPI was not measured. Overall, the range of CPI is larger than other inlets, especially at lower altitudes, but comparable to PCI-D-PM2.5 at higher altitudes.
The PCI-D-PM2.5 has significantly expanded the dva,50 and operation altitude range compared to the previous PCIs with the PM1 lens. With the PCI-D with 450/350 µm (dCO,up/dCO,down) configuration used initially during the TI3GER campaign, a triple-stage diaphragm pump (Vacuubrand Model MD1) was not sufficient to keep PPCI down to 72 mbar below 1.7 km altitude (Fig. S17.1). For operations including sea level altitude, a 450/300 µm (dCO,up/dCO,down) configuration (as used during the second part of TI3GER) or a 450/350 µm (dCO,up/dCO,down) configuration with a more powerful (and heavier) PCI pump can be used. Shattering of monodisperse NH4NO3 particles – used as a standard calibrant for AMS sensitivity – has been observed when operating earlier PCI designs (Guo et al., 2021) as well as single critical orifice setups. These shattering issues were not observed with either PCI-C or PCI-D.
Figure 13e compares the detectable size distribution of particles in the lower stratosphere for a “typical” stratospheric distribution (an average of ATom data in the LS) using different inlet setups characterized in this study. By applying the measured TE, we estimate that the PCI-C-PM1, PCI-C-PM2.5, and PCI-D-PM2.5 configurations (at dCO,down = 300 µm and PPCI = 122.6 mbar) would deliver to the AMS vaporizer approximately 65 %, 78 %, and 89 % of the ambient particles mass, respectively. Therefore, PCI-D-PM2.5 was used for the aerosol measurement up to the upper troposphere and lower stratosphere (UTLS) during TI3GER. The residence time inside the PCI was calculated and measured using NH4NO3 particles (Sect. S12). Given the smaller overall size and lower operating pressure, the residence time inside the PCI was shortened by approximately half (0.2–0.5 s) compared to the PCI-C-PM1 deployed during ATom campaigns (0.5–1 s) (Fig. S12.1), reducing potential diffusional and evaporative losses.
3.4 Aircraft inlet performance during the TI3GER campaign
3.4.1 Particle beam diagnostics in the field
Four sets of 2D-SR-BWP measurements were performed to monitor and optimize the beam alignment of the PCI-D-PM2.5 inlet during the TI3GER campaign, with the polydisperse aerosol generation setup (Fig. 1). The 2D-SR-BWP beam profile measurements were performed on 4 different non-flight days (Fig. S16.1a). Overall, the beam widths of the PCI-D-PM2.5 system as a function of dva were similar during the TI3GER campaign (Fig. S16.1c). The beam relative positions were nearly identical for BP1–BP3, while BP4 showed noticeable changes in the BWP x axis (Fig. S16.1d). This indicates that the beam pointing by the PCI-D-PM2.5 as a function of dva remained nearly identical except for BP4. The exception is probably due to tilting of the inlet plumbing due to additional strain. The relative beam position of the PM2.5 showed similar position variability in the x axis, while the position was relatively constant in the y axis.
After each flight (except for FF01 and RF05), 2D-BWP measurements with monodisperse NH4NO3 particles (350 nm dm) were performed to track the relative change in lens alignment and fill the gap between the 2D-SR-BWP measurements. In Fig. 16a, the four profiles from 2D-SR-BWP were adjusted so that the beam of the same dva as the monodisperse beam (from the flights that were conducted after each 2D-SR-BWP) is matched with the position of the monodisperse beam. These adjusted BPs (BP1–4) were assigned to be the BPs of RF01, RF02-RF03 & FF01, RF04, and RF05-RF08 & FF02, respectively. There are clear shifts in beam profile positions on the vaporizer. These variabilities can be attributed to various factors such as the installation of AMS on aircraft, vibration during flights/landing, and inlet remounting after service including replacement or cleaning of critical orifices (Fig. S16.1a). The inlet was serviced during the TI3GER campaign since this topic was under direct investigation. Such shifts would not be expected for other research missions.
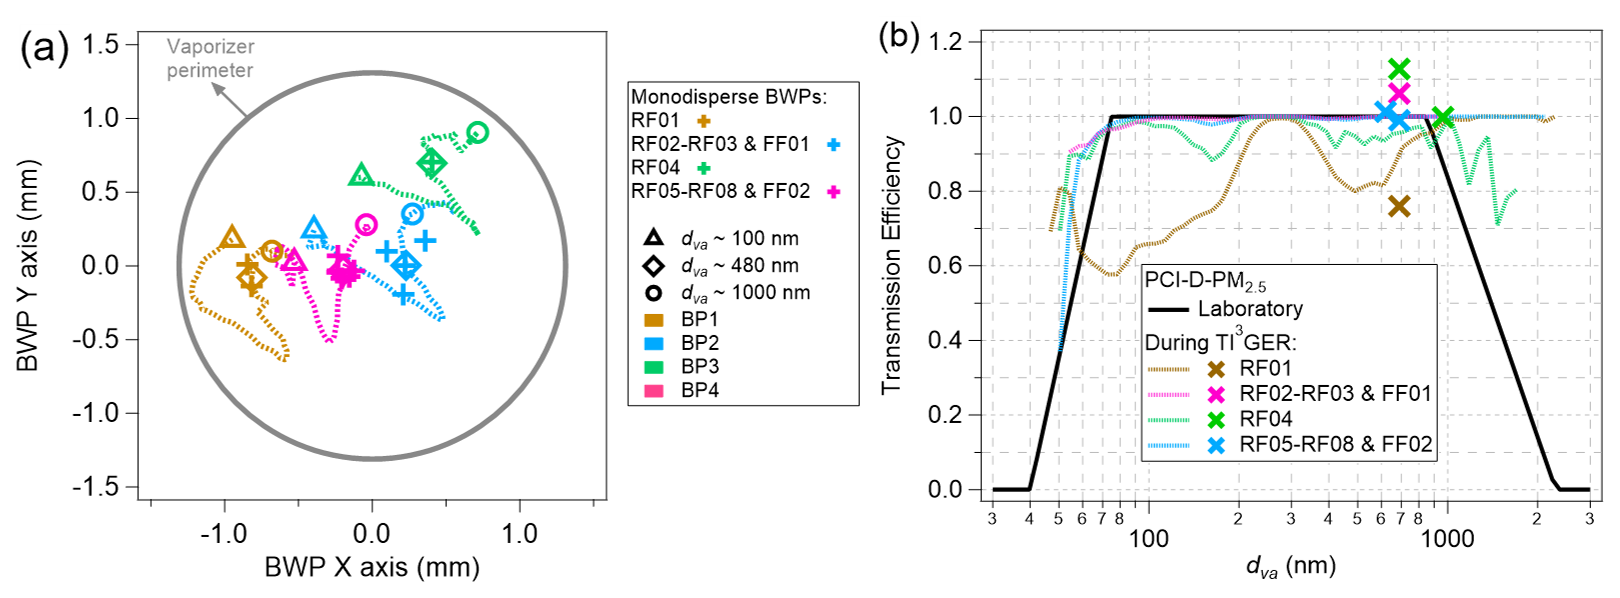
Figure 14(a) Compilation of beam center positions as a function of dva measured from 2D-SR-BWP analysis during TI3GER campaign (dashed lines). The solid grey line is the vaporizer perimeter at the BWP plane. The beam positions of monodisperse NH4NO3 particles are shown by cross markers after flights. The dotted lines represent the four beam profiles (BP1–4) (after being corrected to match with the monodisperse beam positions measured from research flights after each 2D-SR-BWP; see Fig. S16.1 for details). (b) TEs modeled from the four 2D-SR-BWP (dashed lines) as well as the measured TE from the laboratory (solid line) of PCI-D-PM2.5. X markers are the measured TEs during the TI3GER with monodisperse NH4NO3 aerosols. Note that the model does not account for the particle losses inside or upstream of ADL.
The particle beam model (Sects. 2.3.3 and S8) was used to estimate the particle transmission efficiency that accounts for the losses due to the particles failing to hit the vaporizer (Fig. 14b). For all the 2D-SR-BWP measurements, the decreasing trend of TE at dva < 80 nm is captured by the model (consistent with PCI-D-PM2.5 TE). For RF01, compromised TE (dva < 250) nm is due to the beam profile of the size range being too close to the vaporizer edge, while the compromised TE in the 400–700 nm dva range is mainly due to a broad beam width on the x axis (Fig. S16.1c). The in-field TE measurement after RF01 at 688 nm dva was ∼ 0.75, consistent to modeled TE (Fig. 14b). Overall, the particle losses due to failing to hit the vaporizer are negligible for the other flights during the TI3GER campaign. In general, the aircraft inlet for AMS during the TI3GER campaign worked well, as expected from the laboratory experiment, despite several inlet adjustments. The in-field 2D-SR-BWP measurements and modeling suggest that the particles downstream of the PCI-D-PM2.5 inlet were mostly well captured by the vaporizer.
3.4.2 AMS vs. UHSAS aerosol volume comparison
The time series of calculated aerosol volume concentration measured by AMS (Vchem) and by UHSAS (Vphys) volume during the TI3GER campaign are shown in Fig. 15a. The aerosol volume from AMS and UHSAS for this subset of the data agreed very well (slope = 1.00, R2 = 0.96, Fig. 15b; see the comparison in log scale in Fig. S19.2). For this comparison the UHSAS volume was corrected for estimated RI that was estimated based on the AMS composition (the originally reported data were for an RI of 1.595). In this comparison, we only used data above 3 km altitude (to minimize the mass fraction of non-refractory sea salt aerosols) and the data in the absence of clouds indicated by the NCAR cloud droplet probe instrument (Droplet Measurement Technologies Inc.). Within the marine boundary layer, sea salt aerosols can be externally mixed and may not be fully dried before the detection by UHSAS or AMS, making the quantification and comparison more complex. One particular period below 3 km altitude when the G-V sampled a transported pollution plume (yellow shaded area in Fig. 15a bottom panel) over the Pacific Ocean was included in the intercomparison since the period was dominated by non-sea-salt aerosols.
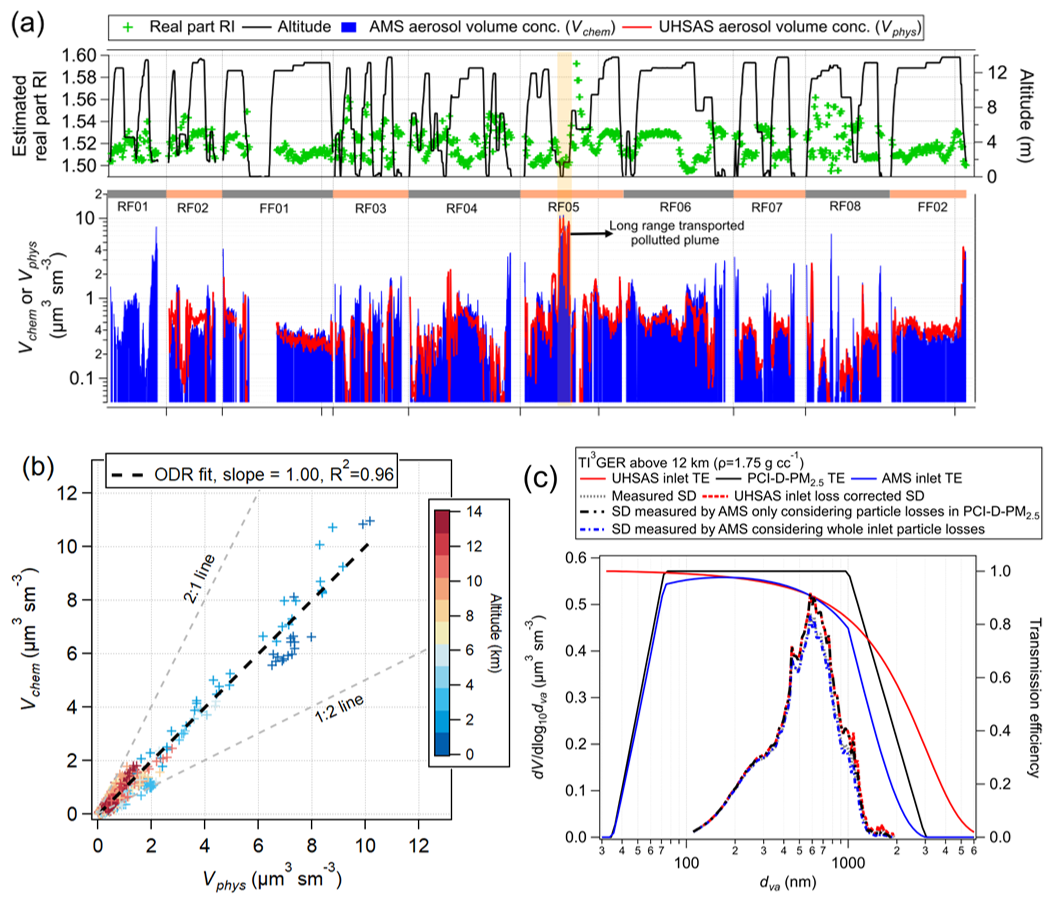
Figure 15(a) Time series of aerosol volume concentrations from the AMS (Vchem) and the UHSAS (Vphys), altitude, and the estimated real part refractive index of the ambient aerosol in 1 min resolution. (b) Scatter plot of AMS vs. UHSAS aerosol volume. The comparisons in log scale and altitude dependence are shown in Fig. S19.2. (c) Ambient aerosol size distribution measured by the UHSAS and the AMS detectable size distribution. The AMS sampling line loss calculation is shown in Fig. S18.1. Note that during the campaign, there were several minor issues with the PCI-D-PM2.5 inlet such as critical orifice clogging during RF01 and failure to maintain the set PPCI value during RF03 and RF04 in the marine boundary layer due to PCI pump limitation in 450/350 µm () configuration (Fig. S17.1). These issues do not affect the intercomparison between AMS and UHSAS in this section since UHSAS was not working properly during RF01, and the MBL during RF03 and RF04 was not included in the comparison. The PCI-D successfully maintained the set PPCI at higher altitudes including the highest altitude 13.8 km (Fig. S17.1).
Given the focus of the development in this paper, TI3GER LS data were analyzed separately. In Fig. 15c, the fraction of particles sampled by AMS was estimated in the LS where H2O O3 < 20 (Koenig et al., 2020). For the estimation, the measured distribution was corrected by the estimated particle losses in the UHSAS sampling line. The particle transmission of the AMS aircraft inlet was applied to the corrected distribution. With the correction, the AMS is expected to sample 99 % (sampling line loss not considered) and 89 % (sampling line loss considered) of the ambient accumulation-mode mass. If the PCI-C-PM1 inlet (PPCI = 122.6 mbar) were used during the TI3GER campaign, 63 % of the mass would have been sampled. Thus, the aircraft inlet for AMS during the TI3GER campaign is suitable for the quantitative sampling of accumulation-mode aerosols in the UTLS as well as other environments, where a larger accumulation mode is expected (i.e., urban haze events). At the same time, the inlet's capability of sampling Aitken-mode aerosols (e.g., particle formation and growth events) is not significantly compromised vs. the aircraft inlet during ATom campaigns (Fig. S11.3).
3.4.3 Particle transmission upstream of PCI during aircraft measurements
The airspeed into the tip of the secondary diffuser is controlled by the main flow rate, which is actively controlled based on altitude, with slower aspiration speeds used at higher altitudes to keep losses at the initial 90° bend at a minimum while roughly matching the airspeed inside the HIMIL, assuming a slowdown within the HIMIL of about 6. The airspeed inside the HIMIL can be estimated based on the measurements at the USAFA wind tunnel facility performed after the TI3GER campaign described in the Supplement (Sect. S20). Based on those measurements, the HIMIL slowed down the flow by a factor of ∼ 7.4, as a function of air speed (Fig. S20.6). The airspeed at the tip of the secondary diffuser was 90 %–120 % the extrapolated airspeed inside the HIMIL. This means that aerosol over-/undersampling at the secondary diffuser is unlikely. This also suggests that, in future campaigns, the flow through the secondary diffuser could be reduced to maximize ET while maintaining the near isokinetic sampling inside the HIMIL. To our knowledge, this provides the first experimental air slowdown measurements for the HIMIL inlet. However, the experimental conditions covered in the tunnel experiments only match those of flights on jet aircraft up to 5 km altitude or so (Fig. S20.3). This means that the extrapolation of the curve toward the faster external air speed (higher altitude) is more uncertain.
The particle transmission through the sampling line (ET) downstream of the HIMIL and upstream of the PCI-D that accounts for the diffusion and impaction losses is estimated based on the tubing dimensions and flow rate (Sect. S18) using the model described in Guo et al. (2021) and Bourgeois et al. (2022). The main loss of particles occurs in the 4.57 mm i.d. stainless tubing with a cumulative bending angle of 335° before the pickup tube (Fig. 2, Sect. 2.6 and Fig. S20.1), including the 90° bend at the secondary diffuser. At higher altitudes, the reduced pressure inside the sampling line enhances the impaction losses due to higher Stokes numbers. of the sampling line ranged 1.7–2.3 µm dva, depending on the altitude (up to 14 km altitude). of the whole aircraft inlet (including PCI-D-PM2.5) ranged within 1.3–1.5 µm dva.
In this work, we present (a) the development of diagnostic tools (lens scan and 2D-SR-BWP) for measuring the beam width and pointing of collimated aerosol beams, (b) the observation of position-dependent decomposition using the lens scan technique, (c) measurements of EL and diagnostics of beam focusing and pointing with different Aerodyne ADLs (PM1 lens, PM2.5 lens, and HPL) using 2D-SR-BWP and beam modeling, (d) the characterization of the newly developed PCI (CU PCI-D) and the aircraft inlet for quantitative aerosol sampling at high altitudes and its particle transmission efficiency tested in the laboratory, and (e) an analysis of the performance of the improved aircraft inlet and diagnostics tools during the TI3GER campaign. A characterization of the air flow inside the HIMIL inlet by wind tunnel experiments is also presented in the Supplement. We also present advances in test aerosol preparation. Modification and characterization of an evaporation-condensation system allowed the measurement of transmission efficiency of small particles (30–200 nm dva) without multiply charged particles. The modified 3D-printed nebulizer produced polydisperse NH4NO3 particles with a wide size range (40 nm to 4 µm dva) for 2D-SR-BWP analysis.
A lens scanning stage was developed for optimization of ADL lens alignment. The lens scan technique finds the center and perimeter of the vaporizer quickly and accurately with monodisperse aerosols. Lens scans also proved useful to measure narrow particle widths (< 0.25 mm) by analyzing the signal decay at the vaporizer edge. Lens scanning also provides a useful tool for the investigation of particle–vaporizer interactions. Both for NH4NO3 and oleic acid aerosol, a higher degree of thermal decomposition has been observed when the particle beam impacts near the center of the SV relative to the off-center position. These higher degrees of thermal decomposition are probably caused by the additional collisions of vaporized gases with the vaporizer surface due to the conical shape of SV. This effect may have contributed to the previously observed instrumental variability of f44 (Crenn et al., 2015; Fröhlich et al., 2015). Frequent calibrations are essential for monitoring and correcting for these variabilities (i.e., the ratio of ratio method for organic nitrate apportionment; Day et al., 2022). Due to its broader particle beam width, deployment of a PM2.5 lens can reduce the position-dependent decomposition effect but at the cost of a more complex alignment procedure due to the variability in beam focusing.
The 2D size-resolved BWP (2D-SR-BWP) method was developed using polydisperse aerosols (NH4NO3 in this study) in PToF mode along two orthogonal axes. This technique provides 2-dimensional information of particle beam position and width vs. dva. Beam widths measured by 2D-SR-BWP were consistent with BWP measurements with monodisperse particles, including small sizes that are hard to access with monodisperse measurements. This technique revealed that the particle beam focusing (width) and pointing (center position) can vary as a function of dva for all the ADLs tested. For all lenses, the beam width was wider for smaller particles (i.e., below 100 nm dva), leading to lower EL. The PM1 lens and HPL showed a monotonic decrease in beam width for increasing dva, as narrow as 0.05 mm or below. The PM2.5 lens exhibited beam widening around 400–600 nm dva. The particle beam position for the PM2.5 lens and HPL varied noticeably depending on dva, while the variability in beam position was minimal for the PM1 lens. The particle beam model based on 2D-SR-BWP measurements can estimate the particle losses by failing to impact the vaporizer due to beam broadening and/or off-centered beam pointing, as a function of dva. The particle transmission estimated from this method was consistent with measured transmission in the laboratory. The beam model also reasonably reproduced the particle deposition images.
EL values of the PM1 lens, PM2.5 lens, and HPL were measured and compared with literature values. The dva,50 range measured from the PM1 lens was 43–940 nm. The small particle transmission of the PM1 lens was very similar to previously reported values (Zhang et al., 2004a; Knote et al., 2011) and higher than the measurement by Liu et al. (2007). The measured EL of the PM2.5 lens was good for both small and large particle sampling (dva,50 range from 55–2700 nm). The measured in this study was 55 nm, 95 nm smaller than the from Xu et al. (2017). Given the dva,50 range measured in this work, the PM2.5 lens can be an excellent option for PM2.5 sampling without significantly compromising the sampling of Aitken-mode aerosols. However, due to the irregularity of beam focusing and pointing by the PM2.5 lens, careful optimization of lens alignment and frequent beam monitoring is are recommended to fully take advantage of their wide particle transmission range, especially so when combined with a CV. When diagnostic tools (e.g., BWP) are not available, regular checks on the EL of the PM2.5 lens can be beneficial. The dva,50 range of HPL in this work was 96 nm to > 2 µm, consistent with Williams et al. (2013). The HPL proved to be outstanding in sampling supermicron particles and submicron particles, with some compromise in Aitken-mode particle sampling. At a lower lens pressure than typical operation (thus lower lens flow and lower sensitivity), the PM2.5 lens and HPL showed lower . Operation at low lens pressure may be useful when nanoparticle sampling (i.e., new particle formation and growth events) is of interest.
A new design for the pressure-controlled inlet (PCI-D) was developed for quantitative sampling at high altitudes (up to 15–17 km) with minimal particle losses in the PCI. TE of PCI-C and PCI-D, coupled with the PM1 lens and PM2.5 lens, was measured in the laboratory. Since the of PCI-C-PM1 is limited by of the PM1 lens (rather than the PCI), deploying the PM2.5 lens increases the of the inlet. As expected, operating at lower PPCI (for operations at higher altitudes while maintaining the nominal PLens) led to higher particle losses (lower ), while was not significantly affected. The addition of the expansion volume (EV-Dup) downstream of COup and the modification of the expansion volume downstream of COdown (EV-Ddown) significantly improved TE while operating at low PPCI (below 250 mbar). Despite the improved TE of the PCI, of PCI-D-PM2.5 is still limited by the particle transmission of PCI-D. The PCI-D-PM2.5 lens (dva,50 range 60–1400 nm, PPCI = 122.6 mbar) is suitable for quantitative measurements of accumulation-mode aerosols in the UTLS. Compared to the previous inlet configuration used for CU-HR-AMS (PCI-C-PM1), the increase in operation altitude and were 5 km and 500–700 nm, respectively. The operation at 96 and 72 mbar enables the operation of PCI-D at even higher altitudes (up to 16 and 18 km, respectively) with similar transmission to the 122.6 mbar setup if the PCI pump is capable of maintaining the constant PPCI at lower altitudes. The residence time in the PCI-D is 0.2–0.5 s, which is ∼ 50 % of the PCI-C. The PCI-D-PM2.5 is expected to measure ∼ 90 % of the accumulation-mode aerosol mass in the lowermost stratosphere during the ATom campaign without compromising the flow through the ADL. The aircraft inlet system coupled with a PM2.5 lens is useful for better quantifying aircraft-based aerosol sampling in other environments with larger accumulation aerosol in general (e.g., urban haze event).
The aircraft inlet was tested during the TI3GER campaign, up to ∼ 13.8 km altitude over the northern Pacific Ocean. The in-field 2D-SR-BWP measurements and beam modeling provided the estimation of the particle losses due to the irregular beam focusing and pointing depending on dva, which was not significant except for RF01. The PCI-D maintained the constant pressure in the intermediate-pressure volume region (IPV) at the highest altitude. A good volume closure between AMS and UHSAS in the free troposphere and the lower stratosphere during the TI3GER campaign was observed. The particle transmission of the aircraft inlet was ultimately limited by the particle losses in the sampling line upstream of PCI-D-PM2.5. During the TI3GER campaign, the AMS aircraft inlet sampled 89 % of accumulation-mode aerosol mass in the UTLS, mostly limited by the sampling line, and not the PCI or ADL. The post-campaign measurements of air speed inside the HIMIL reveal that the air slow-down ratio is ∼ 7.4. For future deployments, the flow through the secondary diffuser can be reduced while maintaining near isokinetic sampling inside the HIMIL, ultimately reducing the particle losses in the sampling line upstream of PCI and improving the overall transmission of larger particles.
TI3GER AMS and UHSAS data can be found at https://doi.org/10.26023/QFEJ-E81T-DC0W (Kim et al., 2025) and https://doi.org/10.26023/CNDV-BZJ3-880X (NSF/NCAR GV Team, 2022), respectively. Data for all the figures in the paper (including Supplement) can be downloaded from https://cires1.colorado.edu/jimenez/group_pubs.html (last access: 22 November 2024).
The supplement related to this article is available online at https://doi.org/10.5194/ar-3-371-2025-supplement.
DK, PCJ, HG, and JLJ designed/conducted experiments and analyzed data on ADLs and PCIs. DY and SD ran/analyzed CFD and contributed to the design of PCI-D. DK, PCJ, RV, and JLJ designed and performed HIMIL wind tunnel testing. DK conducted particle beam simulations. DK, PCJ, HG, and DAD collected AMS data during the TI3GER campaign. DK and PCJ performed the TI3GER data reduction. MR collected UHSAS data. RV designed and led the TI3GER campaign. LW, JJ, and DW provided aerodynamic lenses and experimental data. LW and PC acquired particle disposition images. All authors contributed to the writing of the manuscript.
Leah Williams, Philip Croteau, John Jayne and Douglas Worsnop are employees of Aerodyne Research, manufacturer of the AMS and the ADLs used in this work.
Publisher's note: Copernicus Publications remains neutral with regard to jurisdictional claims made in the text, published maps, institutional affiliations, or any other geographical representation in this paper. While Copernicus Publications makes every effort to include appropriate place names, the final responsibility lies with the authors.
We thank Charles Brock for the loan of the LAS instrument and acknowledge him, Agnieszka Kupc, and Christina Williamson for providing the size distribution measurements for ATom. We thank Sarah Woods and Michael Reeves for collecting CDP data and Michael Reeves for collecting UHSAS data. TI3GER was supported by the National Center for Atmospheric Research, which is a major facility sponsored by the NSF under cooperative agreement no. 1852977. The data were collected using NSF's Lower Atmosphere Observing Facilities, which are managed and operated by NCAR's Earth Observing Laboratory. The GV aircraft was operated by the National Center for Atmospheric Research (NCAR) Earth Observing Laboratory's (EOL) Research Aviation Facility (RAF). Wind tunnel testing was conducted at the US Air Force Academy Aeronautics Research Center under Commercial Test Agreement 21-161-AFA-01. We thank Melissa Morris and Masayuki Takeuchi for manuscript review and useful discussions. We thank the machine shop at the University of Colorado Boulder Chemistry Department for manufacturing the custom-designed PCIs.
This research has been supported by the Division of Atmospheric and Geospace Sciences (grant no. AGS-2027252), the National Aeronautics and Space Administration (grant nos. 80NSSC18K0630, 80NSSC19K0124, 80NSSC21K1342, 80NSSC21K1451, and 80NSSC23K0828), the CIRES Graduate Student Research Award, and the AGU Jerome M. Paros Scholarship in Geophysical Instrumentation.
This paper was edited by Hilkka Timonen and reviewed by two anonymous referees.
Aiken, A. C., Decarlo, P. F., Kroll, J. H., Worsnop, D. R., Huffman, J. A., Docherty, K. S., Ulbrich, I. M., Mohr, C., Kimmel, J. R., Sueper, D., Sun, Y., Zhang, Q., Trimborn, A., Northway, M., Ziemann, P. J., Canagaratna, M. R., Onasch, T. B., Alfarra, M. R., Prevot, A. S. H., Dommen, J., Duplissy, J., Metzger, A., Baltensperger, U., and Jimenez, J. L.: O C and OM OC ratios of primary, secondary, and ambient organic aerosols with high-resolution time-of-flight aerosol mass spectrometry, Environ. Sci. Technol., 42, 4478–4485, https://doi.org/10.1021/es703009q, 2008.
Aldhaif, A. M., Stahl, C., Braun, R. A., Moghaddam, M. A., Shingler, T., Crosbie, E., Sawamura, P., Dadashazar, H., Ziemba, L., Jimenez, J. L., Campuzano-Jost, P., and Sorooshian, A.: Characterization of the real part of dry aerosol refractive index over north America from the surface to 12 km, J. Geophys. Res., 123, 8283–8300, https://doi.org/10.1029/2018jd028504, 2018.
Allan, J. D., Jimenez, J. L., Williams, P. I., Alfarra, M. R., Bower, K. N., Jayne, J. T., Coe, H., and Worsnop, D. R.: Quantitative sampling using an Aerodyne aerosol mass spectrometer 1. Techniques of data interpretation and error analysis, J. Geophys. Res., 108, 4090, https://doi.org/10.1029/2002jd002358, 2003a.
Allan, J. D., Alfarra, M. R., Bower, K. N., Williams, P. I., Gallagher, M. W., Jimenez, J. L., McDonald, A. G., Nemitz, E., Canagaratna, M. R., Jayne, J. T., Coe, H., and Worsnop, D. R.: Quantitative sampling using an Aerodyne aerosol mass spectrometer 2. Measurements of fine particulate chemical composition in two U.K. cities, J. Geophys. Res., 108, 4091, https://doi.org/10.1029/2002jd002359, 2003b.
Bahreini, R., Jimenez, J. L., Wang, J., Flagan, R. C., Seinfeld, J. H., Jayne, J. T., and Worsnop, D. R.: Aircraft-based aerosol size and composition measurements during ACE-Asia using an Aerodyne aerosol mass spectrometer, J. Geophys. Res., 108, 8645, https://doi.org/10.1029/2002jd003226, 2003.
Bahreini, R., Dunlea, E. J., Matthew, B. M., Simons, C., Docherty, K. S., DeCarlo, P. F., Jimenez, J. L., Brock, C. A., and Middlebrook, A. M.: Design and Operation of a Pressure-Controlled Inlet for Airborne Sampling with an Aerodynamic Aerosol Lens, Aerosol Sci. Tech., 42, 465–471, https://doi.org/10.1080/02786820802178514, 2008.
Ball, W. T., Chiodo, G., Abalos, M., Alsing, J., and Stenke, A.: Inconsistencies between chemistry–climate models and observed lower stratospheric ozone trends since 1998, Atmos. Chem. Phys., 20, 9737–9752, https://doi.org/10.5194/acp-20-9737-2020, 2020.
Bohren, C. F. and Huffman, D. R.: Absorption and scattering of light by small particles, edited by: Bohren, C. F. and Huffman, D. R., John Wiley & Sons, Nashville, TN, ISBN 9780471293408, https://doi.org/10.1002/9783527618156, 1998.
Bourgeois, I., Peischl, J., Neuman, J. A., Brown, S. S., Allen, H. M., Campuzano-Jost, P., Coggon, M. M., DiGangi, J. P., Diskin, G. S., Gilman, J. B., Gkatzelis, G. I., Guo, H., Halliday, H. A., Hanisco, T. F., Holmes, C. D., Huey, L. G., Jimenez, J. L., Lamplugh, A. D., Lee, Y. R., Lindaas, J., Moore, R. H., Nault, B. A., Nowak, J. B., Pagonis, D., Rickly, P. S., Robinson, M. A., Rollins, A. W., Selimovic, V., St. Clair, J. M., Tanner, D., Vasquez, K. T., Veres, P. R., Warneke, C., Wennberg, P. O., Washenfelder, R. A., Wiggins, E. B., Womack, C. C., Xu, L., Zarzana, K. J., and Ryerson, T. B.: Comparison of airborne measurements of NO, NO2, HONO, NOy, and CO during FIREX-AQ, Atmos. Meas. Tech., 15, 4901–4930, https://doi.org/10.5194/amt-15-4901-2022, 2022.
Brock, C. A., Cozic, J., Bahreini, R., Froyd, K. D., Middlebrook, A. M., McComiskey, A., Brioude, J., Cooper, O. R., Stohl, A., Aikin, K. C., de Gouw, J. A., Fahey, D. W., Ferrare, R. A., Gao, R.-S., Gore, W., Holloway, J. S., Hübler, G., Jefferson, A., Lack, D. A., Lance, S., Moore, R. H., Murphy, D. M., Nenes, A., Novelli, P. C., Nowak, J. B., Ogren, J. A., Peischl, J., Pierce, R. B., Pilewskie, P., Quinn, P. K., Ryerson, T. B., Schmidt, K. S., Schwarz, J. P., Sodemann, H., Spackman, J. R., Stark, H., Thomson, D. S., Thornberry, T., Veres, P., Watts, L. A., Warneke, C., and Wollny, A. G.: Characteristics, sources, and transport of aerosols measured in spring 2008 during the aerosol, radiation, and cloud processes affecting Arctic Climate (ARCPAC) Project, Atmos. Chem. Phys., 11, 2423–2453, https://doi.org/10.5194/acp-11-2423-2011, 2011.
Brock, C. A., Williamson, C., Kupc, A., Froyd, K. D., Erdesz, F., Wagner, N., Richardson, M., Schwarz, J. P., Gao, R.-S., Katich, J. M., Campuzano-Jost, P., Nault, B. A., Schroder, J. C., Jimenez, J. L., Weinzierl, B., Dollner, M., Bui, T., and Murphy, D. M.: Aerosol size distributions during the Atmospheric Tomography Mission (ATom): methods, uncertainties, and data products, Atmos. Meas. Tech., 12, 3081–3099, https://doi.org/10.5194/amt-12-3081-2019, 2019.
Brock, C. A., Froyd, K. D., Dollner, M., Williamson, C. J., Schill, G., Murphy, D. M., Wagner, N. J., Kupc, A., Jimenez, J. L., Campuzano-Jost, P., Nault, B. A., Schroder, J. C., Day, D. A., Price, D. J., Weinzierl, B., Schwarz, J. P., Katich, J. M., Wang, S., Zeng, L., Weber, R., Dibb, J., Scheuer, E., Diskin, G. S., DiGangi, J. P., Bui, T., Dean-Day, J. M., Thompson, C. R., Peischl, J., Ryerson, T. B., Bourgeois, I., Daube, B. C., Commane, R., and Wofsy, S. C.: Ambient aerosol properties in the remote atmosphere from global-scale in situ measurements, Atmos. Chem. Phys., 21, 15023–15063, https://doi.org/10.5194/acp-21-15023-2021, 2021.
Canagaratna, M. R., Jayne, J. T., Jimenez, J. L., Allan, J. D., Alfarra, M. R., Zhang, Q., Onasch, T. B., Drewnick, F., Coe, H., Middlebrook, A., Delia, A., Williams, L. R., Trimborn, A. M., Northway, M. J., DeCarlo, P. F., Kolb, C. E., Davidovits, P., and Worsnop, D. R.: Chemical and microphysical characterization of ambient aerosols with the aerodyne aerosol mass spectrometer, Mass Spectrom. Rev., 26, 185–222, https://doi.org/10.1002/mas.20115, 2007.
Canagaratna, M. R., Jimenez, J. L., Kroll, J. H., Chen, Q., Kessler, S. H., Massoli, P., Hildebrandt Ruiz, L., Fortner, E., Williams, L. R., Wilson, K. R., Surratt, J. D., Donahue, N. M., Jayne, J. T., and Worsnop, D. R.: Elemental ratio measurements of organic compounds using aerosol mass spectrometry: characterization, improved calibration, and implications, Atmos. Chem. Phys., 15, 253–272, https://doi.org/10.5194/acp-15-253-2015, 2015.
Chen, S.-C., Tsai, C.-J., Wu, C.-H., Pui, D. Y. H., Onischuk, A. A., and Karasev, V. V.: Particle loss in a critical orifice, J. Aerosol Sci., 38, 935–949, https://doi.org/10.1016/j.jaerosci.2007.06.010, 2007.
Chen, Y., Xu, L., Humphry, T., Hettiyadura, A. P. S., Ovadnevaite, J., Huang, S., Poulain, L., Schroder, J. C., Campuzano-Jost, P., Jimenez, J. L., Herrmann, H., O'Dowd, C., Stone, E. A., and Ng, N. L.: Response of the Aerodyne Aerosol Mass Spectrometer to Inorganic Sulfates and Organosulfur Compounds: Applications in Field and Laboratory Measurements, Environ. Sci. Technol., 53, 5176–5186, https://doi.org/10.1021/acs.est.9b00884, 2019.
Clemen, H.-C., Schneider, J., Klimach, T., Helleis, F., Köllner, F., Hünig, A., Rubach, F., Mertes, S., Wex, H., Stratmann, F., Welti, A., Kohl, R., Frank, F., and Borrmann, S.: Optimizing the detection, ablation, and ion extraction efficiency of a single-particle laser ablation mass spectrometer for application in environments with low aerosol particle concentrations, Atmos. Meas. Tech., 13, 5923–5953, https://doi.org/10.5194/amt-13-5923-2020, 2020.
Crenn, V., Sciare, J., Croteau, P. L., Verlhac, S., Fröhlich, R., Belis, C. A., Aas, W., Äijälä, M., Alastuey, A., Artiñano, B., Baisnée, D., Bonnaire, N., Bressi, M., Canagaratna, M., Canonaco, F., Carbone, C., Cavalli, F., Coz, E., Cubison, M. J., Esser-Gietl, J. K., Green, D. C., Gros, V., Heikkinen, L., Herrmann, H., Lunder, C., Minguillón, M. C., Močnik, G., O'Dowd, C. D., Ovadnevaite, J., Petit, J.-E., Petralia, E., Poulain, L., Priestman, M., Riffault, V., Ripoll, A., Sarda-Estève, R., Slowik, J. G., Setyan, A., Wiedensohler, A., Baltensperger, U., Prévôt, A. S. H., Jayne, J. T., and Favez, O.: ACTRIS ACSM intercomparison – Part 1: Reproducibility of concentration and fragment results from 13 individual Quadrupole Aerosol Chemical Speciation Monitors (Q-ACSM) and consistency with co-located instruments, Atmos. Meas. Tech., 8, 5063–5087, https://doi.org/10.5194/amt-8-5063-2015, 2015.
Cross, E. S., Slowik, J. G., Davidovits, P., Allan, J. D., Worsnop, D. R., Jayne, J. T., Lewis, D. K., Canagaratna, M., and Onasch, T. B.: Laboratory and Ambient Particle Density Determinations using Light Scattering in Conjunction with Aerosol Mass Spectrometry, Aerosol Sci. Tech., 41, 343–359, https://doi.org/10.1080/02786820701199736, 2007.
Crutzen, P. J.: Albedo Enhancement by Stratospheric Sulfur Injections: A Contribution to Resolve a Policy Dilemma?, Clim. Change, 77, 211–220, https://doi.org/10.1007/s10584-006-9101-y, 2006.
Day, D. A., Campuzano-Jost, P., Nault, B. A., Palm, B. B., Hu, W., Guo, H., Wooldridge, P. J., Cohen, R. C., Docherty, K. S., Huffman, J. A., de Sá, S. S., Martin, S. T., and Jimenez, J. L.: A systematic re-evaluation of methods for quantification of bulk particle-phase organic nitrates using real-time aerosol mass spectrometry, Atmos. Meas. Tech., 15, 459–483, https://doi.org/10.5194/amt-15-459-2022, 2022.
DeCarlo, P.: IE (and RIE) Calibration with the ToF-AMS, Jose Jimenez group, https://cires1.colorado.edu/jimenez-group//UsrMtgs/EUCAARIClinic2010/PSI-IECalibration.pdf (last access: 22 November 2024), 2009.
DeCarlo, P. F., Slowik, J. G., Worsnop, D. R., Davidovits, P., and Jimenez, J. L.: Particle Morphology and Density Characterization by Combined Mobility and Aerodynamic Diameter Measurements. Part 1: Theory, Aerosol Sci. Tech., 38, 1185–1205, https://doi.org/10.1080/027868290903907, 2004.
DeCarlo, P. F., Kimmel, J. R., Trimborn, A., Northway, M. J., Jayne, J. T., Aiken, A. C., Gonin, M., Fuhrer, K., Horvath, T., Docherty, K. S., Worsnop, D. R., and Jimenez, J. L.: Field-deployable, high-resolution, time-of-flight aerosol mass spectrometer, Anal. Chem., 78, 8281–8289, https://doi.org/10.1021/ac061249n, 2006.
Docherty, K. S., Jaoui, M., Corse, E., Jimenez, J. L., Offenberg, J. H., Lewandowski, M., and Kleindienst, T. E.: Collection Efficiency of the Aerosol Mass Spectrometer for Chamber-Generated Secondary Organic Aerosols, Aerosol Sci. Tech., 47, 294–309, https://doi.org/10.1080/02786826.2012.752572, 2013.
Drewnick, F., Hings, S. S., DeCarlo, P., Jayne, J. T., Gonin, M., Fuhrer, K., Weimer, S., Jimenez, J. L., Demerjian, K. L., Borrmann, S., and Worsnop, D. R.: A New Time-of-Flight Aerosol Mass Spectrometer (TOF-AMS) – Instrument Description and First Field Deployment, Aerosol Sci. Tech., 39, 637–658, https://doi.org/10.1080/02786820500182040, 2005.
Drewnick, F., Diesch, J.-M., Faber, P., and Borrmann, S.: Aerosol mass spectrometry: particle–vaporizer interactions and their consequences for the measurements, Atmos. Meas. Tech., 8, 3811–3830, https://doi.org/10.5194/amt-8-3811-2015, 2015.
Elser, M., Huang, R.-J., Wolf, R., Slowik, J. G., Wang, Q., Canonaco, F., Li, G., Bozzetti, C., Daellenbach, K. R., Huang, Y., Zhang, R., Li, Z., Cao, J., Baltensperger, U., El-Haddad, I., and Prévôt, A. S. H.: New insights into PM2.5 chemical composition and sources in two major cities in China during extreme haze events using aerosol mass spectrometry, Atmos. Chem. Phys., 16, 3207–3225, https://doi.org/10.5194/acp-16-3207-2016, 2016.
Fahey, D. W., Kawa, S. R., Woodbridge, E. L., Tin, P., Wilson, J. C., Jonsson, H. H., Dye, J. E., Baumgardner, D., Borrmann, S., Toohey, D. W., Avallone, L. M., Proffitt, M. H., Margitan, J., Loewenstein, M., Podolske, J. R., Salawitch, R. J., Wofsy, S. C., Ko, M. K. W., Anderson, D. E., Schoeber, M. R., and Chan, K. R.: In situ measurements constraining the role of sulphate aerosols in mid-latitude ozone depletion, Nature, 363, 509–514, https://doi.org/10.1038/363509a0, 1993.
Farmer, D. K., Matsunaga, A., Docherty, K. S., Surratt, J. D., Seinfeld, J. H., Ziemann, P. J., and Jimenez, J. L.: Response of an aerosol mass spectrometer to organonitrates and organosulfates and implications for atmospheric chemistry, P. Natl. Acad. Sci. USA, 107, 6670–6675, https://doi.org/10.1073/pnas.0912340107, 2010.
Fröhlich, R., Crenn, V., Setyan, A., Belis, C. A., Canonaco, F., Favez, O., Riffault, V., Slowik, J. G., Aas, W., Aijälä, M., Alastuey, A., Artiñano, B., Bonnaire, N., Bozzetti, C., Bressi, M., Carbone, C., Coz, E., Croteau, P. L., Cubison, M. J., Esser-Gietl, J. K., Green, D. C., Gros, V., Heikkinen, L., Herrmann, H., Jayne, J. T., Lunder, C. R., Minguillón, M. C., Močnik, G., O'Dowd, C. D., Ovadnevaite, J., Petralia, E., Poulain, L., Priestman, M., Ripoll, A., Sarda-Estève, R., Wiedensohler, A., Baltensperger, U., Sciare, J., and Prévôt, A. S. H.: ACTRIS ACSM intercomparison – Part 2: Intercomparison of ME-2 organic source apportionment results from 15 individual, co-located aerosol mass spectrometers, Atmos. Meas. Tech., 8, 2555–2576, https://doi.org/10.5194/amt-8-2555-2015, 2015.
Fry, J. L., Draper, D. C., Zarzana, K. J., Campuzano-Jost, P., Day, D. A., Jimenez, J. L., Brown, S. S., Cohen, R. C., Kaser, L., Hansel, A., Cappellin, L., Karl, T., Hodzic Roux, A., Turnipseed, A., Cantrell, C., Lefer, B. L., and Grossberg, N.: Observations of gas- and aerosol-phase organic nitrates at BEACHON-RoMBAS 2011, Atmos. Chem. Phys., 13, 8585–8605, https://doi.org/10.5194/acp-13-8585-2013, 2013.
Guo, H., Campuzano-Jost, P., Nault, B. A., Day, D. A., Schroder, J. C., Kim, D., Dibb, J. E., Dollner, M., Weinzierl, B., and Jimenez, J. L.: The importance of size ranges in aerosol instrument intercomparisons: a case study for the Atmospheric Tomography Mission, Atmos. Meas. Tech., 14, 3631–3655, https://doi.org/10.5194/amt-14-3631-2021, 2021.
Hodzic, A., Campuzano-Jost, P., Bian, H., Chin, M., Colarco, P. R., Day, D. A., Froyd, K. D., Heinold, B., Jo, D. S., Katich, J. M., Kodros, J. K., Nault, B. A., Pierce, J. R., Ray, E., Schacht, J., Schill, G. P., Schroder, J. C., Schwarz, J. P., Sueper, D. T., Tegen, I., Tilmes, S., Tsigaridis, K., Yu, P., and Jimenez, J. L.: Characterization of organic aerosol across the global remote troposphere: a comparison of ATom measurements and global chemistry models, Atmos. Chem. Phys., 20, 4607–4635, https://doi.org/10.5194/acp-20-4607-2020, 2020.
Hu, W., Campuzano-Jost, P., Day, D. A., Croteau, P., Canagaratna, M. R., Jayne, J. T., Worsnop, D. R., and Jimenez, J. L.: Evaluation of the new capture vaporizer for aerosol mass spectrometers (AMS) through field studies of inorganic species, Aerosol Sci. Tech., 51, 735–754, https://doi.org/10.1080/02786826.2017.1296104, 2017a.
Hu, W., Campuzano-Jost, P., Day, D. A., Croteau, P., Canagaratna, M. R., Jayne, J. T., Worsnop, D. R., and Jimenez, J. L.: Evaluation of the new capture vapourizer for aerosol mass spectrometers (AMS) through laboratory studies of inorganic species, Atmos. Meas. Tech., 10, 2897–2921, https://doi.org/10.5194/amt-10-2897-2017, 2017b.
Hu, W., Day, D. A., Campuzano-Jost, P., Nault, B. A., Park, T., Lee, T., Croteau, P., Canagaratna, M. R., Jayne, J. T., Worsnop, D. R., and Jimenez, J. L.: Evaluation of the new capture vaporizer for aerosol mass spectrometers: Characterization of organic aerosol mass spectra, Aerosol Sci. Tech., 52, 725–739, https://doi.org/10.1080/02786826.2018.1454584, 2018.
Huffman, J. A., Jayne, J. T., Drewnick, F., Aiken, A. C., Onasch, T., Worsnop, D. R., and Jimenez, J. L.: Design, Modeling, Optimization, and Experimental Tests of a Particle Beam Width Probe for the Aerodyne Aerosol Mass Spectrometer, Aerosol Sci. Tech., 39, 1143–1163, https://doi.org/10.1080/02786820500423782, 2005.
Hünig, A., Appel, O., Dragoneas, A., Molleker, S., Clemen, H.-C., Helleis, F., Klimach, T., Köllner, F., Böttger, T., Drewnick, F., Schneider, J., and Borrmann, S.: Design, characterization, and first field deployment of a novel aircraft-based aerosol mass spectrometer combining the laser ablation and flash vaporization techniques, Atmos. Meas. Tech., 15, 2889–2921, https://doi.org/10.5194/amt-15-2889-2022, 2022.
Hwang, T.-H., Kim, S.-H., Kim, S. H., and Lee, D.: Reducing particle loss in a critical orifice and an aerodynamic lens for focusing aerosol particles in a wide size range of 30 nm–10 µm, J. Mech. Sci. Technol., 29, 317–323, https://doi.org/10.1007/s12206-014-1238-4, 2015.
IPCC: Climate Change 2013 – The Physical Science Basis: Working Group I Contribution to the Fifth Assessment Report of the Intergovernmental Panel on Climate Change, Cambridge University Press, ISBN 9781107415324, https://doi.org/10.1017/CBO9781107415324, 2014.
Jacquot, J. L., Shen, X., Abou-Ghanem, M., Froyd, K. D., Lawler, M., Schill, G. P., Slovacek, K., Thomson, D. S., Cziczo, D. J., and Murphy, D. M.: A new airborne single particle mass spectrometer: PALMS-NG, Aerosol Sci. Tech., 58, 991–1007, https://doi.org/10.1080/02786826.2024.2331549, 2024.
Jayne, J. T., Leard, D. C., Zhang, X., Davidovits, P., Smith, K. A., Kolb, C. E., and Worsnop, D. R.: Development of an Aerosol Mass Spectrometer for Size and Composition Analysis of Submicron Particles, Aerosol Sci. Tech., 33, 49–70, https://doi.org/10.1080/027868200410840, 2000.
Jimenez Group GitLab: https://gitlab.com/JimenezGroup/jg-utilities/ (last access: 15 December 2024), 2024.
Jimenez, J. L., Jayne, J. T., Shi, Q., and Kolb, C. E.: Ambient aerosol sampling using the aerodyne aerosol mass spectrometer, J. Geophys. Res.-Atmos., 108, SOS 5-1–SOS 3-11, https://doi.org/10.1029/2001JD001213, 2003.
Joo, T., Chen, Y., Xu, W., Croteau, P., Canagaratna, M. R., Gao, D., Guo, H., Saavedra, G., Kim, S. S., Sun, Y., Weber, R., Jayne, J., and Ng, N. L.: Evaluation of a New Aerosol Chemical Speciation Monitor (ACSM) System at an Urban Site in Atlanta, GA: The Use of Capture Vaporizer and PM2.5 Inlet, ACS Earth Space Chem., 5, 2565–2576, https://doi.org/10.1021/acsearthspacechem.1c00173, 2021.
Keith, D. W., Weisenstein, D. K., Dykema, J. A., and Keutsch, F. N.: Stratospheric solar geoengineering without ozone loss, P. Natl. Acad. Sci. USA, 113, 14910–14914, https://doi.org/10.1073/pnas.1615572113, 2016.
Kenagy, H. S., Romer Present, P. S., Wooldridge, P. J., Nault, B. A., Campuzano-Jost, P., Day, D. A., Jimenez, J. L., Zare, A., Pye, H. O. T., Yu, J., Song, C. H., Blake, D. R., Woo, J.-H., Kim, Y., and Cohen, R. C.: Contribution of organic nitrates to organic aerosol over South Korea during KORUS-AQ, Environ. Sci. Technol., 55, 16326–16338, https://doi.org/10.1021/acs.est.1c05521, 2021.
Kim, D., Guo, H., Campuzano-Jost, P., and Jimenez, J. L.: TI3GER: AMS-60s (Aerosol Mass Spectrometer) 1 Minute Data, Version 2.0, UCAR/NCAR – Earth Observing Laboratory [data set], https://doi.org/10.26023/QFEJ-E81T-DC0W, 2025.
Kimmel, J.: Overview: Event Trigger and ePTOF, Jose Jimenez group, https://cires1.colorado.edu/jimenez-group/UsrMtgs/UsersMtg17/Kimmel_2016_AMSUsersMtg%5b5263%5d.pdf (last access: 22 November 2024), 2016.
Knote, C., Brunner, D., Vogel, H., Allan, J., Asmi, A., Äijälä, M., Carbone, S., van der Gon, H. D., Jimenez, J. L., Kiendler-Scharr, A., Mohr, C., Poulain, L., Prévôt, A. S. H., Swietlicki, E., and Vogel, B.: Towards an online-coupled chemistry-climate model: evaluation of trace gases and aerosols in COSMO-ART, Geosci. Model Dev., 4, 1077–1102, https://doi.org/10.5194/gmd-4-1077-2011, 2011.
Koenig, T. K., Baidar, S., Campuzano-Jost, P., Cuevas, C. A., Dix, B., Fernandez, R. P., Guo, H., Hall, S. R., Kinnison, D., Nault, B. A., Ullmann, K., Jimenez, J. L., Saiz-Lopez, A., and Volkamer, R.: Quantitative detection of iodine in the stratosphere, P. Natl. Acad. Sci. USA, 117, 1860–1866, https://doi.org/10.1073/pnas.1916828117, 2020.
Kupc, A., Williamson, C., Wagner, N. L., Richardson, M., and Brock, C. A.: Modification, calibration, and performance of the Ultra-High Sensitivity Aerosol Spectrometer for particle size distribution and volatility measurements during the Atmospheric Tomography Mission (ATom) airborne campaign, Atmos. Meas. Tech., 11, 369–383, https://doi.org/10.5194/amt-11-369-2018, 2018.
Kuwata, M., Zorn, S. R., and Martin, S. T.: Using elemental ratios to predict the density of organic material composed of carbon, hydrogen, and oxygen, Environ. Sci. Technol., 46, 787–794, https://doi.org/10.1021/es202525q, 2012.
Li, Z., Xu, W., Zhou, W., Lei, L., Sun, J., You, B., Wang, Z., and Sun, Y.: Insights into the compositional differences of PM1 and PM2.5 from aerosol mass spectrometer measurements in Beijing, China, Atmos. Environ., 301, 119709, https://doi.org/10.1016/j.atmosenv.2023.119709, 2023.
Liu, P., Ziemann, P. J., Kittelson, D. B., and McMurry, P. H.: Generating Particle Beams of Controlled Dimensions and Divergence: II. Experimental Evaluation of Particle Motion in Aerodynamic Lenses and Nozzle Expansions, Aerosol Sci. Tech., 22, 314–324, https://doi.org/10.1080/02786829408959749, 1995a.
Liu, P., Ziemann, P. J., Kittelson, D. B., and McMurry, P. H.: Generating Particle Beams of Controlled Dimensions and Divergence: I. Theory of Particle Motion in Aerodynamic Lenses and Nozzle Expansions, Aerosol Sci. Tech., 22, 293–313, https://doi.org/10.1080/02786829408959748, 1995b.
Liu, P. S. K., Deng, R., Smith, K. A., Williams, L. R., Jayne, J. T., Canagaratna, M. R., Moore, K., Onasch, T. B., Worsnop, D. R., and Deshler, T.: Transmission Efficiency of an Aerodynamic Focusing Lens System: Comparison of Model Calculations and Laboratory Measurements for the Aerodyne Aerosol Mass Spectrometer, Aerosol Sci. Tech., 41, 721–733, https://doi.org/10.1080/02786820701422278, 2007.
Liu, X., Henzing, B., Hensen, A., Mulder, J., Yao, P., van Dinther, D., van Bronckhorst, J., Huang, R., and Dusek, U.: Measurement report: Evaluation of the TOF-ACSM-CV for PM1.0 and PM2.5 measurements during the RITA-2021 field campaign, Atmos. Chem. Phys., 24, 3405–3420, https://doi.org/10.5194/acp-24-3405-2024, 2024.
Matthew, B. M., Middlebrook, A. M., and Onasch, T. B.: Collection Efficiencies in an Aerodyne Aerosol Mass Spectrometer as a Function of Particle Phase for Laboratory Generated Aerosols, Aerosol Sci. Tech., 42, 884–898, https://doi.org/10.1080/02786820802356797, 2008.
Middlebrook, A. M., Bahreini, R., Jimenez, J. L., and Canagaratna, M. R.: Evaluation of Composition-Dependent Collection Efficiencies for the Aerodyne Aerosol Mass Spectrometer using Field Data, Aerosol Sci. Tech., 46, 258–271, https://doi.org/10.1080/02786826.2011.620041, 2012.
Molleker, S., Helleis, F., Klimach, T., Appel, O., Clemen, H.-C., Dragoneas, A., Gurk, C., Hünig, A., Köllner, F., Rubach, F., Schulz, C., Schneider, J., and Borrmann, S.: Application of an O-ring pinch device as a constant-pressure inlet (CPI) for airborne sampling, Atmos. Meas. Tech., 13, 3651–3660, https://doi.org/10.5194/amt-13-3651-2020, 2020.
Moore, R. H., Wiggins, E. B., Ahern, A. T., Zimmerman, S., Montgomery, L., Campuzano Jost, P., Robinson, C. E., Ziemba, L. D., Winstead, E. L., Anderson, B. E., Brock, C. A., Brown, M. D., Chen, G., Crosbie, E. C., Guo, H., Jimenez, J. L., Jordan, C. E., Lyu, M., Nault, B. A., Rothfuss, N. E., Sanchez, K. J., Schueneman, M., Shingler, T. J., Shook, M. A., Thornhill, K. L., Wagner, N. L., and Wang, J.: Sizing response of the Ultra-High Sensitivity Aerosol Spectrometer (UHSAS) and Laser Aerosol Spectrometer (LAS) to changes in submicron aerosol composition and refractive index, Atmos. Meas. Tech., 14, 4517–4542, https://doi.org/10.5194/amt-14-4517-2021, 2021.
Müller, M., Eichler, P., D'Anna, B., Tan, W., and Wisthaler, A.: Direct Sampling and Analysis of Atmospheric Particulate Organic Matter by Proton-Transfer-Reaction Mass Spectrometry, Anal. Chem., 89, 10889–10897, https://doi.org/10.1021/acs.analchem.7b02582, 2017.
Murphy, D. M.: The design of single particle laser mass spectrometers, Mass Spectrom. Rev., 26, 150–165, https://doi.org/10.1002/mas.20113, 2007.
Murphy, D. M., Thomson, D. S., and Mahoney, M. J.: In situ measurements of organics, meteoritic material, mercury, and other elements in aerosols at 5 to 19 kilometers, Science, 282, 1664–1669, https://doi.org/10.1126/science.282.5394.1664, 1998.
Murphy, D. M., Cziczo, D. J., Froyd, K. D., Hudson, P. K., Matthew, B. M., Middlebrook, A. M., Peltier, R. E., Sullivan, A., Thomson, D. S., and Weber, R. J.: Single-particle mass spectrometry of tropospheric aerosol particles, J. Geophys. Res., 111, D23S32, https://doi.org/10.1029/2006jd007340, 2006.
Murphy, D. M., Abou-Ghanem, M., Cziczo, D. J., Froyd, K. D., Jacquot, J., Lawler, M. J., Maloney, C., Plane, J. M. C., Ross, M. N., Schill, G. P., and Shen, X.: Metals from spacecraft reentry in stratospheric aerosol particles, P. Natl. Acad. Sci. USA, 120(43), e2313374120, https://doi.org/10.1073/pnas.2313374120, 2023.
Nault, B. A., Campuzano-Jost, P., Day, D. A., Schroder, J. C., Anderson, B., Beyersdorf, A. J., Blake, D. R., Brune, W. H., Choi, Y., Corr, C. A., de Gouw, J. A., Dibb, J., DiGangi, J. P., Diskin, G. S., Fried, A., Huey, L. G., Kim, M. J., Knote, C. J., Lamb, K. D., Lee, T., Park, T., Pusede, S. E., Scheuer, E., Thornhill, K. L., Woo, J.-H., and Jimenez, J. L.: Secondary organic aerosol production from local emissions dominates the organic aerosol budget over Seoul, South Korea, during KORUS-AQ, Atmos. Chem. Phys., 18, 17769–17800, https://doi.org/10.5194/acp-18-17769-2018, 2018.
Nault, B. A., Canagaratna, M., Croteau, P., Fortner, E., Lambe, A. T., Stark, H., Sueper, D., Werden, B. S., Williams, A., Williams, L. R., Worsnop, D., Jayne, J., DeCarlo, P. F., Cubison, M., Papadopoulos, G., and Urs, R.: Characterization of a new higher-resolution time-of-flight aerosol chemical speciation monitor: Application for measurements of atmospheric aerosols, Aerosol Sci. Tech., 59, 719–742, https://doi.org/10.1080/02786826.2025.2481221, 2025.
Ng, N. L., Canagaratna, M. R., Jimenez, J. L., Chhabra, P. S., Seinfeld, J. H., and Worsnop, D. R.: Changes in organic aerosol composition with aging inferred from aerosol mass spectra, Atmos. Chem. Phys., 11, 6465–6474, https://doi.org/10.5194/acp-11-6465-2011, 2011.
NSF/NCAR GV Team: TI3GER: Low Rate (LRT – 1 sps) Navigation, State Parameter, and Microphysics Flight-Level Data – ICARTT Format, Version 1.0, UCAR/NCAR – Earth Observing Laboratory [data set], https://doi.org/10.26023/CNDV-BZJ3-880X, 2022.
Ovadnevaite, J., Ceburnis, D., Canagaratna, M., Berresheim, H., Bialek, J., Martucci, G., Worsnop, D. R., and O'Dowd, C.: On the effect of wind speed on submicron sea salt mass concentrations and source fluxes, J. Geophys. Res.-Atmos., 117, D16201, https://doi.org/10.1029/2011JD017379, 2012.
Park, K., Kittelson, D. B., Zachariah, M. R., and McMurry, P. H.: Measurement of Inherent Material Density of Nanoparticle Agglomerates, J. Nanopart. Res., 6, 267–272, https://doi.org/10.1023/B:NANO.0000034657.71309.e6, 2004.
Peck, J., Gonzalez, L. A., Williams, L. R., Xu, W., Croteau, P. L., Timko, M. T., Jayne, J. T., Worsnop, D. R., Miake-Lye, R. C., and Smith, K. A.: Development of an aerosol mass spectrometer lens system for PM2.5, Aerosol Sci. Tech., 50, 781–789, https://doi.org/10.1080/02786826.2016.1190444, 2016.
Piel, F., Müller, M., Mikoviny, T., Pusede, S. E., and Wisthaler, A.: Airborne measurements of particulate organic matter by proton-transfer-reaction mass spectrometry (PTR-MS): a pilot study, Atmos. Meas. Tech., 12, 5947–5958, https://doi.org/10.5194/amt-12-5947-2019, 2019.
Pratt, K. A., Mayer, J. E., Holecek, J. C., Moffet, R. C., Sanchez, R. O., Rebotier, T. P., Furutani, H., Gonin, M., Fuhrer, K., Su, Y., Guazzotti, S., and Prather, K. A.: Development and characterization of an aircraft aerosol time-of-flight mass spectrometer, Anal. Chem., 81, 1792–1800, https://doi.org/10.1021/ac801942r, 2009.
Robock, A., Marquardt, A., Kravitz, B., and Stenchikov, G.: Benefits, risks, and costs of stratospheric geoengineering, Geophys. Res. Lett., 36, L19703, https://doi.org/10.1029/2009GL039209, 2009.
Rösch, M. and Cziczo, D. J.: Aqueous particle generation with a 3D printed nebulizer, Atmos. Meas. Tech., 13, 6807–6812, https://doi.org/10.5194/amt-13-6807-2020, 2020.
Salcedo, D., Onasch, T. B., Dzepina, K., Canagaratna, M. R., Zhang, Q., Huffman, J. A., DeCarlo, P. F., Jayne, J. T., Mortimer, P., Worsnop, D. R., Kolb, C. E., Johnson, K. S., Zuberi, B., Marr, L. C., Volkamer, R., Molina, L. T., Molina, M. J., Cardenas, B., Bernabé, R. M., Márquez, C., Gaffney, J. S., Marley, N. A., Laskin, A., Shutthanandan, V., Xie, Y., Brune, W., Lesher, R., Shirley, T., and Jimenez, J. L.: Characterization of ambient aerosols in Mexico City during the MCMA-2003 campaign with Aerosol Mass Spectrometry: results from the CENICA Supersite, Atmos. Chem. Phys., 6, 925–946, https://doi.org/10.5194/acp-6-925-2006, 2006.
Salcedo, D., Onasch, T. B., Canagaratna, M. R., Dzepina, K., Huffman, J. A., Jayne, J. T., Worsnop, D. R., Kolb, C. E., Weimer, S., Drewnick, F., Allan, J. D., Delia, A. E., and Jimenez, J. L.: Technical Note: Use of a beam width probe in an Aerosol Mass Spectrometer to monitor particle collection efficiency in the field, Atmos. Chem. Phys., 7, 549–556, https://doi.org/10.5194/acp-7-549-2007, 2007.
Schmale, J., Schneider, J., Jurkat, T., Voigt, C., Kalesse, H., Rautenhaus, M., Lichtenstern, M., Schlager, H., Ancellet, G., Arnold, F., Gerding, M., Mattis, I., Wendisch, M., and Borrmann, S.: Aerosol layers from the 2008 eruptions of Mount Okmok and Mount Kasatochi: In situ upper troposphere and lower stratosphere measurements of sulfate and organics over Europe, J. Geophys. Res., 115, D00L07, https://doi.org/10.1029/2009jd013628, 2010.
Schroder, J. C., Campuzano-Jost, P., Day, D. A., Shah, V., Larson, K., Sommers, J. M., Sullivan, A. P., Campos, T., Reeves, J. M., Hills, A., Hornbrook, R. S., Blake, N. J., Scheuer, E., Guo, H., Fibiger, D. L., McDuffie, E. E., Hayes, P. L., Weber, R. J., Dibb, J. E., Apel, E. C., Jaeglé, L., Brown, S. S., Thornton, J. A., and Jimenez, J. L.: Sources and secondary production of organic aerosols in the northeastern United States during WINTER, J. Geophys. Res., 123, 7771–7796, https://doi.org/10.1029/2018jd028475, 2018.
Schueneman, M. K., Nault, B. A., Campuzano-Jost, P., Jo, D. S., Day, D. A., Schroder, J. C., Palm, B. B., Hodzic, A., Dibb, J. E., and Jimenez, J. L.: Aerosol pH indicator and organosulfate detectability from aerosol mass spectrometry measurements, Atmos. Meas. Tech., 14, 2237–2260, https://doi.org/10.5194/amt-14-2237-2021, 2021.
Seinfeld, J. H. and Pandis, S. N.: Atmospheric Chemistry and Physics: From Air Pollution to Climate Change, 3rd edn., Wiley, ISBN 978-1-118-94740-1, 2016.
Sokolik, I. N. and Toon, O. B.: Incorporation of mineralogical composition into models of the radiative properties of mineral aerosol from UV to IR wavelengths, J. Geophys. Res., 104, 9423–9444, https://doi.org/10.1029/1998jd200048, 1999.
Solomon, S., Stone, K., Yu, P., Murphy, D. M., Kinnison, D., Ravishankara, A. R., and Wang, P.: Chlorine activation and enhanced ozone depletion induced by wildfire aerosol, Nature, 615, 259–264, https://doi.org/10.1038/s41586-022-05683-0, 2023.
Song, S., Gao, M., Xu, W., Sun, Y., Worsnop, D. R., Jayne, J. T., Zhang, Y., Zhu, L., Li, M., Zhou, Z., Cheng, C., Lv, Y., Wang, Y., Peng, W., Xu, X., Lin, N., Wang, Y., Wang, S., Munger, J. W., Jacob, D. J., and McElroy, M. B.: Possible heterogeneous chemistry of hydroxymethanesulfonate (HMS) in northern China winter haze, Atmos. Chem. Phys., 19, 1357–1371, https://doi.org/10.5194/acp-19-1357-2019, 2019.
Stith, J. L., Ramanathan, V., Cooper, W. A., Roberts, G. C., DeMott, P. J., Carmichael, G., Hatch, C. D., Adhikary, B., Twohy, C. H., Rogers, D. C., Baumgardner, D., Prenni, A. J., Campos, T., Gao, R., Anderson, J., and Feng, Y.: An overview of aircraft observations from the Pacific Dust Experiment campaign, J. Geophys. Res., 114, D05207, https://doi.org/10.1029/2008jd010924, 2009.
Takeuchi, M., Wang, Y., Nault, B. A., Chen, Y., Canagaratna, M. R., and Ng, N. L.: Evaluating the response of the Aerodyne aerosol mass spectrometer to monoterpene- and isoprene-derived organic nitrate standards, Aerosol Sci. Tech., 58, 1371–1388, https://doi.org/10.1080/02786826.2024.2389183, 2024.
Vaden, T. D., Imre, D., Beranek, J., Shrivastava, M., and Zelenyuk, A.: Evaporation kinetics and phase of laboratory and ambient secondary organic aerosol, P. Natl. Acad. Sci. USA, 108, 2190–2195, https://doi.org/10.1073/pnas.1013391108, 2011.
Villamayor, J., Iglesias-Suarez, F., Cuevas, C. A., Fernandez, R. P., Li, Q., Abalos, M., Hossaini, R., Chipperfield, M. P., Kinnison, D. E., Tilmes, S., Lamarque, J.-F., and Saiz-Lopez, A.: Very short-lived halogens amplify ozone depletion trends in the tropical lower stratosphere, Nat. Clim. Chang., 13, 554–560, https://doi.org/10.1038/s41558-023-01671-y, 2023.
Wang, X. and McMurry, P. H.: A Design Tool for Aerodynamic Lens Systems, Aerosol Sci. Tech., 40, 320–334, https://doi.org/10.1080/02786820600615063, 2007.
Williams, L. R., Gonzalez, L. A., Peck, J., Trimborn, D., McInnis, J., Farrar, M. R., Moore, K. D., Jayne, J. T., Robinson, W. A., Lewis, D. K., Onasch, T. B., Canagaratna, M. R., Trimborn, A., Timko, M. T., Magoon, G., Deng, R., Tang, D., de la Rosa Blanco, E., Prévôt, A. S. H., Smith, K. A., and Worsnop, D. R.: Characterization of an aerodynamic lens for transmitting particles greater than 1 micrometer in diameter into the Aerodyne aerosol mass spectrometer, Atmos. Meas. Tech., 6, 3271–3280, https://doi.org/10.5194/amt-6-3271-2013, 2013.
Williamson, C. J., Kupc, A., Axisa, D., Bilsback, K. R., Bui, T., Campuzano-Jost, P., Dollner, M., Froyd, K. D., Hodshire, A. L., Jimenez, J. L., Kodros, J. K., Luo, G., Murphy, D. M., Nault, B. A., Ray, E. A., Weinzierl, B., Wilson, J. C., Yu, F., Yu, P., Pierce, J. R., and Brock, C. A.: A large source of cloud condensation nuclei from new particle formation in the tropics, Nature, 574, 399–403, https://doi.org/10.1038/s41586-019-1638-9, 2019.
Willis, M. D., Lee, A. K. Y., Onasch, T. B., Fortner, E. C., Williams, L. R., Lambe, A. T., Worsnop, D. R., and Abbatt, J. P. D.: Collection efficiency of the soot-particle aerosol mass spectrometer (SP-AMS) for internally mixed particulate black carbon, Atmos. Meas. Tech., 7, 4507–4516, https://doi.org/10.5194/amt-7-4507-2014, 2014.
Xu, W., Croteau, P., Williams, L., Canagaratna, M., Onasch, T., Cross, E., Zhang, X., Robinson, W., Worsnop, D., and Jayne, J.: Laboratory characterization of an aerosol chemical speciation monitor with PM2.5 measurement capability, Aerosol Sci. Tech., 51, 69–83, https://doi.org/10.1080/02786826.2016.1241859, 2017.
Yang, D., Assaf, E., Mauldin, R., Dhaniyala, S., and Volkamer, R.: Laminar gas inlet – Part 2: Wind tunnel chemical transmission measurement and modelling, EGUsphere [preprint], https://doi.org/10.5194/egusphere-2024-2390, 2024a.
Yang, D., Reza, M., Mauldin, R., Volkamer, R., and Dhaniyala, S.: Performance characterization of a laminar gas inlet, Atmos. Meas. Tech., 17, 1463–1474, https://doi.org/10.5194/amt-17-1463-2024, 2024b.
Zhang, Q., Stanier, C. O., Canagaratna, M. R., Jayne, J. T., Worsnop, D. R., Pandis, S. N., and Jimenez, J. L.: Insights into the chemistry of new particle formation and growth events in Pittsburgh based on aerosol mass spectrometry, Environ. Sci. Technol., 38, 4797–4809, https://doi.org/10.1021/es035417u, 2004a.
Zhang, X., Smith, K. A., Worsnop, D. R., Jimenez, J., Jayne, J. T., and Kolb, C. E.: A Numerical Characterization of Particle Beam Collimation by an Aerodynamic Lens-Nozzle System: Part I. An Individual Lens or Nozzle, Aerosol Sci. Tech., 36, 617–631, https://doi.org/10.1080/02786820252883856, 2002.
Zhang, X., Smith, K. A., Worsnop, D. R., Jimenez, J. L., Jayne, J. T., Kolb, C. E., Morris, J., and Davidovits, P.: Numerical Characterization of Particle Beam Collimation: Part II Integrated Aerodynamic-Lens–Nozzle System, Aerosol Sci. Tech., 38, 619–638, https://doi.org/10.1080/02786820490479833, 2004b.