the Creative Commons Attribution 4.0 License.
the Creative Commons Attribution 4.0 License.
 | 04 Jul 2025
Determination of aerosol composition by ED-XRF on Teflon and quartz substrates: potentialities and limits
Florin Unga
Giulia Calzolai
Massimo Chiari
Eleonora Cuccia
Cristina Colombi
Mariolina Franciosa
Adelaide Dinoi
Eva Merico
Noelia Gómez-Sánchez
Caterina Mapelli
Salvatore Pareti
Cinzia Perrino
Eduardo Yubero
Daniele Contini
Energy-dispersive X-ray fluorescence (ED-XRF) is a versatile non-destructive technique to evaluate elemental composition of atmospheric particulate matter (PM) without the need for sample preparation and with high potentiality in source apportionment studies. It is usually applied on Teflon or polycarbonate substrates; however, it would be preferable to use quartz substrates for the possibility to use the same substrate also for carbon detection. In this work an intercomparison among five laboratories on PM10 samples collected on Teflon and quartz filters was done with the specific purpose of understanding the performance of the ED-XRF technique applied to samples collected on quartz substrates. Limits of detection (LODs) on quartz substrates were significantly larger than those on Teflon for the majority of the elements with the exclusion of Cl, Mn, Cu, and Rb, which had comparable LODs for the two substrates. Repeatability on PM10 samples collected on quartz and Teflon substrates was comparable and, on average, better than 10 % for the majority of the elements analysed and better than 5 % for several elements. Comparisons of analysis on Teflon filters for 20 elements obtained by the different laboratories were in the range of ±15 % of the 1:1 line for most of the elements and laboratories. Comparison of measurements on samples collected on quartz and Teflon substrates showed that 17 elements were well correlated (R > 0.7) with average ratios in the range 0.6 ± 0.1 (for light elements, due to self-absorption effects) to 1.1 ± 0.1 for the majority of the cases. This suggested that reasonable results could be obtained on quartz substrates for 17 elements, including Na, Mg, and Al, using calibration on Teflon and the ratios as correction factors. However, these correction factors were dependent on the instrument and method used for the analysis.
- Article
(2122 KB) - Full-text XML
- BibTeX
- EndNote


Energy-dispersive X-ray fluorescence (ED-XRF) is a versatile technique to evaluate the elemental composition of atmospheric particulate matter (PM), which can be used with limited or negligible sample preparation (Calzolai et al., 2008; Canepari et al., 2009; Contini et al., 2016). Despite the limited sensitivity for trace elements compared to other techniques such as inductively coupled plasma mass spectrometry (ICP-MS), ED-XRF offers the advantage of being able to measure crustal elements such as Si and Al when suitable substrates are used, providing useful information for source apportionment to characterise soil sources as well as resuspended dust in urban and suburban areas (Wang et al., 1999; Cesari et al., 2021). Although potential losses of highly volatile species during the measurement process cannot be completely ruled out, ED-XRF is considered a non-destructive analytical technique with respect to the solid matrix of the sample. As such, the collected samples (e.g. filters) remain intact and can be subsequently used for additional chemical characterisations. This represents a significant advantage when multiple analytical techniques need to be applied to the same specimen or when both the soluble and insoluble fractions of particulate matter (PM) require detailed compositional analysis (Perrino et al., 2011).
Recent instrumental advances have enabled the possibility of high-temporal-resolution (∼ 1 h) multielement ED-XRF measurements, which have proven to be useful for identification of specific natural and anthropogenic sources including soil dust (Furger et al., 2020), especially when coupled with other instruments such as the Aerosol Chemical Speciation Monitor (ACSM), aethalometers, and total carbon analysers (Manousakas et al., 2022). Measurements of elemental composition at high temporal resolution have been successfully applied in source apportionment analyses using receptor models (Belis et al., 2019; Su et al., 2020).
Offline ED-XRF is typically used for particulate matter (PM) samples collected on Teflon (Ogrizek et al., 2022) or polycarbonate substrates (Spolnik et al., 2005; Arana et al., 2014). However, in several monitoring stations and observational platforms, PM samples are routinely collected on quartz filters, which allow the determination of organic and elemental carbon, also performing reasonably well for the determination of water-soluble ions via high-performance ion chromatography (HPIC), metals via ICP-MS or other destructive techniques, and oxidative potential (Guascito et al., 2023). Thereby, it would be useful to use ED-XRF for elemental analysis on quartz substrates. ED-XRF on quartz suffers from absorption effects due to the penetration of the particles into the fibres of quartz, mainly affecting low-energy X-rays, i.e. light elements (Chiari et al., 2018).
There are still relatively few studies focusing on ED-XRF performance and measurements on quartz substrates. Chiari et al. (2018) investigated the absorption on quartz substrates by using ED-XRF and particle-induced X-ray emission (PIXE) by comparing PM10 samples collected on Teflon and quartz substrates. The shown limits of detection (LODs) were significantly higher on quartz substrates, but good correlations between measurements on the two substrates suggest that average correction factors can be used for ED-XRF application on quartz substrates. However, the light elements (Na, Mg, Al, and Si) were not included in the analysis. Okuda et al. (2013) showed that the ED-XRF can be successfully applied to the determination of 12 elements (not including the light ones) on quartz filters. In Manousakas et al. (2013), 10 elements were determined on PM10 samples collected on both substrates with significant greater uncertainty on quartz substrates compared to Teflon. Yatkin et al. (2012) compared standardless ED-XRF analysis of 13 elements with ICP-MS analysis on Teflon and quartz filters and showed that, using appropriate correction factors, the results on quartz filters were also reasonable for Al. Similar conclusions were also obtained by Steinhoff et al. (2000) comparing ED-XRF analysis with atomic spectrometric methods such as graphite furnace atomic absorption spectroscopy (GF-AAS) and inductively coupled plasma optical emission spectroscopy (ICP-OES). Gupta et al. (2021) compared measurements of seven elements using power-adapted wavelength-dispersive (WD)-XRF with flame atomic absorption spectrometry (FAAS) on PM2.5 samples collected on quartz filters. Their results showed a good correlation for five elements (Al, Ca, Fe, K, and Na) and limited or negligible correlation for Ni and Zn.
To address the gaps in current research, the main objectives of this work were the following: (i) to investigate limits of detection and repeatability of ED-XRF measurements of different elements contained in daily PM10 samples collected on both substrates (Teflon and quartz); (ii) to intercompare the concentrations of elements measured by ED-XRF and PIXE by different laboratories on daily PM10 samples collected on Teflon filters; and (iii) to investigate the potentiality of ED-XRF to measure the concentration of 20 elements, including the light ones (i.e. Na, Mg, and Al), on quartz substrates, determining the correction factors necessary to adapt the calibration usually done for Teflon to quartz substrates.
2.1 Details of the instruments used
PM10 daily samples collected in various sites in Italy were analysed in the different laboratories involved in this work using their “home” instruments and protocols. Specifically, (i) ISAC-CNR (Lecce) used a Spectro (XEPOS05) ED-XRF instrument (Dinoi et al., 2024); (ii) ARPA Lombardia (Milan) used a Malvern Panalytical™ (Epsilon 4) ED-XRF spectrometer (Colombi et al., 2013); (iii) IIA-CNR (Rome) used a Spectro (XEPOS03) ED-XRF (Perrino et al., 2022a, b); (iv) UMH (Elche) used a Thermo Scientific™ (ARL™ QUANT'X) ED-XRF spectrometer (Galindo et al., 2018); and (v) INFN (Florence) used a dedicated external-beam set-up for PIXE analysis on aerosol samples, installed at the LABEC 3MV tandem accelerator (Calzolai et al., 2006).
Medium-concentration elemental thin-film standards from the Micromatter (i.e. usually defined as light standards with mass loads in the range 6–50 µg cm−2) were used for calibration at ISAC-CNR, ARPA Lombardia, and UMH using a single concentration point and linear calibration. ARPA Lombardia and UMH also used NIST2783 aerosol standard to routinely check instrumental performance. IIA-CNR calibrated on real samples by comparison with ICP-OES analysis (Astolfi et al., 2006; Canepari et al., 2009). Briefly, 20 Teflon filters loaded with atmospheric particles (about 55 m3 sampled volume, collected in different environmental conditions) were analysed by ED-XRF and then re-analysed by ICP-OES, performing direct dissolution of the samples by HF acid digestion in a microwave oven, applying the procedure described in Bettinelli et al. (2000). ICP-OES results on these ambient concentration samples were used for ED-XRF calibration, in addition to the original factory calibration values, which spanned over very high concentrations. In the course of time, the procedure was repeated by adding additional points in the calibration to reach 30 data points for each species (Astolfi et al., 2006; Canepari et al., 2009; Perrino et al., 2011). INFN uses a standardless approach (Calzolai et al., 2006), using the Micromatter thin elemental and the NIST2783 aerosol reference material as external standards for quality assurance and quality control checks.
The datasets described in Sect. 2.2 were analysed by the different laboratories using their typical “home protocols”, and the concentrations of the different elements on daily PM10 Teflon substrates were compared in ng cm−2 after blank subtraction. ISAC-CNR ED-XRF measurements were performed in four different phases (both in air and He atmospheres) for a total of 30 min, with spinning samples, using the manufacturer “filter” protocol built in the XRF Analyser Pro software. The samples were analysed without any preparation using specifically designed filter holders (Potì et al., 2025). ARPA Lombardia ED-XRF system used four different irradiation conditions, two in air and two in He conditions, for a total measurement time of 20 min with spinning samples without any specific preparation (Cadeo et al., 2025). IIA-CNR measurements were performed using four different targets in the He atmosphere for a total of 24 min, using an eight-position rotating sample plate; one of the positions was always occupied by a blank filter. The samples were analysed without any preparation. UMH system used five different measurement conditions with different filters and voltage of the tube for a total measurement time of 22.5 min. All the samples were analysed in vacuum (Chiari et al., 2018). The INFN protocol for PIXE measurements is fully described elsewhere (Lucarelli et al., 2014). Briefly, samples were bombarded with an extracted proton beam of 3.0 MeV energy on the target (about 3.2 MeV in vacuum), which is the optimum beam energy for the analysis of Teflon filters and is also adequate for quartz fibre filters (Calzolai et al., 2010), with a 40 nA current for 3 min and with 10 nA for 5 min, respectively, for Teflon and quartz. Using a scanning system, most of the area of the sample was analysed, to average over possible non-homogeneous deposits. PIXE spectra were analysed with the GUPIXWIN software (Campbell et al., 2010).
2.2 Sets of PM10 samples used in the work
Several datasets of daily PM10 collected at different sites on quartz and Teflon substrates (47 mm in diameter) using low-volume (i.e. 2.3 m3 h−1) samplers have been used in this work.
A set of 30 daily PM10 samples was collected by IIA-CNR in Rome in the research area of Montelibretti, a peri-urban site 25 km from Rome, in central Italy. Samplings were carried out in the period 3 January–5 February 2023, on 47 mm Teflon filters, 2 µm pore size (PALL Corporation, Port Washington, NY, USA), using a β-attenuation monitor operating at the flow rate of 2.3 m3 h−1 (SWAM5a, FAI Instruments, Fonte Nuova, Rome, Italy).
A set of 20 + 20 PM10 daily samples were simultaneously collected by IIA-CNR on Teflon (same as above) and quartz (Pallflex Tissuquartz, PALL Corporation, Port Washington, NY, USA) substrates in an urban background site in Ferrara (Italy) using a dual-channel β-attenuation monitor operating at the flow rate of 2.3 m3 h−1 (SWAM5a Dual Channel Monitor, FAI Instruments, Fonte Nuova, Rome, Italy).
A dataset of 9 PM10 daily samples was collected by ARPA Lombardia in Milan (north Italy) on Teflon filters, and a set of 52 PM10 daily samples was simultaneously collected in an urban background site in Turbigo (Italy), about 35 km west of the Milan city centre on Teflon (26 samples) and quartz (26 samples) substrates using a dual-channel low-volume (i.e. 2.3 m3 h−1) sampler (Gemini, Dado Lab srl).
A dataset of 16 PM10 samples was collected simultaneously on quartz (eight samples) and Teflon (eight samples) substrates by ISAC-CNR in Lecce (south Italy) at the urban background site of the Environmental Climate Observatory (ECO) using a dual-channel sampler at 2.3 m3 h−1 (SWAM, Fai Instruments srl) equipped with automatic detection of concentrations by means of the β-attenuation method (Conte et al., 2020).
2.3 Determination of LODs and repeatability
The limits of detection (LODs), for each element, on both Teflon and quartz filters, were evaluated as 3 times the standard deviation of element concentrations measured in at least six different field blanks for each substrate. For the elements not detectable on blanks, the LOD was evaluated as 3 times the minimum detectable level of the instruments.
Repeatability was determined by measuring of Micromatter standards (in the laboratories using them) and PM10 samples collected on Teflon and quartz substrates. The repeatability on samples was obtained performing at least six different measurements (also on different days) by removing and reinstalling the samples in the analyser after each measurement.
2.4 Intercomparison approach for Teflon and quartz substrates
The datasets described in Sect. 2.2 were analysed by the different laboratories using their typical “home protocol”, and the concentrations of the different elements on daily PM10 Teflon substrates were compared in ng cm−2 after blank subtraction. Concentrations for As, Se, Mo, Cd, Te, and I were almost always lower than the LODs, and these elements were excluded from the comparison. Ga and Ba were measurable in some samples but were included only in the ISAC-CNR protocol and were not further processed in this intercomparison. In total, 20 elements were considered in this comparison work: Na, Mg, Al, Si, P, S, Cl, K, Ca, Ti, Cr, Mn, Fe, Ni, Cu, Zn, Br, Rb, Sr, and Pb.
Daily PM10 samples collected simultaneously on Teflon and quartz substrates were analysed, with blank subtraction, by the different laboratories to estimate the correlations between measurements on the two substrates and the ratios of concentrations. This was done for all elements but Si, which was obviously not measurable on quartz filters. The aim was to determine correction coefficients to be used for determination of element concentration in quartz samples starting from the calibration of ED-XRF carried out on Teflon substrates. When concentrations on quartz substrates need to be determined, the normal protocol used for Teflon substrates can be applied and the average ratios used to correct measured concentrations after blank subtraction. This is possible for elements that are linearly correlated when detected on the two substrates, provided that the ratios can be determined with reasonably small standard errors. The latter can be used because the final analytical uncertainty for measurements on quartz substrates will be the quadratic sum (assuming random independent errors) of the uncertainty resulting from the correction coefficients and that coming from the calibration on Teflon substrates.
3.1 LODs for different substrates
The values of the LODs on both substrates averaged over the data from the different laboratories are shown in Fig. 1 together with their standard errors. It was observed that the LODs of light elements were larger than those of heavy elements (i.e. high atomic numbers), especially for quartz filters. Ca is an exception to this trend, showing an average LOD similar to that of Na for the quartz substrates and greater than that of Mg and Al for the Teflon substrates. For the majority of the elements, the LODs for quartz filters were larger than those for Teflon filters with the exception of Cl, Mn, Cu, and Rb, which had LODs comparable values for the two substrates. A large inter-laboratory variability was observed for the LODs of some specific elements such as Na and Br (for both substrates); P, Ca, and Mn (for quartz substrates); and Zn (for Teflon substrates). This suggests, as expected, that the LODs depend on the instrument, on the specificity of the protocol used, and likely also on the filter batch.
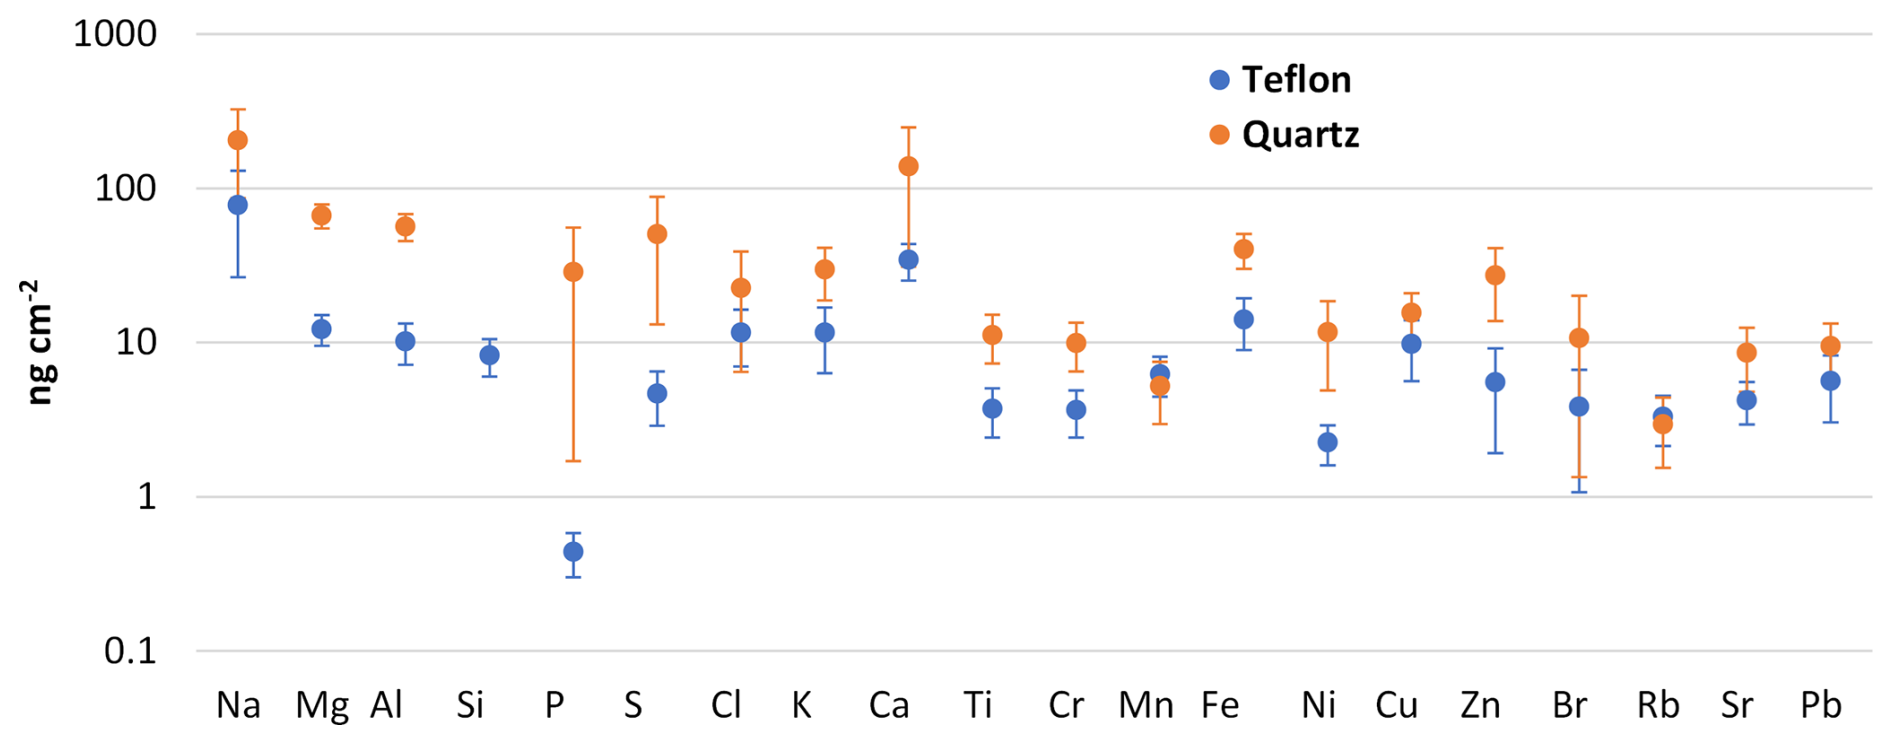
Figure 1Average LODs for ED-XRF analysis of measurements on Teflon and quartz substrates by the different laboratories. The error bars are the standard errors of the results obtained by the different laboratories.
3.2 Repeatability of measurements on standards and on PM10 samples
The repeatability of measurements on medium concentration Micromatter standards was investigated at ISAC-CNR over different time periods covering a range of 18 months to evaluate the long-term stability of calibration. Results are reported in Fig. 2 in terms of relative differences of measurements at 6, 9, 12, and 18 months from the initial calibration, taken as a reference.
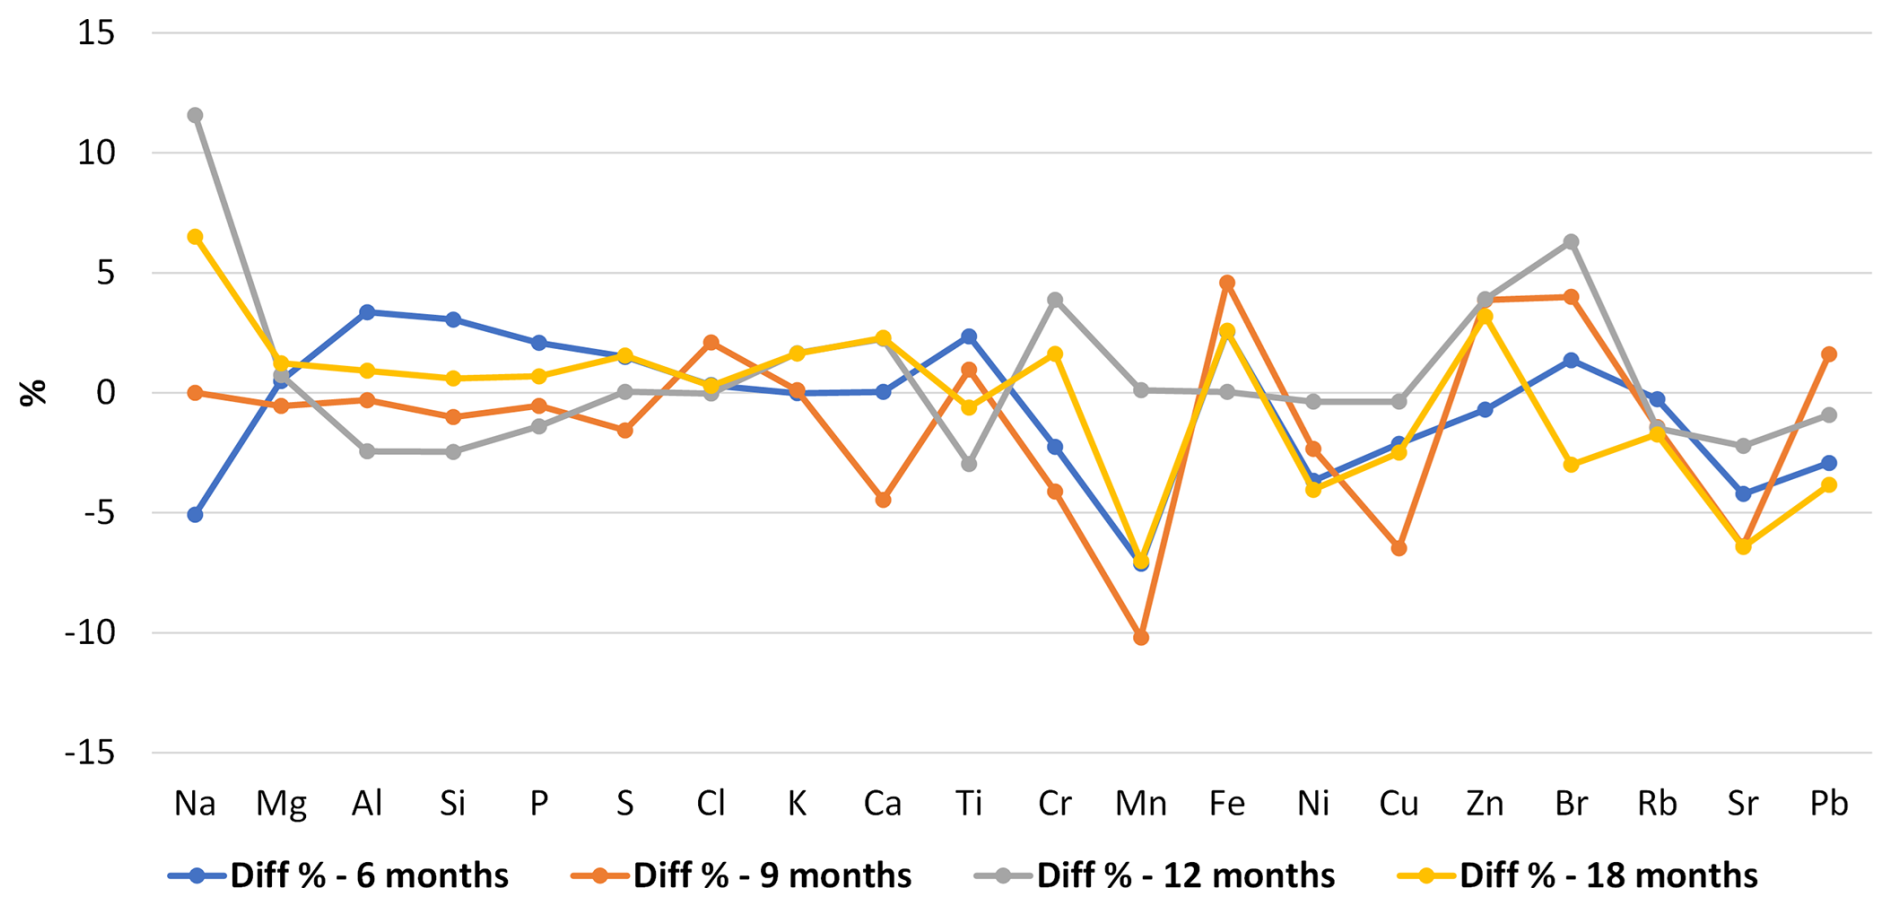
Figure 2Repeatability (%) of measurements on standards at intervals of several months (6–9–12–18) from the first calibration at ISAC-CNR.
The data showed an excellent stability, with differences below 12 % for all elements and below 5 % (i.e. the nominal uncertainty of the standards) for most of the elements. In addition, there was not any clear evidence of a performance deterioration with time because several differences at 18 months were lower (in absolute terms) than those at 3 months. This suggests that both the instrument and the standards are reasonably stable over long periods of time, such as those associated with the observational platforms of monitoring networks, and that periodic calibration checks done every few months may be sufficient for long-term operation of ED-XRF. The average repeatability of elements measured on Micromatter standards by the different laboratories using them is also shown in Fig. 3, with average values better than 5 % for all elements.
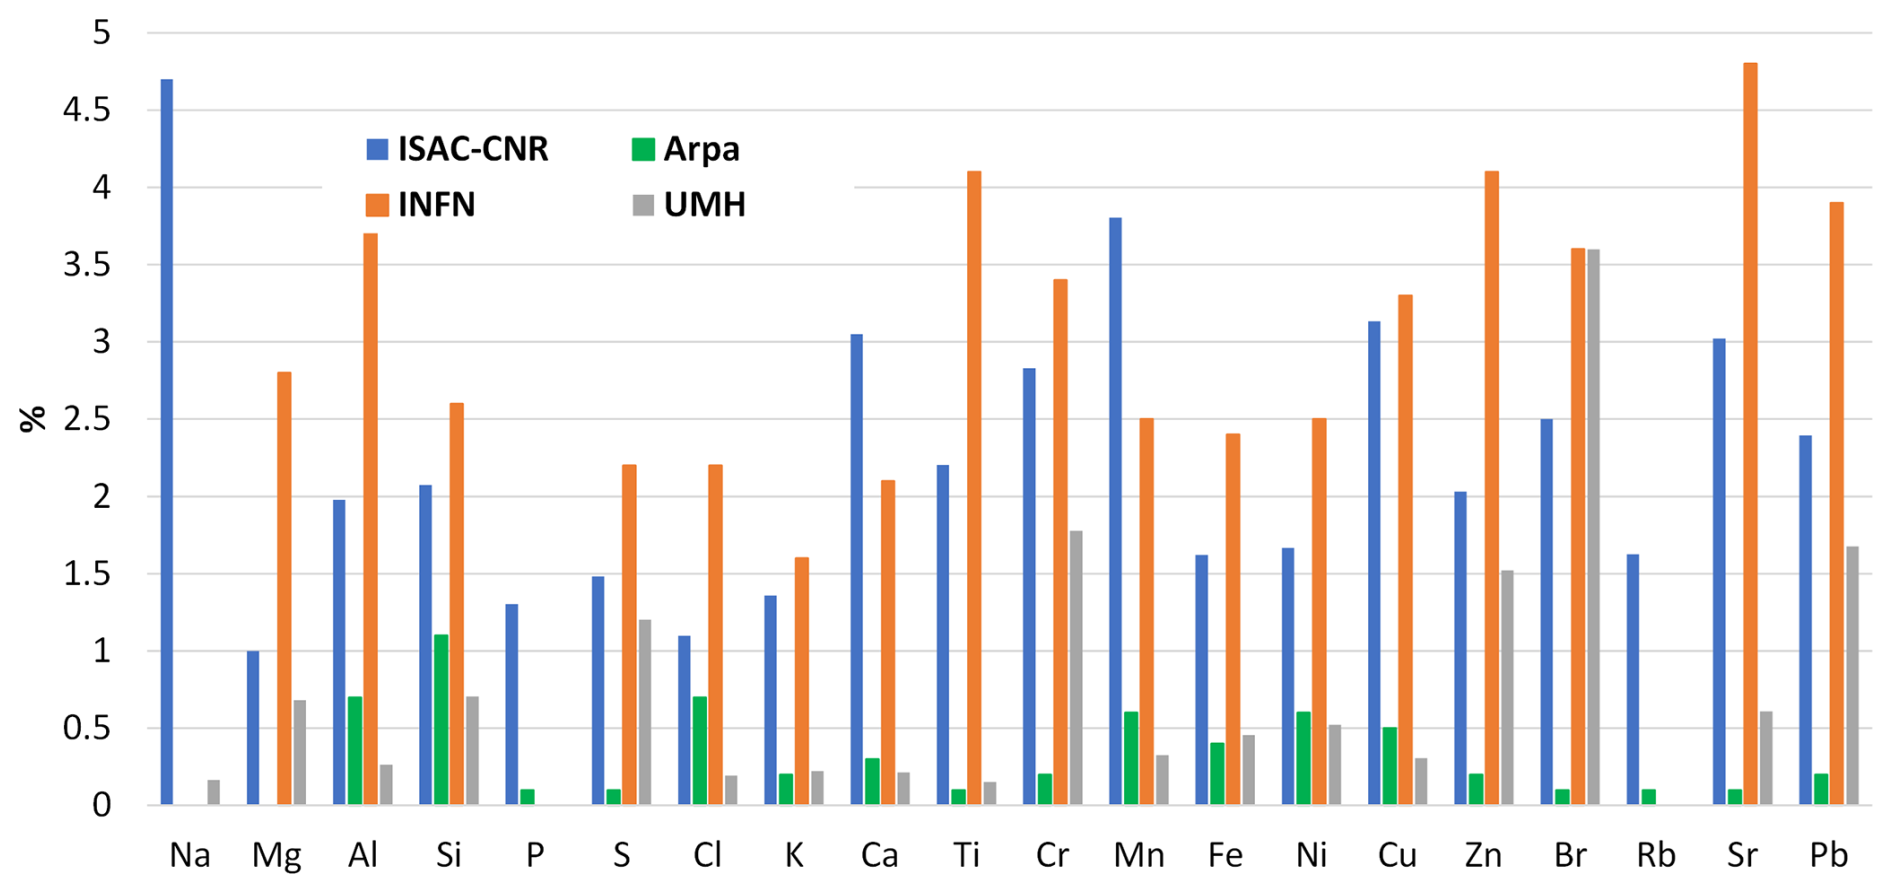
Regarding repeatability on PM10 samples, the results obtained by the different laboratories on Teflon substrates are reported in Fig. 4, showing repeatability better than 10 % for most of the elements and laboratories and, in several cases, better than 5 %. Sporadically (i.e. limited to specific laboratories) larger repeatability, in the range between 10 % and 20 %, was observed for Al, Cl, Ni, Cr, Rb, and Br.
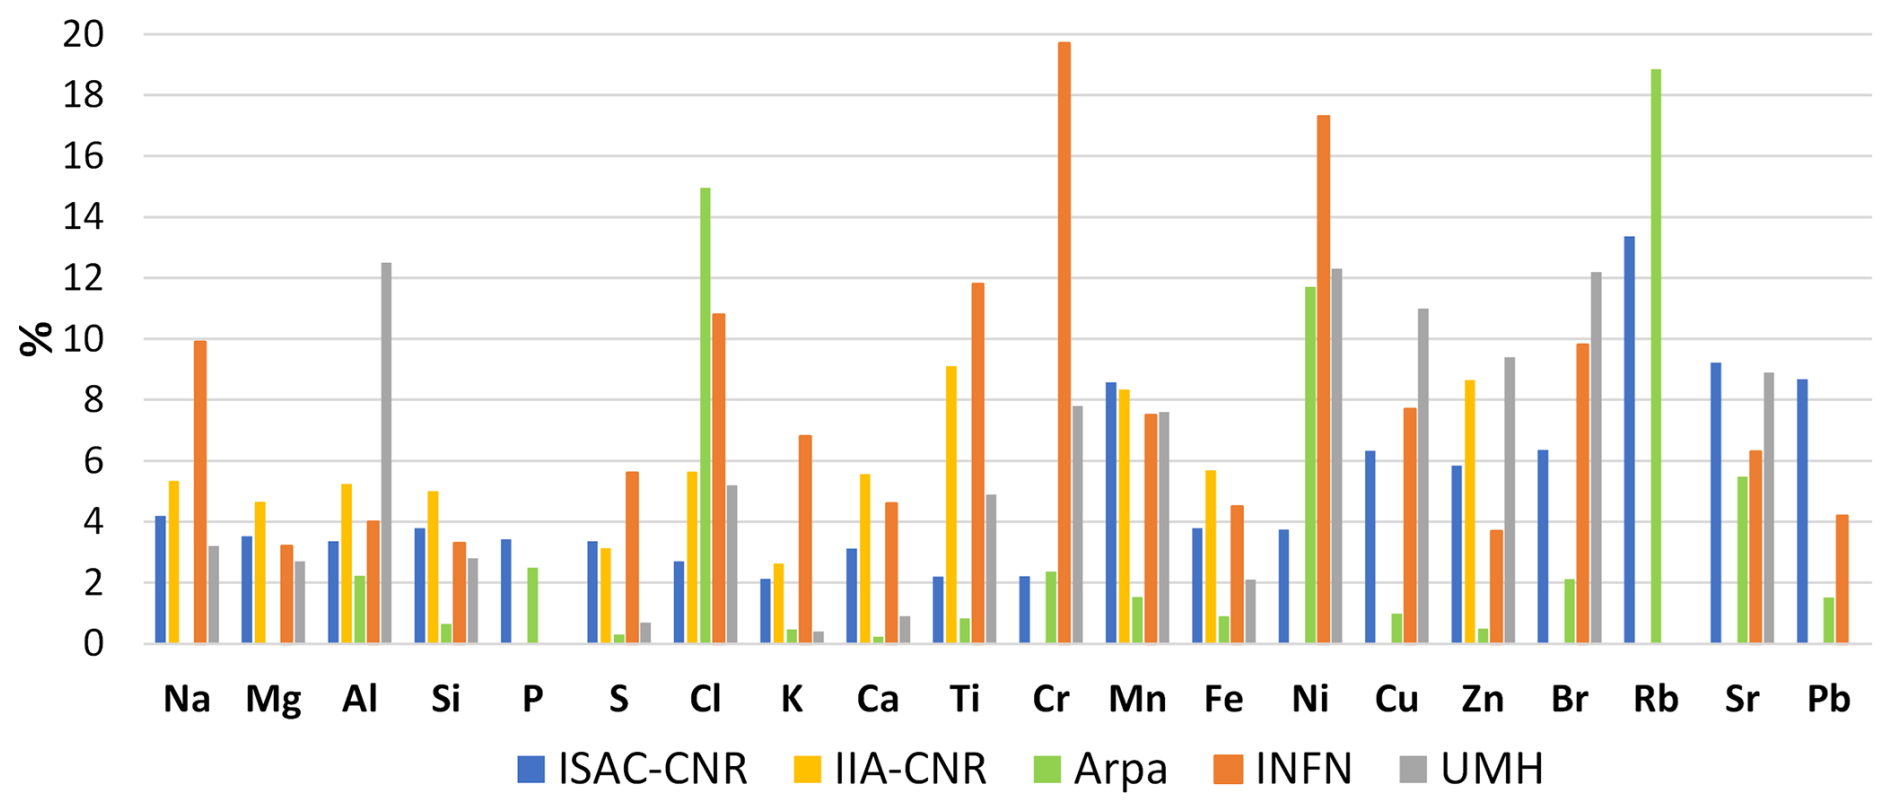
Figure 4Repeatability (%) of ED-XRF measurements on PM10 daily samples collected on Teflon filters by the different laboratories.
3.3 Comparison of measurements on Teflon substrates
The comparison was made on the Teflon samples of the datasets described in Sect. 2.2 comparing the results of the different laboratories on the same PM10 samples. The results of comparison for the non-trace elements (i.e. those with high abundances in the collected samples) are reported in Fig. 5, while the results for the trace elements are shown in Fig. 6.
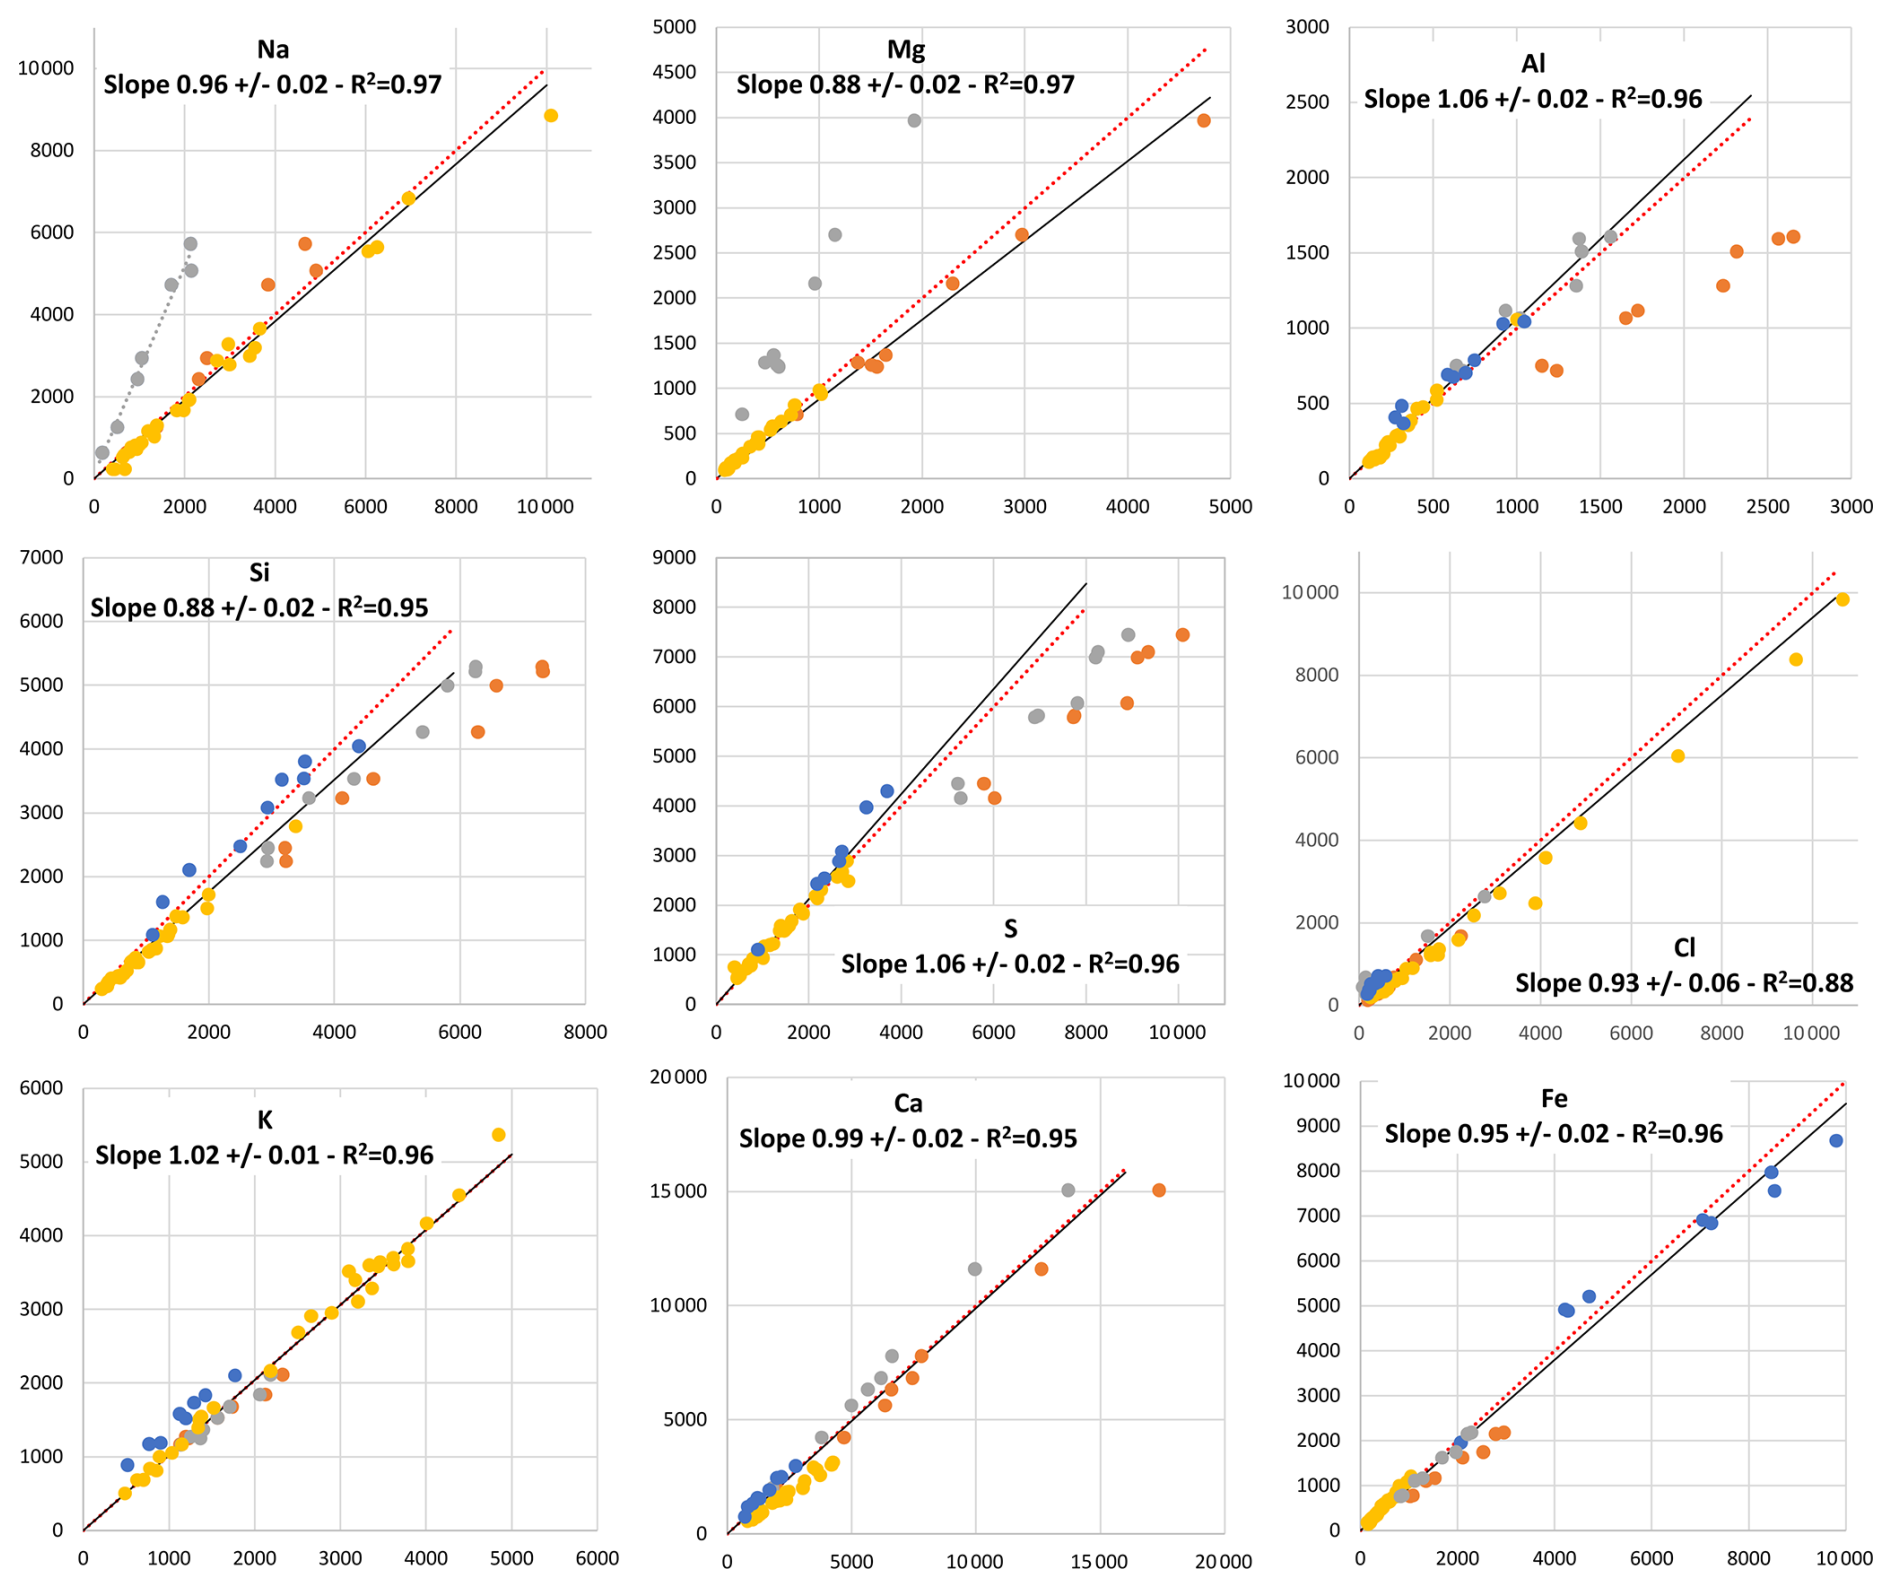
Figure 5Comparison of the measurements (ng cm−2) on Teflon filters for non-trace elements. The dashed red line represents the 1:1 line, while the black continuous line is a linear fit including only the datasets falling within ± 15 % of the 1:1 line. The x axis reports measurements at IIA-CNR (yellow), ARPA (blue), UMH (grey), and INFN with PIXE (orange); the y axis reports measurements in Lecce for the corresponding samples.
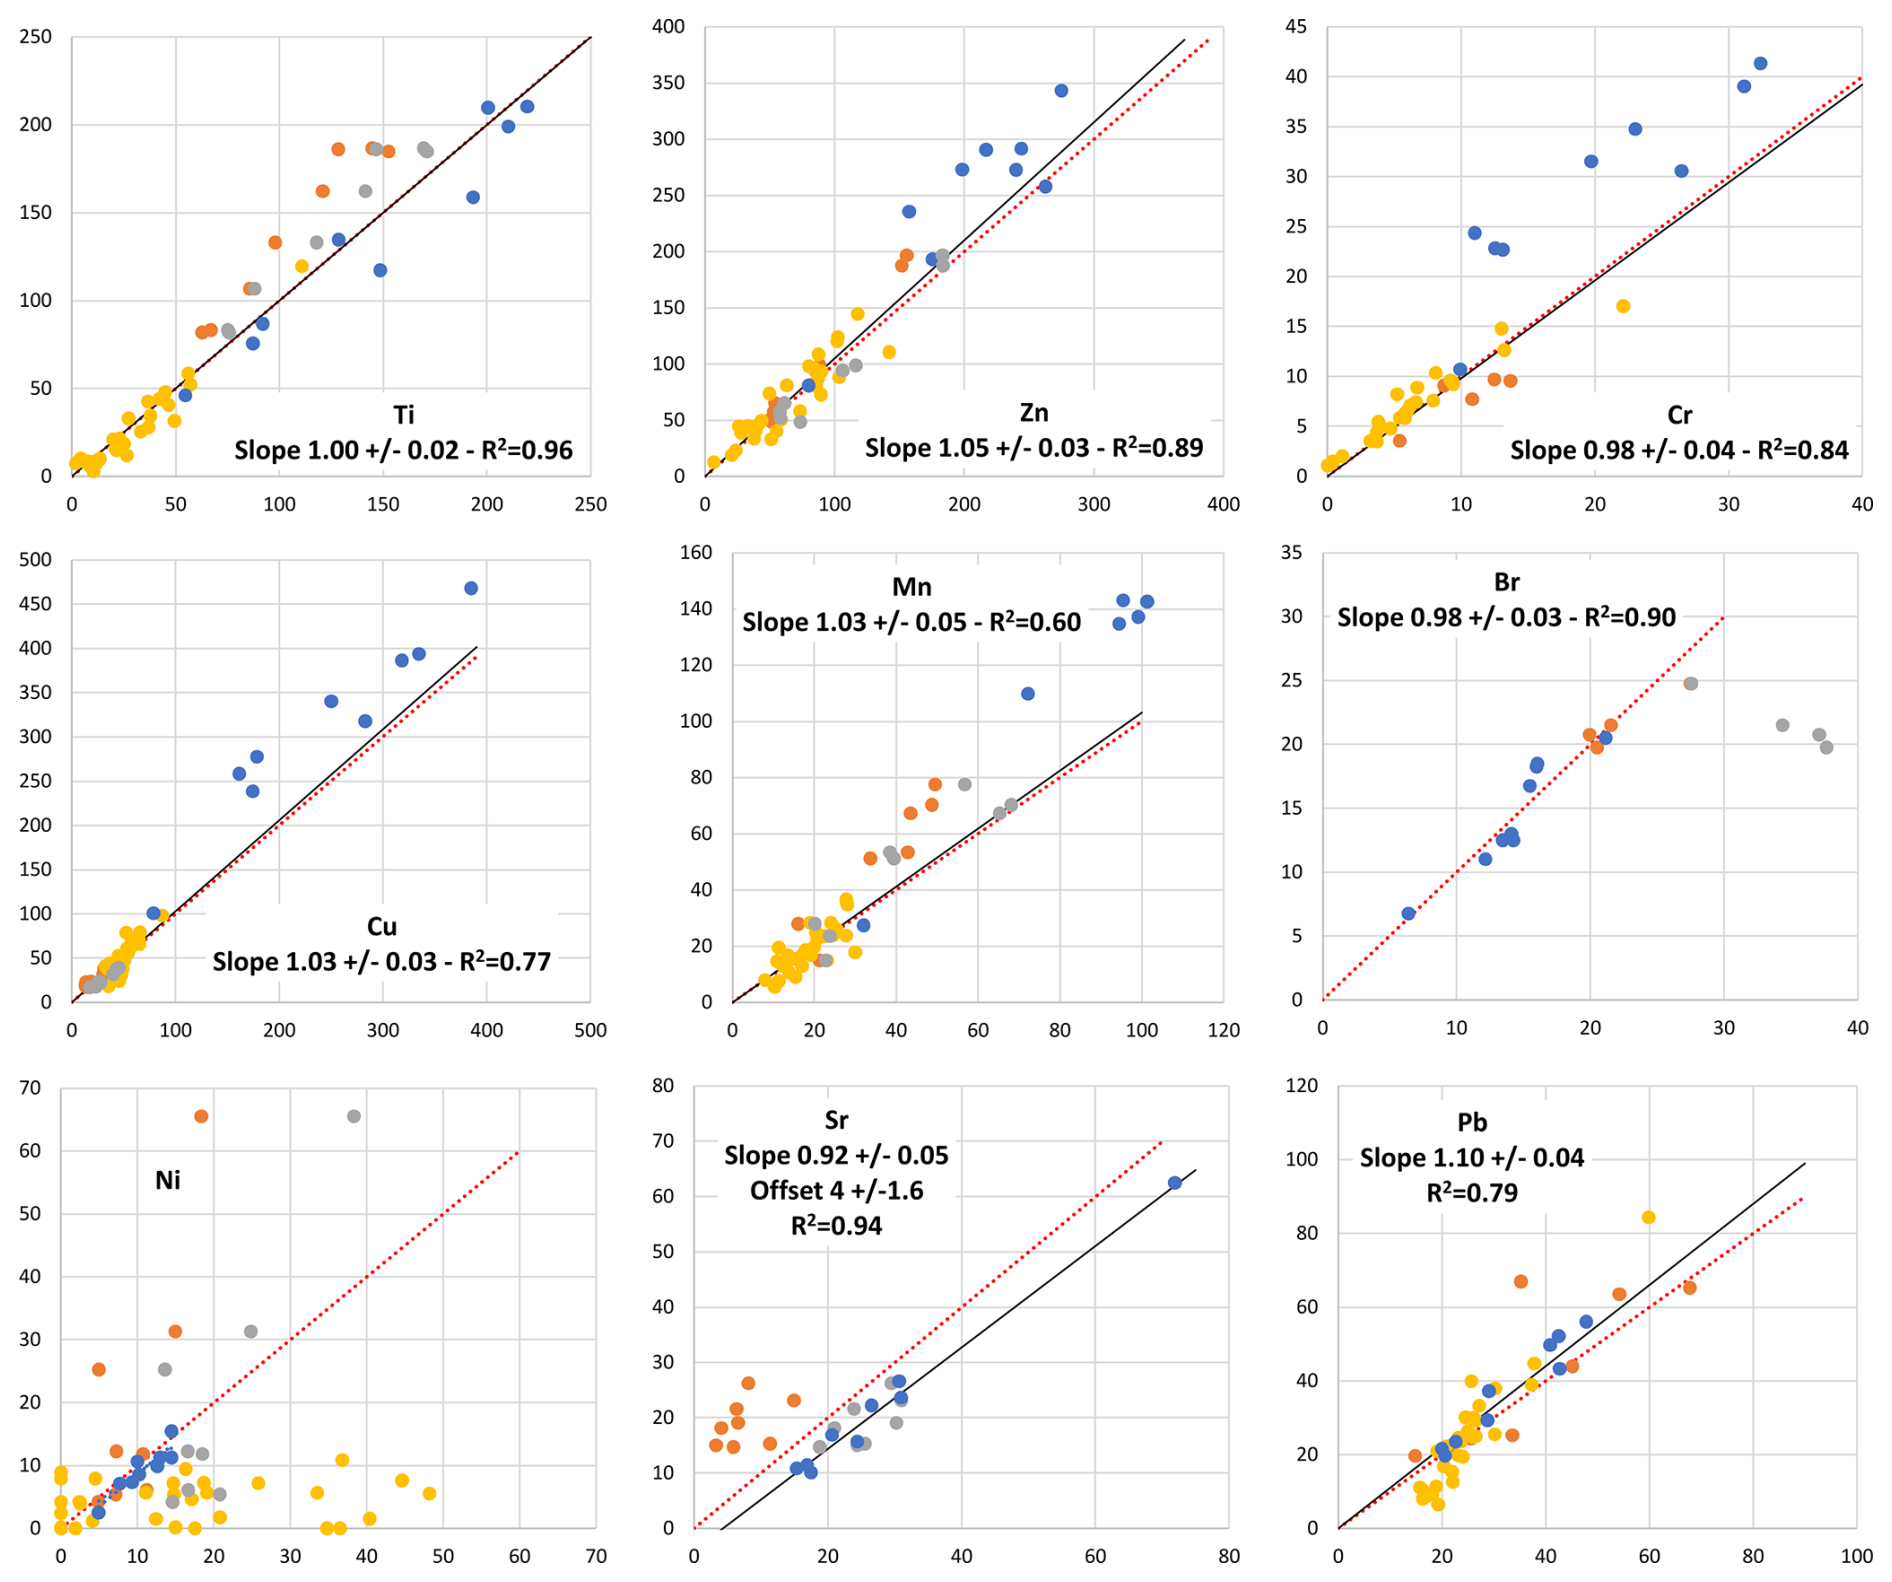
Figure 6Comparison of the measurements (ng cm−2) on Teflon filters for the trace elements. The dashed red line is 1:1; the black continuous line is a linear fit including the datasets within 15 % of the 1:1 line. The x axis reports measurements at IIA-CNR (yellow), ARPA (blue), UMH (grey), and INFN with PIXE (orange); the y axis reports measurements in Lecce for the corresponding samples.
Regarding non-trace elements, all analyses for Na and Mg showed a linear behaviour with differences among the laboratories within 15 % of the 1:1 line (with the exclusion of UMH for Na, showing an underestimation) that may suggest difficulty in detecting/calibrating these light elements with the ED-XRF technique if not specifically optimised. Concentrations of Al, Si, and S with the ED-XRF analysis are typically within 15 % of the 1:1 line, but an underestimation compared to PIXE was observed for Al (approximately 32 %) and Si (approximately 28 %). There were non-negligible differences between ED-XRF and PIXE also for S and Fe (both approximately 25 % larger with PIXE), as well as Ti (approximately 20 % lower with PIXE). Measurements of Cl showed a linear behaviour with inter-laboratory differences within 15 % of the 1:1 line; the same happened for K with an offset of approximately 370 ng cm−2 for the analysis of ARPA. Lombardia measurements of Ca were within 15 % of the 1:1 line for all laboratories with the exclusion of IIA-CNR, which showed an overestimation of approximately 25 % compared to the average fitting line.
Regarding trace elements, Rb and P were only analysed by ISAC-CNR and ARPA Lombardia and are not included in Fig. 5. The Rb concentrations measured in the two laboratories were all less than 10 ng cm−2 and correlated well (Pearson coefficient 0.94) with a slope of 0.92 ± 0.12, suggesting that even at these low concentration levels, Rb could be reliably measured. P concentrations of ISAC-CNR and ARPA Lombardia showed a very good correlation coefficient of 0.95 and a slope of 0.76 ± 0.03, suggesting a potential non-negligible error in the determination/calibration of P with ED-XRF that should be verified and further investigated with other techniques. The other trace elements (Fig. 5) showed good linear behaviour when measurements of the different laboratories were compared, with the exclusion of Ni. For this element, there was a good correlation and slope of the measurements at ISAC-CNR and ARPA Lombardia (Pearson coefficient = 0.91; slope of 1.02 ± 0.17), but no correlation was found with those of the other laboratories. This result suggests that Ni may be an element that is difficult to be measured with ED-XRF technique at least at the low concentration levels of the samples of this study. Comparison of Zn and Pb measurements performed by the different laboratories showed linear behaviour with slopes reasonably near 1. Br was detectable only in a limited number of samples and with low concentrations (i.e. < 30 ng cm−2); however, measurements at the different laboratories had a linear behaviour with slopes within 15 % of the 1:1 ratio for ISAC-CNR, ARPA Lombardia, and INFN; however, no correlation was found with measurements at UMH. Cr showed a linear behaviour among measurements in different laboratories, but an offset of approximately 9 ng cm−2 was observed for ARPA Lombardia. The same was observed for Cu with an offset of approximately 50 ng cm−2, at least at high concentrations (> 200 ng cm−2). Sr measurements showed a good correlation between ISAC-CNR, UMH, and ARPA Lombardia, with an offset of approximately 4 ± 1.6 ng cm−2 in the measurements of ISAC-CNR. An underestimation of PIXE measurements compared to ED-XRF was observed for strontium (Sr). Measurements of Mn showed a substantial agreement of ISAC-CNR and IIA-CNR measurements; however, these showed an overestimation of approximately 26 %–28 % compared to the other laboratories. This suggests that further comparison with independent chemical analysis of Mn using another technique such as the ICP-MS may be necessary.
The ranges of the average differences among measurements in the different laboratories and between ED-XRF and PIXE were comparable with the results of some previous intercomparison studies. An inter-laboratory comparison of ED-XRF and PIXE was conducted by Gini et al. (2021) using certified reference materials deposited on Teflon filters. Their results showed an efficient detection of most of the elements (Ca, Fe, K, Ti, Zn, Cr, Pb), but only three participants were able to report values for light elements (i.e. atomic numbers < 16). The average relative differences between the participants results and the assigned values were 17.5 ± 18.1 % (reference material CRM2583; excluding Cr and Pb) and 16.7 ± 16.7 % (reference material CRM2584; excluding Cr and P). Yatkin et al. (2016) performed an inter-laboratory comparison on PM10 samples collected on Teflon filters at a regional rural site in northern Italy, using three different XRF methods and the PIXE method. Regression results showed that the three XRF laboratories measured very similar mass loadings for S, K, Ti, Mn, Fe, Cu, Br, Sr, and Pb, with slopes within 20 % of unity.
3.4 Comparison of simultaneous measurements on quartz and Teflon substrates
The analysis of the PM10 dataset collected simultaneously on quartz and Teflon filters was carried out to investigate the correlation between the concentrations measured on the two substrates and their ratio (where Cquartz means concentration measured in the quartz filter and Cteflon the concentration measured in the Teflon substrate). Results showed that Si was not measurable on quartz filters due to strong interference from the quartz matrix itself, which is composed primarily of Si and thus leads to high background levels. In addition, Ni and Rb, measured on the two substrates, showed no correlation, at the typical concentrations of the samples used in this study, and were not further processed. Results for Ni are consistent with the low correlation of Ni measurements on quartz substrates using WD-XRF with flame atomic absorption spectroscopy measurements observed in Gupta et al. (2021).
Figure 7 shows the average ratios for the different laboratories together with the interquartile range (i.e. 25th–75th percentile).
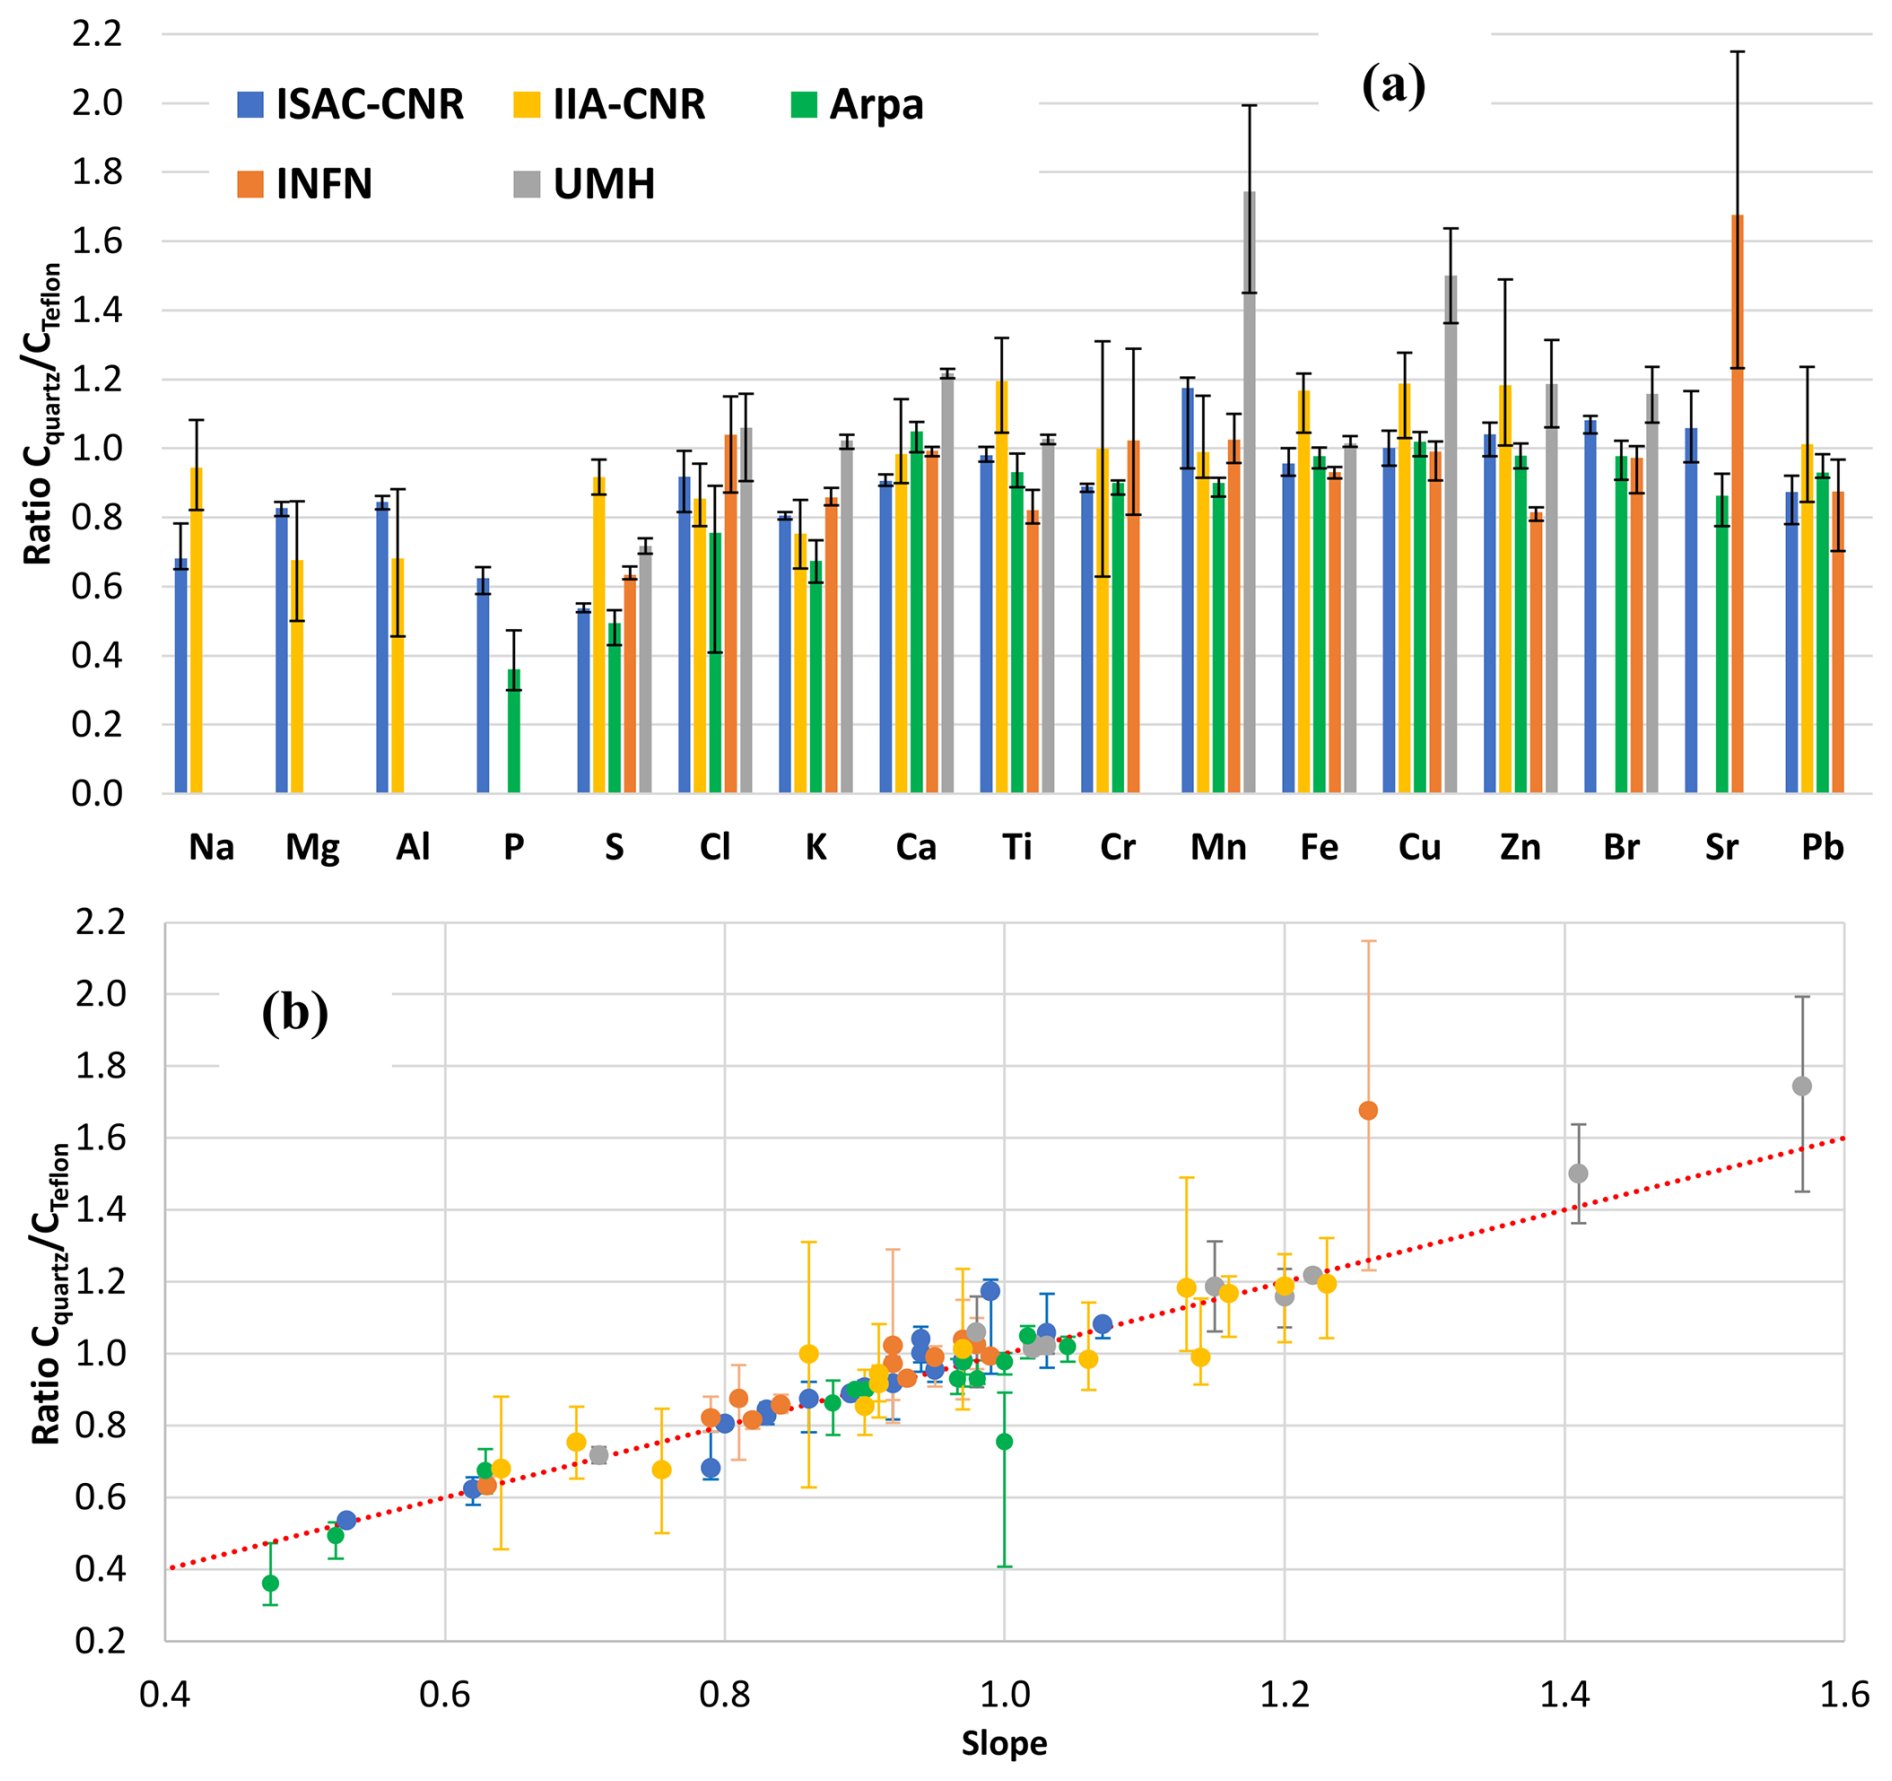
Figure 7(a) Averages and interquartile ranges (i.e. 25th–75th percentiles) of the ratios measured at the different laboratories. (b) Comparison of the average ratios with the corresponding slope of the linear fit between concentrations measured on quartz and Teflon. The dashed red line is 1:1. Error bars represent the interquartile ranges (i.e. 25th–75th percentiles).
In addition, Fig. 7 also compares the average ratios with the corresponding slopes of the linear fits between the concentrations measured on Teflon and on quartz substrates. Pearson correlation coefficients (not shown) were all above 0.7, and in several cases above 0.9, with the exception of Sr (0.64 at ISAC-CNR and 0.34 at INFN) with all concentrations below 30 ng cm−2; Br at INFN (0.34) with all concentrations below 15 ng cm−2; and Na (0.40), Cr (0.64), and Pb (0.49) at IIA-CNR. The comparison of the average ratios with the slopes showed a substantial agreement within the error bars for the different laboratories. For the PIXE analysis the only case out of the trend is the high value obtained on Sr, but the two time series were affected by significant uncertainty, having all concentrations lower than 30 ng cm−2 and a limited correlation (0.34) among measurements on quartz and Teflon. In a previous study, a ratio of 0.9 was observed for Sr using PIXE at different concentrations (Chiari et al., 2018). Regarding the average ratios observed at UMH, there are two high values (> 1.4), obtained for Cu and Mn, which are significantly higher than the corresponding values of the other laboratories. The correction factors to be used for measurements on quartz substrates (i.e. the ratios) were generally lower for light elements than for heavy elements. The trend observed is consistent with the results reported for 12 elements in Steinhoff et al. (2000), where a ratio of about 0.6 was found for Al and K, and larger values of 1.0–1.1 were found for Zn, Pb, Cu, Fe, and Ca with ratios up to 1.2–1.4 for Ti and Se. The trend is also consistent with the results reported for 11 elements analysed by ED-XRF (excluding Al) in Chiari et al. (2018), where the values range from 0.6 for light elements (Na and Mg) to 0.7 (for S, Cl, and K) and up to 0.9–1.1 for heavier elements. The values of the ratios found in this work depend on the specific protocols and instruments used in the different laboratories, but for several of the 17 elements studied there is a good consistency with limited differences between the different laboratories. In addition, reliable results could also be obtained on quartz substrates for light elements (Na, Mg, and Al), provided that the instrument has sufficient emission energy and that the method used is optimised for these elements.
This work intercompared ED-XRF and PIXE measurements, done by different laboratories, on PM10 samples collected at different sites on quartz and Teflon substrates. The focus was to evaluate LODs, repeatability, and correction factors to use ED-XRF on quartz substrates also for light elements (i.e. Na, Mg, Al, and P) starting from the calibration used for Teflon substrates. The main findings are outlined below.
LODs on quartz substrates were significantly larger than those on Teflon for the majority of the elements, with the exclusion of Cl, Mn, Cu, and Rb that had comparable LODs for the two substrates. LODs of light elements were generally larger compared to those of high atomic number, especially for quartz substrates, with the exception of Ca.
Repeated measurements on Micromatter standards showed very stable results for several months (up to 18 months). The average repeatability of measurements of standards was better than 5 % (i.e. nominal uncertainty of the standards) for all elements analysed. Repeatability on PM10 samples collected on Teflon substrates was, on average, better than 10 % for the majority of the elements analysed and better than 5 % for several elements.
Comparison of analysis on Teflon samples for 20 elements obtained by the different laboratories showed good correlation with concentrations in the range of ±15 % of the 1:1 line for most of the elements and laboratories. Larger differences, 25 %–30 %, were observed comparing ED-XRF with PIXE for some elements (Al, Si, S, and Ti). Worse agreement between the different laboratories was observed for the determination of Ni, Mn, and Rb. Offsets > 10 ng cm−2 were sporadically observed for Cu and K.
Comparison of measurements on samples collected on quartz and Teflon substrates showed that on quartz Si was obviously too abundant on blanks and thus not measurable; Rb and Ni were not well correlated between the two substrates at the typical concentrations of this study. The remaining 17 elements were well correlated, with Pearson coefficients larger than 0.7 for the majority of the cases. The average ratios of the majority of elements and laboratories were in the range 0.6 ± 0.1 (for light elements, due to self-absorption effects) to 1.1 ± 0.1 for heavy elements.
Results showed that reasonable results could be obtained on quartz substrates for 17 elements, including Na, Mg, and Al for instruments having sufficient emission energy and a method optimised for these elements, using calibration on Teflon and opportune corrections based on the ratios of . However, the corrections depend on the instrument and method used for the analysis.
Despite the higher LODs, ED-XRF on quartz filters remains advantageous in specific applications thanks to its non-destructive nature, fast and simple sample handling with minimal contamination risks, and its sufficient sensitivity to many elements relevant to atmospheric PM studies. These features make it particularly suitable for integrated platforms where multiple analyses (e.g. carbon, ions, oxidative potential) are performed on a single filter. Further studies on the application of ED-XRF to multi-elemental measurements on quartz filter may benefit from the availability of suitable standards deposited on quartz substrates.
All data are available upon reasonable request from the corresponding author (antonio.pennetta@cnr.it).
DC conceptualised the study design and collaborated to the writing of the initial draft. FU, AD, EM, and CM collected samples in Lecce and performed ED-XRF analysis and some of the data post-processing. AP collaborated on measurements of elements and on the writing of the initial draft. GC and MC performed the analysis with PIXE. EC, CC, and MF collected samples in Milan and performed ED-XRF analysis. SP and CP collected samples in Rome and performed ED-XRF analysis. NGS and EY performed ED-XRF analysis in Elche. All authors collaborated on the interpretation of results and read and commented on the final manuscript.
At least one of the (co-)authors is a member of the editorial board of Aerosol Research. The peer-review process was guided by an independent editor, and the authors also have no other competing interests to declare.
Publisher’s note: Copernicus Publications remains neutral with regard to jurisdictional claims made in the text, published maps, institutional affiliations, or any other geographical representation in this paper. While Copernicus Publications makes every effort to include appropriate place names, the final responsibility lies with the authors.
This research was supported by the project IR0000032 – ITINERIS, Italian Integrated Environmental Research Infrastructures System (D.D. no. 130/2022 – CUP B53C22002150006) funded by EU – Next Generation EU PNRR – Mission 4 “Education and Research” – Component 2: “From research to business” – Investment 3.1: “Fund for the realisation of an integrated system of research and innovation infrastructures”.
This paper was edited by Luis A. Ladino and reviewed by two anonymous referees.
Arana, A., Loureiro, A. L., Barbosa, H. M. J., Van Grieken, R., and Artaxo, P.: Optimized energy dispersive X-ray fluorescence analysis of atmospheric aerosols collected at pristine and perturbed Amazon Basin sites, X-Ray Spectrom., 43, 228–237, https://doi.org/10.1002/xrs.2544, 2014.
Astolfi, M. L., Canepari, S., Catrambone, M., Perrino, C., and Pietrodangelo, A.: Improved characterisation of inorganic components in airborne particulate matter, Environ. Chem. Lett., 3, 186–191, https://doi.org/10.1007/s10311-005-0029-7, 2006.
Belis, C. A., Pikridas, M., Lucarelli, F., Petralia, E., Cavalli, F., Calzolai, G., Berico, M., and Sciare, J.: Source apportionment of fine PM by combining high time resolution organic and inorganic chemical composition datasets, Atmospheric Environment: X, 3, 100046, https://doi.org/10.1016/j.aeaoa.2019.100046, 2019.
Bettinelli, M., Beone, G. M., Spezia, S., and Baffi, C.: Determination of heavy metals in soils and sediments by microwave-assisted digestion and inductively coupled plasma optical emission spectrometry analysis, Anal. Chim. Acta, 424, 289–296, https://doi.org/10.1016/S0003-2670(00)01123-5, 2000.
Cadeo, L., Biffi, B., Chazeau, B., Colombi, C., Cosenza, R., Cuccia, E., Manousakas, M.-I., Daellenbach, K. R., Prévôt, A. S. H., and Vecchi, R.: Intercomparison of online and offline XRF spectrometers for determining the PM10 elemental composition of ambient aerosol, EGUsphere [preprint], https://doi.org/10.5194/egusphere-2025-110, 2025.
Calzolai, G., Chiari, M., Lucarelli, F., Mazzei, F., Nava, S., Prati, P., Valli, G., and Vecchi, R.: PIXE and XRF analysis of particulate matter samples: an inter-laboratory comparison, Nucl. Instrum. Meth. B, 266, 2401–2404, https://doi.org/10.1016/j.nimb.2008.03.056, 2008.
Calzolai, G., Chiari, M., Lucarelli, F., Nava, S., and Portarena, S.: Proton induced γ-ray emission yields for the analysis of light elements in aerosol samples in an external beam set-up, Nucl. Instrum. Meth. B, 268, 1540–1545, https://doi.org/10.1016/j.nimb.2010.03.002, 2010.
Campbell, J. L., Boyd, N. I., Grassi, N., Bonnick, P., and Maxwell, J. A.: The Guelph PIXE software package IV, Nucl. Instrum. Meth. B, 268, 3356–3363, https://doi.org/10.1016/j.nimb.2010.07.012, 2010.
Canepari, S., Perrino, C., Astolfi, M. L., Catrambone, M., and Perret, D.: Determination of soluble ions and elements in ambient air suspended particulate matter: Inter-technique comparison of XRF, IC and ICP for sample-by-sample quality control, Talanta, 77, 1821–1829, https://doi.org/10.1016/j.talanta.2008.10.029, 2009.
Cesari, D., Merico, E., Grasso, F. M., Dinoi, A., Conte, M., Genga, A., Siciliano, M., Petralia, E., Stracquadanio, M., and Contini, D.: Analysis of the contribution to PM10 concentrations of the largest coal-fired power plant of Italy in four different sites, Atmos. Pollut. Res., 12, 101135, https://doi.org/10.1016/j.apr.2021.101135, 2021.
Chiari, M., Yubero, E., Calzolai, G., Lucarelli, F., Crespo, J., Galindo, N., Nicolás, J. F., Giannoni, M., and Nava, S.: Comparison of PIXE and XRF analysis of airborne particulate matter samples collected on Teflon and quartz fibre filters, Nucl. Instrum. Meth. B, 417, 128–132, https://doi.org/10.1016/j.nimb.2017.07.031, 2018.
Colombi, C., Angius, S., Gianelle, V., and Lazzarini, M.: Particulate matter concentrations, physical characteristics and elemental composition in the Milan underground transport system, Atmos. Environ., 70, 166–178, https://doi.org/10.1016/j.atmosenv.2013.01.035, 2013.
Conte, M., Merico, E., Cesari, D., Dinoi, A., Grasso, F. M., Donateo, A., Guascito, M. R., and Contini, D.: Long-term characterisation of African dust advection in south-eastern Italy: Influence on fine and coarse particle concentrations, size distributions, and carbon content, Atmos. Res., 233, 104690, https://doi.org/10.1016/j.atmosres.2019.104690, 2020.
Contini, D., Cesari, D., Conte, M., and Donateo, A.: Application of PMF and CMB receptor models for the evaluation of the contribution of a large coal-fired power plant to PM10 concentrations, Sci. Total Environ., 560, 131–140, https://doi.org/10.1016/j.scitotenv.2016.04.031, 2016.
Dinoi, A., Pavese, G., Calvello, M., Chirizzi, D., Pennetta, A., De Benedetto, G. E., Esposito, F., Mapelli, C., and Contini, D.: Characterization of aerosol and its oxidative potential in a coastal semi-rural site of Southern Italy, Atmos. Environ., 333, 120656, https://doi.org/10.1016/j.atmosenv.2024.120656, 2024.
Furger, M., Rai, P., Slowik, J. G., Cao, J., Visser, S., Baltensperger, U., and Prévôt, A. S. H.: Automated alternating sampling of PM10 and PM2.5 with an online XRF spectrometer, Atmospheric Environment: X, 5, 100065, https://doi.org/10.1016/j.aeaoa.2020.100065, 2020.
Galindo, N., Yubero, E., Nicolás, J. F., Varea, M., and Crespo, J.: Characterization of metals in PM1 and PM10 and health risk evaluation at an urban site in the western Mediterranean, Chemosphere, 201, 243–250, https://doi.org/10.1016/j.chemosphere.2018.02.162, 2018.
Gini, M., Manousakas, M. I., Kantarelou, V., Karydas, A. G., Chiari, M., Migliori, A., Civici, N., Veleva, B., Šega, K., Samek, L., Samara, C., Kertesz, Z., Osan, J., and Eleftheriadis, K.: Inter-laboratory comparison of ED-XRF/PIXE analytical techniques in the elemental analysis of filter-deposited multi-elemental certified reference materials representative of ambient particulate matter, Sci. Total Environ., 780, 146449, https://doi.org/10.1016/j.scitotenv.2021.146449, 2021.
Guascito, M. R., Lionetto, M. G., Mazzotta, F., Conte, M., Giordano, M. E., Caricato, R., De Bartolomeo, A. R., Dinoi, A., Cesari, D., Merico, E., Mazzotta, L., and Contini, D.: Characterisation of the correlations between oxidative potential and in vitro biological effects of PM10 at three sites in the central Mediterranean, J. Hazard. Mater., 448, 130872, https://doi.org/10.1016/j.jhazmat.2023.130872, 2023.
Gupta, S., Soni, P., and Gupta, A. K.: Optimization of WD-XRF analytical technique to measure elemental abundance in PM2.5 dust collected on quartz-fibre filter, Atmos. Pollut. Res., 12, 345–351, https://doi.org/10.1016/j.apr.2021.01.001, 2021.
Lucarelli, F., Calzolai, G., Chiari, M., Giannoni, M., Mochi, D., Nava, S., and Carraresi, L.: The upgraded external-beam PIXE/PIGE set-up at LABEC for very fast measurements on aerosol samples, Nucl. Instrum. Meth. B, 318, 55–59, https://doi.org/10.1016/j.nimb.2013.05.099, 2014.
Manousakas, M., Eleftheriadis, K., and Papaefthymiou, H.: Characterization of PM10 Sources and Ambient Air Concentration Levels at Megalopolis City (Southern Greece) Located in the Vicinity of Lignite-Fired Plants, Aerosol Air Qual. Res., 13, 804–817, https://doi.org/10.4209/aaqr.2012.09.0239, 2013.
Manousakas, M., Furger, M., Daellenbach, K. R., Canonaco, F., Chen, G., Tobler, A., Rai, P., Qi, L., Tremper, A. H., Green, D., Hueglin, C., Slowik, J. G., El Haddad, I., and Prevot, A. S. H.: Source identification of the elemental fraction of particulate matter using size segregated, highly time-resolved data and an optimized source apportionment approach, Atmospheric Environment: X, 14, 100165, https://doi.org/10.1016/j.aeaoa.2022.100165, 2022.
Ogrizek, M., Kroflič, A., and Šala, M.: Critical review on the development of analytical techniques for the elemental analysis of airborne particulate matter, Trends in Environmental Analytical Chemistry, 33, e00155, https://doi.org/10.1016/j.teac.2022.e00155, 2022.
Okuda, T., Fujimori, E., Hatoya, K. Takada, H., Kumata, H., Nakajima, F., Hatakeyama, S., Uchida, M., Tanaka, S., He, K., Ma, Y., and Haraguchi, H.: Rapid and Simple Determination of Multi-Elements in Aerosol Samples Collected on Quartz Fiber Filters by Using EDXRF Coupled with Fundamental Parameter Quantification Technique, Aerosol Air Qual. Res., 13, 1864–1876, https://doi.org/10.4209/aaqr.2012.11.0308, 2013.
Perrino, C., Tiwari, S., Catrambone, M., Dalla Torre, S., Rantica, E., and Canepari, S.: Chemical characterization of atmospheric PM in Delhi, India, during different periods of the year including Diwali festival, Atmos. Pollut. Res., 2, 418–427, https://doi.org/10.5094/APR.2011.048, 2011.
Perrino, C., Giusto, M., Sargolini, T., Calzolai, G., and Canepari, S.: Assessment of the link between atmospheric dispersion and chemical composition of PM10 at 2-h time resolution, Chemosphere, 298, 134272, https://doi.org/10.1016/j.chemosphere.2022.134272, 2022a.
Perrino, C., Pelliccioni, A., Tofful, L., and Canepari, S.: Indoor PM10 in university classrooms: chemical composition and source behaviour, Atmos. Environ., 287, 119260, https://doi.org/10.1016/j.atmosenv.2022.119260, 2022b.
Potì, S., Merico, E., Conte, M., Unga, F., Cesari, D., Dinoi, A., De Bartolomeo, A. R., Pennetta, A., Bloise, E., Deluca, G., De Benedetto, G. E., Ferrera, R., Bompadre, E., Guascito, M. R., and Contini, D., Spatial and seasonal variability of the contribution of sources to PM2.5, PM10 and their oxidative potential in different sites in a central Mediterranean area, Sci. Total Environ., 976, 179283, https://doi.org/10.1016/j.scitotenv.2025.179283, 2025.
Spolnik, Z., Belikov, K., Van Meel, K., Adriaenssens, E., De Roeck, F., and Van Grieken, R.: Optimization of measurement conditions of an energy dispersive X-ray fluorescence spectrometer with high-energy polarized beam excitation for analysis of aerosol filters, Appl. Spectrosc., 59, 1465–1469, https://doi.org/10.1366/000370205775142647, 2005.
Steinhoff, G., Haupt, O., and Dannecker, W.: Fast determination of trace elements on aerosol-loaded filters by X-ray fluorescence analysis considering the inhomogeneous elemental distribution, Fresen. J. Anal. Chem., 366, 174–177, https://doi.org/10.1007/s002160050034, 2000.
Su, C.-P., Peng, X., Huang, X.-F., Zeng, L.-W., Cao, L.-M., Tang, M.-X., Chen, Y., Zhu, B., Wang, Y., and He, L.-Y.: Development and application of a mass closure PM2.5 composition online monitoring system, Atmos. Meas. Tech., 13, 5407–5422, https://doi.org/10.5194/amt-13-5407-2020, 2020.
Yatkin, S., Gerboles, M., and Borowiak, A.: Evaluation of standardless EDXRF analysis for the determination of elements on PM10 loaded filters, Atmos. Environ., 54, 568–582, https://doi.org/10.1016/j.atmosenv.2012.02.062, 2012.
Yatkin, S., Belis, C. A., Gerboles, M., Calzolai, G., Lucarelli, F., Cavalli, F., and Trzepla, K.: An interlaboratory comparison study on the measurement of elements in PM10, Atmos. Environ., 125, 61–68, https://doi.org/10.1016/j.atmosenv.2015.10.084, 2016.
Wang, C. F., Tu, F. H., Jeng, S. L., and Chin, C. J.: The determination of silicon in airborne particulate matter by XRF and LA–ICP–MS, J. Radioanal. Nucl. Ch., 242, 97–103, https://doi.org/10.1007/bf02345899, 1999.