the Creative Commons Attribution 4.0 License.
the Creative Commons Attribution 4.0 License.
 | 25 Nov 2025
Ice-nucleating particles at Ny-Ålesund: a study of condensation freezing by the Dynamic Filter Processing Chamber
Alessia Nicosia
Marco Paglione
Karam Mansour
Stefano Decesari
Mauro Mazzola
Gianni Santachiara
Franco Belosi
This study presents atmospheric ice-nucleating particle (INP) data from the Gruvebadet (GVB) observatory in Ny-Ålesund (Svalbard). Aerosol particle sampling activities were conducted over 3 years (2018–2020) for a total of six intensive campaigns, covering three seasons (spring, summer, and autumn), by deploying PM1 and PM10 sampling inlets in parallel. Ambient INP concentrations (nINP) were measured offline on the collected filters in condensation-freezing mode (water saturation ratio of 1.02) by means of the Dynamic Filter Processing Chamber. Three activation temperatures (T) were considered: −15, −18, and −22 °C.
Overall, in the PM10 size range, nINP ranged from 0.3 to 315 m−3 in the considered T range, in agreement with previous observations in the Arctic environment. Regarding the ice nucleation efficiency of the investigated aerosol particles (referring to the range between 0.1 and 10 µm), the estimated activated fraction (AF) resulted to be between 10−8 and 10−5, obviously increasing as the T decreased.
The seasonality of the ice-nucleating properties of Arctic aerosol particles was investigated by merging the results of the six campaigns. Our data show a moderate summertime increase in nINP at T= −15 °C. No such summertime increase was observed at T= −18 and −22 °C. On the other hand, the AF of atmospheric aerosol particles presents a clearer seasonal evolution, with maxima observed in late summer and early autumn. Finally, we report a marked seasonal evolution in the contribution of super-micrometre INPs. Such INPs increase their contribution significantly from spring (15 %–20 %) to summer (∼ 60 %), while lower levels typically characterise the autumn season (20 %–50 %). Our calculations also show that super-micrometre particles have at least 2-orders-of-magnitude-higher AF compared to sub-micrometre ones.
The correlation with anthropogenic long-range-transport tracer black carbon, the contribution of ground types (seawater, sea ice, land, and snow) inferred from satellite data, the low-level back trajectory analysis, and the aforementioned considerations regarding the varying seasonal contributions of sub- and super-micrometre INPs all indicate that the primary sources of springtime INPs at GVB are mostly located outside the Arctic. In contrast, local INP sources dominate during summer and early autumn. When land and sea are mostly free from snow and ice, both marine and terrestrial sources result in important INP contributors at GVB. Regarding marine sources in particular, our analysis identifies potential marine INP sources located in the seawaters surrounding and immediately to the south of the Svalbard archipelago down to the waters around Iceland. Such sources apparently dominate nINP in summer and early autumn outside the major terrestrial INP bursts.
- Article
(4189 KB) - Full-text XML
-
Supplement
(3549 KB) - BibTeX
- EndNote


The Arctic is one of the most climate-sensitive regions on Earth, undergoing warming at a rate 2–3 times the global average (Serreze and Barry, 2011; Wendisch et al., 2019) or even higher according to recent estimates (Rantanen et al., 2022). This phenomenon, known as Arctic amplification, has relevant implications for global climate and depends on many factors. One of the main drivers considered is the positive surface albedo feedback (Screen and Simmonds, 2010; Hall, 2004) resulting from the reduction in Arctic sea ice extent (Stroeve et al., 2012; Serreze et al., 2007). Other drivers include atmospheric and oceanic heat transport from the mid-latitudes (Spielhagen et al., 2011), the greenhouse effect of additional water vapour (Graversen and Wang, 2009), and cloud feedbacks (Korolev et al., 2017; Vavrus, 2004; Intrieri et al., 2002). Cloud feedbacks are particularly important for the Arctic climate given the ubiquity of Arctic stratiform clouds and their potential to affect the radiative balance at both the surface and the top of the atmosphere. Among the factors influencing Arctic clouds, ice-nucleating particles (INPs) play a critical role by initiating ice crystal formation, a process that governs cloud phase, optical properties, and lifetime (Murray et al., 2021).
INPs determine the microphysical properties of mixed-phase clouds, which, as has been said, dominate the Arctic atmosphere year-round. These clouds, containing both supercooled liquid droplets and ice crystals, influence surface energy budgets by altering radiation fluxes (Korolev et al., 2017; Morrison et al., 2012). For instance, the presence of ice crystals can increase cloud reflectivity, thereby cooling the surface, or promote precipitation, reducing cloud coverage and enhancing surface warming (Murray et al., 2021; Lohmann and Feichter, 2005). Recently, Carlsen and David (2022) documented the importance of INPs in mixed-phase cloud formation, showing through satellite data that the availability of INPs is essential in controlling cloud phase evolution and that local sources of INPs in the high latitudes play a key role in the formation of such clouds. The complex interplay between INP concentrations, cloud microphysics, and atmospheric dynamics makes their accurate representation in climate models essential for understanding Arctic feedback mechanisms (Storelvmo et al., 2011). Despite their importance, the sources, concentrations, and types of INPs in the Arctic remain poorly characterised, posing significant challenges to accurate climate predictions and contributing significantly to large uncertainties in climate models (Schmale et al., 2021; Murray et al., 2021).
INPs are broadly classified into abiotic and biotic. Within the former category, mineral particles typically dominate below −20 °C (Hoose and Möhler, 2012); K-feldspar and quartz constitute notable exceptions as they can facilitate ice nucleation at higher temperatures (Atkinson et al., 2013; Harrison et al., 2019). In contrast, biotic INPs, including bacteria, fungal spores, and marine biogenic particles, are often more active at warmer sub-zero temperatures (Morris et al., 2014; Murray et al., 2012), even though the ice nucleation efficiency of biotic INPs is highly variable (Kanji et al., 2017). Seawater was also identified as a source of biogenic INPs (Knopf et al., 2011; Wang et al., 2015; Wilson et al., 2015; McCluskey et al., 2017). In the Arctic, marine biogenic INPs, linked to phytoplankton activity and sea spray aerosols, are of particular interest due to their potential to dominate INP activity during the open-water season (McCluskey et al., 2018c; Irish et al., 2017; Ickes et al., 2020; Hartmann et al., 2021; Creamean et al., 2019).
Since the beginning of INP explorations in the Arctic, the ocean has been proposed as a potentially important source of INPs (Bigg, 1996; Bigg and Leck, 2001). More recently, Creamean et al. (2019) showed how biologically derived INPs were transported from deep Bering Strait waters to become airborne over the Arctic Ocean. Hartmann et al. (2021) presented indications that INPs at warmer temperatures (T> −15 °C) are marine and locally emitted, using shipborne measurements close to Svalbard and in the vicinity of the ice edge. Inoue et al. (2021) observed warm and thermo-labile INPs increasing by 1 order of magnitude under high-wave and strong-wind conditions in comparison with the earlier period during an Arctic research cruise in the marginal ice zone in the Chukchi Sea. According to Creamean et al. (2022), warm INPs observed in summertime over the high Arctic were likely to be from biological productivity in open water from the marginal ice zone. Eventually, Porter et al. (2022) associated high concentrations of heat-labile INPs over the North Pole (88–90° N) with air masses originating in the ice-free ocean environment off the Russian coast, with pack ice, open leads, and the marginal ice zone apparently being weaker sources. Other studies have hypothesised that marine sources of INPs may be potentially relevant over the Arctic during summer, though without obtaining conclusive evidence (Sze et al., 2023; Santl-Temkiv et al., 2019).
On the other hand, important terrestrial INP sources have been highlighted in the Arctic by other studies, such as mineral dust from the glacial outwash plains in Svalbard (Tobo et al., 2019) or from Iceland deserts (Sanchez-Marroquin et al., 2020). Regarding biogenic terrestrial INPs, vegetation (Conen et al., 2016), runoff from watersheds (Tobo et al., 2019), and thawing permafrost (Barry et al., 2023; Creamean et al., 2020), together with bacterial productivity (Santl-Temkiv et al., 2019), have been identified as potential sources in the Arctic. Finally, the long-range transport from middle to low latitudes can be a non-negligible source of INPs (Schmale et al., 2021; Vergara-Temprado et al., 2017).
In recent years, several studies have reported INP measurements conducted on the Svalbard islands. Observations were carried out either at Mt. Zeppelin (475 m a.s.l. (metres above sea level); Schrod et al., 2020; Freitas et al., 2023, 2024; Tobo et al., 2024) or at the coastal ground-level site of Ny-Ålesund (Wex et al., 2019; Rinaldi et al., 2021; Pasquier et al., 2022; Li et al., 2022, 2023). Overall, these studies show a consistent picture of INP atmospheric levels, reporting an increase in warm INPs (active at T> −15 °C) during summer, while the corresponding increase for cold INPs (active at T< −15 °C) is generally less pronounced.
However, differences exist regarding the magnitude of this summer enhancement in warm INPs. In several cases, a strong association between summertime warm INPs and fluorescent biological particles has also been reported (Li et al., 2023; Freitas et al., 2023, 2024). The source attribution of these biological INPs remains debated (both in Svalbard and elsewhere), with some studies suggesting a predominantly terrestrial origin (e.g. Tobo et al., 2024), while others point to a marine contribution (e.g. Li et al., 2023). Similarities and differences between the present findings and those reported in the aforementioned studies will be discussed where relevant in the “Results and discussion” section.
Despite the increase in INP observations over the Arctic region in recent years, quantitative insights into the abundance, properties, and sources of INPs in this complex environment remain limited. The present study aims to contribute to the characterisation of Arctic INPs by investigating their concentrations (nINP), annual variability, and potential sources at the sea-level site of Gruvebadet (GVB; Ny-Ålesund, Svalbard). The ice-nucleating efficiency of Arctic aerosol particles is also explored through their activated fraction (AF; Schrod et al., 2020). The dataset analysed here includes 33 samples previously discussed in Rinaldi et al. (2021), together with data from four additional measurement campaigns, for a total of 113 samples collected over 3 years and spanning three seasons – spring, summer, and autumn. All data presented in this work were obtained using the condensation-freezing mode. This mechanism may play a role in Arctic cloud formation, depending on ambient temperature and relative humidity; however, its relevance remains uncertain due to the challenge of distinguishing condensation-freezing processes from immersion-freezing processes, which can sometimes be physically indistinguishable (Wex et al., 2014; Hiranuma et al., 2015).
Compared with previous studies in the Arctic, the present work provides INP observations using an alternative technique to the widely applied cold-stage immersion-freezing approach (see Sect. 2.2). Methodological diversity is valuable as it helps mitigate potential technique-related observational biases. In addition, this study provides size-segregated information on INPs, presenting the ice-nucleating activity of sub-micrometre and super-micrometre particles and their relative contributions to the total INP population across different seasons. Such size-resolved INP data remain extremely scarce in the Arctic, having been reported in only a few previous studies (Mason et al., 2016; Creamean et al., 2022).
Finally, this work contributes to expanding the coverage of ground-level INP observations in Svalbard. To date, year-round or multi-year continuous observations have been available only at the high-altitude Mt. Zeppelin station (Schrod et al., 2020; Freitas et al., 2023; Tobo et al., 2024), while, for Ny-Ålesund, only campaign-based measurements have been reported. Therefore, any effort to enhance data coverage at this sea-level site – potentially more affected by local sources such as nearby seawater – should be considered to be highly valuable to the scientific community.
2.1 Aerosol sampling for offline INP analyses
Aerosol particle sampling was performed at the GVB observatory, located in proximity to the village of Ny-Ålesund (78°55′ N, 11°56′ E) on Spitsbergen, Svalbard. The observatory is located about 1 km southwest of the village, at 40 m a.s.l. Given the prevailing southerly winds, such a location guarantees minimal influence by local pollution sources (Udisti et al., 2016).
Aerosol sampling occurred during six intensive campaigns covering 3 years. In the present work, we define the seasons following Creamean et al. (2022): March to May – spring; June to August – summer; September to November – autumn. Two campaigns were held in 2018, one in spring (from 17 April to 2 May) and one in summer (from 11 to 27 July). The results of these first two campaigns have been extensively discussed in Rinaldi et al. (2021). Three campaigns were carried out in 2019, one in spring (12–23 April), one in summer (5–20 July), and a longer one in autumn, covering from 4 October to 24 November. This last campaign occurred concurrently with a larger INP investigation effort (the NASCENT campaign) which was described in Pasquier et al. (2022) and Li et al. (2023). Eventually, one last campaign occurred in autumn 2020 (15–26 September). In total, 113 samples were collected and analysed: 28 in spring, 33 in summer, and 52 in autumn. No sampling could be conducted during winter due to logistical constraints. Therefore, throughout the text, any reference to seasonal cycles should be understood as describing the evolution of INP properties from spring through autumn, with winter being excluded.
Throughout all measurement campaigns, aerosol particles were sampled using nitrocellulose membrane filters (Millipore HABG04700, nominal pore size 0.45 µm) mounted in two parallel inlet systems: one configured with an aerodynamic size selector for sub-micrometre particles (PM1) and the other for collecting particles with an aerodynamic diameter below 10 µm (PM10; cut point in accordance with EN 12341, TCR Tecora). Both sampling lines operated at 38.3 (±2.0) L min−1. The height of the sampling inlets was set to about 5 m a.g.l (metres above ground level).
Two samples per day – one from each inlet system – were collected, with each sampling event lasting 3 h. This short collection period was chosen to prevent particle overload on the filters. Given the need to coordinate with other scheduled activities at GVB, sampling could not be performed at the same time during all campaigns. Specific information on the sampling intervals is provided in Table S1 in the Supplement. The relatively short sampling durations may have introduced biases into the quantification of INP levels during the single campaigns and, consequently, into the estimation of their seasonal variability. However, analyses of continuous particle number concentrations (not shown here) did not reveal pronounced diurnal patterns, suggesting that potential biases arising from the variable sampling times were likely to be minimal.
An additional limitation of this study stems from the fact that measurements did not cover entire seasons but were instead confined to short-term campaigns. This limits our ability to capture intra-seasonal variability and may, in turn, affect the robustness of the derived seasonality. Rinaldi et al. (2021) compared short-term campaign measurements with immersion-freezing data continuously collected from April to late July 2018. Although both approaches yielded broadly consistent descriptions of INP seasonality, the extended temporal coverage of the immersion-freezing observations captured variability that could not be resolved using campaign-based Dynamic Filter Processing Chamber (DFPC) data alone. For this reason, we clarify that, in the following discussion, spring refers primarily to samples collected in April and summer to those collected in July, while autumn encompasses a broader temporal range, extending from September to November.
2.2 INP measurements by the Dynamic Filter Processing Chamber
All samples, stored at ambient temperature until analysis, were examined using the membrane filter technique with a Dynamic Filter Processing Chamber (DFPC), as described in Santachiara et al. (2010) and Rinaldi et al. (2017), within approximately 6 months of collection. Prior to analysis, each filter was mounted on a 5.5 cm diameter, 0.5 mm thick metal plate coated with a smooth paraffin layer to ensure good thermal contact. The paraffin was briefly flash-heated to 70 °C for less than 5 s and rapidly cooled to fill the filter pores.
A replica of the Langer chamber (Langer and Rodgers, 1975), housed in a refrigerated enclosure, was used to determine the concentration of ice-nucleating particles (nINP) at various temperatures (T). Particle-free air entered the chamber through a perforated plate and flowed over an ice bed, becoming saturated with respect to ice but remaining undersaturated with respect to water. The air then passed over the sample filter, which was cooled by a Peltier device in thermal contact with the metal support plate. Supersaturation with respect to water occurred only at this stage. Measurements occurred in condensation-freezing mode at a supersaturation with respect to water (Sw) of 1.02 at three temperatures (T): −15, −18, and −22 °C. Ice nucleation was visually evaluated by counting the number of ice crystals growing on individual aerosol particles on the sampled filter illuminated by a visible light source. Subsequently, the atmospheric concentration of INPs was obtained by dividing the number of crystals on the filter by the air volume sampled through the filter. The uncertainty in the DFPC-based INP assessment was estimated following Belosi et al. (2018) and Rinaldi et al. (2021) and resulted to be around ±30 %. The instrumental background was evaluated by analysing blank filters under the same conditions as the samples (Table S2). All the measurements were corrected for the filter background by subtracting the mean background value, and the contribution of the filter background variability was integrated into the evaluation of the overall nINP measurement uncertainty by error propagation.
2.3 Complementary measurements and analyses
2.3.1 Meteorology
Meteorological parameters (T, pressure, relative humidity, wind speed) were provided by the Amundsen-Nobile Climate Change Tower positioned less than 1 km NE of GVB (Mazzola et al., 2016), while precipitation data (type and amount, measured in the centre of Ny-Ålesund by the Norwegian Meteorological Institute) were taken from the eKlima database, provided by the Norwegian Meteorological Institute (https://seklima.met.no/observations/, last access: 21 September 2022).
2.3.2 Black carbon and particle size distribution measurements
Evaluations of equivalent black carbon (BC) were obtained at GVB through continuous online measurements carried out by means of a three-wavelength particulate soot absorption photometer (PSAP, Radiance Research) (Bond et al., 1999) operating at 467, 530, and 660 nm at a nominal flow rate of 1 L min−1. The PSAP sampled air through the station's total suspended particulate (TSP) inlet. Details on the data treatment and corrections can be found in Gilardoni et al. (2023).
The aerosol particle number size distribution was continuously monitored at the GVB station using a scanning mobility particle sizer (SMPS, TSI 3034; 10–500 nm, 54 channels) and an aerodynamic particle sizer (APS, TSI 3321; 0.5–20 µm). Both instruments operated in parallel through a common TSP inlet, providing 10 min averaged data (Giardi et al., 2016; Lupi et al., 2016). APS aerodynamic diameters were converted into volume-equivalent diameters assuming a mean particle density of 1.95 g cm−3 (Lisok et al., 2016) and a dynamic shape factor of 1. In the overlapping size range, SMPS data were used, and the combined SMPS–APS counts provided total particle number concentrations. For comparison with nINP and AF calculations, 10 min data were averaged over each filter sampling interval. The APS was offline during September 2020; therefore only the sub-micrometre size distribution was available for that period.
2.3.3 Air mass back-trajectories
For each of the 113 samples collected throughout the six campaigns, two air mass back-trajectory (BT) tracks were calculated (one at start of the sampling time and the other at the end of it). The BTs from the National Oceanic and Atmospheric Administration (NOAA) Hybrid Single-Particle Lagrangian Integrated Trajectory (HYSPLIT) model (HYSPLIT4 with GDAS data: https://ready.arl.noaa.gov/, last access: 21 September 2022) (Stein et al., 2015; Rolph et al., 2017) were simulated for an altitude of 100 m a.g.l. at the GVB station with hourly backward time steps of up to 5 d (120 h).
2.3.4 Satellite ground type maps and ground type contribution calculation
Ground condition maps were obtained from the National Snow & Ice Data Center (NISDC; https://nsidc.org/, last access: 28 May 2022) Interactive Multisensor Snow and Ice Mapping System (IMS) (Helfrich et al., 2007; National Ice-Center, 2008) at a 4 km spatial resolution. The ground types considered are “seawater”, “sea ice”, “land”, and “snow”. Seawater indicates that the air mass travelled over the open ocean, while sea ice indicates passage over ice-covered waters. The land category represents air masses passing over land without snow cover, whereas snow denotes passage over snow-covered land.
For each BT endpoint (see Sect. 2.3.3), we identified the corresponding ground type, considering only BTs that travelled at altitudes within the boundary layer height; such height was extracted from the ECMWF-ERA5 dataset (Hersbach et al., 2020). Combining the information obtained along the entirety of the BTs allowed for the estimation of the contribution of each ground type to each INP sample.
2.3.5 Satellite chlorophyll-a data and correlation analysis
Similarly to Rinaldi et al. (2021), satellite-retrieved chlorophyll-a fields were used to track the evolution of oceanic biological activity in the Arctic Ocean during the measurement periods. The best-estimate “cloud-free” (level-4) daily sea surface chlorophyll-a concentration (CHL) data were downloaded from the EU Copernicus Marine Environment Monitoring Service (CMEMS; http://marine.copernicus.eu/, last access: 30 May 2022). The data product is available globally at a ∼ 4 km spatial resolution. From this global dataset, CHL fields were extracted in the Arctic Ocean during the campaign periods to be merged with INP data.
Recently, Mansour et al. (2020b) reported that nINP concentrations over the North Atlantic Ocean follow patterns of marine biological activity. To investigate the relationship between INPs and phytoplankton biomass (traced by CHL), daily DFPC samples were treated as individual days and compared with daily CHL time series after selecting the samples more representative of marine sources (see Sect. 3.4.2). Pearson correlation coefficients between INPs and satellite-derived ocean colour data were calculated via least-square regression at each grid point in the Arctic domain across different time lags, generating the correlation maps shown in the “Results and discussion” section.
2.3.6 Concentration-weighted trajectory model
The concentration-weighted trajectory (CWT) method was used to determine the most probable source regions contributing to INP samples at GVB. For each sample, two BT tracks, one at the start and one at the end of the sampling period, were analysed to represent the pathways of incoming air masses. A comprehensive explanation of the applied equation and calculation procedures is available in Rinaldi et al. (2021). The trajectories were traced back over a 5 d period, with data points recorded at 1 h intervals along each track.
2.3.7 Statistical data treatment
In this study, linear relationships between measured ambient variables were tested by the Pearson correlation method. Regressions with correlation coefficients (R) overpassing the critical threshold for a confidence interval of 95 % (p<0.05) were considered to be statistically significant. In the tables throughout this paper, non-statistically significant R values with p<0.1 are also evidenced.
Considering the fact that INP concentration datasets often exhibit non-normal distributions, the statistical significance of differences between INP datasets was assessed using the Wilcoxon–Mann–Whitney non-parametric test, which does not assume normality. The selected threshold for significance was that corresponding to a confidence interval of 95 % (p<0.05). A comparison with the standard t test shows consistency in terms of the significance test outcomes for 85 % of the cases, suggesting that the assumption of normality was reasonably satisfied in most cases. For other types of data for which normality is usually assumed (e.g. particle number concentration data), the standard t test was used with the same threshold (p<0.05).
3.1 INP concentration and activated fraction at GVB
Figure 1 shows the overall nINP range observed at the GVB station across the six campaigns described above (2018–2020), while the time series of nINP for each campaign are available in Figs. S1 and S2. In the PM10 size range, nINP ranges from 3.5 to 315.1 m−3 (median of 76.2), from 4.0 to 289.0 m−3 (median of 35.5), and from 0.3 to 193.3 m−3 (median of 14.3) at T= −22, −18, and −15 °C, respectively. Compilations of ground-level Arctic nINP data can be found in Rinaldi et al. (2021) and Li et al. (2022); more recent data collections have also been presented by Yun et al. (2022) and Conen et al. (2023). According to these data compilations, the overall range of nINP in the Arctic, in the T range between −15 and −22 °C, is roughly between 10−1 and 103 m−3, encompassing the totality of our data. It should be noted, however, that comparison with these past studies is only qualitative given the great variability in the parameters that may influence the measurement of nINP (e.g. different instruments, locations, season, weather conditions, aerosol particle size distribution, ice nucleation mode).
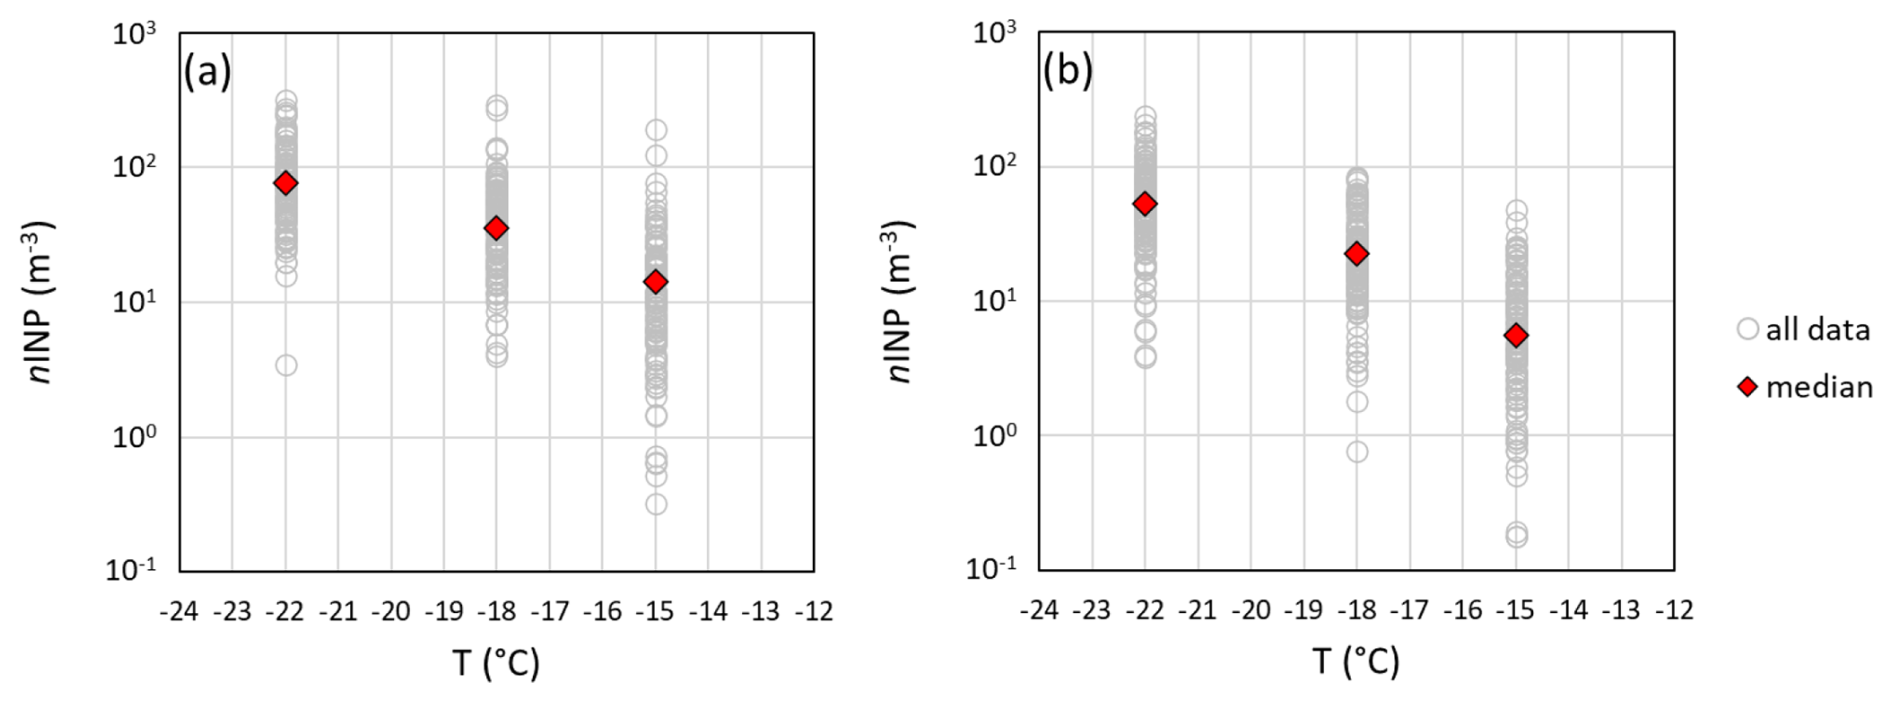
Figure 1nINP as a function of the activation T from the six campaigns at GVB (data distribution and median values). (a) PM10 size range. (b) PM1 size range.
In terms of activated fraction (AF), that is, nINP scaled over the total particle number concentration in the 0.1–10 µm size range, the observed variability at GVB at T= −22 °C ranges between 9.9 × 10⁻⁸ and 2.3 × 10⁻⁵ (median of 2.4 × 10⁻⁶; Fig. 2). At T= −18 °C, AF ranges between 5.8 × 10⁻⁸ and 1.7 × 10⁻⁵ (median of 1.3 × 10⁻⁶), while at T= −15 °C, it ranges between 9.0 × 10⁻⁹ and 7.4 × 10⁻⁶ (median of 4.5 × 10⁻⁷). Time-resolved AF values for each campaign can be found in Fig. S3.
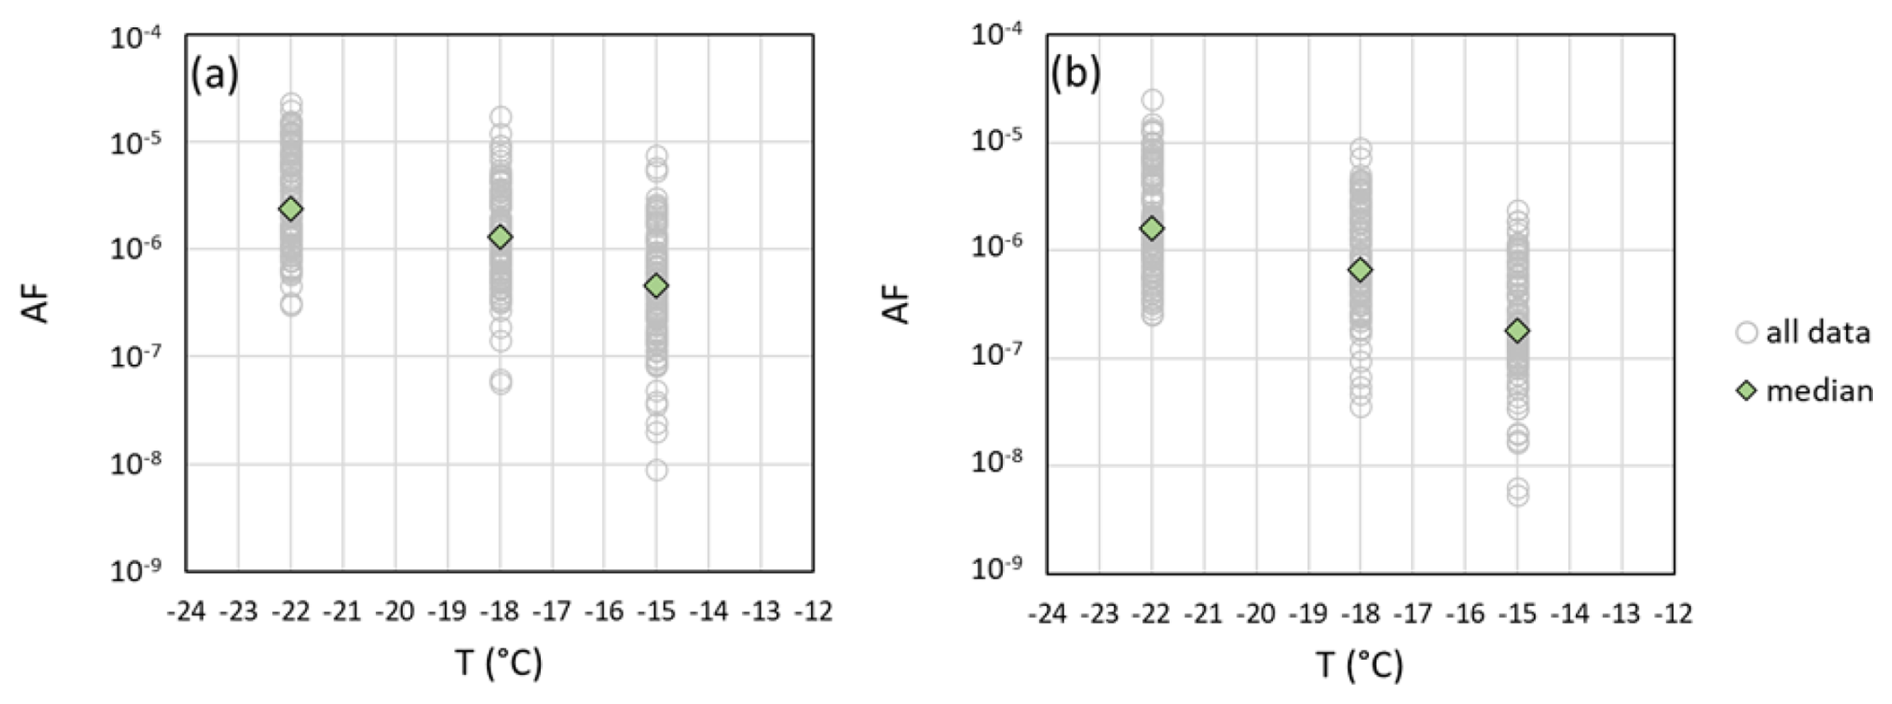
Figure 2Atmospheric aerosol AF as a function of the activation T from the six campaigns at GVB (data distribution and median values). (a) PM10 size range. (b) PM1 size range.
Li et al. (2023) recently reported aerosol particle AF data at T= −15 °C, obtained by immersion-freezing measurements at the GVB station. Their sampling was performed concurrently with one of the campaigns included in the present study (autumn 2019). The AF values reported at −15 °C (3 × 10⁻⁷–2 × 10⁻⁴) are 1 to 2 orders of magnitude higher than those observed here. This difference mainly reflects the distinct operational definitions of AF applied in the two studies: Li et al. (2023) normalised nINP by the total particle number concentration above 500 nm, which results in lower total particle counts and, thus, higher AF values. A quantitative comparison of AF values calculated in this study using both lower size cuts with those from Li et al. (2023) is presented in Table S3.
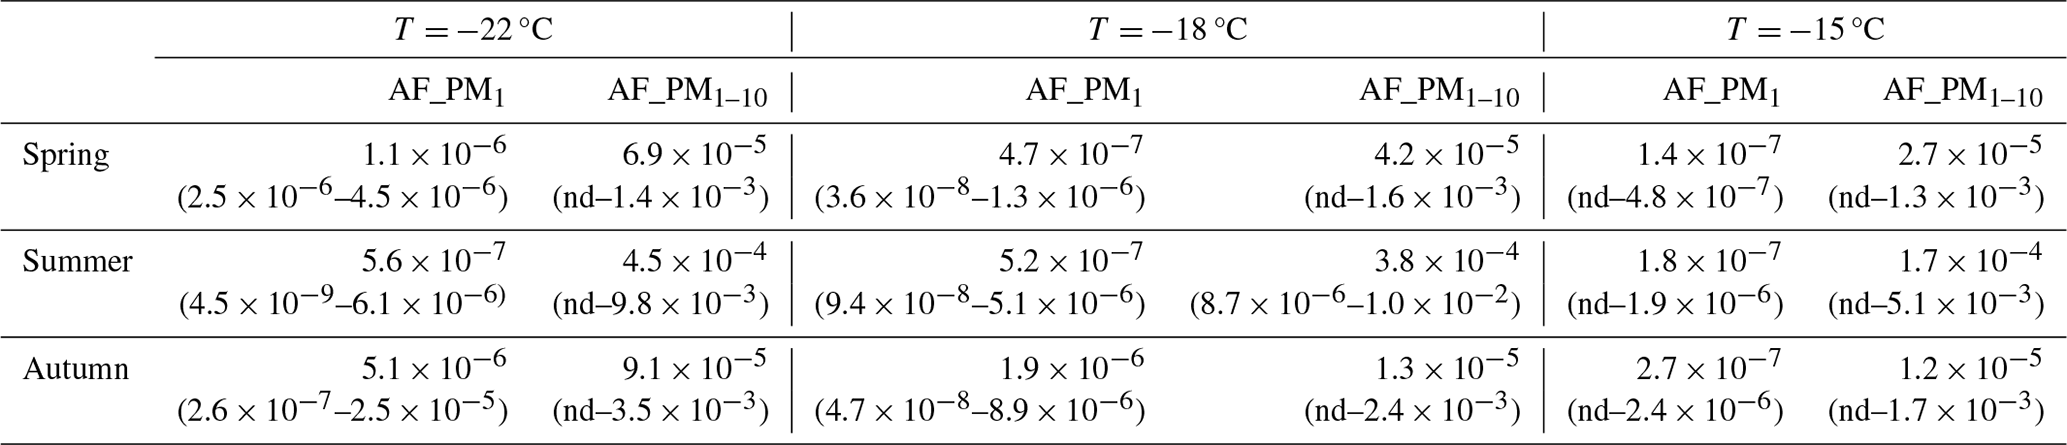
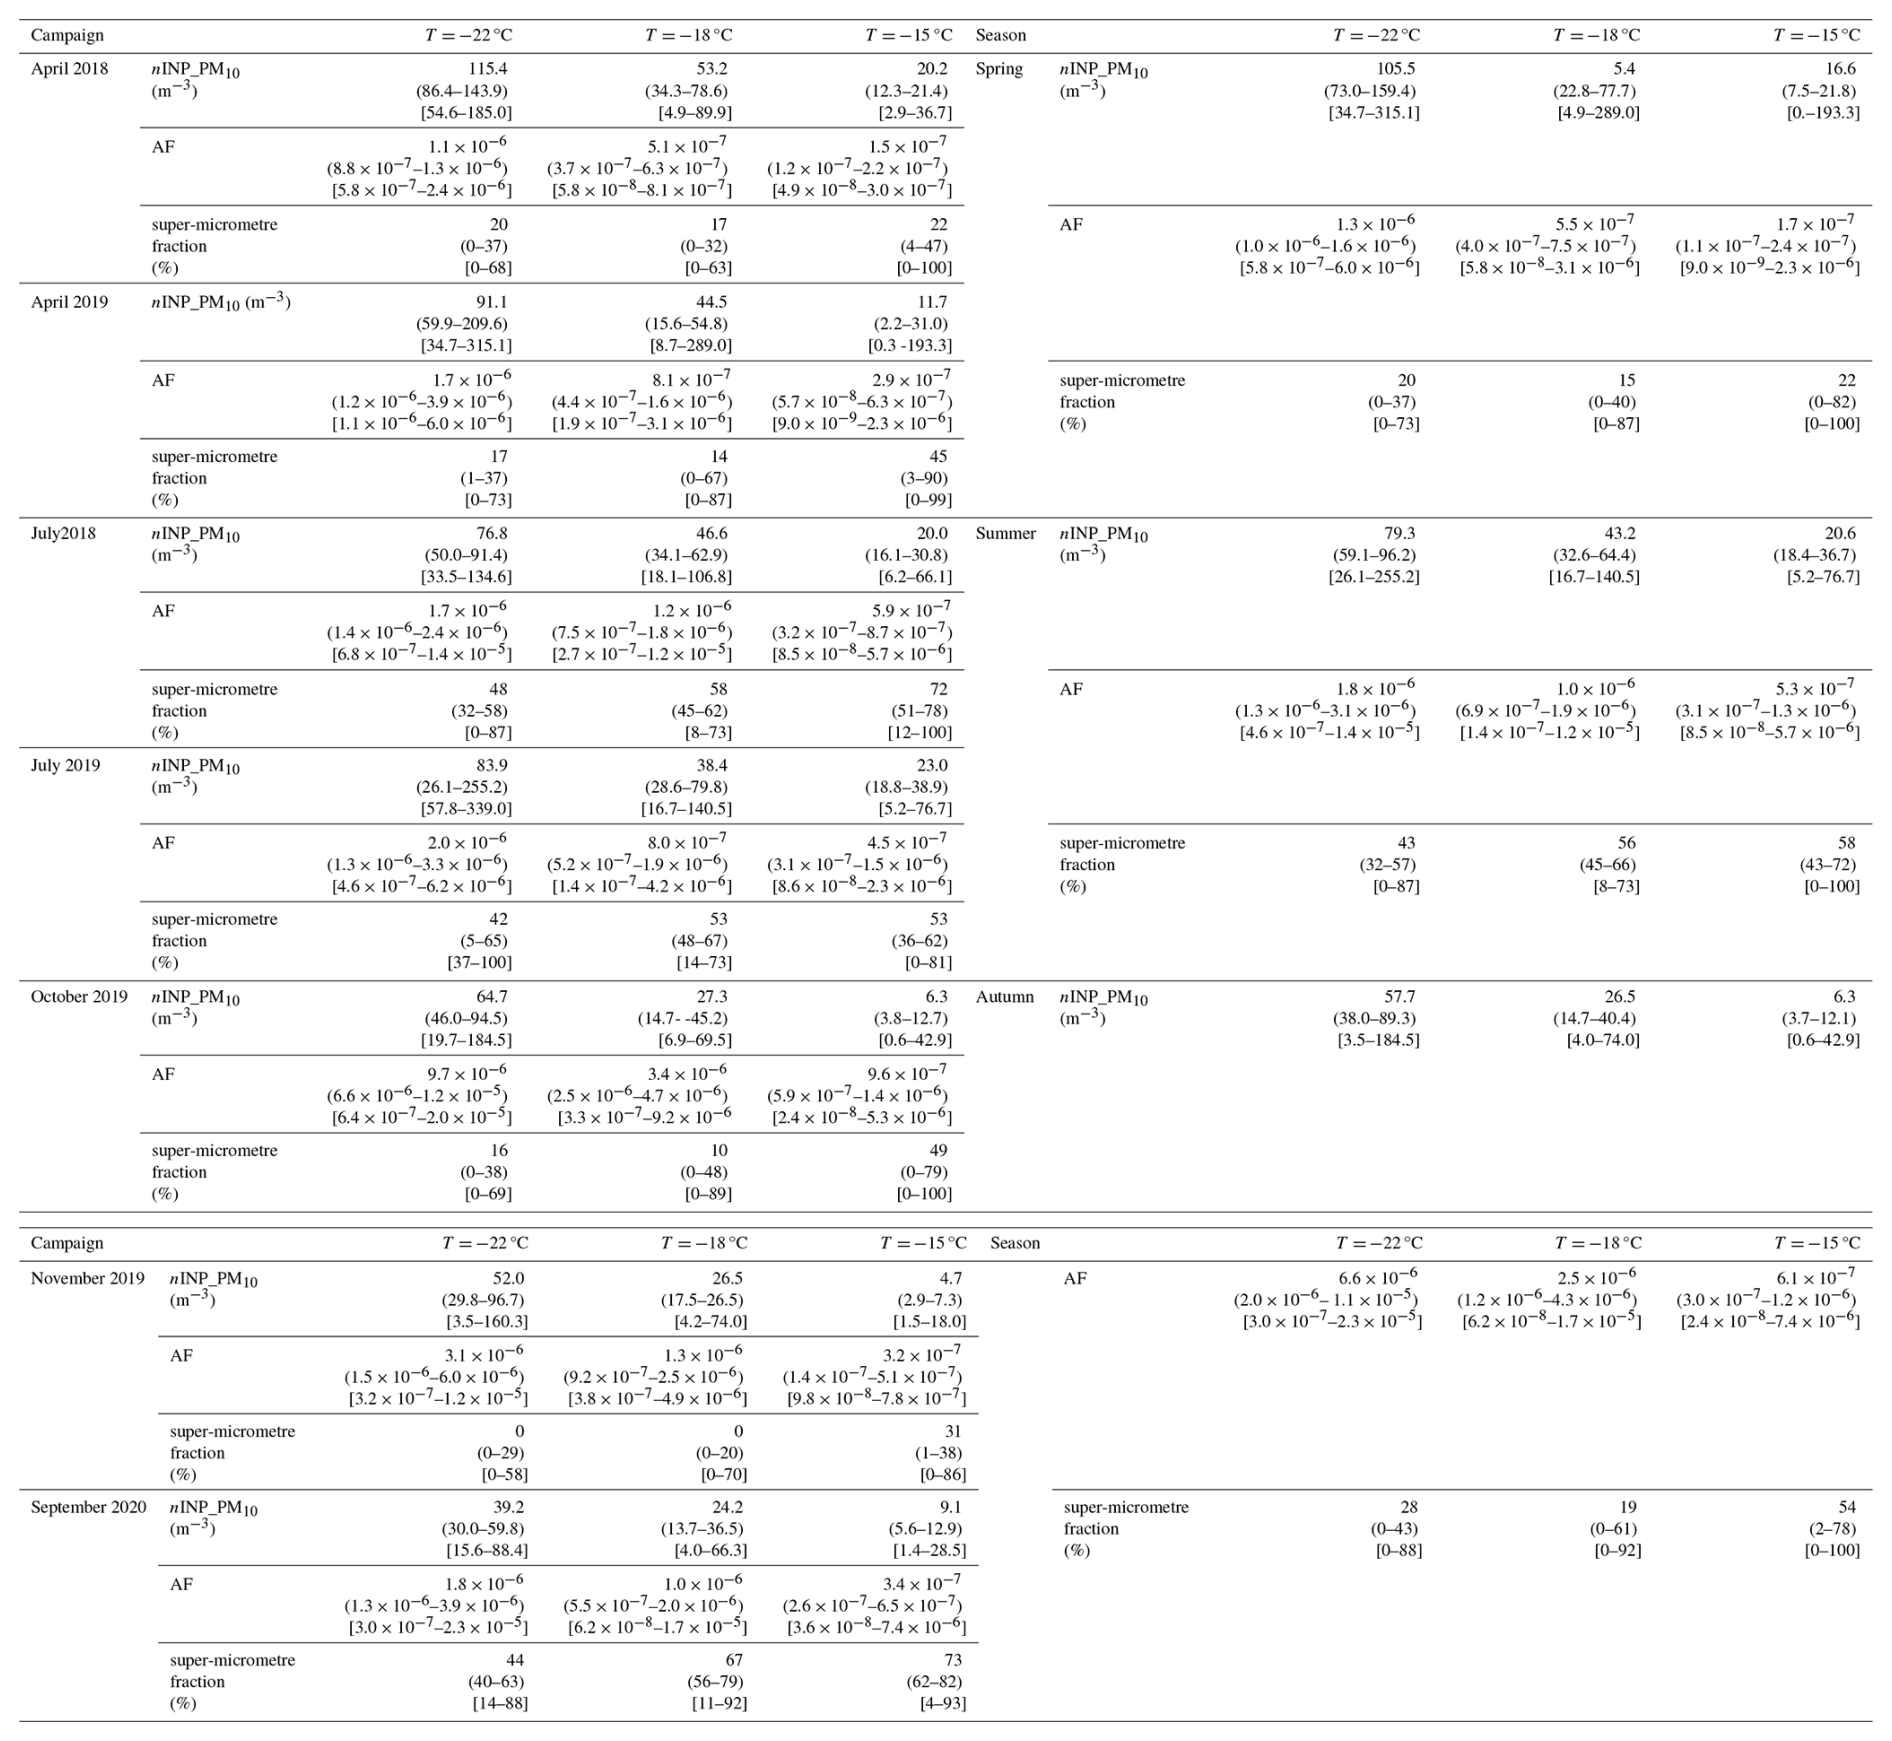
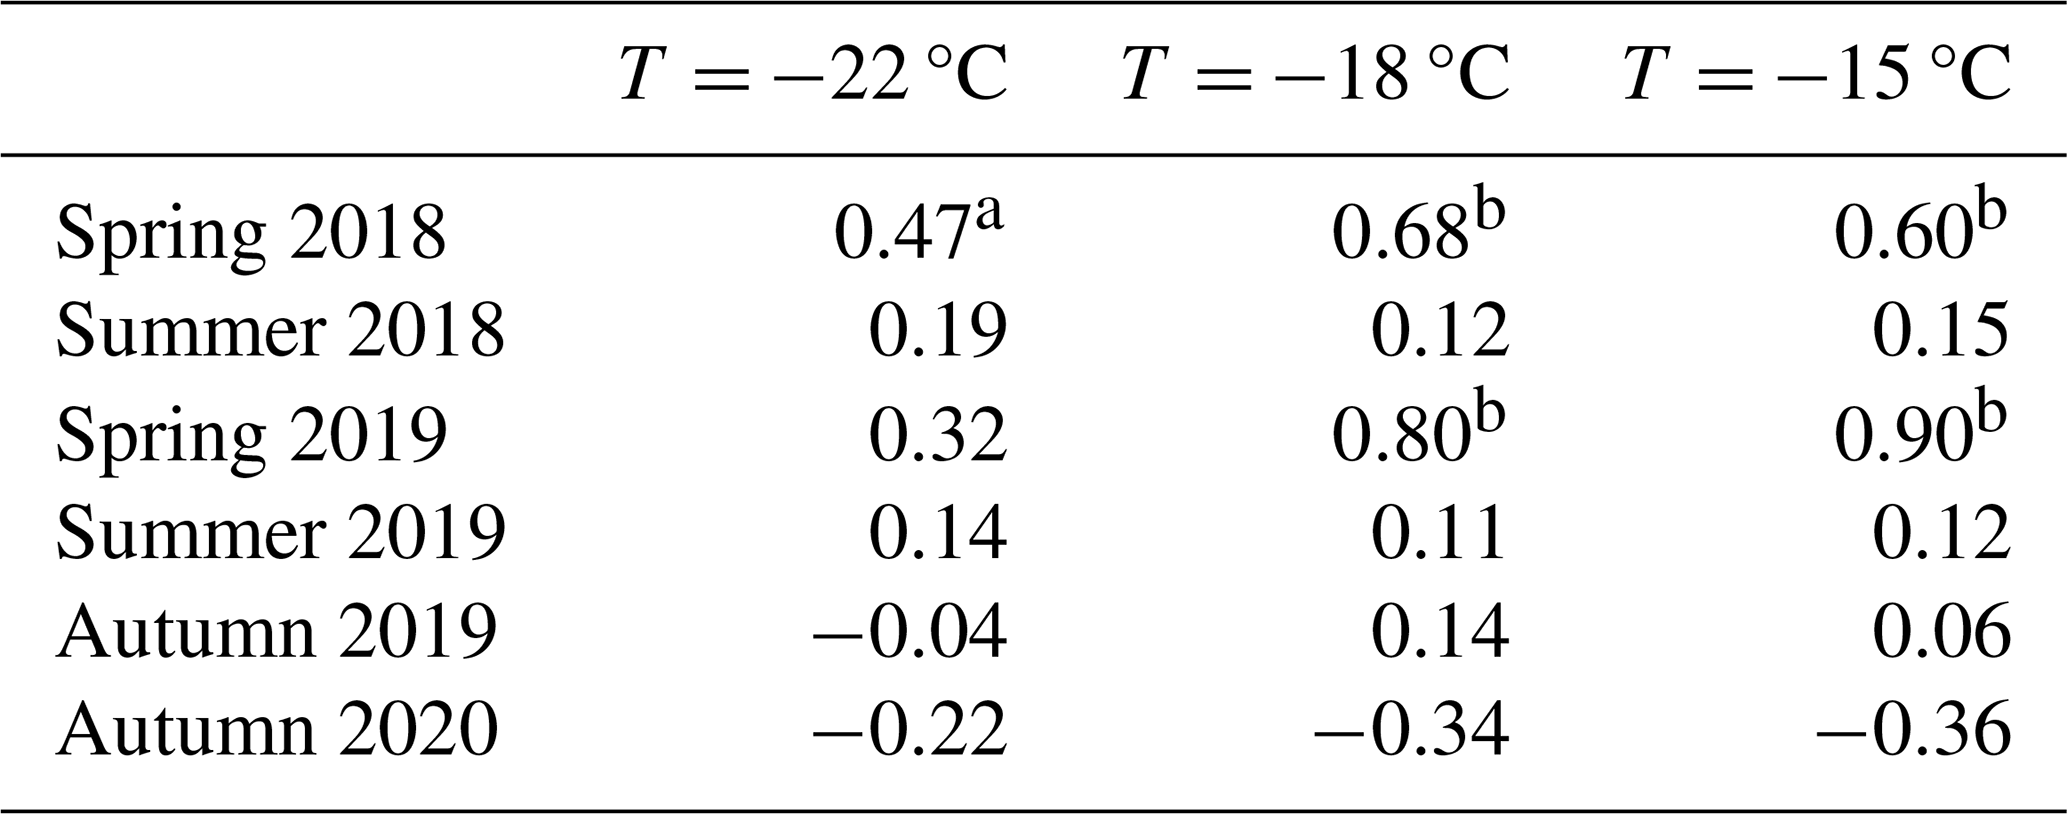
Size wise, we report a markedly higher AF for super-micrometre INPs compared to for sub-micrometre ones (Table 1), with the ice nucleation ability of the former being increased by 1 to 3 orders of magnitude. The AF difference between super- and sub-micrometre particles is higher in summer with respect to the other seasons and at T= −15 °C with respect to the colder probed T values. A higher ice-nucleating efficiency for super-micrometre particles with respect to sub-micrometre ones is typically observed in INP measurements (Kanji et al., 2017; Mitts et al., 2021).
Table 1Median (min–max range) AF observed for sub-micrometre (PM1) and super-micrometre (PM1–10) particles in the different seasons. Note that “nd” denotes not detected.
3.2 Seasonal evolution of ice-nucleating properties
3.2.1 nINP
Figure 3 shows the seasonal evolution of nINP (PM10 size range) reconstructed considering the results of the six campaigns. As the autumn 2019 campaign lasted almost 2 months, in the analysis, these were considered to be two separate periods, with one representing the month of October and the other representing the month of November. The assumption that the seasonality of INP parameters can be investigated by merging the results of campaigns performed over different years might be questioned; nevertheless, we evidence a very good agreement of the data distributions for the same season over different years (Table S4). In detail, comparing corresponding periods over different years (e.g. April and July 2018 vs. April and July 2019), median INP concentrations are consistent within 30 % for the majority of T values, with the only exception being T= −15 °C in spring, though the difference is not larger than 73 %. Likewise, no statistically significant differences were evidenced in this comparison. This supports the assumption that our six campaigns provide a representative picture of the seasonal evolution of aerosol INP properties at the study location during the period of 2018–2020. Table 2 presents summary statistics for both the individual campaigns and the seasonally grouped datasets.
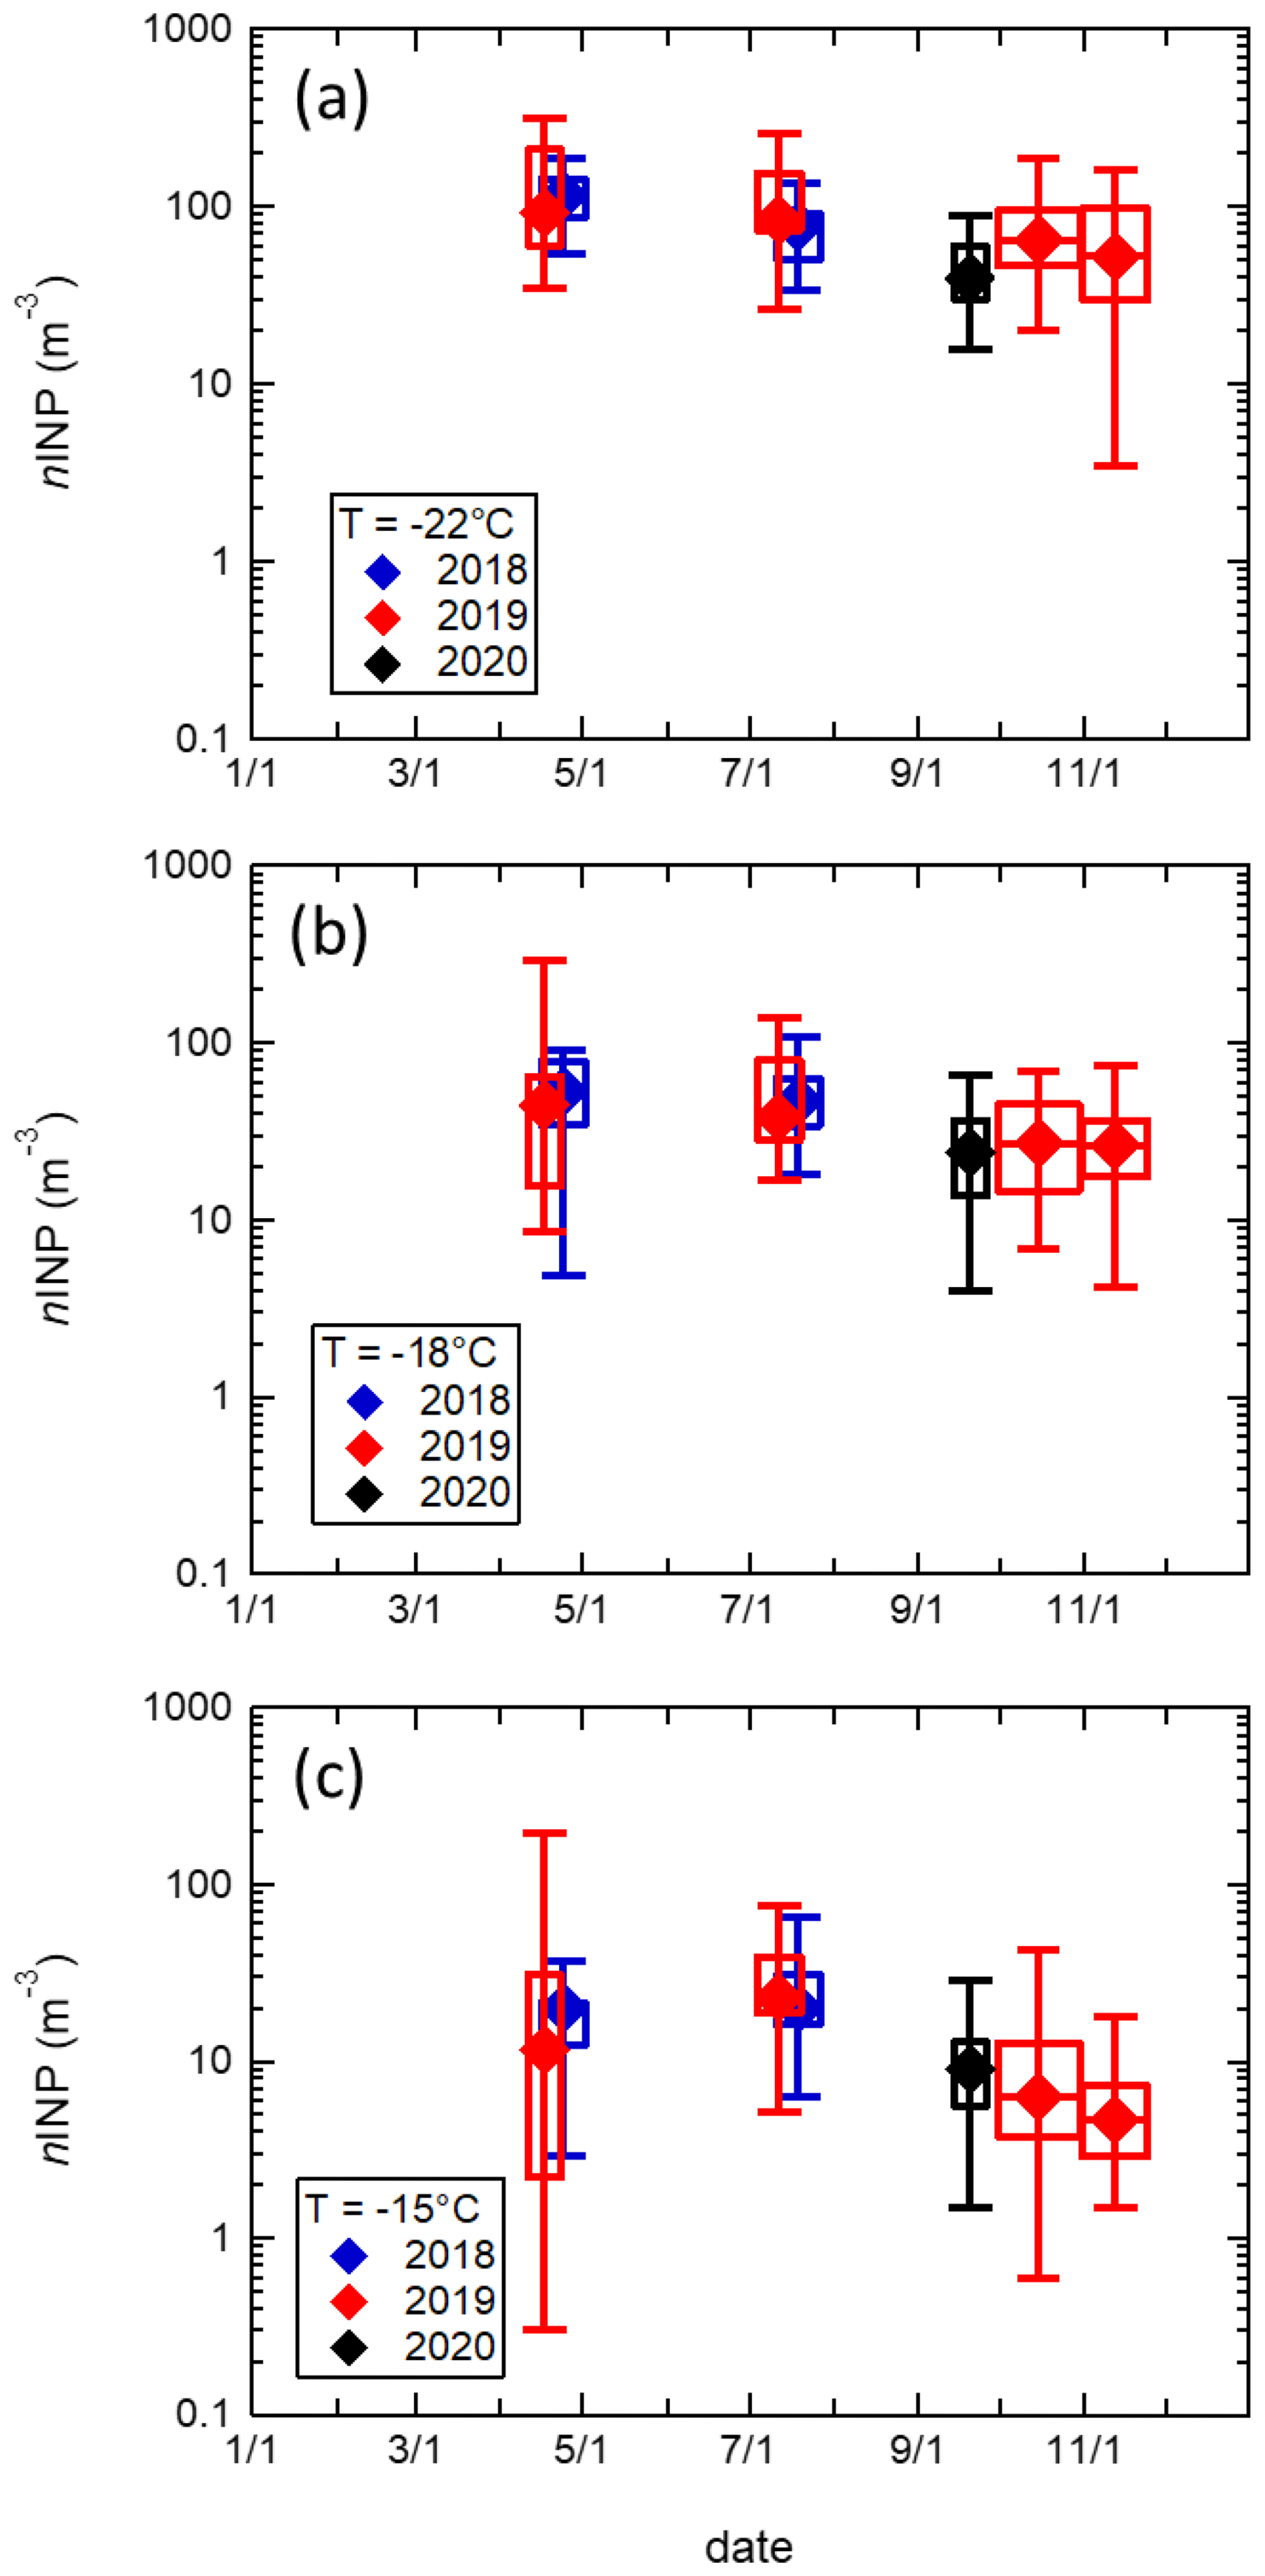
Figure 3Seasonal variation of nINP in the PM10 size range: (a) T= −22 °C, (b) T= −18 °C, and (c) T= −15 °C. The diamonds indicate the median value, the box represents the interquartile range, and the whiskers represent the min–max range. The width of the box indicates the time span of each measurement period.
Table 2Summary statistics for both of the individual campaigns and the seasonally grouped datasets. Each cell reports the median value, the interquartile range in parentheses, and the minimum–maximum range in square brackets.
In terms of the seasonal evolution of nINP, different features can be observed for the three considered activation temperatures. At T= −22 and −18 °C, we do not observe statistically significant differences between the INP levels in spring and summer; nevertheless, we report a slightly higher median nINP in spring at both T= −22 °C (by 1.3 times) and T= −18 °C (by 1.2 times). Conversely, autumn is characterised by a significant reduction in INP levels (p<0.05) with respect to spring and summer. The spring-to-autumn median nINP reduction is 1.8 and 1.9 times at T= −22 and −18 °C, respectively. At T= −15 °C, instead, it is possible to observe a statistically significant (p<0.05) summertime increase in nINP: the median summertime nINP is 1.2 and 3.3 times higher than the spring and autumn ones, respectively. In brief, our data show a modest summertime nINP increase for warm INPs (T= −15 °C, in our case), while cold ones (T= −22 and −18 °C) do not seem to be affected by the expected increase in local sources during summertime, after snow and sea ice melting, and instead show a modest decline after springtime. In any case, independently of their direction, seasonal variations in nINP are lower than the day-to-day variability observed within each campaign.
A strong seasonal variation in nINP, with maxima in summertime and concentrations over 1 order of magnitude higher than in the other seasons, has often been reported for the Arctic environment (Santl-Temkiv et al., 2019; Wex et al., 2019; Tobo et al., 2019). Recently, Creamean et al. (2022) confirmed these findings by means of ship-borne measurements in the high Arctic, evidencing a remarkable increase in June and July with respect to the rest of the year for INPs active at T> −15 °C. Similarly, Sze et al. (2023) reported a summertime increase in nINP from 2 years of continuous measurements at Villum station in northern Greenland. In detail, the reported increase was ∼ 4 times at T= −15 °C and ∼ 1.4 times at T= −22 °C. In both studies, the seasonality was driven by the summertime enhancement of warm INPs (active at T> −15 °C), attributed to local biological sources of marine (Creamean et al., 2022) or combined marine and terrestrial (Sze et al., 2023) origin. A common finding across all of these studies is that the difference in nINP between summer and the rest of the year diminishes with decreasing activation temperature. According to Sze et al. (2023), this trend is attributed to a persistent background of mineral dust particles (active at T< −15 °C) present in the Arctic throughout the year, which progressively obscures the summertime increase at colder temperatures. This is in line with the findings presented here as our GVB data also show a summertime increase, even though this is less evident than in other works, for warm INPs (T= −15 °C) and not for colder ones (T= −18 and −22 °C). An explanation for this could be that Ny-Ålesund is characterised by a higher cold INP background than other locations, maybe because of the relatively low latitude, which is able to mask the nINP seasonal trend at T= −18 °C, a temperature at which it is instead evident over the high Arctic (Creamean et al., 2022), and to reduce the extent of the summertime increase at T= −15 °C as well. This would also explain why a negligible seasonal trend was reported by Schrod et al. (2020) from multi-year measurements performed at Zeppelin station on the peak overlooking GVB station (475 m a.s.l.). In fact, they report INP measurements at T= −20 °C and lower, which probably hindered the appreciation of the summertime nINP increase. Nevertheless, this hypothesis does not reconcile the discrepancy between our results and those of Wex et al. (2019), which showed a summertime increase in INPs by 1 order of magnitude or more at the same GVB sampling location, even though these results are based on a much smaller dataset.
3.2.2 Activated fraction
The seasonality of aerosol particle AF, as shown by Fig. 4, is not in phase with that of nINP, being generally characterised by a constant increase from spring to autumn. Furthermore, the seasonal variation of AF is stronger than that of nINP: at T= −22 °C, the median AF passes from 1.3 × 10⁻⁶ in spring to 6.6 × 10⁻⁶ in autumn (increase of 5.2 times), with the autumn data being significantly higher than both spring and summer levels (p<0.05). At T= −18 and −15 °C, similar increases of 4.5 and 3.7 times, respectively, are reported from spring to autumn.
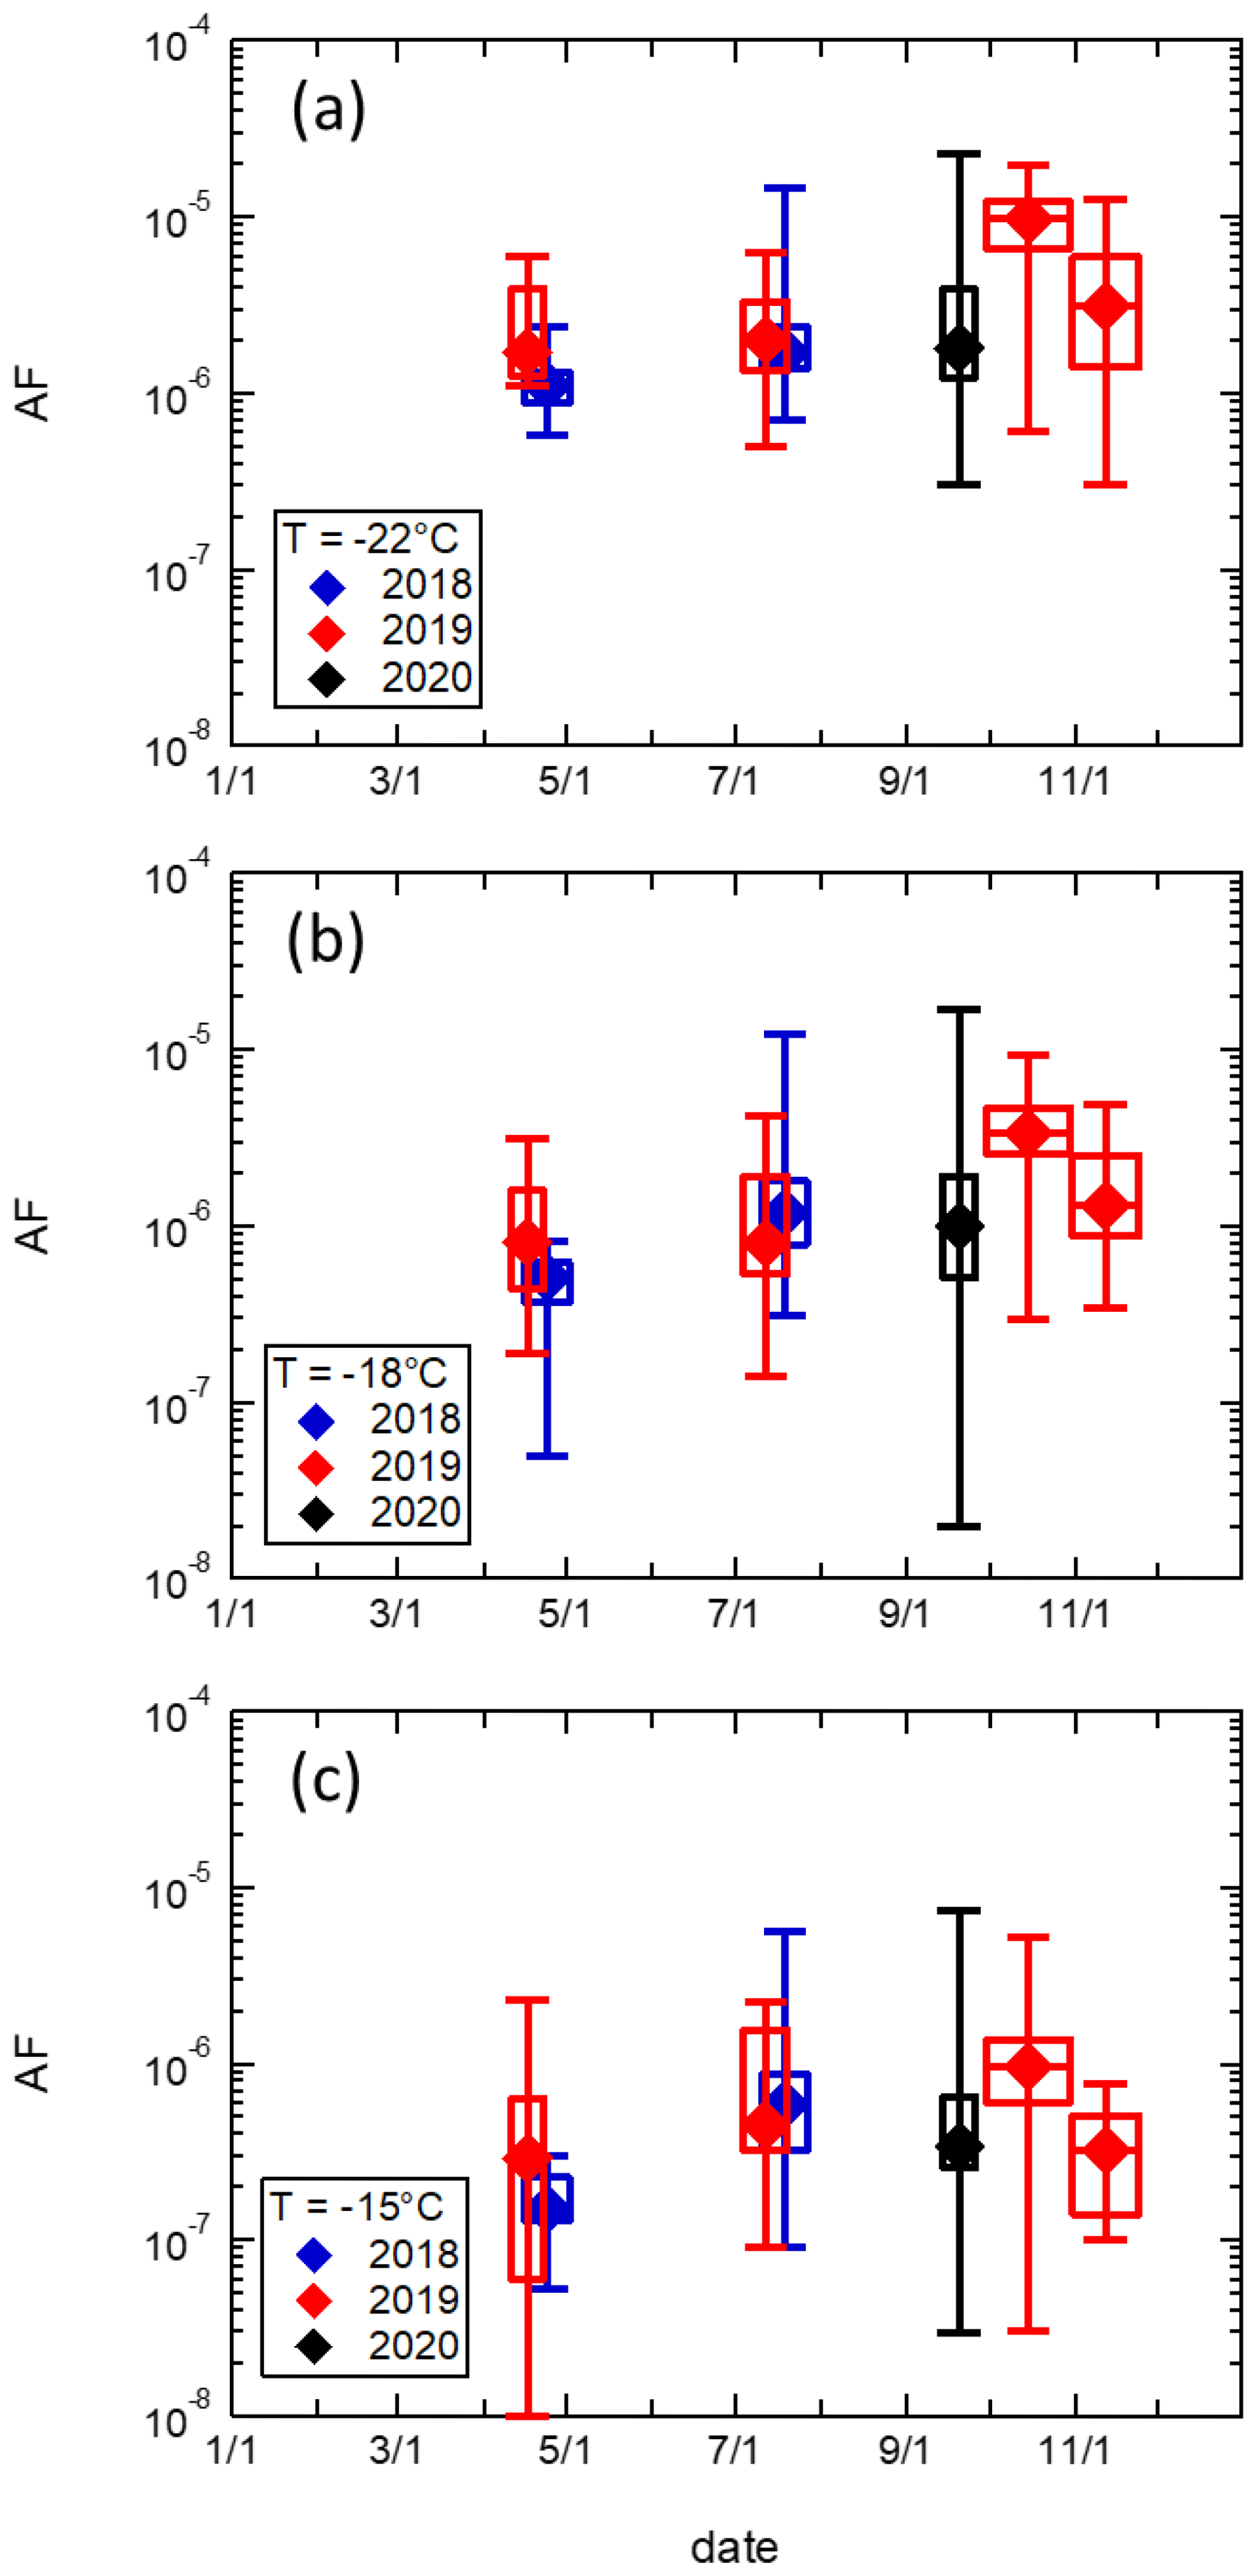
Figure 4Seasonal variation of the AF of aerosol particles in the PM10 size range: (a) T= −22 °C, (b) T= −18 °C, and (c) T= −15 °C. The diamonds indicate the median value, the box represents the interquartile range, and the whiskers show the min–max range. The width of the box indicates the time span of each measurement period.
This spring-to-autumn increase in the AF is mainly due to a significant reduction in the particle number concentration in the 0.1–10 µm range, passing from spring to autumn (p<0.05) (Fig. S4). Such a decrease has a higher magnitude than any eventual nINP increase discussed above. Indeed, the median particle number concentration shows a decrease of about 3 times from spring to summer and almost 1 order of magnitude from spring to autumn. The relatively strong seasonal increase in the aerosol particle AF suggests that aerosols at GVB are constituted by particles with different properties and, in particular, different ice nucleation efficiency in the different seasons.
Multiple processes are probably responsible for the observed AF seasonal trend, including the formation of secondary aerosol through new particle formation (NPF). Secondary aerosol particles may not contribute significantly to INPs (Kanji et al., 2017), but their presence in the aerosol particle population likely lowers the estimated AF. Song et al. (2022) provided a description of the seasonal evolution of aerosol sources and of the resulting particle number and volume distributions at GVB based on measurements performed between March and October 2015. They showed that the particle number distribution is dominated by accumulation-mode anthropogenic secondary aerosols in spring, while particle nucleation and biogenic secondary aerosols are more important in summertime, starting from May. Super-micrometre-mode particles peak in spring and autumn and are mainly contributed by sea spray and blowing snow, with only a minor contribution from mineral particles. Similarly, Dall'Osto et al. (2019) showed that the production of fresh particles is frequent during the period from May to August at GVB, while April is characterised by the presence of aged, accumulation-mode particles. These seasonal patterns may contribute to explaining the observed seasonal variation of the estimated AF. In springtime, the low AF could be explained by the lower ice-nucleating ability of anthropogenic long-range-transported fine aerosols from lower latitudes (Hartmann et al., 2019). Conversely, in summer, notwithstanding the higher nINP observed at T= −15 °C, we do not observe a maximum in AF as the likely higher abundance of non-ice-nucleating particles from local NPF, and growth keeps the AF at lower levels than in autumn. Finally, the reduction in secondary particles observed in autumn, probably due to the lower radiation characterising that period, determines the enhancement of the AF observed in autumn, even though the absolute nINP tends to decrease with respect to summer.
3.2.3 Super-micrometre INP contribution
The strongest seasonal trend in INP properties was observed in the contribution of super-micrometre INPs (Fig. 5), calculated as the difference between nINP in the PM10 and PM1 size ranges, normalised for nINP in the PM10 size range. Super-micrometre INPs increase their contribution significantly from spring to summer, while lower levels typically characterise the autumn season. At T= −22 °C (−18 °C), the median super-micrometre INP contribution in summer is 43 % (56 %) as compared to 20 % (15 %) and 28 % (19 %) in spring and autumn, respectively. At T= −15 °C, the contribution of super-micrometre INPs passes from 22 % in spring to 58 % in summer, while the autumn level is 54 %, with high intra-season variability. Indeed, the median super-micrometre INP contribution at T= −15 °C in September is 73 % and quickly decreases through October (49 %) and November (31 %). This same trend is also evident at the other activation temperatures, though to a lesser extent. This leads to the conclusion that a high contribution of super-micrometre INPs may be a constant feature of the whole summer season, extending until late summer and early autumn (August–September), while it decreases progressively in October and November, reaching values as low as those characterising the springtime.
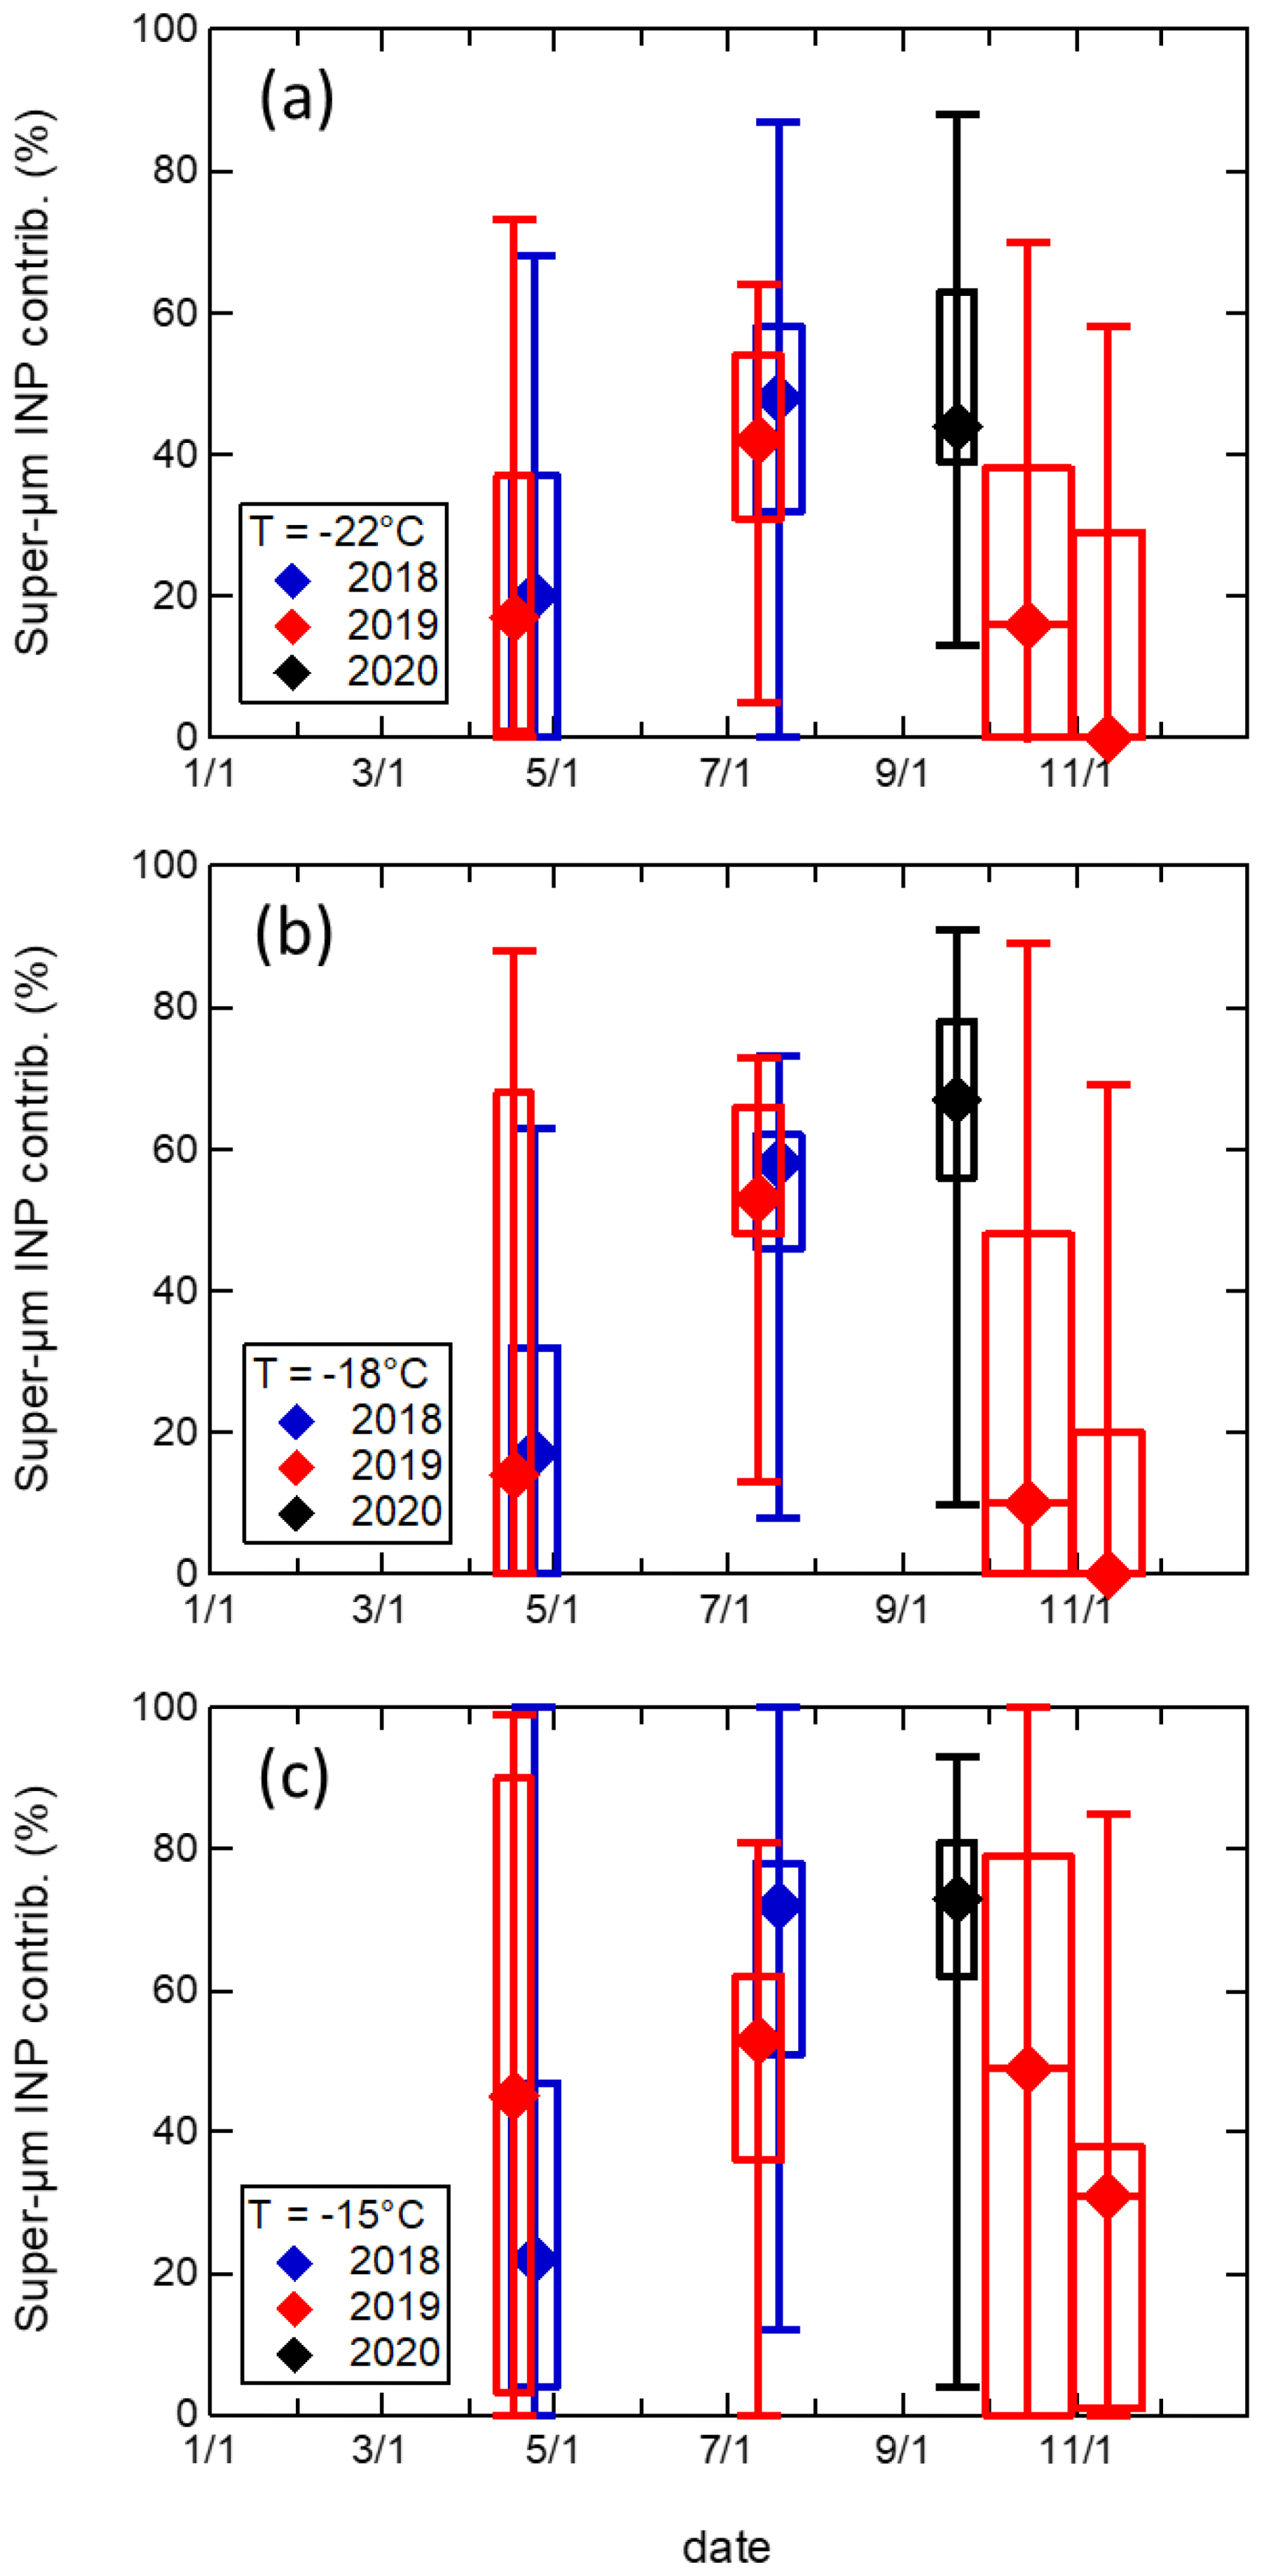
Figure 5Seasonal variation of the contribution of super-micrometre INPs (size range between 1 and 10 µm): (a) T= −22 °C, (b) T= −18 °C, and (c) T= −15 °C. The diamonds indicate the median value, the box represents the interquartile range, and the whiskers show the min–max range. The width of the box indicates the time span of each measurement period.
The very clear summertime increase in super-micrometre INP contribution observed in the present study is consistent with the findings by Mason et al. (2016) at the Alert Arctic station and by Creamean et al. (2022) over the high Arctic. Although size-segregated INP measurements in the Arctic region are still scarce, this consistency between studies located in different sectors and at different latitudes of the Arctic region suggests that the increase in the contribution of super-micrometre INPs occurring in summertime, likely attributable to local sources of, potentially, both marine and terrestrial origin, may be a general feature of the Arctic environment. This has implication for INP dynamics that need to be accounted for to model Arctic clouds and climate correctly.
3.3 Evolution of INP properties during autumn: a focus on the 2019 campaign
The longest continuous record of INP properties in the present dataset is represented by the autumn 2019 campaign, which extended from the beginning of October to almost the end of November for a total of 40 samples. The sampling was performed in parallel with a larger experimental effort, which is described in Pasquier et al. (2022). Figure 6 reports the time pattern of nINP in the PM10 size range. The data show a distinct variability of nINP, ranging between 3.5 and 185 m−3 at T= −22 °C, 4.2 and 74 m−3 at T= −18 °C, and 0.6 and 43 m−3 at T= −15 °C. Incidentally, we report a very good level of agreement of these nINP ranges with those observed by Li et al. (2023) in parallel during the same period at GVB station by means of immersion freezing (Fig. S5). For instance, the Pearson's correlation coefficient (R) between the two nINP time series at T= −15 °C is 0.69, with a mean absolute error (MAE) of 13.1 m−3 and with 84 % of the points lying within a factor of 5 from the 1:1 line.
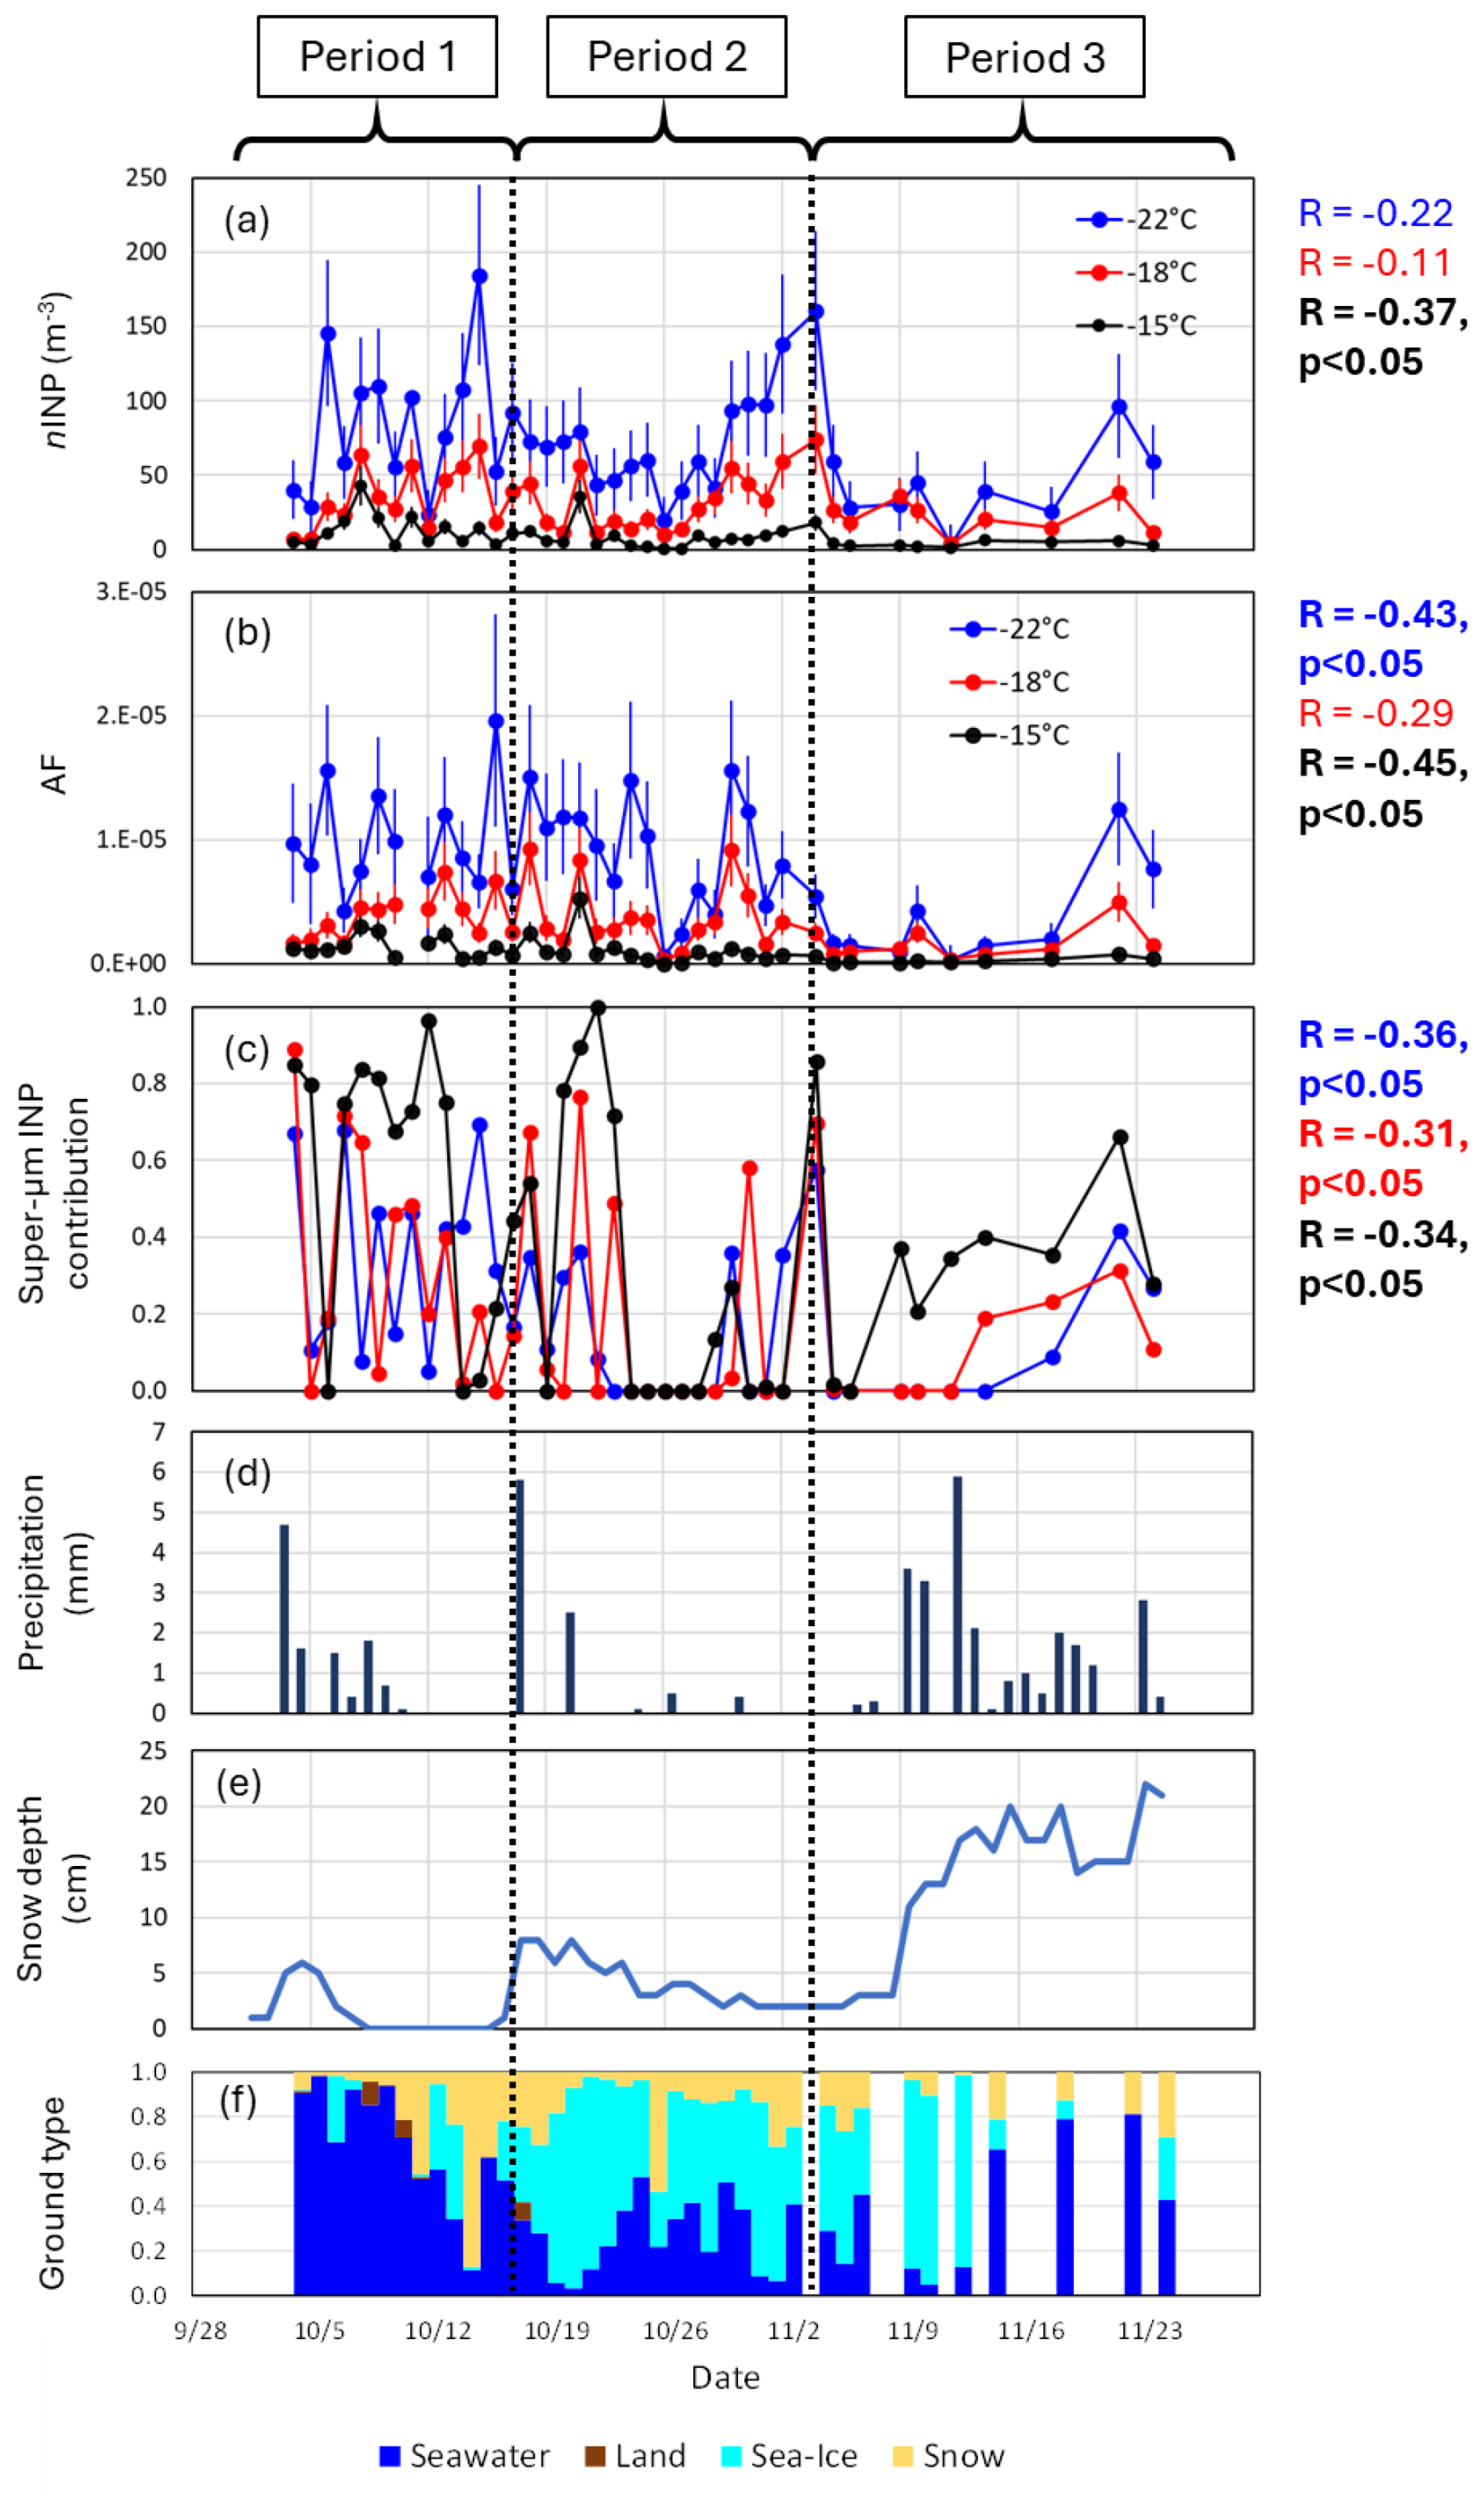
Figure 6Time series of (a) nINP (PM10 size range), (b) AF, and (c) percentage contribution of super-micrometre INPs during the October–November 2019 campaign. On the right, Pearson correlation coefficients between the observed variable and time (expressed as a sequential number) are reported to test the statistical significance of the observed temporal trend; for significant time trends (evidenced in bold), the confidence level is also reported. Also reported are (d) precipitation intensity, (e) snow depth, and (f) ground type influence on the sampled air masses.
Notwithstanding the day-to-day variability, nINP showed a clear decreasing trend through the campaign (statistically significant at T= −15 °C; p<0.05; Fig. 6). Similarly, the AF and the contribution of super-micrometre INPs also show a neat decreasing trend, with the latter being statistically significant at all probed T values. This analysis further reinforces the conclusions discussed in the previous sections, revealing a distinct temporal evolution of INP properties (nINP, AF, and the relative contribution of super-micrometre INPs) across October and November. Overall, our findings (Figs. 3–6) suggest that summer-like conditions may persist into early autumn, as evidenced by the September 2020 campaign, whereas, from October onward, the atmosphere transitions toward a state characterised by reduced INP concentrations, lower aerosol particle AF, and a diminished super-micrometre INP contribution. Below, we provide an interpretative framework to explain the main drivers of this evolution.
Among the meteorological parameters, the variability of nINP seems to be mostly related to precipitation (Fig. 6 and Table S5). Consistently, the snow depth on the ground also tends to be negatively associated with nINP at all the T values. More specifically, according to precipitation and snow depth, the campaign can be divided into three periods: the first one goes from the beginning of October to 16 October, the second goes from 17 October to 8 November, and the third goes from 9 November up to the end of the campaign. In general, the three periods are characterised by growing levels of accumulated precipitation and snow cover depth, though with variation in terms of the conditions within the single periods, as opposed to decreasing levels of nINP at all T values (Table S5). However, the association with precipitation and snow cover does not explain the nINP increase observed in the last days of the campaign.
The ground type influence on the sampled air masses (see Sects. 2.3.4 and 3.4.2; Fig. 6) can provide a further key for interpreting the variability of nINP across the campaign. Air masses sampled during the campaign were characterised by a very low influence of snow-free lands, while a relation between nINP and air mass contacts with ice-free seawaters seems to be evident from Fig. 6. In detail, the first part of the campaign (up to 16 October) is characterised by the highest nINP, with air masses having prolonged contact with seawater. During this period, the air masses came mostly from the south (Fig. S6). During the second period (17 October–8 November), the sampled air masses came from the north and travelled mostly over sea ice, corresponding to a reduction in nINP. As seen above, the slight increase in precipitation with respect to the previous period (particularly in the first half of the second period) may also have contributed to reducing nINP. Eventually, the last period (after 9 November) is again characterised by abundant air mass contact with seawater, again from the south, which may explain the increase in nINP observed in the last days of the campaign, which was potentially masked by the abundant precipitation in the previous days (9–20 November).
3.4 INP sources at GVB
3.4.1 Correlation analysis between nINP and black carbon
Rinaldi et al. (2021) showed correlations of nINP with chemical tracers of Arctic haze pollution during the spring of 2018, contextually reporting no clear correlation for the summer campaign. In the present analysis, we used online measured BC concentrations as a tracer for anthropogenic pollution and, in particular, for the springtime Arctic haze (Shaw, 1995). Significant correlations between nINP and BC concentration were observed only in springtime (particularly at T= −15 and −18 °C; Table 3) and with the extended dataset. This confirms that INPs at GVB are influenced by long-range transport from lower latitudes during springtime, which is consistent with the low contribution of super-micrometre INPs in this season as such particles tend to be scavenged during transport over long distances.
Table 3Pearson correlation coefficient (R) between nINP (PM10 size range) and BC.
a Statistically significant correlation for p<0.1. b Significant correlation for p<0.05.
3.4.2 Influence of ground conditions
Figure 7 shows that the contribution of the four considered ground types (sea ice, snow, seawater, and land) varies with the season. In spring, sampled air masses had the majority of contacts with sea ice or snow-covered land, while, in summer, low air masses were generally more influenced by ice-free seawaters. The autumn period shows large variability in terms of conditions, from a dominant contribution of ice-free seawaters (as seen in September 2020) to sea-ice-dominated conditions (November 2019). The (snow-free) land contribution was the lowest in every season, with a higher occurrence in summer.
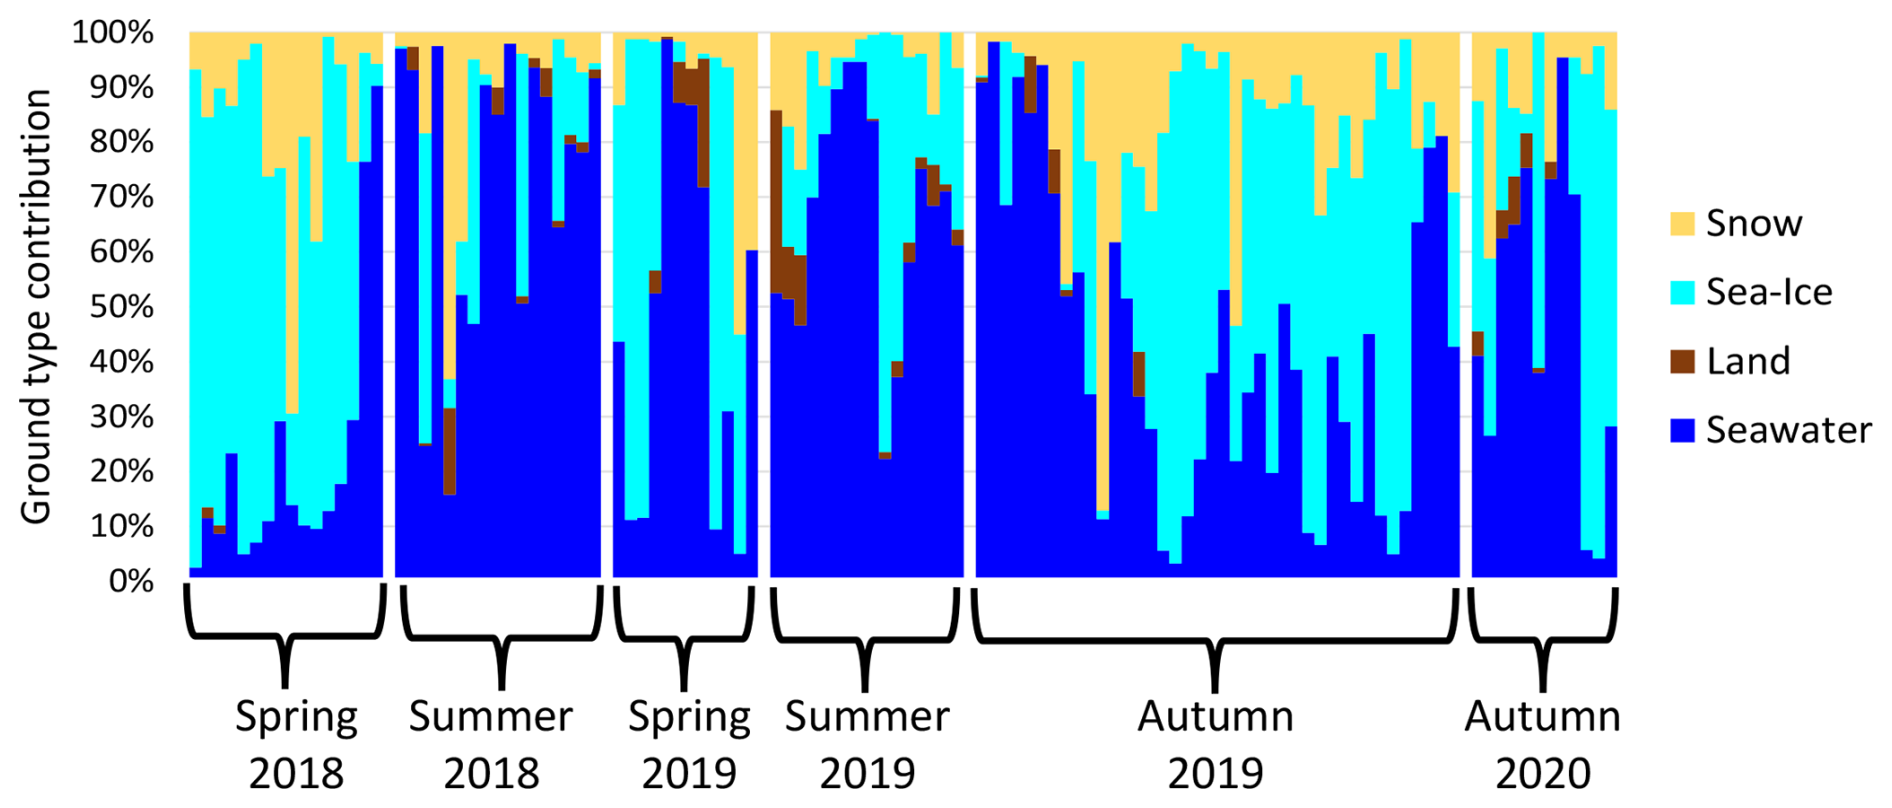
Figure 7Ground type contribution estimated for each INP sample. The ground type categories are described in Sect. 2.3.4.
In order to assess the contribution of land sources, two subsets were isolated from the whole nINP dataset according to the following criterion: samples obtained from air masses in contact with land for more than 5 % of the time were grouped in the land-influenced subset (n= 15). The rest of the samples (n= 98) represented a second subset, representative of air masses virtually unaffected by land sources. The two sample subsets present different nINP levels at all T values (Fig. 8), with the land-influenced subset having generally higher nINP values. This difference is statistically significant for T= −18 and −15 °C (p<0.05). This suggests a contribution of terrestrial INP sources in the study area during periods when snow is not present on the ground, which may be potentially relevant given the observed effect on the nINP levels even at modest levels of air mass contact with snow-free land. The higher nINP associated with land-influenced air masses may be due to the higher ice nucleation efficiency of mineral dust and soil particles compared to, for instance, marine biological particles (Wilson et al., 2015; McCluskey et al., 2018a; McCluskey et al., 2018b). In summer, contacts with snow-free land occurred mainly over the Svalbard archipelago (local sources) or over Greenland and Iceland (regional sources), as shown in Fig. S6. However, the low general influence of land sources in our sample set emerging from Fig. 7 (i.e. only 15 samples over 113 show land influence above 5 %) suggests that other sources may provide a significant contribution to the INP pool over the study area outside of the major terrestrial dust outbursts.
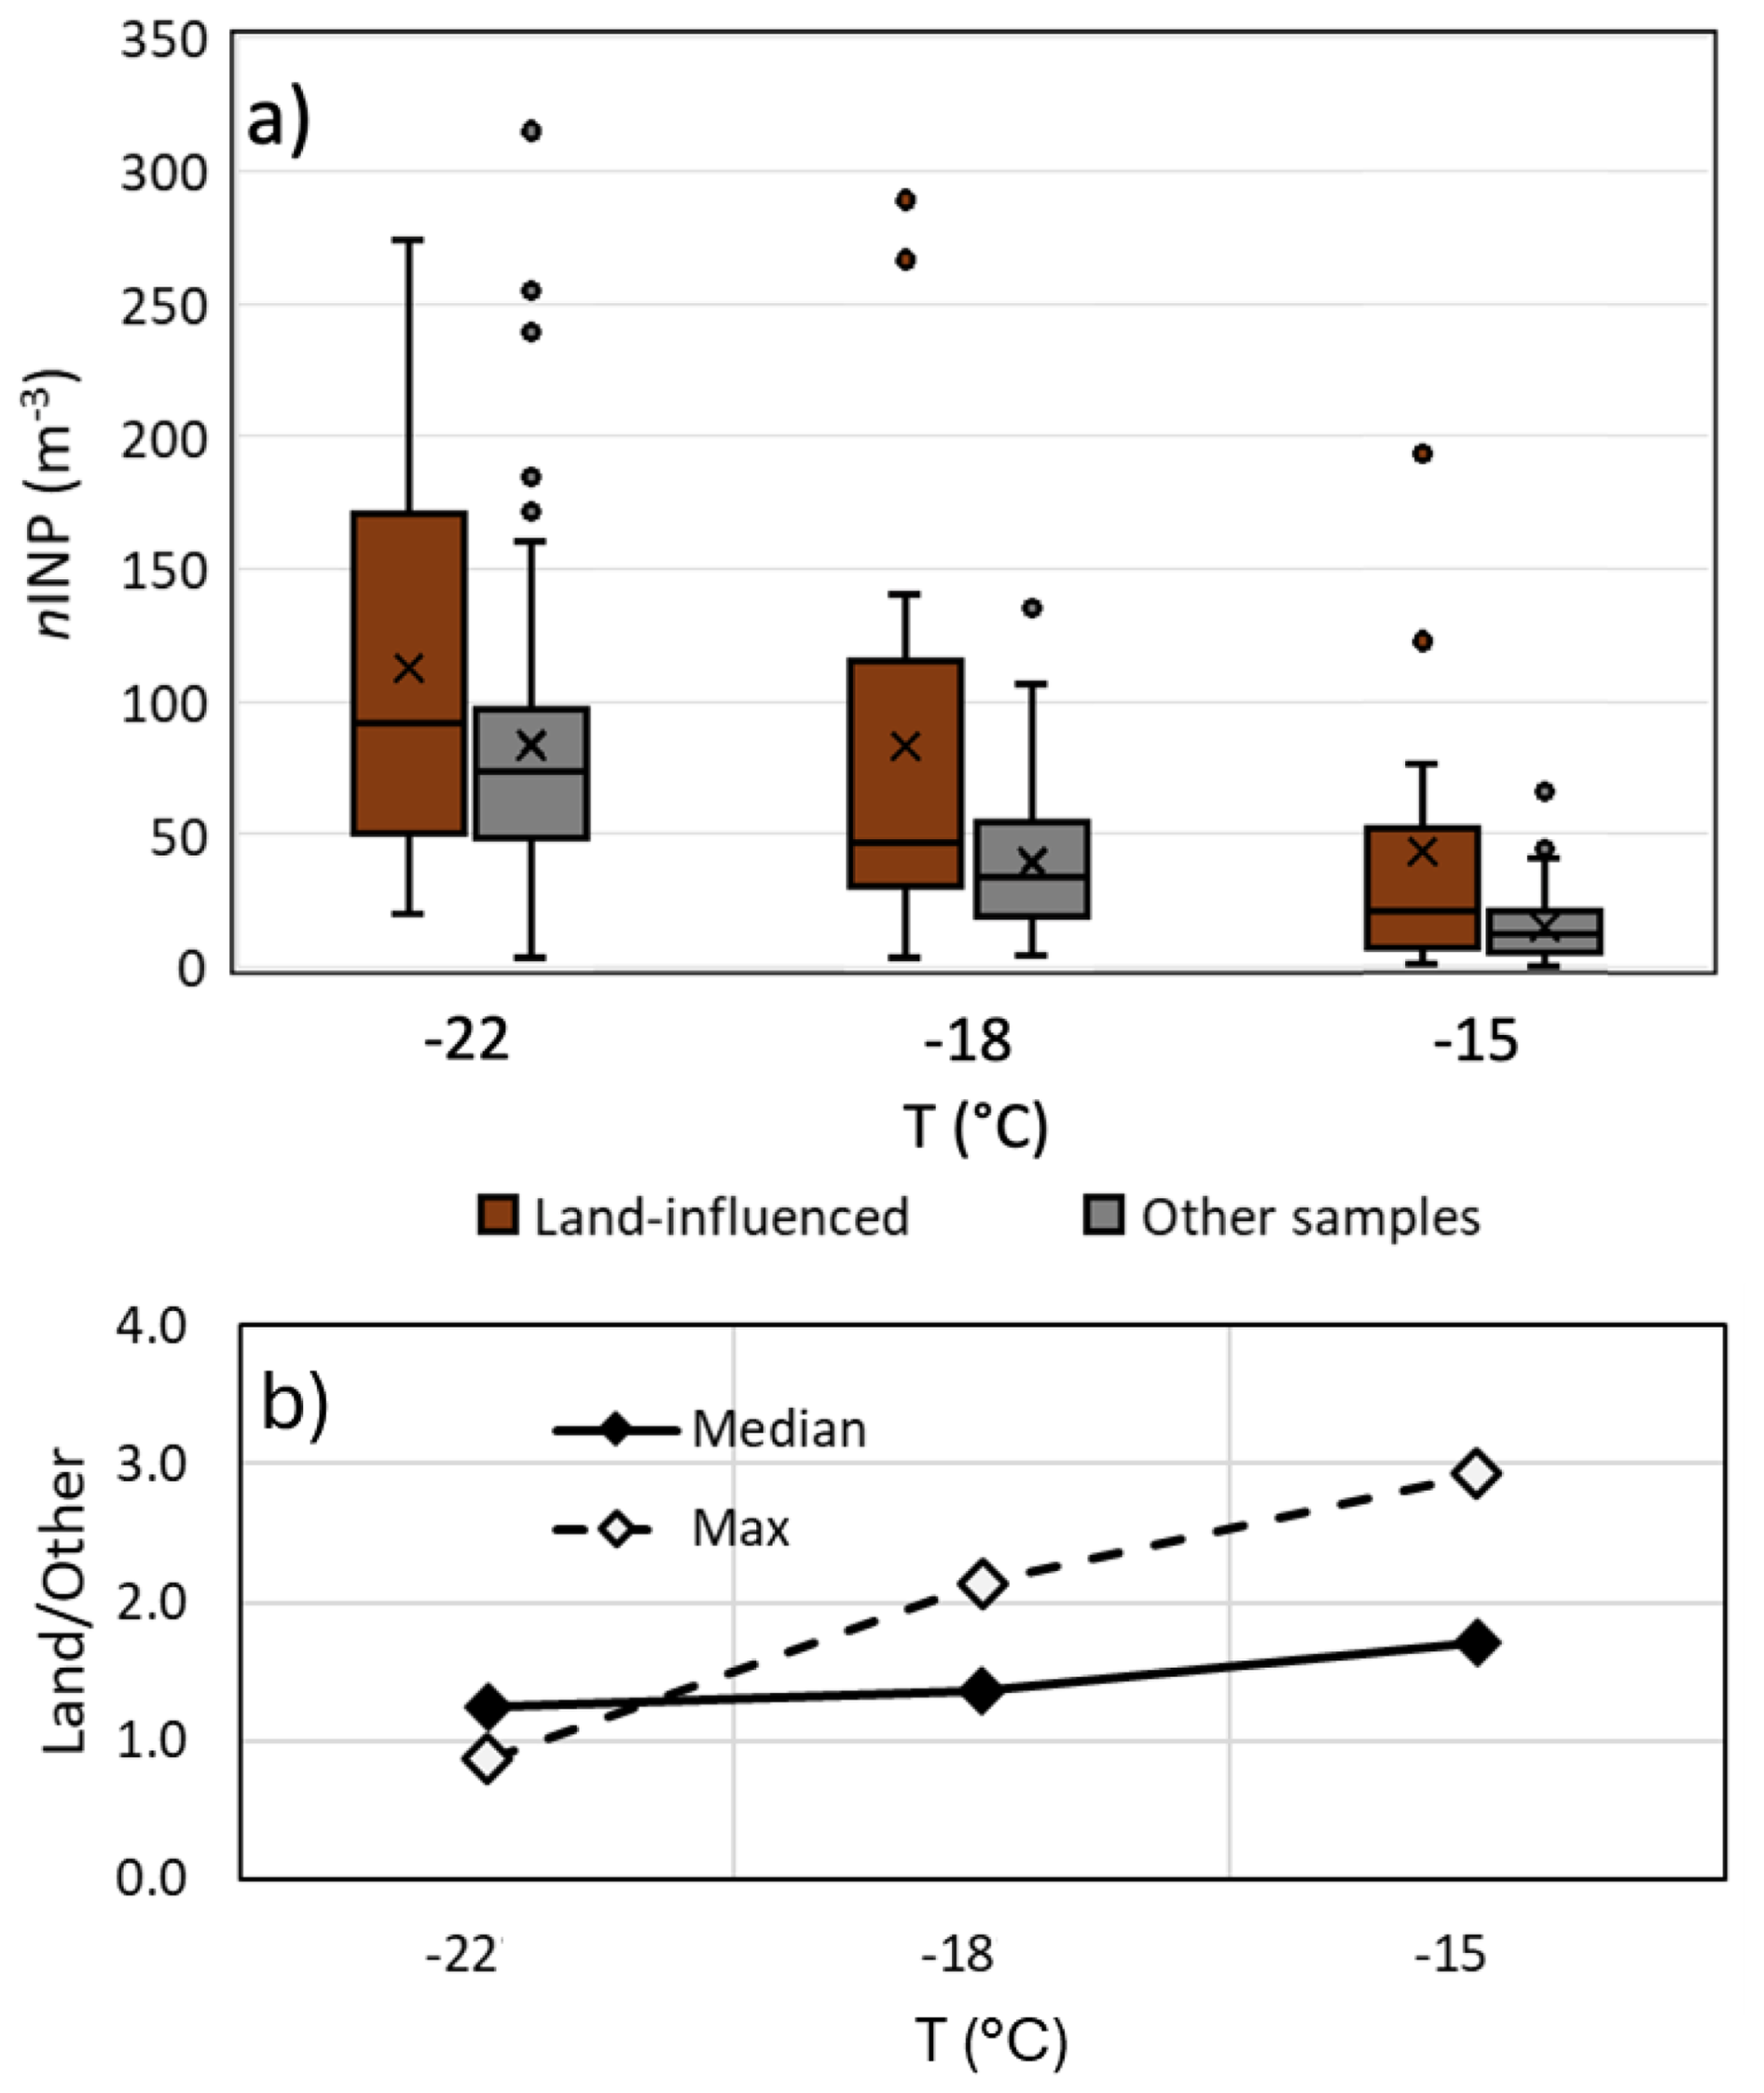
Figure 8(a) Distribution of nINP in the land-influenced sample subset compared to the rest of the samples as a function of T. The x within the box-and-whisker plots indicates the mean value. (b) Ratio between the median and maximum nINP in the land-influenced and other sample subsets.
3.4.3 Contribution of marine biological INP sources
In this section, we test the hypothesis that marine sources of biological particulate matter contributed to the observed atmospheric INP pool in periods of our measurements when the sea was mostly free of ice. To do this, we operated a two-step approach following Rinaldi et al. (2021). On the one hand, we examined the spatio-temporal correlation between nINP and surface CHL by applying the time lag analysis first proposed by Rinaldi et al. (2013) to assess if INP levels followed any relation with the patterns of marine biological activity over a domain comprising the Arctic Ocean and all the seawaters down to 50° latitude. On the other hand, we ran the CWT spatial source attribution model on the INP dataset in order to evidence INP emission hotspots in the same oceanic domain.
To exclude interferences from land sources, we selected a further sample subset: all the samples corresponding to air masses in contact with (ice-free) seawater for more than 50 % of the time and with (snow-free) land for less than 5 % of the time were grouped in the seawater-dominated subset (n= 45). This subset was used for the present analysis. In addition, we focused on INP measurements taken at T= −15 °C as this temperature is considered to be most indicative of ice nucleation driven by biological particles and less affected by mineral dust (Kanji et al., 2017). Finally, we selected for the analysis the PM1 size fraction following the results of McCluskey et al. (2018b) and Mansour et al. (2020b), where a better correlation with CHL is reported for fine INPs. The absence of a correlation between surface CHL levels and super-micrometre INPs does not mean that the ocean surface cannot produce large INPs. It simply indicates that CHL is not a suitable indicator for tracking these larger biological particles. While CHL has been linked to organic matter in smaller sea spray particles (Rinaldi et al., 2013), its relationship with larger particles has not been studied. Laboratory experiments by McCluskey et al. (2017) showed that both small and large INPs can form from algal blooms, suggesting that different mechanisms and particle types are involved.
An example of the results of the INP vs. CHL correlation analysis is reported in Fig. 9a in the form of a correlation map. The colour of each pixel represents the correlation coefficient (R) resulting from the linear regression between the CHL concentration in that pixel and the nINP measured at GVB. To explore potential correlations, we generated multiple maps by applying different time lags between the two time series. Specifically, CHL data were shifted from 1 to 24 d prior to the INP filter sampling times (see Figs. S7, S8, and S9 for the complete set of lag correlation maps). This time lag methodology has been shown to enhance correlations between in situ coastal aerosol and/or cloud measurements and satellite-derived CHL fields (Rinaldi et al., 2013; Mansour et al., 2020a, 2020b, 2022). The lag period is thought to represent the timescale of biochemical processes that generate transferable organic matter in seawater following phytoplankton blooms indicated by CHL variability. Regions of the ocean displaying significant positive correlations – marked by red dots on the maps – may indicate source areas of biologically derived particles acting as INPs in our samples. The map in Fig. 9a shows high correlation regions in the seawaters to the south of the Svalbard archipelago, around Iceland, and to the south of Greenland, with all of these regions being consistently located upwind of GVB during the sampling period (Fig. S6). Similar spatial features of the correlation between nINP and CHL can be observed almost independently of the considered lag times between 0 and 24 d (Fig. S7). The weak dependence of the correlation on lag time is typical of yearly (or multi-yearly) datasets. This suggests that the relationship between INP concentration and CHL is primarily driven by seasonal patterns in marine biological activity rather than by short-term fluctuations such as daily or weekly changes (Mansour et al., 2020a, b; Mansour et al., 2022).
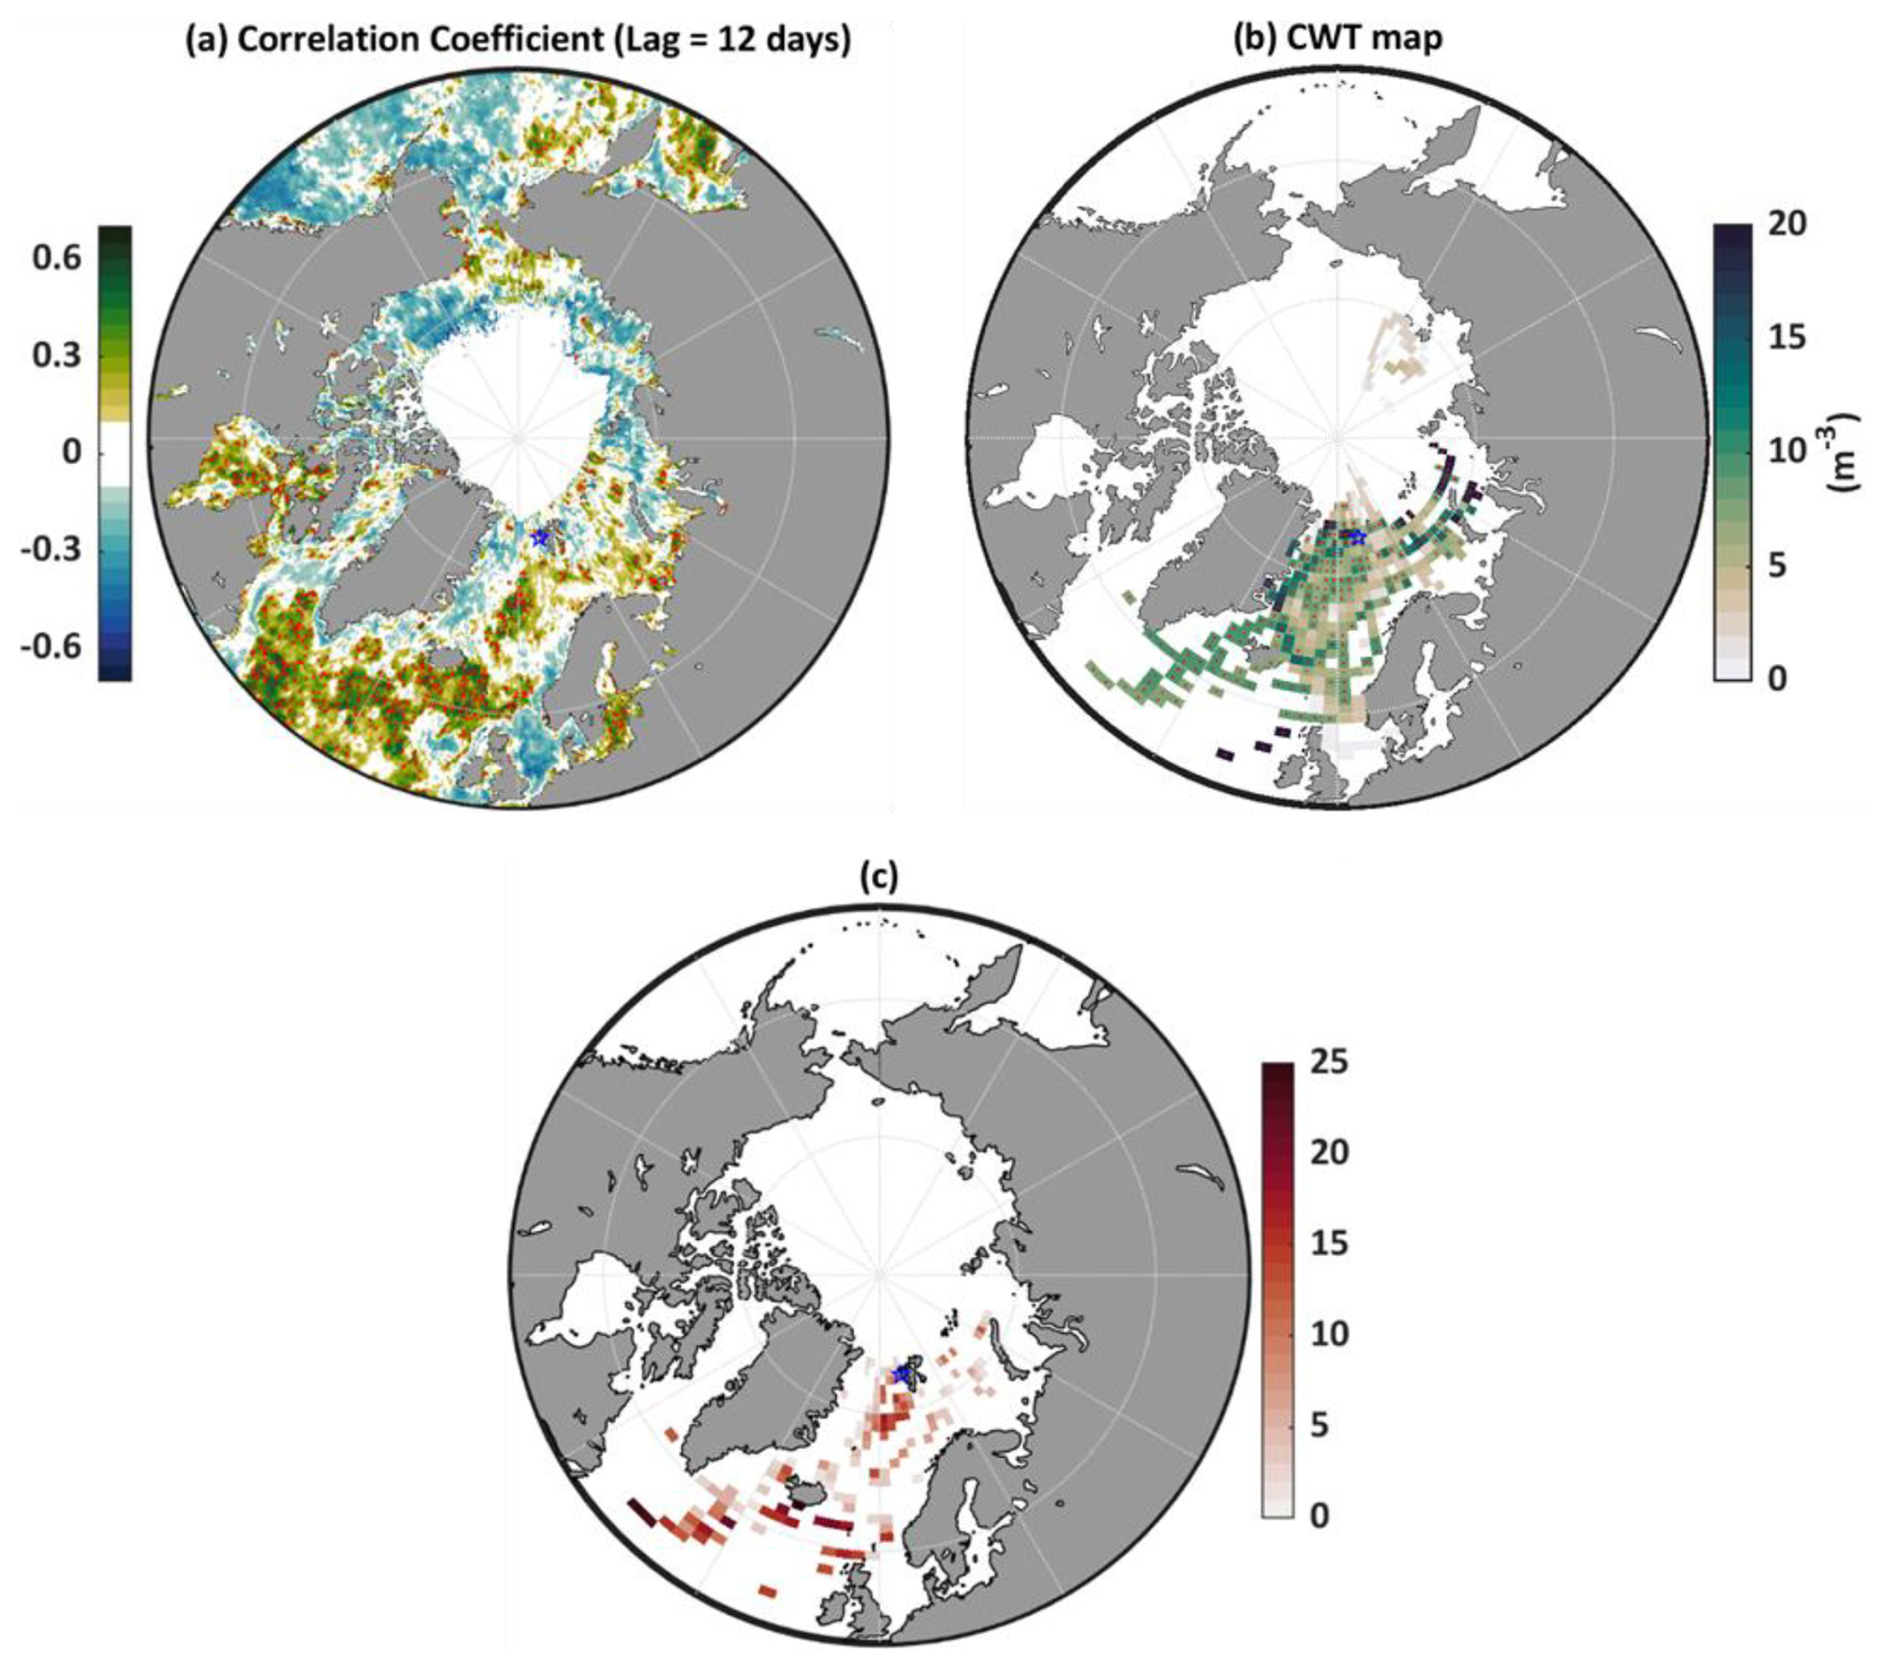
Figure 9(a) Example of the spatial distribution of the linear correlation coefficient between nINP (PM1, T= −15 °C) measured at GVB and CHL over the Arctic Ocean. Red dots represent positive and significant correlation coefficients at p<0.1. (b) CWT source maps for nINP (PM1, T= −15 °C). Regions marked with red dots indicate potential source regions (CWT ≥ median). (c) Oceanic regions which have the highest probability of being a source of marine biogenic aerosol impacting nINP (T= −15 °C) at GVB. The colour scale reflects how many times a given pixel has a CWT ≥ median and a positive significant correlation coefficient by running the time lag from 0 to 24 d.
The results of the CWT analysis are presented in Fig. 9b, which shows the potential INP sources at GVB during periods of high (sea-ice-free) seawater influence. Figure 9a and b show some similar features in terms of the identified potential source regions. To facilitate the comparison between spatio-temporal correlation maps and the CWT results, Fig. 9c shows every pixel with both a CWT value above the median and a significant positive correlation between nINP and surface CHL, considering every delay time between 0 and 24 d. The map in Fig. 9c evidences the sea regions immediately to the south of the Svalbard islands and around Iceland as the most likely sources of the INP measured at GVB in the seawater-influenced sample subset, i.e. outside the major episodes of terrestrial influence discussed in the previous section.
3.4.4 Remarks on INP sources
The correlation with BC observed only in the springtime (Sect. 3.4.1) and the aforementioned dominance of sub-micrometre INPs in this season (Sect. 3.2) support the hypothesis that the primary sources of springtime INPs at GVB may be located outside the Arctic. During spring, the Arctic region is influenced by the long-range transport of anthropogenic aerosols originating from lower latitudes (Udisti et al., 2016; Stohl, 2006; Heidam et al., 1999), and, during this time, INPs likely originate from the same source regions, carried northward with the Arctic haze. Consequently, the AF estimates presented above (Fig. 4) support the hypothesis that long-range-transported aerosol particles from lower latitudes nucleate ice less efficiently than local-origin aerosol particles, with spring being the season characterised by the lowest AF. This aligns with the results reported by Hartmann et al. (2019), evidencing a minimal influence of human-induced emissions on Arctic INP levels in pre-industrial ice core records, and with the pioneering study by Borys (1983).
In contrast, the summertime aerosol population appears to be more strongly influenced by local Arctic sources. The absence of a correlation with black carbon (Sect. 3.4.1) and the prevalence of super-micrometre INPs (Sect. 3.2) suggest that the dominant summertime INP sources are natural and located at relatively low distance. Further support comes from Sect. 3.4.2 and 3.4.3, which indicate that, during periods of minimal snow and sea ice cover, terrestrial and marine sources with a local Arctic origin contribute to INP levels. Additionally, Fig. 7 and Sect. 3.3 show that air masses had the highest contact with seawater in summer and early autumn, decreasing steadily through the autumn season. This implies that summertime INP sources may continue to influence the early autumn period, with their impact gradually diminishing later in the season, as clearly shown by the approximately 2-month long record of observations from autumn 2019.
Our analysis points out that both marine and terrestrial sources may contribute to the INP population in the European Arctic and that terrestrial sources could play a significant role due to the greater ice-nucleating efficiency of mineral dust and soil particles compared to marine aerosols (McCluskey et al., 2018b). By contrast, marine sources may be significant on account of the extension of ice-free seawaters during the Arctic summer and even from a future perspective considering the progressive reduction in the sea ice cover during the Arctic summer (Stroeve et al., 2012; Serreze et al., 2007). Regarding marine sources, the analysis performed on the extended dataset (2018–2020) substantially confirms the preliminary results achieved by Rinaldi et al. (2021), showing potential marine sources located in the seawaters surrounding and immediately to the south of the Svalbard archipelago down to the waters around Iceland. These sea regions are identified by the statistical model CWT as INP emission hotspots and have time patterns of CHL evolution in correlating, to some extent, with the atmospheric variability of INPs at GVB. With respect to Rinaldi et al. (2021), the new results are based on a significantly higher number of samples (45 samples, more than 3 times higher), which provides more statistical robustness and credibility to the conclusions.
Recently, Paglione et al. (2025) identified the main sources of the sub-micrometre organic aerosol at Ny-Ålesund by factor analysis of aerosol mass spectra and nuclear magnetic resonance (NMR) spectra. The study is based on aerosol samples from the GVB station, collected between May 2019 and June 2020, with a partial overlap with the present study (56 samples over 113). Among the isolated organic aerosol types, they identified a primary marine organic aerosol (POA), representative of biogenic organics emitted within sea spray particles, which can be associated with marine biogenic INPs (McCluskey et al., 2018a, 2017). This organic aerosol type contributed mostly during summer. The sampling resolution of the filters analysed by Paglione et al. (2025) is approximately 4 d, much longer than that of the INP filters, which hinders a quantitative comparison with the present INP data. Nevertheless, the source area of the POA identified by CWT in Paglione et al. (2025) presents remarking similarities compared to Fig. 9c of the present work. These findings mutually support each other, further strengthening the reliability of the identified marine biogenic INP source region.
Although our dataset and analysis do not allow a quantitative assessment of the relative magnitude of terrestrial vs. marine INP sources over the European Arctic during periods of snow and sea ice melt, our findings give support to the idea that marine biogenic particles may be a relevant INP source in the Arctic, in line with recent publications (Hartmann et al., 2021; Creamean et al., 2022; Inoue et al., 2021; Porter et al., 2022).
This work presents and discusses ambient concentrations of INPs from the GVB observatory, near Ny-Ålesund, collected during six campaigns covering three seasons (spring, summer, and autumn) over 3 years for a total of 113 parallel PM1–PM10 samples. Aerosol particles were assessed for their ice nucleation ability and efficiency offline in condensation-freezing mode by the DFPC. Considering the PM10 size interval, nINP during our observations ranged from 0.3 m−3 (minimum observed at T= −15 °C) to 315 m−3 (maximum observed at T= −22 °C), in fair agreement with the range of previous observations at Arctic sites. Regarding the ice nucleation efficiency of the investigated aerosol particle populations (in the range of 0.1–10 µm), the estimated AF was shown to be between 10−8 and 10−5.
This study also focuses on investigating the seasonality of INP properties over the Atlantic sector of the Arctic, represented by the GVB station. Conversely to other studies, our data show only a moderate summertime increase in nINP and only at T= −15 °C. This could be explained assuming a higher background concentration of cold INPs of likely mineral origin at GVB with respect to other stations located at higher latitudes. This may be able to somewhat mask the impact of summertime sources at T= −18 and −22 °C. On the other hand, the AF of atmospheric aerosol particles from GVB presents a clearer seasonal evolution, with maxima observed in late summer and early autumn.
A marked seasonal evolution of the super-micrometre INP contribution was, eventually, observed. Such INPs increase their contribution significantly from spring (15 %–20 %) to summer (∼ 60 %), while lower levels typically characterise the autumn season (20 %–50 %). Our calculations also show that super-micrometre particles have a significantly higher AF compared to sub-micrometre ones, with at least 2 orders of magnitude difference between the two size regimes. This suggests that aerosol particles larger than 1 µm are important players in summertime aerosol–cloud interactions at the study location.
The longest continuous record of measurements in the dataset, performed in October–November 2019, shows a progressive reduction in nINP, AF, and super-micrometre INPs contribution through autumn. The variability of INP levels during autumn, at least during our observations, could be related to the interplay of two phenomena: increased precipitation, which, in the considered period, seemed to enhance the INP removal, and progressive reduction of the influence of seawater sources on air masses reaching the study area as the sea ice coverage increases.
Additionally, our analyses show the dominance of local aerosol particle sources during summer and early autumn. Conversely, during springtime, INPs are mostly accounted for by long-range-transported aerosol particles from southern latitudes. When land and sea are mostly free from snow and ice, both marine and terrestrial sources may be potentially relevant INP contributors at GVB. Regarding marine sources, our analysis identified potential marine INP sources located in the seawaters surrounding and immediately to the south of the Svalbard archipelago down to the waters around Iceland, which apparently dominate the nINP variability outside the major events of terrestrial influence.
Conclusively, the results discussed here evidence the importance of local (particularly super-micrometre) INP sources as drivers of aerosol-0cloud interactions in the Arctic region and the variability of INP seasonal features depending on the latitude and, potentially, geographic sector. This implies that the formation mechanisms of local INPs in the Arctic, including the emission of biological particles from the sea surface, need to be better constrained in order to achieve a more robust understanding of the ongoing climate change in this fragile region.
Data are available at https://doi.org/10.5281/zenodo.15188457 (Rinaldi et al., 2025).
BC data are available at https://data.iadc.cnr.it/erddap/tabledap/gilardoni_acdp_2018_2021.html (last access: 18 September 2025).
Precipitation data are available at https://seklima.met.no/observations/ (last access: 18 September 2025).
The supplement related to this article is available online at https://doi.org/10.5194/ar-3-535-2025-supplement.
MR and FB planned and supervised the research. AN, MP, MM, GS, and FB performed the sampling and/or the measurements. MR, AN, KM, and FB analysed the data. MR wrote the paper draft. MR, AN, MP, SD, and FB reviewed and edited the paper.
The contact author has declared that none of the authors has any competing interests.
Publisher's note: Copernicus Publications remains neutral with regard to jurisdictional claims made in the text, published maps, institutional affiliations, or any other geographical representation in this paper. While Copernicus Publications makes every effort to include appropriate place names, the final responsibility lies with the authors. Views expressed in the text are those of the authors and do not necessarily reflect the views of the publisher.
The authors thank the CNR and the staff of the Arctic Station Dirigibile Italia for their support: Alessandra Amore, Federica Bruschi, Federico Scoto, Raffaello Nardin, and Fabio Giardi.
Financial support was provided by the European Commission: H2020 Research and innovation program, project FORCeS (grant no. 821205) and by the Italian Joint Research Center ENI-CNR “Aldo Pontremoli” within the ENI-CNR Joint Research Agreement. Support from CleanCloud (Horizon Europe, grant no. 101137639) is also greatly acknowledged. This research was also supported by the Italian Ministry of University and Research (MIUR) within the framework of the Arctic Research Program of Italy of the project “BETHA-NyÅ” – Boundary layer evolution through harmonization of aerosol measurements at Ny-Ålesund research station (grant no. PRA2021-0020).
This paper was edited by Shahzad Gani and reviewed by two anonymous referees.
Atkinson, J. D., Murray, B. J., Woodhouse, M. T., Whale, T. F., Baustian, K. J., Carslaw, K. S., Dobbie, S., O'Sullivan, D., and Malkin, T. L.: The importance of feldspar for ice nucleation by mineral dust in mixed-phase clouds, Nature, 498, 355–358, https://doi.org/10.1038/nature12278, 2013.
Barry, K., Hill, T., Moore, K., Douglas, T., Kreidenweis, S., DeMott, P., and Creamean, J.: Persistence and Potential Atmospheric Ramifications of Ice- Nucleating Particles Released from Thawing Permafrost, Environmental Science & Technology, https://doi.org/10.1021/acs.est.2c06530, 2023.
Belosi, F., Piazza, M., Nicosia, A., and Santachiara, G.: Influence of supersaturation on the concentration of ice nucleating particles, Tellus Series B-Chemical and Physical Meteorology, 70, https://doi.org/10.1080/16000889.2018.1454809, 2018.
Bigg, E. K.: Ice forming nuclei in the high Arctic, Tellus Series B-Chemical and Physical Meteorology, 48, 223–233, https://doi.org/10.1034/j.1600-0889.1996.t01-1-00007.x, 1996.
Bigg, E. K. and Leck, C.: Cloud-active particles over the central Arctic Ocean, Journal of Geophysical Research-Atmospheres, 106, 32155–32166, https://doi.org/10.1029/1999jd901152, 2001.
Bond, T. C., Anderson, T. L., and Campbell, D.: Calibration and Intercomparison of Filter-Based Measurements of Visible Light Absorption by Aerosols, Aerosol Sci. Tech., 30, 582–600, 1999.
Borys, R. D.: The effects of long-range transport of air pollutants on Arctic cloud-active aerosol, Atmospheric Science, Colorado State University, Fort Collins, Colorado, USA, 367 pp., 1983.
Carlsen, T. and David, R.: Spaceborne Evidence That Ice-Nucleating Particles Influence High-Latitude Cloud Phase, Geophysical Research Letters, 49, https://doi.org/10.1029/2022GL098041, 2022.
Conen, F., Stopelli, E., and Zimmermann, L.: Clues that decaying leaves enrich Arctic air with ice nucleating particles, Atmospheric Environment, 129, 91–94, https://doi.org/10.1016/j.atmosenv.2016.01.027, 2016.
Conen, F., Yakutin, M., Puchnin, A., and Yttri, K.: On coarse patterns in the atmospheric concentration of ice nucleating particles, Atmospheric Research, 285, https://doi.org/10.1016/j.atmosres.2023.106645, 2023.
Creamean, J., Cross, J., Pickart, R., McRaven, L., Lin, P., Pacini, A., Hanlon, R., Schmale, D., Ceniceros, J., Aydell, T., Colombi, N., Bolger, E., and DeMott, P.: Ice Nucleating Particles Carried From Below a Phytoplankton Bloom to the Arctic Atmosphere, Geophysical Research Letters, 46, 8572–8581, https://doi.org/10.1029/2019GL083039, 2019.
Creamean, J., Hill, T., DeMott, P., Uetake, J., Kreidenweis, S., and Douglas, T.: Thawing permafrost: an overlooked source of seeds for Arctic cloud formation, Environmental Research Letters, 15, https://doi.org/10.1088/1748-9326/ab87d3, 2020.
Creamean, J., Barry, K., Hill, T., Hume, C., DeMott, P., Shupe, M., Dahlke, S., Willmes, S., Schmale, J., Beck, I., Hoppe, C., Fong, A., Chamberlain, E., Bowman, J., Scharien, R., and Persson, O.: Annual cycle observations of aerosols capable of ice formation in central Arctic clouds, Nature Communications, 13, https://doi.org/10.1038/s41467-022-31182-x, 2022.
Dall'Osto, M., Beddows, D. C. S., Tunved, P., Harrison, R. M., Lupi, A., Vitale, V., Becagli, S., Traversi, R., Park, K.-T., Yoon, Y. J., Massling, A., Skov, H., Lange, R., Strom, J., and Krejci, R.: Simultaneous measurements of aerosol size distributions at three sites in the European high Arctic, Atmos. Chem. Phys., 19, 7377–7395, https://doi.org/10.5194/acp-19-7377-2019, 2019.
Freitas, G., Adachi, K., Conen, F., Heslin-Rees, D., Krejci, R., Tobo, Y., Yttri, K. and Zieger, P.: Regionally sourced bioaerosols drive high-temperature ice nucleating particles in the Arctic, Nature Communications, 14, https://doi.org/10.1038/s41467-023-41696-7, 2023.
Freitas, G., Kopec, B., Adachi, K., Krejci, R., Heslin-Rees, D., Yttri, K., Hubbard, A., Welker, J. and Zieger, P.: Contribution of fluorescent primary biological aerosol particles to low-level Arctic cloud residuals, Atmospheric Chemistry and Physics, 24, 5479–5494, https://doi.org/10.5194/acp-24-5479-2024, 2024.
Giardi, F., Becagli, S., Traversi, R., Frosini, D., Severi, M., Caiazzo, L., Ancillotti, C., Cappelletti, D., Moroni, B., Grotti, M., Bazzano, A., Lupi, A., Mazzola, M., Vitale, V., Abollino, O., Ferrero, L., Bolzacchini, E., Viola, A., and Udisti, R.: Size distribution and ion composition of aerosol collected at Ny-lesund in the spring-summer field campaign 2013, Rendiconti Lincei-Scienze Fisiche E Naturali, 27, 47–58, https://doi.org/10.1007/s12210-016-0529-3, 2016.
Gilardoni, S., Heslin-Rees, D., Mazzola, M., Vitale, V., Sprenger, M., and Krejci, R.: Drivers controlling black carbon temporal variability in the lower troposphere of the European Arctic, Atmos. Chem. Phys., 23, 15589–15607, https://doi.org/10.5194/acp-23-15589-2023, 2023.
Graversen, R. and Wang, M.: Polar amplification in a coupled climate model with locked albedo, Clim. Dynam., 33, 629–643, https://doi.org/10.1007/s00382-009-0535-6, 2009.
Hall, A.: The role of surface albedo feedback in climate, Journal of Climate, 17, 1550–1568, 2004.
Harrison, A. D., Lever, K., Sanchez-Marroquin, A., Holden, M. A., Whale, T. F., Tarn, M. D., McQuaid, J. B., and Murray, B. J.: The ice-nucleating ability of quartz immersed in water and its atmospheric importance compared to K-feldspar, Atmos. Chem. Phys., 19, 11343–11361, https://doi.org/10.5194/acp-19-11343-2019, 2019.
Hartmann, M., Blunier, T., Brugger, S. O., Schmale, J., Schwikowski, M., Vogel, A., Wex, H., and Stratmann, F.: Variation of Ice Nucleating Particles in the European Arctic Over the Last Centuries, Geophysical Research Letters, 46, 4007–4016, https://doi.org/10.1029/2019gl082311, 2019.
Hartmann, M., Gong, X., Kecorius, S., van Pinxteren, M., Vogl, T., Welti, A., Wex, H., Zeppenfeld, S., Herrmann, H., Wiedensohler, A., and Stratmann, F.: Terrestrial or marine – indications towards the origin of ice-nucleating particles during melt season in the European Arctic up to 83.7° N, Atmos. Chem. Phys., 21, 11613–11636, https://doi.org/10.5194/acp-21-11613-2021, 2021.
Heidam, N. Z., Wahlin, P., and Christensen, J. H.: Tropospheric gases and aerosols in northeast Greenland, Journal of the Atmospheric Sciences, 56, 261–278, https://doi.org/10.1175/1520-0469(1999)056<0261:tgaain>2.0.co;2, 1999.
Helfrich, S., McNamara, D., Ramsay, B., Baldwin, T., and Kasheta, T.: Enhancements to, and forthcoming developments in the Interactive Multisensor Snow and Ice Mapping System (IMS), Hydrological Processes, 21, 1576–1586, https://doi.org/10.1002/hyp.6720, 2007.
Hersbach, H., Bell, B., Berrisford, P., Hirahara, S., Horanyi, A., Munoz-Sabater, J., Nicolas, J., Peubey, C., Radu, R., Schepers, D., Simmons, A., Soci, C., Abdalla, S., Abellan, X., Balsamo, G., Bechtold, P., Biavati, G., Bidlot, J., Bonavita, M., De Chiara, G., Dahlgren, P., Dee, D., Diamantakis, M., Dragani, R., Flemming, J., Forbes, R., Fuentes, M., Geer, A., Haimberger, L., Healy, S., Hogan, R. J., Holm, E., Janiskova, M., Keeley, S., Laloyaux, P., Lopez, P., Lupu, C., Radnoti, G., de Rosnay, P., Rozum, I., Vamborg, F., Villaume, S., and Thepaut, J. N.: The ERA5 global reanalysis, Quarterly Journal of the Royal Meteorological Society, 146, 1999–2049, https://doi.org/10.1002/qj.3803, 2020.
Hiranuma, N., Mohler, O., Yamashita, K., Tajiri, T., Saito, A., Kiselev, A., Hoffmann, N., Hoose, C., Jantsch, E., Koop, T., and Murakami, M.: Ice nucleation by cellulose and its potential contribution to ice formation in clouds, Nature Geoscience, 8, 273–277, https://doi.org/10.1038/ngeo2374, 2015.
Hoose, C. and Möhler, O.: Heterogeneous ice nucleation on atmospheric aerosols: a review of results from laboratory experiments, Atmos. Chem. Phys., 12, 9817–9854, https://doi.org/10.5194/acp-12-9817-2012, 2012.
Ickes, L., Porter, G. C. E., Wagner, R., Adams, M. P., Bierbauer, S., Bertram, A. K., Bilde, M., Christiansen, S., Ekman, A. M. L., Gorokhova, E., Höhler, K., Kiselev, A. A., Leck, C., Möhler, O., Murray, B. J., Schiebel, T., Ullrich, R., and Salter, M. E.: The ice-nucleating activity of Arctic sea surface microlayer samples and marine algal cultures, Atmos. Chem. Phys., 20, 11089–11117, https://doi.org/10.5194/acp-20-11089-2020, 2020.
Inoue, J., Tobo, Y., Taketani, F., and Sato, K.: Oceanic Supply of Ice-Nucleating Particles and Its Effect on Ice Cloud Formation: A Case Study in the Arctic Ocean During a Cold-Air Outbreak in Early Winter, Geophysical Research Letters, 48, https://doi.org/10.1029/2021GL094646, 2021.
Intrieri, J., Shupe, M., Uttal, T., and McCarty, B.: An annual cycle of Arctic cloud characteristics observed by radar and lidar at SHEBA, Journal of Geophysical Research-Oceans, 107, https://doi.org/10.1029/2000JC000423, 2002.
Irish, V. E., Elizondo, P., Chen, J., Chou, C., Charette, J., Lizotte, M., Ladino, L. A., Wilson, T. W., Gosselin, M., Murray, B. J., Polishchuk, E., Abbatt, J. P. D., Miller, L. A., and Bertram, A. K.: Ice-nucleating particles in Canadian Arctic sea-surface microlayer and bulk seawater, Atmos. Chem. Phys., 17, 10583–10595, https://doi.org/10.5194/acp-17-10583-2017, 2017.
Kanji, Z. A., Ladino, L. A., Wex, H., Boose, Y., Burkert-Kohn, M., Cziczo, D. J., and Kramer, M.: Overview of Ice Nucleating Particles, Ice Formation and Evolution in Clouds and Precipitation: Measurement and Modeling Challenges, 58, https://doi.org/10.1175/amsmonographs-d-16-0006.1, 2017.
Knopf, D., Alpert, P., Wang, B., and Aller, J.: Stimulation of ice nucleation by marine diatoms, Nature Geoscience, 4, 88–90, https://doi.org/10.1038/ngeo1037, 2011.
Korolev, A., McFarquhar, G., Field, P., Franklin, C., Lawson, P., Wang, Z., Williams, E., Abel, S., Axisa, D., Borrmann, S., Crosier, J., Fugal, J., Krämer, M., Lohmann, U., Schlenczek, O., Schnaiter, M., and Wendisch, M.: Mixed-Phase Clouds: Progress and Challenges, Meteorological Monographs, https://doi.org/10.1175/AMSMONOGRAPHS-D-17-0001.1, 2017.
Langer, G. and Rodgers, J.: An Experimental Study of the Detection of Ice Nuclei on Membrane Filters and Other Substrata, Journal of Applied Meteorology and Climatology, 14, 560–570, 1975.
Li, G., Wieder, J., Pasquier, J. T., Henneberger, J., and Kanji, Z. A.: Predicting atmospheric background number concentration of ice-nucleating particles in the Arctic, Atmos. Chem. Phys., 22, 14441–14454, https://doi.org/10.5194/acp-22-14441-2022, 2022.
Li, G., Wilbourn, E. K., Cheng, Z., Wieder, J., Fagerson, A., Henneberger, J., Motos, G., Traversi, R., Brooks, S. D., Mazzola, M., China, S., Nenes, A., Lohmann, U., Hiranuma, N., and Kanji, Z. A.: Physicochemical characterization and source apportionment of Arctic ice-nucleating particles observed in Ny-Ålesund in autumn 2019, Atmos. Chem. Phys., 23, 10489–10516, https://doi.org/10.5194/acp-23-10489-2023, 2023.
Lisok, J., Markowicz, K. M., Ritter, C., Makuch, P., Petelski, T., Chilinski, M., Kaminski, J. W., Becagli, S., Traversi, R., Udisti, R., Rozwadowska, A., Jefimow, M., Markuszewski, P., Neuber, R., Pakszys, P., Stachlewska, I. S., Struzewska, J., and Zielinski, T.: 2014 iAREA campaign on aerosol in Spitsbergen – Part 1: Study of physical and chemical properties, Atmospheric Environment, 140, 150–166, https://doi.org/10.1016/j.atmosenv.2016.05.051, 2016.
Lohmann, U. and Feichter, J.: Global indirect aerosol effects: a review, Atmos. Chem. Phys., 5, 715–737, https://doi.org/10.5194/acp-5-715-2005, 2005.
Lupi, A., Busetto, M., Becagli, S., Giardi, F., Lanconelli, C., Mazzola, M., Udisti, R., Hansson, H. C., Henning, T., Petkov, B., Strom, J., Krejci, R., Tunved, P., Viola, A. P., and Vitale, V.: Multi-seasonal ultrafine aerosol particle number concentration measurements at the Gruvebadet observatory, Ny-Ålesund, Svalbard Islands, Rendiconti Lincei-Scienze Fisiche E Naturali, 27, 59–71, https://doi.org/10.1007/s12210-016-0532-8, 2016.
Mansour, K., Decesari, S., Bellacicco, M., Marullo, S., Santoleri, R., Bonasoni, P., Facchini, M. C., Ovadnevaite, J., Ceburnis, D., O'Dowd, C., and Rinaldi, M.: Particulate methanesulfonic acid over the central Mediterranean Sea: Source region identification and relationship with phytoplankton activity, Atmospheric Research, 237, https://doi.org/10.1016/j.atmosres.2019.104837, 2020a.
Mansour, K., Decesari, S., Facchini, M. C., Belosi, F., Paglione, M., Sandrini, S., Bellacicco, M., Marullo, S., Santoleri, R., Ovadnevaite, J., Ceburnis, D., O'Dowd, C., Roberts, G., Sanchez, K., and Rinaldi, M.: Linking Marine Biological Activity to Aerosol Chemical Composition and Cloud-Relevant Properties Over the North Atlantic Ocean, Journal of Geophysical Research-Atmospheres, 125, https://doi.org/10.1029/2019jd032246, 2020b.
Mansour, K., Rinaldi, M., Preissler, J., Decesari, S., Ovadnevaite, J., Ceburnis, D., Paglione, M., Facchini, M., and O'Dowd, C.: Phytoplankton Impact on Marine Cloud Microphysical Properties Over the Northeast Atlantic Ocean, Journal of Geophysical Research-Atmospheres, 127, https://doi.org/10.1029/2021JD036355, 2022.
Mason, R. H., Si, M., Chou, C., Irish, V. E., Dickie, R., Elizondo, P., Wong, R., Brintnell, M., Elsasser, M., Lassar, W. M., Pierce, K. M., Leaitch, W. R., MacDonald, A. M., Platt, A., Toom-Sauntry, D., Sarda-Estève, R., Schiller, C. L., Suski, K. J., Hill, T. C. J., Abbatt, J. P. D., Huffman, J. A., DeMott, P. J., and Bertram, A. K.: Size-resolved measurements of ice-nucleating particles at six locations in North America and one in Europe, Atmos. Chem. Phys., 16, 1637–1651, https://doi.org/10.5194/acp-16-1637-2016, 2016.
Mazzola, M., Viola, A. P., Lanconelli, C., and Vitale, V.: Atmospheric observations at the Amundsen-Nobile Climate Change Tower in Ny-lesund, Svalbard, Rendiconti Lincei-Scienze Fisiche E Naturali, 27, 7–18, https://doi.org/10.1007/s12210-016-0540-8, 2016.
McCluskey, C. S., Hill, T. C. J., Malfatti, F., Sultana, C. M., Lee, C., Santander, M. V., Beall, C. M., Moore, K. A., Cornwell, G. C., Collins, D. B., Prather, K. A., Jayarathne, T., Stone, E. A., Azam, F., Kreidenweis, S. M., and DeMott, P. J.: A Dynamic Link between Ice Nucleating Particles Released in Nascent Sea Spray Aerosol and Oceanic Biological Activity during Two Mesocosm Experiments, Journal of the Atmospheric Sciences, 74, 151–166, https://doi.org/10.1175/jas-d-16-0087.1, 2017.
McCluskey, C. S., Hill, T. C. J., Sultana, C. M., Laskina, O., Trueblood, J., Santander, M. V., Beall, C. M., Michaud, J. M., Kreidenweis, S. M., Prather, K. A., Grassian, V., and DeMott, P. J.: A Mesocosm Double Feature: Insights into the Chemical Makeup of Marine Ice Nucleating Particles, Journal of the Atmospheric Sciences, 75, 2405–2423, https://doi.org/10.1175/jas-d-17-0155.1, 2018a.
McCluskey, C. S., Ovadnevaite, J., Rinaldi, M., Atkinson, J., Belosi, F., Ceburnis, D., Marullo, S., Hill, T. C. J., Lohmann, U., Kanji, Z. A., O'Dowd, C., Kreidenweis, S. M., and DeMott, P. J.: Marine and Terrestrial Organic Ice-Nucleating Particles in Pristine Marine to Continentally Influenced Northeast Atlantic Air Masses, Journal of Geophysical Research-Atmospheres, 123, 6196–6212, https://doi.org/10.1029/2017jd028033, 2018b.
McCluskey, C. S., Hill, T. C. J., Humphries, R. S., Rauker, A. M., Moreau, S., Strutton, P. G., Chambers, S. D., Williams, A. G., McRobert, I., Ward, J., Keywood, M. D., Harnwell, J., Ponsonby, W., Loh, Z. M., Krummel, P. B., Protat, A., Kreidenweis, S. M., and DeMott, P. J.: Observations of Ice Nucleating Particles Over Southern Ocean Waters, Geophysical Research Letters, 45, 11989–11997, https://doi.org/10.1029/2018gl079981, 2018c.
Mitts, B., Wang, X., Lucero, D., Beall, C., Deane, G., DeMott, P., and Prather, K.: Importance of Supermicron Ice Nucleating Particles in Nascent Sea Spray, Geophysical Research Letters, 48, https://doi.org/10.1029/2020GL089633, 2021.
Morris, C., Conen, F., Huffman, J., Phillips, V., Pöschl, U., and Sands, D.: Bioprecipitation: a feedback cycle linking Earth history, ecosystem dynamics and land use through biological ice nucleators in the atmosphere, Global Change Biology, 20, 341–351, https://doi.org/10.1111/gcb.12447, 2014.
Morrison, H., de Boer, G., Feingold, G., Harrington, J., Shupe, M. D., and Sulia, K.: Resilience of persistent Arctic mixed-phase clouds, Nature Geoscience, 5, 11–17, https://doi.org/10.1038/ngeo1332, 2012.
Murray, B. J., O'Sullivan, D., Atkinson, J. D., and Webb, M. E.: Ice nucleation by particles immersed in supercooled cloud droplets, Chemical Society Reviews, 41, 6519–6554, https://doi.org/10.1039/c2cs35200a, 2012.
Murray, B. J., Carslaw, K. S., and Field, P. R.: Opinion: Cloud-phase climate feedback and the importance of ice-nucleating particles, Atmos. Chem. Phys., 21, 665–679, https://doi.org/10.5194/acp-21-665-2021, 2021.
National Ice-Center: IMS Daily Northern Hemisphere Snow and Ice Analysis at 1 km, 4 km, and 24 km Resolutions, Version 1, Boulder, Colorado USA, NSIDC: National Snow and Ice Data Center [data set], https://doi.org/10.7265/N52R3PMC, 2008.
Paglione, M., Hao, Y., Decesari, S., Russo, M., Mansour, K., Mazzola, M., Fellin, D., Mazzanti, A., Tagliavini, E., Manousakas, M. I., Diapouli, E., Barbaro, E., Feltracco, M., Daellenbach, K. R., and Rinaldi, M.: Unraveling Arctic submicron organic aerosol sources: a year-long study by H-NMR and AMS in Ny-Ålesund, Svalbard, Atmos. Chem. Phys., 25, 12853–12874, https://doi.org/10.5194/acp-25-12853-2025, 2025.
Pasquier, J., David, R., Freitas, G., Gierens, R., Gramlich, Y., Haslett, S., Li, G., Schaefer, B., Siegel, K., Wieder, J., Adachi, K., Belosi, F., Carlsen, T., Decesari, S., Ebell, K., Gilardoni, S., Gysel-Beer, M., Henneberger, J., Inoue, J., Kanji, Z., Koike, M., Kondo, Y., Krejci, R., Lohmann, U., Maturilli, M., Mazzolla, M., Modini, R., Mohr, C., Motos, G., Nenes, A., Nicosia, A., Ohata, S., Paglione, M., Park, S., Pileci, R., Ramelli, F., Rinaldi, M., Ritter, C., Sato, K., Storelvmo, T., Tobo, Y., Traversi, R., Viola, A., and Zieger, P.: The Ny-Alesund Aerosol Cloud Experiment (NASCENT): Overview and First Results, Bulletin of the American Meteorological Society, 103, E2533–E2558, 10.1175/BAMS-D-21-0034.1, 2022.
Porter, G., Adams, M., Brooks, I., Ickes, L., Karlsson, L., Leck, C., Salter, M., Schmale, J., Siegel, K., Sikora, S., Tarn, M., Vüllers, J., Wernli, H., Zieger, P., Zinke, J., and Murray, B.: Highly Active Ice-Nucleating Particles at the Summer North Pole, Journal Of Geophysical Research-Atmospheres, 127, https://doi.org/10.1029/2021JD036059, 2022.
Rantanen, M., Karpechko, A., Lipponen, A., Nordling, K., Hyvärinen, O., Ruosteenoja, K., Vihma, T., and Laaksonen, A.: The Arctic has warmed nearly four times faster than the globe since 1979, Communications Earth & Environment, 3, https://doi.org/10.1038/s43247-022-00498-3, 2022.
Rinaldi, M., Fuzzi, S., Decesari, S., Marullo, S., Santoleri, R., Provenzale, A., von Hardenberg, J., Ceburnis, D., Vaishya, A., O'Dowd, C. D., and Facchini, M. C.: Is chlorophyll-a the best surrogate for organic matter enrichment in submicron primary marine aerosol?, Journal of Geophysical Research-Atmospheres, 118, 4964–4973, https://doi.org/10.1002/jgrd.50417, 2013.
Rinaldi, M., Santachiara, G., Nicosia, A., Piazza, M., Decesari, S., Gilardoni, S., Paglione, M., Cristofanelli, P., Marinoni, A., Bonasoni, P., and Belosi, F.: Atmospheric Ice Nucleating Particle measurements at the high mountain observatory Mt. Cimone (2165 m a.s.l., Italy), Atmospheric Environment, 171, 173–180, https://doi.org/10.1016/j.atmosenv.2017.10.027, 2017.
Rinaldi, M., Hiranuma, N., Santachiara, G., Mazzola, M., Mansour, K., Paglione, M., Rodriguez, C. A., Traversi, R., Becagli, S., Cappelletti, D., and Belosi, F.: Ice-nucleating particle concentration measurements from Ny-Ålesund during the Arctic spring–summer in 2018, Atmos. Chem. Phys., 21, 14725–14748, https://doi.org/10.5194/acp-21-14725-2021, 2021.
Rinaldi, M., Alessia, N., Marco, P., Karam, M., and Franco, B.: INP data at Gruvebadet observatory (Ny-Ålesund) by the Dynamic Filter Processing Chamber (DFPC) in the period 2018-2020, Zenodo [data set], https://doi.org/10.5281/zenodo.15188457, 2025.
Rolph, G., Stein, A., and Stunder, B.: Real-time Environmental Applications and Display sYstem: Ready, Environmental Modelling & Software, 95, 210–228, https://doi.org/10.1016/j.envsoft.2017.06.025, 2017.
Sanchez-Marroquin, A., Arnalds, O., Baustian-Dorsi, K., Browse, J., Dagsson-Waldhauserova, P., Harrison, A., Maters, E., Pringle, K., Vergara-Temprado, J., Burke, I., McQuaid, J., Carslaw, K., and Murray, B.: Iceland is an episodic source of atmospheric ice-nucleating particles relevant for mixed-phase clouds, Science Advances, 6, https://doi.org/10.1126/sciadv.aba8137, 2020.
Santachiara, G., Di Matteo, L., Prodi, F., and Belosi, F.: Atmospheric particles acting as Ice Forming Nuclei in different size ranges, Atmospheric Research, 96, 266–272, https://doi.org/10.1016/j.atmosres.2009.08.004, 2010.
Santl-Temkiv, T., Lange, R., Beddows, D., Rauter, U., Pilgaard, S., Dall'Osto, M., Gunde-Cimerman, N., Massling, A., and Wex, H.: Biogenic Sources of Ice Nucleating Particles at the High Arctic Site Villum Research Station, Environmental Science & Technology, 53, 10580–10590, https://doi.org/10.1021/acs.est.9b00991, 2019.
Schmale, J., Zieger, P., and Ekman, A.: Aerosols in current and future Arctic climate, Nature Climate Change, 11, 95–105, https://doi.org/10.1038/s41558-020-00969-5, 2021.
Schrod, J., Thomson, E. S., Weber, D., Kossmann, J., Pöhlker, C., Saturno, J., Ditas, F., Artaxo, P., Clouard, V., Saurel, J.-M., Ebert, M., Curtius, J., and Bingemer, H. G.: Long-term deposition and condensation ice-nucleating particle measurements from four stations across the globe, Atmos. Chem. Phys., 20, 15983–16006, https://doi.org/10.5194/acp-20-15983-2020, 2020.
Screen, J. and Simmonds, I.: The central role of diminishing sea ice in recent Arctic temperature amplification, Nature, 464, 1334–1337, https://doi.org/10.1038/nature09051, 2010.
Serreze, M. and Barry, R.: Processes and impacts of Arctic amplification: A research synthesis, Global and Planetary Change, 77, 85–96, https://doi.org/10.1016/j.gloplacha.2011.03.004, 2011.
Serreze, M., Holland, M., and Stroeve, J.: Perspectives on the Arctic's shrinking sea-ice cover, Science, 315, 1533–1536, https://doi.org/10.1126/science.1139426, 2007.
Shaw, G. E.: The arctic haze phenomenon, Bulletin of the American Meteorological Society, 76, 2403–2413, https://doi.org/10.1175/1520-0477(1995)076<2403:TAHP>2.0.CO;2, 1995.
Song, C., Becagli, S., Beddows, D., Brean, J., Browse, J., Dai, Q., Dall'Osto, M., Ferracci, V., Harrison, R., Harris, N., Li, W., Jones, A., Kirchgassner, A., Kramawijaya, A., Kurganskiy, A., Lupi, A., Mazzola, M., Severi, M., Traversi, R. and Shi, Z.: Understanding Sources and Drivers of Size-Resolved Aerosol in the High Arctic Islands of Svalbard Using a Receptor Model Coupled with Machine Learning, Environmental Science & Technology, https://doi.org/10.1021/acs.est.1c07796, 2022.
Spielhagen, R., Werner, K., Sorensen, S., Zamelczyk, K., Kandiano, E., Budeus, G., Husum, K., Marchitto, T., and Hald, M.: Enhanced Modern Heat Transfer to the Arctic by Warm Atlantic Water, Science, 331, 450–453, https://doi.org/10.1126/science.1197397, 2011.
Stein, A. F., Draxler, R. R., Rolph, G. D., Stunder, B. J. B., Cohen, M. D., and Ngan, F.: NOAA'S hysplit atmospheric transport and dispersion modeling system, Bulletin of the American Meteorological Society, 96, 2059–2077, https://doi.org/10.1175/bams-d-14-00110.1, 2015.
Stohl, A.: Characteristics of atmospheric transport into the Arctic troposphere, Journal of Geophysical Research-Atmospheres, 111, https://doi.org/10.1029/2005jd006888, 2006.
Storelvmo, T., Hoose, C., and Eriksson, P.: Global modeling of mixed-phase clouds: The albedo and lifetime effects of aerosols, Journal of Geophysical Research-Atmospheres, 116, https://doi.org/10.1029/2010JD014724, 2011.
Stroeve, J., Serreze, M., Holland, M., Kay, J., Malanik, J., and Barrett, A.: The Arctic's rapidly shrinking sea ice cover: a research synthesis, Climatic Change, 110, 1005–1027, https://doi.org/10.1007/s10584-011-0101-1, 2012.
Sze, K. C. H., Wex, H., Hartmann, M., Skov, H., Massling, A., Villanueva, D., and Stratmann, F.: Ice-nucleating particles in northern Greenland: annual cycles, biological contribution and parameterizations, Atmos. Chem. Phys., 23, 4741–4761, https://doi.org/10.5194/acp-23-4741-2023, 2023.
Tobo, Y., Adachi, K., DeMott, P. J., Hill, T. C. J., Hamilton, D. S., Mahowald, N. M., Nagatsuka, N., Ohata, S., Uetake, J., Kondo, Y., and Koike, M.: Glacially sourced dust as a potentially significant source of ice nucleating particles, Nature Geoscience, 12, https://doi.org/10.1038/s41561-019-0314-x, 2019.
Tobo, Y., Adachi, K., Kawai, K., Matsui, H., Ohata, S., Oshima, N., Kondo, Y., Hermansen, O., Uchida, M., Inoue, J. and Koike, M.: Surface warming in Svalbard may have led to increases in highly active ice-nucleating particles, Communication Earth & Environment, 5, https://doi.org/10.1038/s43247-024-01677-0, 2024.
Udisti, R., Bazzano, A., Becagli, S., Bolzacchini, E., Caiazzo, L., Cappelletti, D., Ferrero, L., Frosini, D., Giardi, F., Grotti, M., Lupi, A., Malandrino, M., Mazzola, M., Moroni, B., Severi, M., Traversi, R., Viola, A., and Vitale, V.: Sulfate source apportionment in the Ny-Alesund (Svalbard Islands) Arctic aerosol, Rendiconti Lincei-Scienze Fisiche E Naturali, 27, 85–94, https://doi.org/10.1007/s12210-016-0517-7, 2016.
Vavrus, S.: The impact of cloud feedbacks on Arctic climate under greenhouse forcing, Journal of Climate, 17, 603–615, 2004.
Vergara-Temprado, J., Murray, B. J., Wilson, T. W., O'Sullivan, D., Browse, J., Pringle, K. J., Ardon-Dryer, K., Bertram, A. K., Burrows, S. M., Ceburnis, D., DeMott, P. J., Mason, R. H., O'Dowd, C. D., Rinaldi, M., and Carslaw, K. S.: Contribution of feldspar and marine organic aerosols to global ice nucleating particle concentrations, Atmos. Chem. Phys., 17, 3637–3658, https://doi.org/10.5194/acp-17-3637-2017, 2017.
Wang, X. F., Sultana, C. M., Trueblood, J., Hill, T. C. J., Malfatti, F., Lee, C., Laskina, O., Moore, K. A., Beall, C. M., McCluskey, C. S., Cornwell, G. C., Zhou, Y. Y., Cox, J. L., Pendergraft, M. A., Santander, M. V., Bertram, T. H., Cappa, C. D., Azam, F., DeMott, P. J., Grassian, V. H., and Prather, K. A.: Microbial Control of Sea Spray Aerosol Composition: A Tale of Two Blooms, Acs Central Science, 1, 124–131, https://doi.org/10.1021/acscentsci.5b00148, 2015.
Wendisch, M., Macke, A., Ehrlich, A., Lüpkes, C., Mech, M., Chechin, D., Dethloff, K., Velasco, C., Bozem, H., Brückner, M., Clemen, H., Crewell, S., Donth, T., Dupuy, R., Ebell, K., Egerer, U., Engelmann, R., Engler, C., Eppers, O., Gehrmann, M., Gong, X., Gottschalk, M., Gourbeyre, C., Griesche, H., Hartmann, J., Hartmann, M., Heinold, B., Herber, A., Herrmann, H., Heygster, G., Hoor, P., Jafariserajehlou, S., Jäkel, E., Järvinen, E., Jourdan, O., Kästner, U., Kecorius, S., Knudsen, E., Köllner, F., Kretzschmar, J., Lelli, L., Leroy, D., Maturilli, M., Mei, L., Mertes, S., Mioche, G., Neuber, R., Nicolaus, M., Nomokonova, T., Notholt, J., Palm, M., van Pinxteren, M., Quaas, J., Richter, P., Ruiz-Donoso, E., Schäfer, M., Schmieder, K., Schnaiter, M., Schneider, J., Schwarzenböck, A., Seifert, P., Shupe, M., Siebert, H., Spreen, G., Stapf, J., Stratmann, F., Vogl, T., Welti, A., Wex, H., Wiedensohler, A., Zanatta, M., and Zeppenfeld, S.: The Arctic Cloud Puzzle: Using ACLOUD/PASCAL Multiplatform Observations to Unravel the Role of Clouds and Aerosol Particles in Arctic Amplification, Bulletin of the American Meteorological Society, 100, 841–872, https://doi.org/10.1175/BAMS-D-18-0072.1, 2019.
Wex, H., DeMott, P. J., Tobo, Y., Hartmann, S., Rösch, M., Clauss, T., Tomsche, L., Niedermeier, D., and Stratmann, F.: Kaolinite particles as ice nuclei: learning from the use of different kaolinite samples and different coatings, Atmos. Chem. Phys., 14, 5529–5546, https://doi.org/10.5194/acp-14-5529-2014, 2014.
Wex, H., Huang, L., Zhang, W., Hung, H., Traversi, R., Becagli, S., Sheesley, R. J., Moffett, C. E., Barrett, T. E., Bossi, R., Skov, H., Hünerbein, A., Lubitz, J., Löffler, M., Linke, O., Hartmann, M., Herenz, P., and Stratmann, F.: Annual variability of ice-nucleating particle concentrations at different Arctic locations, Atmos. Chem. Phys., 19, 5293–5311, https://doi.org/10.5194/acp-19-5293-2019, 2019.
Wilson, T. W., Ladino, L. A., Alpert, P. A., Breckels, M. N., Brooks, I. M., Browse, J., Burrows, S. M., Carslaw, K. S., Huffman, J. A., Judd, C., Kilthau, W. P., Mason, R. H., McFiggans, G., Miller, L. A., Najera, J. J., Polishchuk, E., Rae, S., Schiller, C. L., Si, M., Temprado, J. V., Whale, T. F., Wong, J. P. S., Wurl, O., Yakobi-Hancock, J. D., Abbatt, J. P. D., Aller, J. Y., Bertram, A. K., Knopf, D. A., and Murray, B. J.: A marine biogenic source of atmospheric ice-nucleating particles, Nature, 525, https://doi.org/10.1038/nature14986, 2015.
Yun, J., Evoy, E., Worthy, S., Fraser, M., Veber, D., Platt, A., Rawlings, K., Sharma, S., Leaitch, W., and Bertram, A.: Ice nucleating particles in the Canadian High Arctic during the fall of 2018, Environmental Science-Atmospheres, 2, 279–290, https://doi.org/10.1039/d1ea00068c, 2022.