the Creative Commons Attribution 4.0 License.
the Creative Commons Attribution 4.0 License.
 | 20 Mar 2026
Six-year trend of concentrations of ultrafine particles 6 km away from a major German airport
Wolfram Birmili
Kay Weinhold
Honey Dawn Contecson Alas
Alfred Wiedensohler
Wilma Travnicek
Ultrafine particles play a crucial role in the atmosphere, both as a source of larger particles and as a factor influencing human health. We analysed hourly particle number size distributions collected during 2015–2021 from an urban background station in the Rhine-Main area in Germany, focusing on potential particle sources and multi-annual trends. The site is influenced by diffuse regional sources such as motor traffic and domestic heating, as well as Frankfurt Airport, located at a distance of 6 km. The average total particle number concentration (TNC, size range 10–500 nm) was 9.4 × 103 cm−3. TNC maxima were observed in diurnal cycles at 07:00, 13:00, and 21:00 UTC+1 (UTC+1 is used throughout the paper). The midday peak was more distinct during the warm season and dominated by nucleation mode particles (NUCs, 10–30 nm), suggesting photochemical particle formation as a source. When the wind was blowing from Frankfurt Airport, a 2.5-fold concentration average in NUCs was observed compared to other directions (11.2 × 10³ and 4.3 × 103 cm−3, 2015–2021). In 2020, during traffic restrictions related to the COVID-19 lockdown, TNC downwind of the airport was 40 %–60 % lower compared to the average of the prior 4 years. The overall trend analysis for 2015–2021 yielded consistent downward trends for TNC (−2 % yr−1), atmospheric particulate matter (PM10) mass (4 % yr−1), and nitrogen dioxide (NO2) (−5 % yr−1). While our observations of particle number size distributions show general similarities to other Central European observations, the effect of winds from Frankfurt Airport as a particle source is most prominently seen in the range 10–30 nm. The airport's role as a source of NUCs, and the rise in flights from 2015 to 2019 may be the cause of lower decline rates when compared to other locations.
- Article
(5270 KB) - Full-text XML
-
Supplement
(2531 KB) - BibTeX
- EndNote


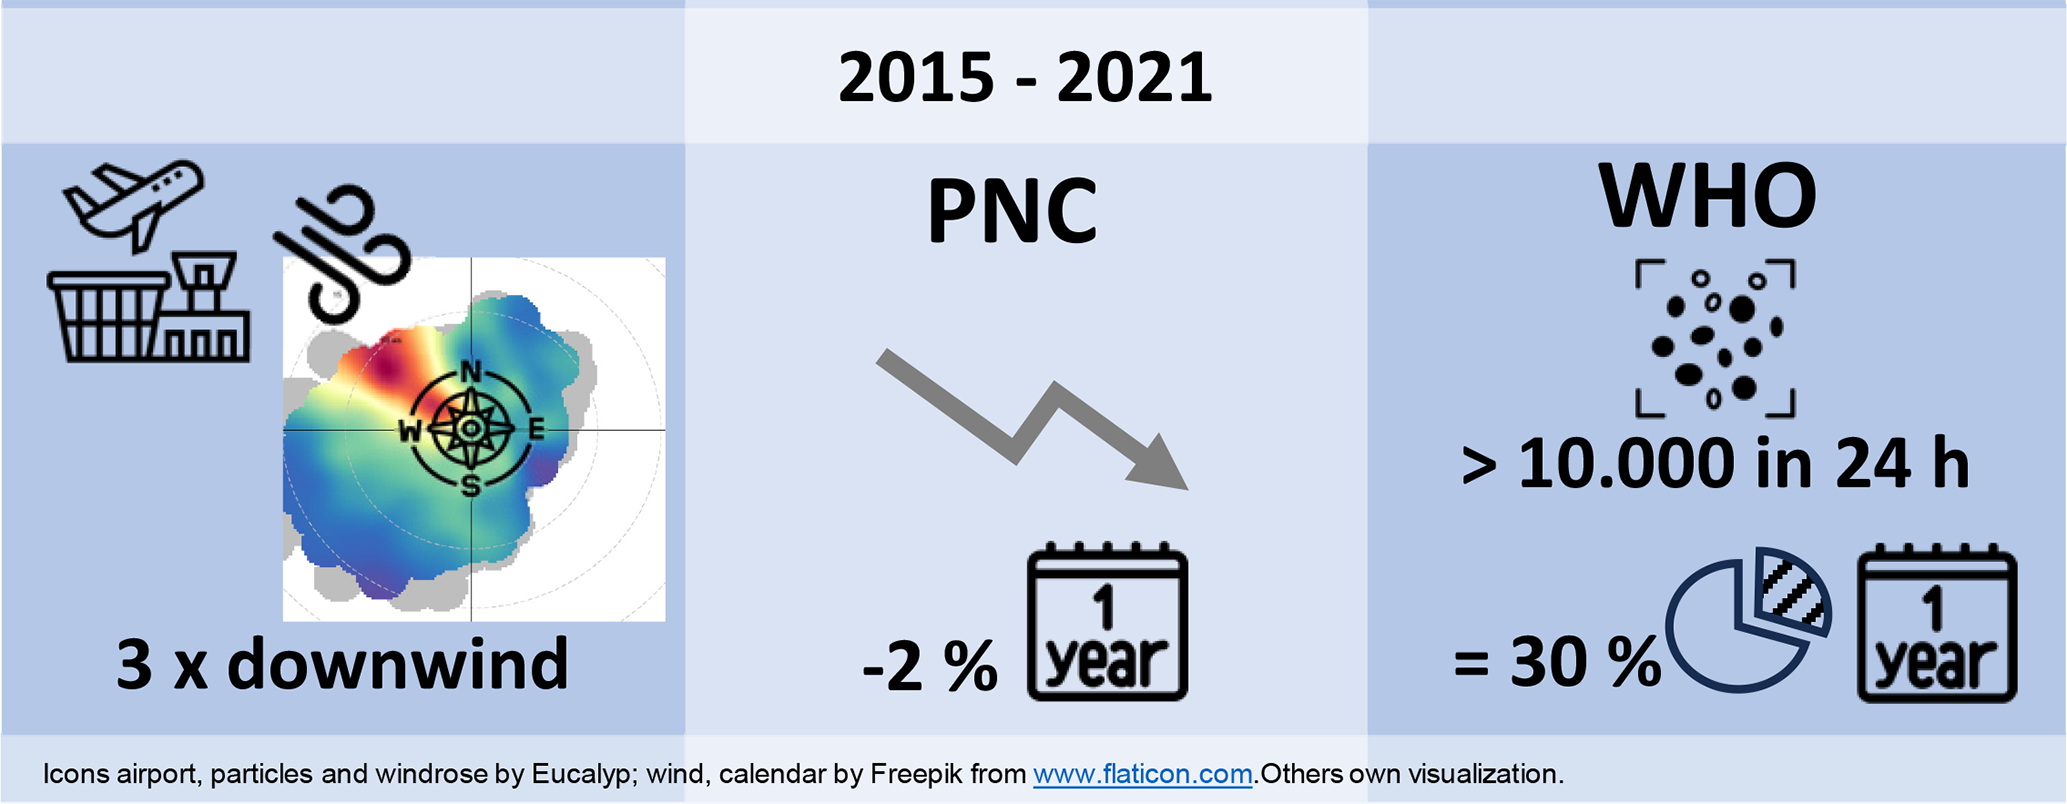
Atmospheric aerosol and air quality science have achieved major advances in recent years, but important questions remain. Specific challenges concern the sources of ultrafine particles (UFPs; particles with a size < 100 nm in diameter), their further processing in the atmosphere and finally, their impacts on climate and human health. The adverse health effects of UFPs have not been fully ascertained, mostly due to a lack of sufficient long-term studies (Cassee et al., 2019; Ohlwein et al., 2019). Nevertheless, the World Health Organization (WHO) has forwarded concrete atmospheric UFP concentrations as a “good practice statement” in its latest report (WHO, 2021). It is worth noting that the WHO defines UFP as the total particle number concentration (TNC) with a lower size limit of 10 nm or less and an open upper end. The WHO considers a 24 h mean of TNC < 1000 cm−3 as “low concentrations”. Values of TNC > 10 000 cm−3 are classified as “high concentrations”. The new EU Air Quality Directive 2024/2881 (European Parliament and Council of the European Union, 2024) includes the requirement to measure particle number concentration (PNC) and particle size distribution (PSD).
Atmospheric UFPs and the particle number size distributions (PNSDs) may occur in considerable variation in the atmosphere due to rapid dynamic processes such as particle nucleation from gas-phase compounds, subsequent particle growth, coagulation, deposition, and activation as cloud condensation nuclei (CCN) (Bousiotis et al., 2021; Yao et al., 2018). As shown by stationary and mobile observations, large and frequent spatio-temporal gradients occur in urban atmospheres (Trechera et al., 2023; von Schneidemesser et al., 2019). The overall factors influencing UFP concentrations include time of day, wind direction, season, wind speed, temperature, and solar radiation (von Bismarck-Osten et al., 2013). The mixed layer height (MLH) (Emeis et al., 2008) is a critical factor in the dispersal of any kind of pollutant near the ground. Over continental areas, the mixed layer is typically more shallow at night-time and during the winter season (Ma et al., 2014; Geiß et al., 2017), effectively trapping pollutants emitted near the ground.
Combustion is a major source of UFP, including a range of individual sources such as the engines of vehicles, aircraft, and ships, as well as power- and heat-generation plants, and domestic heating. Airborne measurements suggest that plumes from industrial plants contribute to 10 %–40 % of background UFP in Germany (Junkermann et al., 2016). The effects of road traffic are evidenced by numerous studies in urban areas (e.g. Wehner et al., 2002; Gani et al., 2021).
A contrasting phenomenon is secondary new particle formation (NPF), i.e. nucleation from gaseous precursors and subsequent growth into larger diameters. This process is typically driven by the photochemical generation of the combination of one or more of the following compounds: sulfuric acid, amines, and organic molecules. This may occur simultaneously over large spatial areas and is independent from combustion-driven UFP emission (Kerminen et al., 2018). In a continental atmosphere, combustion-derived UFPs and (secondary) NPFs may overlap in observations, making a separation of the contributions difficult. Ma and Birmili (2015) attempted to separate these contributions based on multiple-site observations and concluded that secondary NPFs contributed up to 30 % of nucleation mode particles in an urban area. Clustering analysis identified NPFs as the most important source for 16 % of particle size distributions in southern Europe (Brines et al., 2015). Several studies have intensely discussed the source apportionment of UFPs (Garcia-Marlès et al., 2024; Hopke et al., 2022; Trechera et al., 2023; Vörösmarty et al., 2024).
Aircraft engines emit a large fraction of UFPs as nucleation mode particles (NUCs hereafter) (Brock et al., 2000). Not surprisingly, airports are significant sources of elevated UFPs as well, particularly in the NUC range (Lorentz et al., 2019; Stacey, 2019; Rivas et al., 2020). NUC formation after aircraft exhaust involves a dynamic interplay of chemical species. Sulfuric acid often acts as the primary nucleating agent (Schneider et al., 2005). Lower fuel sulfur content increases the relative contribution of organic compounds to NUC formation (Yu et al., 1999). Jet engine lubricants contribute to the UFP mass fraction (Ungeheuer et al., 2021). Atmospheric observations downwind from airports typically show elevated NUC concentrations, most pronounced at about 5–10 km: Los Angeles showed a 4-fold increase at 10 km (Hudda et al., 2014). Amsterdam exhibited a 3-fold increase at 7 km (Keuken et al., 2015). Boston demonstrated a 1.6- to 3-fold increase at 5 km (Hudda et al., 2018). Zurich modelling suggested a 2- to 10-fold increase at 3 km (Zhang et al., 2020). London measurements revealed a 10-fold increase at 1.2 km (Masiol et al., 2017). At distances exceeding 20 km, tower measurements show a shift towards Aitken mode particles (AITs, 30–100 nm). This shift reflects particle growth from NUCs to AITs over several hours (Harrison et al., 2019; Keuken et al., 2015).
Data on atmospheric UFP have been collected over long enough time periods to identify trends. Long-term observations in North America suggest an increase in UFPs over time (Chen et al., 2022). In Germany and Europe, however, decreasing trends were observed (Sun et al., 2020; Trechera et al., 2023). This decrease was associated with efforts in air quality control, although these studies did not explicitly investigate the influence of aircraft emissions.
This work presents new PNSD data from an urban background station in the Rhine-Main area of Germany, collected between 2015 and 2021, and builds upon previous research on UFPs in the vicinity of Frankfurt Airport (FRA) (Gregor et al., 2015). Our objective is to examine the impact of anthropogenic sources on local air quality. In particular, we focus on NUC and UFP concentrations from Frankfurt Airport at a distance of 6 km, considering the impact of time of day, season, and wind direction. We also assess the specific impact of the lockdown period during the COVID-19 pandemic, with its reductions in traffic (Putaud et al., 2021). To our knowledge, this is the first study to examine the impact of an airport on a downwind site over a 6-year period.
2.1 Study area
This study is based on atmospheric measurements in the Rhine-Main metropolitan region (2.8 million inhabitants), including the city of Frankfurt (Main). An essential feature is Frankfurt Airport, which ranked fourth to sixth in Europe for passenger volume during 2015–2021. Observations were made at one site for PNSDs and three other sites for auxiliary observations, shown in Fig. 1. For the exact positions of the sites, see Table 1.
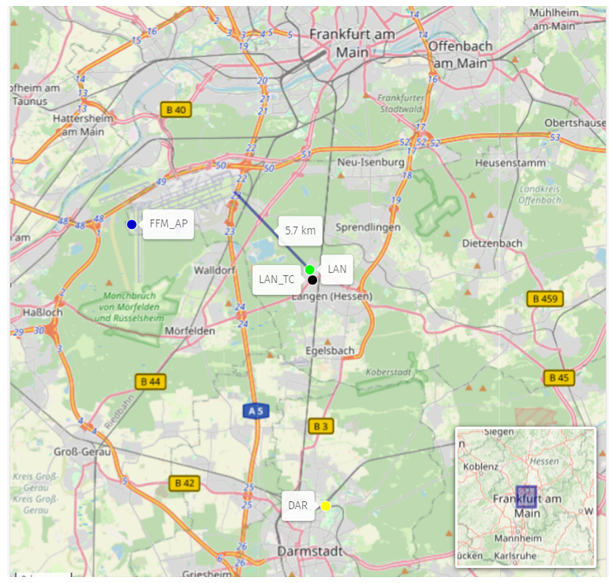
Figure 1Location of stations: LAN-provided data on TNC, NUC, AIT, and ACC. DAR, FFM_AP, and LAN_TC provide auxiliary data. © OpenStreetMap contributors 2025. Distributed under the Open Data Commons Open Database License (ODbL) v1.0.
Table 1List of air quality sites supplying datasets to this study, with location and type of environment. Coor.: coordinates; Alt.: altitude; UB: urban background; Met: meteorological parameters; TC: traffic count; PNC: particle number concentration.
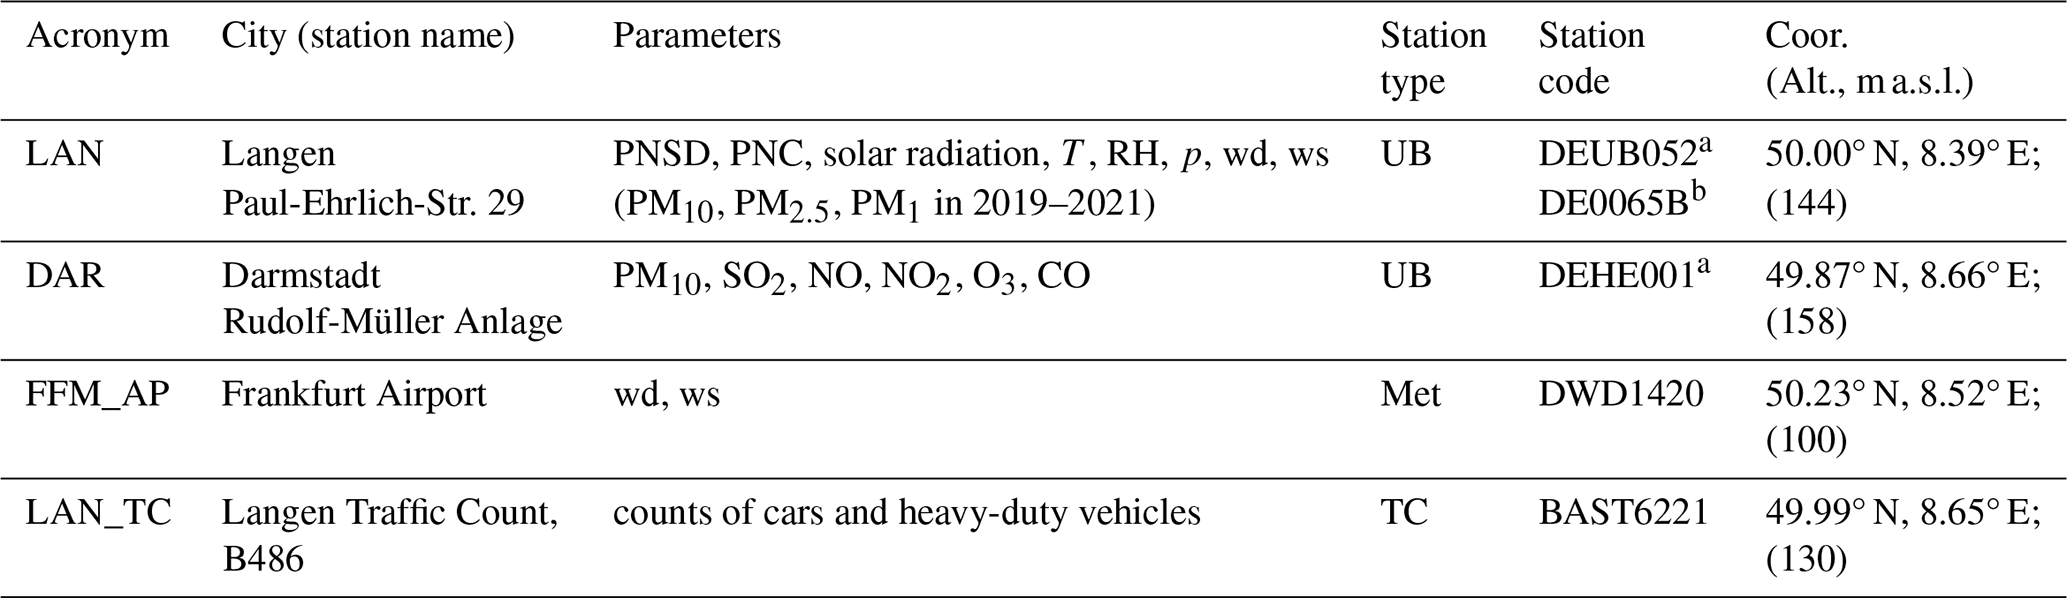
a EU station code. b EBAS station codes.
For this study, we used PNSD data from the years 2015–2021 at LAN (Langen), excluding 2016, resulting in a 6-year trend analysis. We excluded 2016 due to its low data coverage (< 55 %). PM concentration measurements at LAN lasted from 1 January 2019 to 31 December 2021.
-
LAN (Langen) is the main observation site for particle number size distributions (PNSDs). The urban background site is on the roof of the laboratory building of the German Environment Agency, or Umweltbundesamt (UBA), in Langen. This is a mixed business/residential neighbourhood 1.5 km northwest of the city centre (approximately 40 000 residents). It lies 15 km south of Frankfurt (Main) and 15 km north of Darmstadt. For further information, site classification and details can be found in Birmili et al. (2016) and Sun et al. (2020). Significant roads are located in the vicinity of the site. These include 500 m to the south (B486 federal road, ca. 24 000 vehicles d−1, 6 % heavy-duty vehicles), 3 km to the east (A661 motorway, ca. 70 000 vehicles d−1, 6 % heavy-duty vehicles), and 4 km to the west (A5 motorway, ca. 130 000 vehicles d−1, 11 % heavy-duty vehicles). An overview of parameters is given in Table 1 and additional information in Table S1 in the Supplement. In addition to the PNSD data from LAN, we also used data from three additional observation sites:
-
DAR (Darmstadt) is an urban background site that supplies general air quality data in the city of Darmstadt (Rudolf-Mueller-Anlage), 15 km south of LAN and 18 km southeast of Frankfurt Airport. It is operated by the governmental authority Hessian Agency for Nature Conservation, Environment and Geology (HLNUG, 2023a). Hourly concentrations are provided: NO, NO2, CO, O3, SO2, and PM10 mass. The longer distance, particularly between the two stations LAN and DAR, made it difficult to adequately compare the gaseous pollutants to PNSDs.
-
FFM_AP (Frankfurt Airport) provides data on meteorological parameters. It is situated on flat grassland at the edge of the airport field. It is operated by the German Weather Service (DWD). Because buildings and building components to the northeast were shaded by winds, we preferred the weather parameters from FFM_AP over LAN. For completeness, wind roses for both LAN and FFM_AP for 2015–2021 are given in the Supplement (see Fig. S1).
-
LAN_TC (Langen Traffic Count) is an automatic counting station for vehicular traffic at the edge of the B486 federal road, 1 km south of LAN. It is operated by the German Federal Highway Research Institute (BASt, 2023).
It is expected that traffic emissions from major highways and local roads less than 5 km away will affect LAN measurements (here, the traffic count is recorded at the nearby station LAN_TC). Urban emissions such as domestic heating and limited industrial sources can be found in the surroundings of LAN. Natural gas is primarily used for domestic and commercial heating, with residential wood combustion likely to have increased recently. Residential wood combustion has been identified as the most important source of VOCs during winter in a city (Languille et al., 2020). There is a gas-fired power plant (DFS Energy Centre) 500 m to the north, with 120 MWh fuel consumption per year (DFS, 2022).
A 430 MW coal-fired power plant in Frankfurt (Main), 11 km north, may be the primary source of SO2 emissions. In Hesse, industry accounts for over 70 % of the total 2000 t yr−1 SO2 emissions, with aircraft burning kerosene up to 300 m above ground contributing less than 10 % (HLNUG, 2023b). The transport of polluted air from eastern Europe to eastern Germany is a major source of PM10 mass (50 %) and SO2 (van Pinxteren et al., 2019).
2.2 Instrumentation
The following instrumentation was used for atmospheric measurements at the main observation site, LAN: particle number size distributions (PNSDs) were measured by a scanning mobility particle size spectrometer (MPSS). We used a TSI MPSS (TSI Inc., USA, model 3936), modified by the Leibniz Institute for Tropospheric Research (TROPOS), Leipzig. The original TSI instrument was augmented with additional hardware and software from TROPOS, and Nafion® dryers were installed in the system for aerosol and sheath air conditioning. We used the negative high voltage of the differential mobility analyser (DMA). As a condensation particle counter (CPC), TSI model 3010 was used before Nov 2016, and TSI model 3772 (both with a Dp50 = 10 nm) afterwards. An X-ray neutraliser (TSI model 3087) was used for the bipolar charging of ambient aerosols. Prior to size classification, the aerosol was dried below 50 % relative humidity (RH), as opposed to the optimal 40 % RH (CEN, 2020). In this instance, hygroscopic characteristics and other water uptake processes may have caused the particles to grow, resulting in larger particle sizes. Particles smaller than 10 nm also grow and would therefore lead to an even higher proportion of NUCs. Humidity was present between 40 % and 50 % of the time, particularly during the summer months. After multiple charge inversion, the MPSS provides PNSDs across a particle size range of 10–500 nm. Regular quality control was performed in association with the World Calibration Centre for Aerosol Physics (WCCAP), Leipzig, Germany. A catalytic stripper (Catalytic Instruments, CVF500) operating at 400 °C was used since mid-2016 to remove gas-phase hydrocarbons (1-butanol) from the exhaust of the CPCs.
To provide standardised sampling conditions, a PM1 mass inlet (Digitel AG and sampling line PSE1, Riemer) was used at a total flow of 33 L min−1, heated to 25 °C. The temperature in the measurement container ranged between 20 and 25 °C, as controlled by a combination of air conditioning and heating. Although direct solar radiation heated the sampling line to 31 °C during the summer, the aerosol was cooled to the temperature of the measurement container air as it passed through the sampling line and Nafion® dryers. As a result, the PNSD temperature range of 5 °C was ignored throughout the year. For more information, see Table S1. We are aware that inlet heating has not been recommended since 2020 and that the PM1 mass inlet should be PM2.5 or PM10 (CEN, 2020). We recommend that future studies meet the UFP measurement requirements of ACTRIS and CEN (CEN, 2023, 2020), as well as Wiedensohler et al. (2018, 2012). Therefore, in future we will use an adapted MPSS of TROPOS for PNSD from 10 to 800 nm, including improved sampling according to CEN. Then, we will dry the sampled aerosol below 40 % RH and use a PM2.5 inlet as is recommended in the Service Tool 1 prepared within the “Research Infrastructures Services Reinforcing Air Quality Monitoring Capacities in European Urban & Industrial AreaS” EU project (RI-URBANS, 2024).
The meteorological parameters (FFM_AP) and the concentrations of PM mass and gaseous pollutants (DAR) were recorded at the corresponding nearby stations using instruments that comply with European legislation standards. All data obtained were averaged to hourly values.
2.3 Data treatment
The non-parametric Mann–Kendall test (Kendall, 1975; Mann, 1945) was used to determine an increasing or decreasing trend over time. In the presence of a statistically significant trend, the amount was quantified by the Theil–Sen slope. This is the median of all possible slopes between the data pairs (Sen, 1968; Theil, 1992). To accomplish this, monthly data series spanning more than 6 years were aggregated with a 30 % threshold and de-seasonalised using the seasonal decomposition of time series by loess (Cleveland et al., 1990). It should be noted that a 6-year time series for identifying trends is quite short. Data preparation and statistical analysis were carried out with R (v3.6.1; R Core Team, 2019) and the Openair package (v2.18-2, 11 March 2024) (Carslaw and Ropkins, 2012). To better compare the contributions to exposure to an air pollutant between the modes, we have divided the 10° cut wind sectors into 20 or 30° sectors: northeast (NE) 40–60°; northwest (NW) 290–310°; and southwest (SW) 190–220°. The TNC in this study has three particle modes: nucleation (NUC: 10–30 nm), Aitken (AIT: 30–100 nm), and accumulation (ACC: 100–500 nm). The specific size range for NUC often depends on the instrumentation used for measurement, the specific scientific question being addressed, and the environment being studied (e.g. urban, remote, marine). It is currently defined as 3–25 nm (Wehner et al., 2005) but with higher lower and upper limits for modelling aerosols of 10–40 nm (Lupascu et al., 2015). In this study, we defined NUC with a lower limit of 10 nm based on the equipment used (Trechera et al., 2023) and an upper limit of 30 nm to also capture the slight overlap of nucleation mode particles with Aitken mode particles.
In the LAN dataset 2015–2019, high particle number concentrations were detected in the finest size fractions (Trechera et al., 2023). A measurement in the 10 nm range places high demands on instrumental detection, as the CPC used has a low detection efficiency in that range. Therefore, instrument-to-instrument variability has been observed to be higher – below 20 nm – than above this size (Wiedensohler et al., 2012). However, this higher variability has considerable effects, especially on the number concentrations in NUC.
We are aware that the proportion of larger particles in the 500–800 nm range is not measured, in accordance with CEN guidelines (2020).
3.1 Particle number concentrations of size fractions
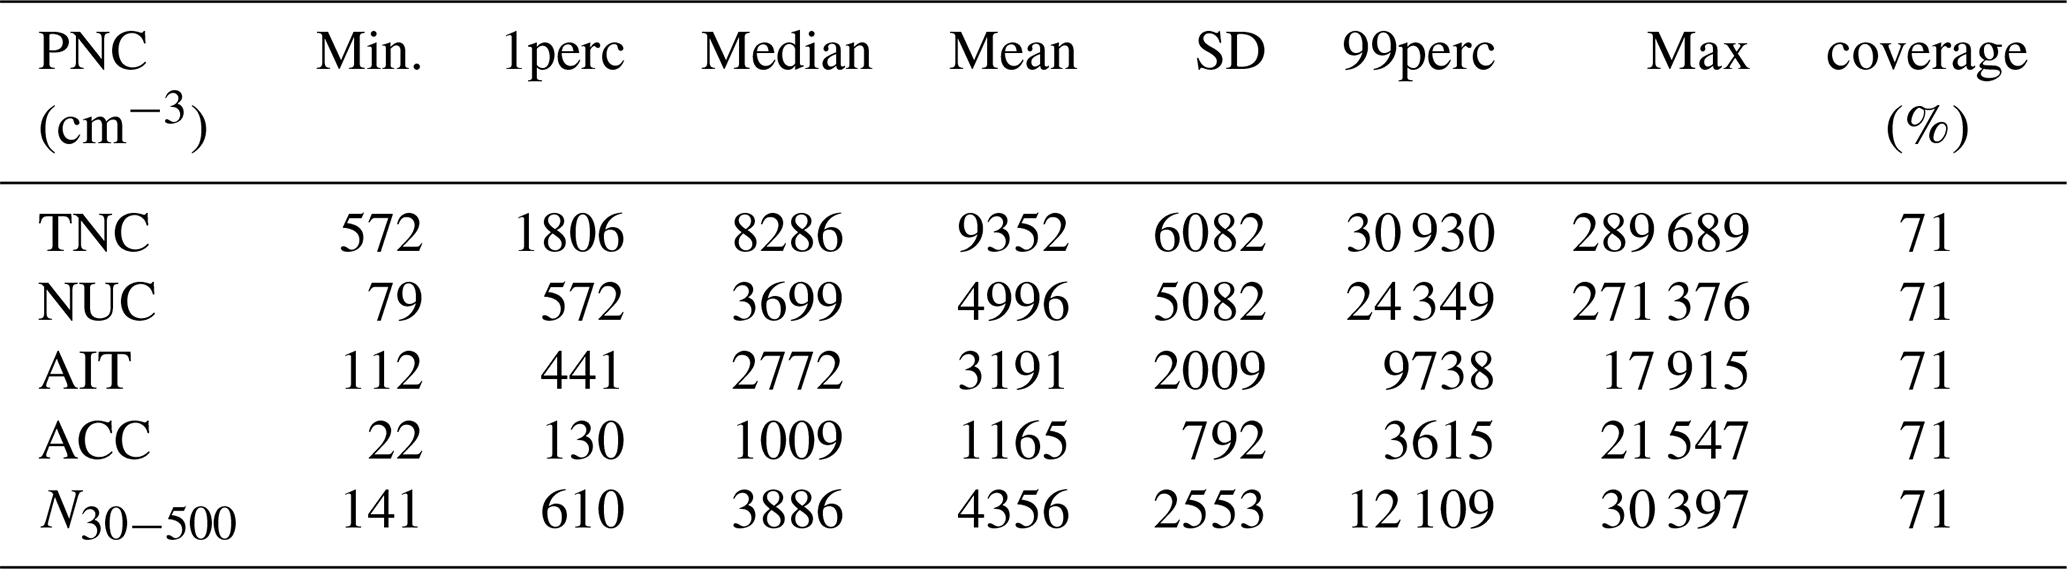
Table 2 presents the multi-annual statistics of TNC-derived PNSD (10–500 nm). The corresponding data for the year 2021 is given in Table S3. The median TNC was 8.2 × 103 cm−3 (7.9 × 103 cm−3 in 2021). The NUC range had the highest fraction of TNC (median 3.7 × 103 cm−3, 44 % in 2015–2021; 3.9 × 103 cm−3, 49 % in 2021). These values are within the typical range of other urban background stations in Germany and Europe (Sun et al., 2020; Trechera et al., 2023). The highest 1 % of hourly TNC ranged from 31 to 290 × 103 cm−3 for the entire period and from 27 to 54 × 103 cm−3 in 2021.
Table 2Hourly concentrations at Langen (LAN) 2015–2021 (2016 excluded) for nucleation, Aitken and accumulation mode particles (NUC, N10−30; AIT, N30−100, and ACC, N100−500), and total number concentration (TNC, N10−500). Data coverage in % per year (% yr−1).
3.2 Temporal trend of TNC
Figure 2 displays the temporal trend of seasonal mean TNC at LAN from 2015 to 2021, with seasons defined as 3-month periods (winter: December–February).
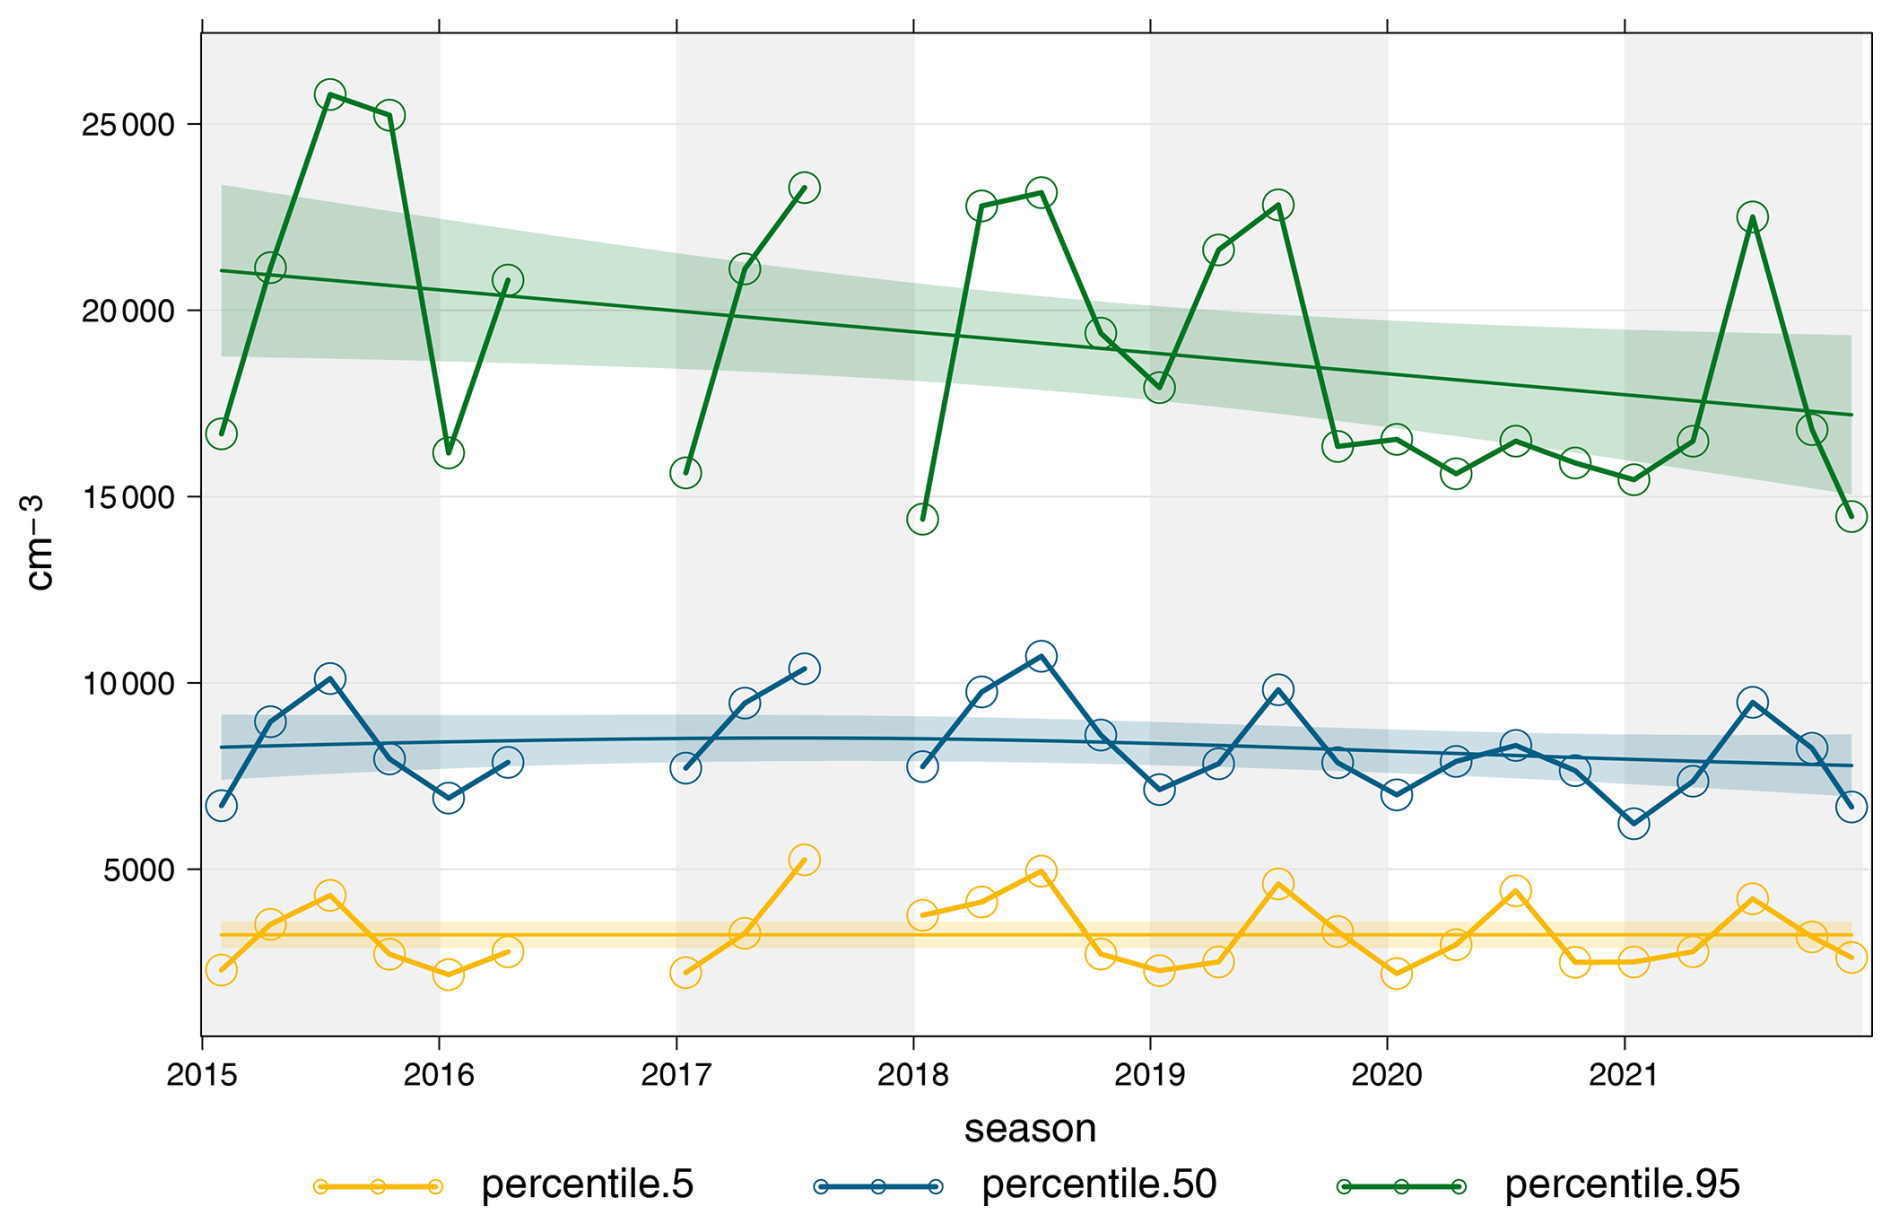
The regression line (computed using R) is shown without statistical parameters to maintain methodological clarity, as linear regression is applied here while the Theil–Sen estimator is used in subsequent figures. The moving average reveals a decreasing trend for the 95th percentile, with a pronounced 25 % drop in spring 2020.
The drop of 25 % in 95th percentile in spring 2020 (Fig. 2) corresponded to a decrease in traffic related to the COVID-19 lockdown. Landings and take-offs (LTOs) decreased by 70 % (Schultheiß-Münch et al., 2022) (Sect. 3.6) and car traffic on motorways by 16 % (BASt, 2023) in 2020, compared to 2019 for car traffic (at LAN_TC) and 2015–2019 for airports. Several studies have examined the environmental impacts of traffic restrictions during the COVID-19 lockdown. In Spain, COVID-19 lockdown restrictions reduced traffic intensity by up to 80 %, resulting in lower levels of combustion-related pollutants NO2, CO, and SO2 (Putaud et al., 2021; Querol et al., 2021).
Figure S2 shows annual box plots for TNC to complete the picture. The yearly medians confirm the general downward trend.
To quantify long-term changes, we applied Theil–Sen trend analysis (see Sect. 2.3) to monthly means of daily values from 2015 to 2021 (Table S6). For better representation, Fig. 3 shows Theil–Sen trend lines from 2015 to 2021 on the basis of monthly means of daily mean values (see Table S6). The trend for TNC (Fig. 3a) yielded a highly significant (P < 0.001) decrease of −2.3 % yr−1. Even for the shorter period of 2015–2019 when excluding year 2020 as a special year of pandemic-caused reductions, the trend was still −1.9 % yr−1 but less significant (P < 0.05) (see Table S6). Trend analyses for an earlier period (2009–2018) at German Ultrafine Aerosol Network (GUAN) stations in Germany showed a stronger decrease between −2.6 % yr−1 to −6.3 % yr−1 for TNC (20–800 nm) (Sun et al., 2020).
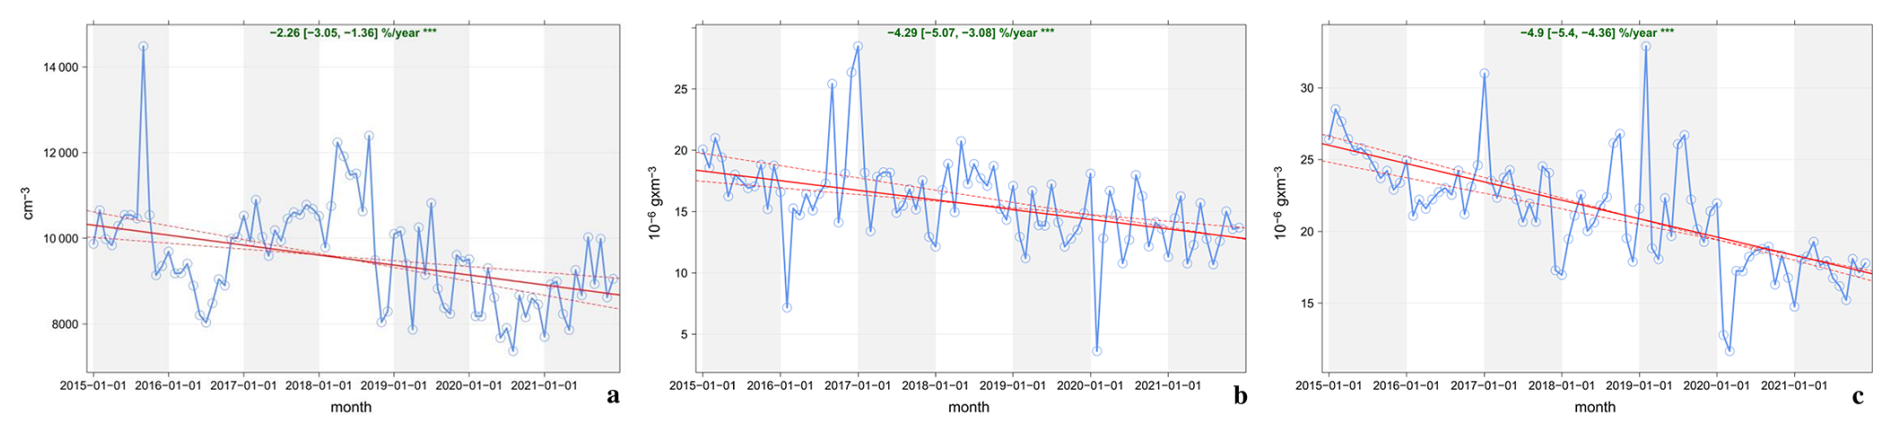
Figure 3Theil–Sen trend (seasonal effects excluded) for monthly means from 2015 to 2021 for all wind directions for (a) LAN: TNC, DAR: (b) PM10, and (c) NO2.
Other components also showed a highly significant (P < 0.001) decrease, with even higher rates: PM10 −4.3 % yr−1 (Fig. 3b) and NO2 −4.9 % yr−1 (Fig. 3c). In contrast, some components showed a significant (P < 0.01) increase: CO 3.5 % yr−1, ozone 1.5 % yr−1 (see Table S4).
When considering Table S4, the decrease for the different particle size ranges was the highest for NUC −2.9 % yr−1 at P < 0.001 (2015–2021). The decrease was lower for AIT −2.0 % yr−1 (2015–2021). ACC showed no significant trend or even showed an increase of 3.3 % yr−1 (2015–2019). Overall, the decrease in TNC seems to be associated primarily with a decrease in the subfraction NUC. This decrease is in line with decreasing trends in other combustion-related compounds of mainly anthropogenic origin, such as NO2, PM10; for NO and SO2, see Table S4. In contrast, CO, another combustion-related pollutant, increased as well as ozone.
The airport as an additional source of NUCs could be the reason for the lower decline rates compared to the other locations. When only wind from the airport is considered, the trend is higher (−3.7 % yr−1, 2015 to 2021, see Fig. 4a). Here, the pandemic year 2020 shows a dip before increasing again in 2021. This could be due to reduced emissions from the airport. The decrease in wind from the other directions was lower at −1.8 % yr−1 (Fig. 5a) and showed no visible impact in 2020.

Figure 4Theil–Sen trend (seasonal effects excluded) for monthly means, 2015–2021, for wind from airport: WR 270–340°, for (a) LAN: TNC, DAR: (b) PM10 and (c) NO2.
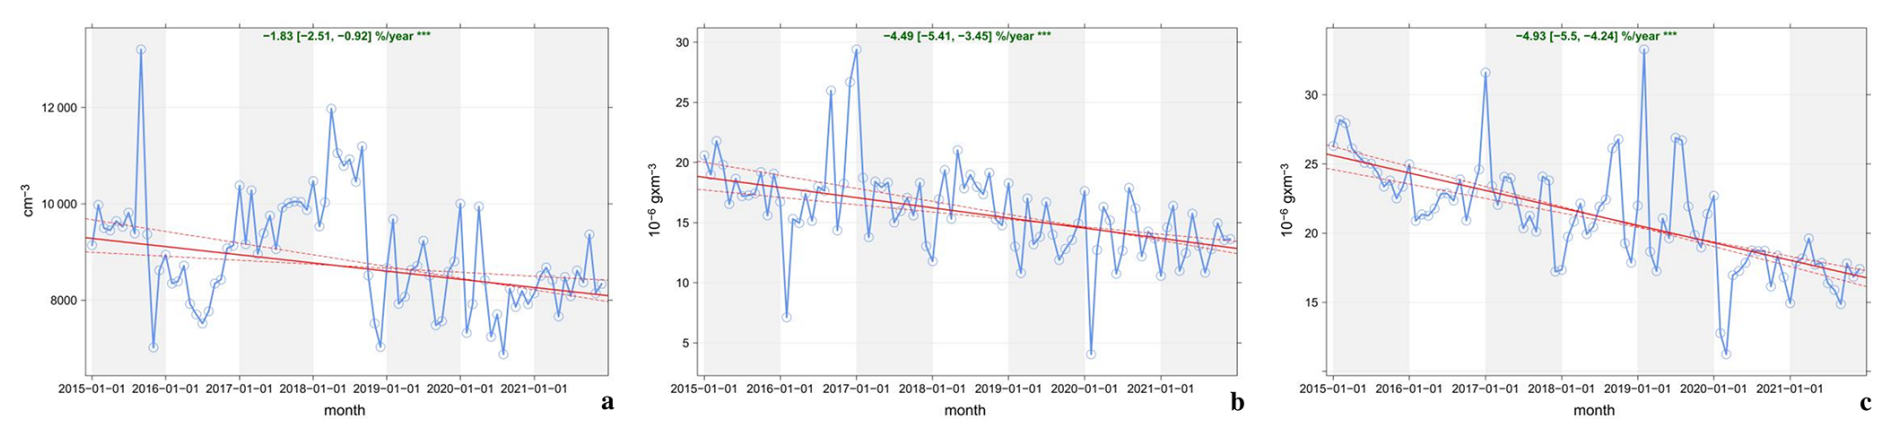
Figure 5Theil–Sen trend (seasonal effects excluded) for monthly means, 2015–2021, from wind not from airport: WR 350–360° + 0–260°, for (a) LAN: TNC, DAR: (b) PM10 and (c) NO2.
3.3 Influence of sources and meteorological parameters
In this section, we analyse the variations of PNSD and its subfractions as a function of different meteorological variables. For the analysis of the temporal variation of the auxiliary compounds, we focus on the available data from 2019 to 2021.
3.3.1 Influence of wind direction on particle number concentrations
Figure 6 shows the average particle number concentration of all the years included in this analysis for each subfraction of the PNSD as a function of wind direction (aggregated to 10° steps) and wind speed (as distance from the centre). From this figure we can see high concentrations coming from the direction of the airport (NW, indicated with a white arrow) with a maximum of 16 × 103 cm−3 for NUCs. However, from this figure alone, it is unclear which factors influence the other size fractions AIT (Fig. 6b) and ACC (Fig. 6c), showing a maximum that could originate from various directions. Therefore, we analyse further by splitting the polar plot into the different years as shown in Fig. 7.
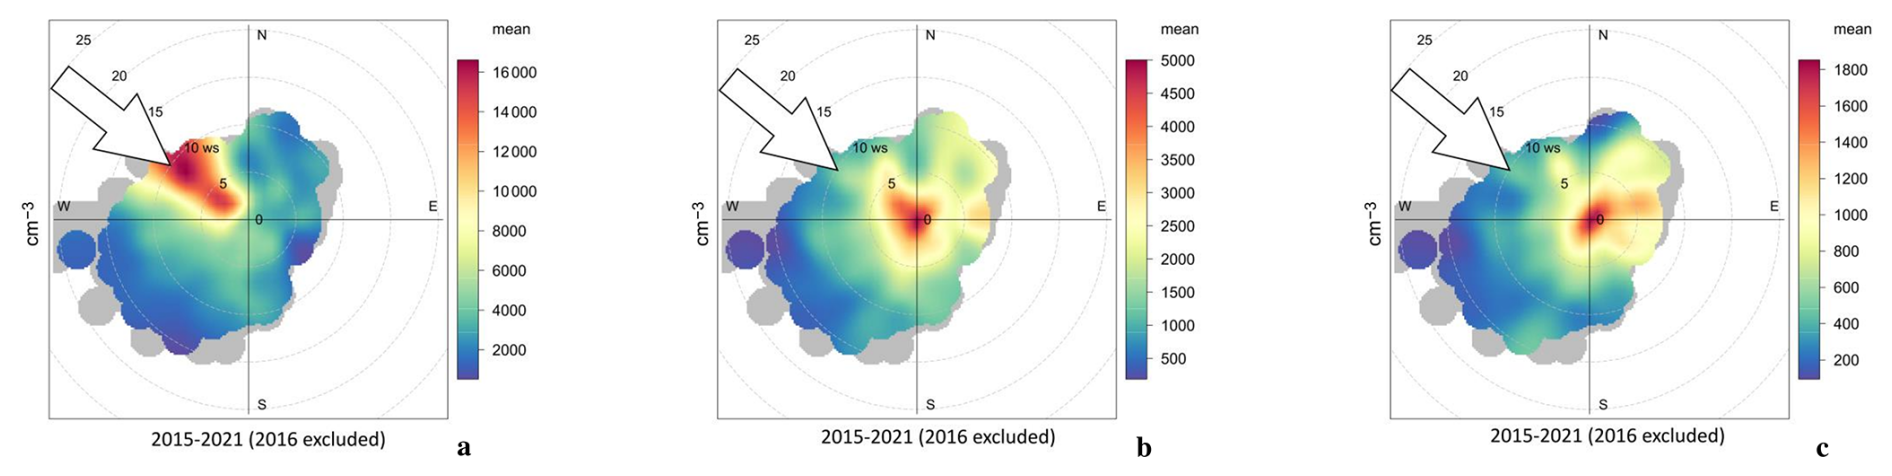
Figure 6Polar plot for particle number concentration in cm−3, average of hours of the years 2015–2021 (2016 excluded), in LAN. (a) NUC, (b) AIT, and (c) ACC. Grey spots represent cases less than 2 h. The arrow indicates the wind from the airport.
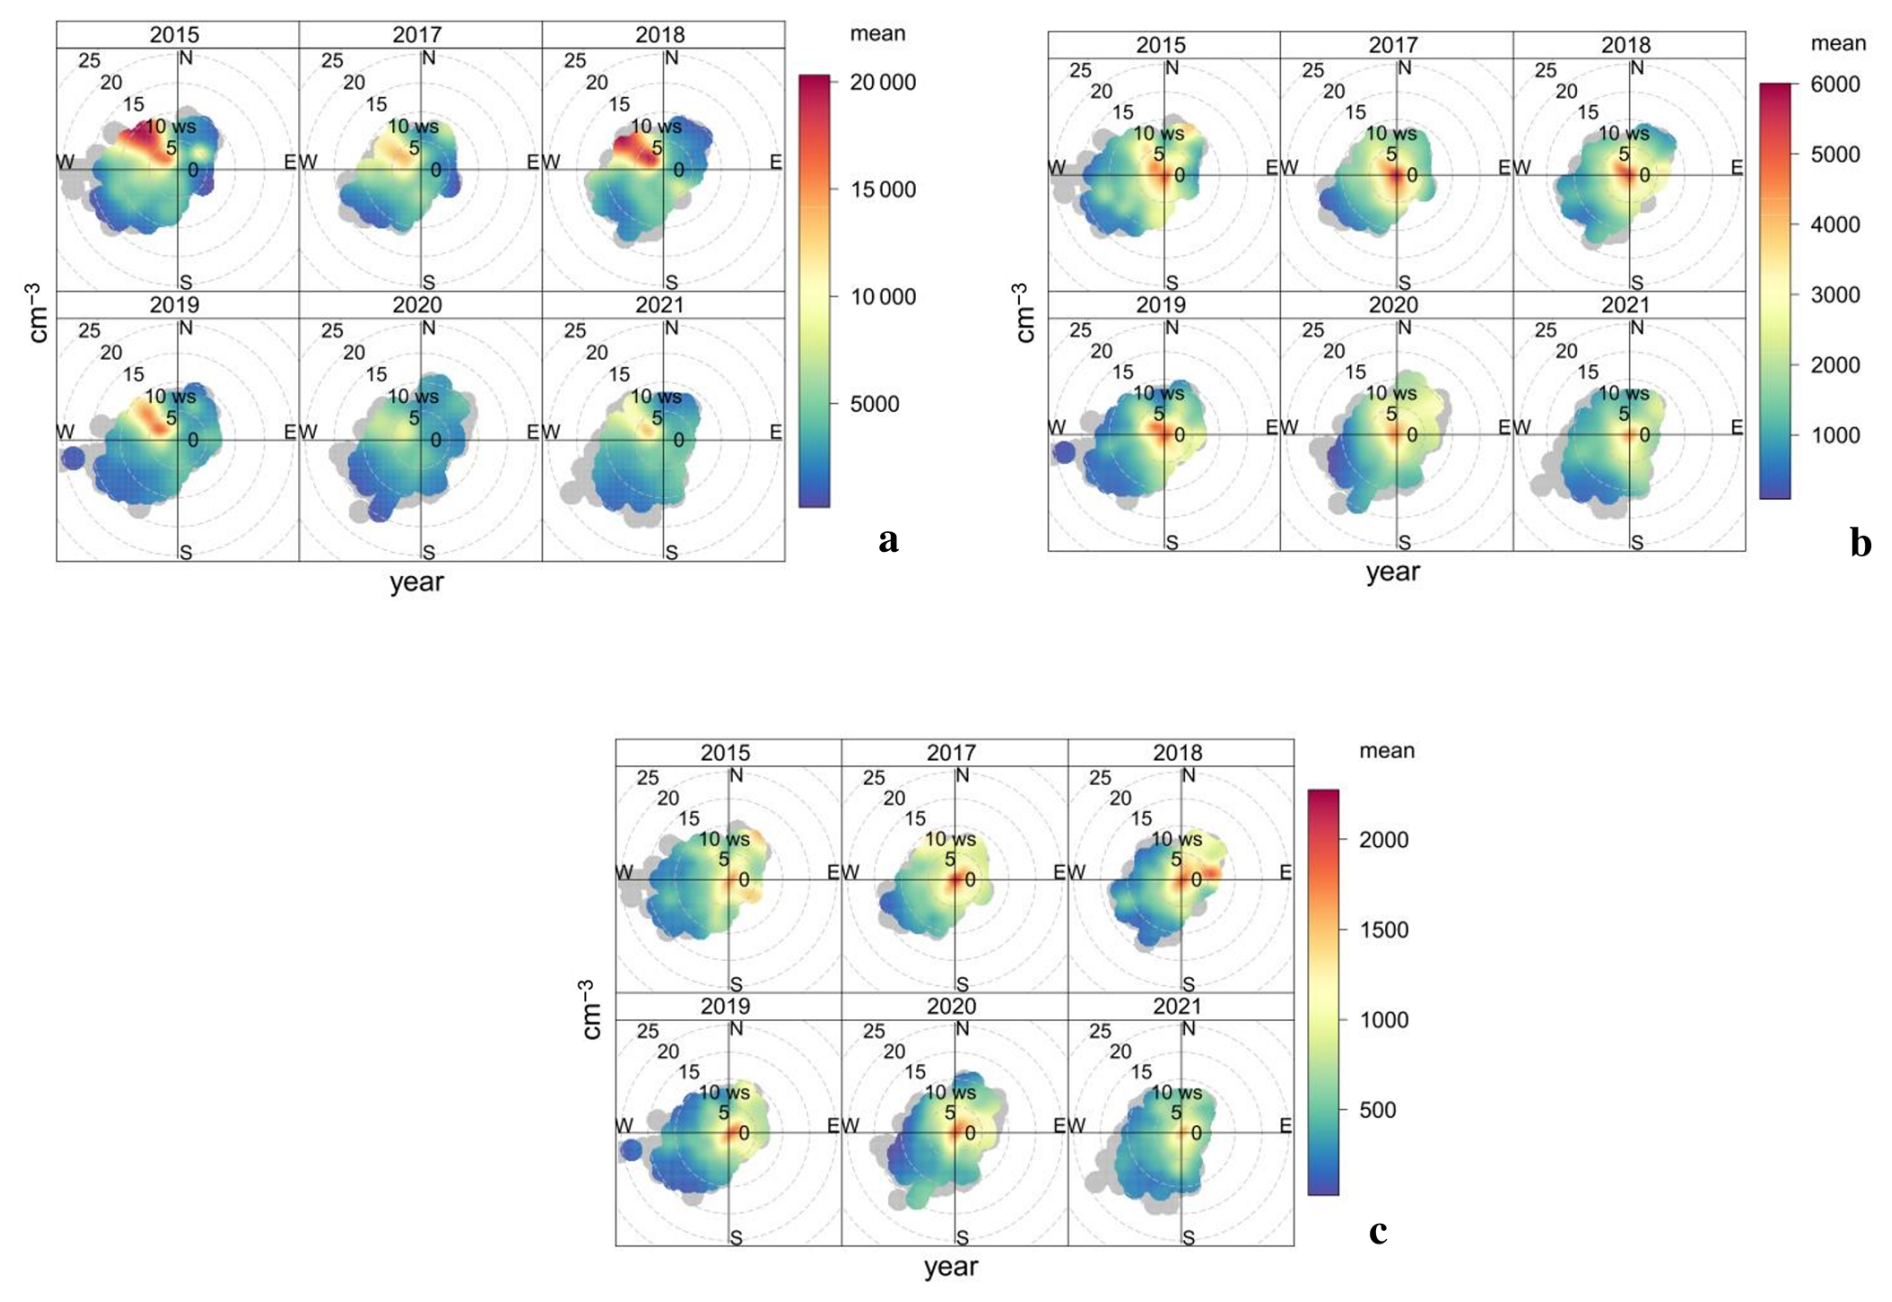
Figure 7Polar plot for particle number concentration in cm−3, average of hours separated from 2015 to 2021 (excluding 2016), in LAN. (a) NUC, (b) AIT, and (c) ACC. Grey spots represent cases less than 2 h.
In 2020 (Fig. 6a), the lowest maximum value of NUCs was observed with 7 × 103 cm−3 from the NW, which was reduced to 50 % compared to the average of all previous years. This year also had the lowest air traffic according to the Frankfurt Airport Air Traffic Statistics 2023 (Schultheiß-Münch et al., 2024) (Sect. 3.2). The maximum increased again in 2021. The highest 10° concentration was measured in 2018 from the NW at 9 m s−1 with 20 × 103 cm−3. In 2021, NW showed lower concentrations of 12 × 103 cm−3 than in the years before 2020, with 12–20 × 103 cm−3. We conclude that the airport 6 km away has a strong influence on NUC concentrations.
AIT concentrations were highest in three directions: NW, NE, and S, reaching up to 4.5 × 103 cm−3 at wind speeds of less than 3 m s−1. The lowest concentration was observed from the SW with a 10 times lower concentration of 0.5 × 103 cm−3. Figure 7b depicts the development of the average individual years. The highest concentration was recorded in 2017 from all directions at < 1 m s−1, while the lowest concentration was in 2020, with SW winds at 15 m s−1.
The highest ACC concentration of 1.6 × 103 cm−3 was measured from all directions at < 2 m s−1. The second-highest concentration was 1.2 × 103 cm−3 and came from the E at 7 m s−1. Figure 7c depicts the development of the average individual years. The maximum was found in 2018 from E at 5 m s−1 with 1.8 × 103 cm−3. The minimum in 2019 and 2020 from SW was < 0.1 × 103 cm−3.
The 2019–2021 PM concentration polar diagrams in LAN and DAR showed a pattern that was similar to ACC (Fig. S3a, b). The highest concentration was found in the NE quadrant, especially in 2019 and 2021, with wind speeds of 10 m s−1 from the NNE.
Figure S4 depicts the average NO2 concentrations in the DAR over different years. Concentrations are highest from the northwest at 10 m s−1 and lowest from the southwest at wind speeds ranging from 0.5 to 5 m s−1 throughout the years. The NO2 pattern appears to be partly influenced by the Frankfurt Airport, located 18 km away, and local sources. However, the highest concentration from NW was not found in 2019 like with NUC, possibly due to the changing ratio between NO2 and NUC from 2015 to 2019.
In contrast to NUC, where the highest concentration is in the direction of the airport, like in other studies before (Keuken et al., 2015), AIT and ACC showed a different pattern that is not directed towards the airport. These bigger particles could be influenced less by air traffic and more by other sources, such as tailpipe emissions, abrasion and resuspension, or long-range transport (Okuljar et al., 2021). We speculate that AIT has sources in the traffic sector, in line with the arguments of Trechera et al., 2023. We interpret the pattern of ACC to the movement of large-scale meteorological air masses across Central Europe, as described in Engler et al. (2007). In line with ACC, high PM10 concentrations from NE with higher wind speed point to long-range transport effects (van Pinxteren et al., 2019).
3.3.2 Seasonal variability
The annual variation for the entire period of TNC showed a maximum in summer, with the highest concentrations in July and August, and about 20 % higher concentrations during May–September compared to the rest of the year. (See Fig. S5, where shaded areas represent 75 % and 95 % confidence intervals.) TNC followed the same pattern as particles < 100 nm, as both NUCs and AIT reached their maxima in summer (July–August). In contrast, ACC did not show pronounced maxima. For a comparison with airport traffic, see Sect. 3.6.
We found a seasonal variability for PM1, PM2.5, and PM10, with a winter : summer ratio of 2 : 1 to 3 : 1 for PM2.5 in LAN (Fig. S6). The PM10 concentration in DAR is lower in November and December than in LAN.
The secondary parameter ozone showed its maximum in summer; others such as NO2, NO, and CO showed their maxima in winter (Fig. S7).
For UFP at LAN and gaseous compounds at DAR, we discovered that TNC, NUC, AIT, and ozone have an annual cycle, with the highest concentrations in the summer. In contrast, PM, particularly PM2.5, NO2, NO, and CO, reached their peak in the winter, possibly due to higher heating emissions and lower MLH in the winter. Studies have shown that wood combustion is a significant source of particulate matter during winter (van Pinxteren, 2016).
3.3.3 Diurnal variation
In this section, we analyse diurnal variation of particle number concentrations, which are influenced by meteorology (temperature, humidity, wind speed), anthropogenic activities, and biological processes.
In LAN, the overall diurnal variation (Fig. 6a) of TNC showed two intermediate maxima concentrations (08:00, 21:00). The first occurred between 07:00 and 09:00, and a very small midday peak at 13:00 (Fig. S5); the highest peak was seen at 21:00 in the evening. For NUC, a similar shape was observed but with a more distinct small midday peak at 13:00 and a slightly earlier evening peak at 20:00. Hourly variations of NUC increased with ozone and global radiation (GLO) between 07:00 and 11:00 (see Fig. 8b), particularly in the summer, but less in the spring and autumn. The midday TNC peak was more pronounced in the summer and less so in the spring and autumn, but it was absent in the winter.
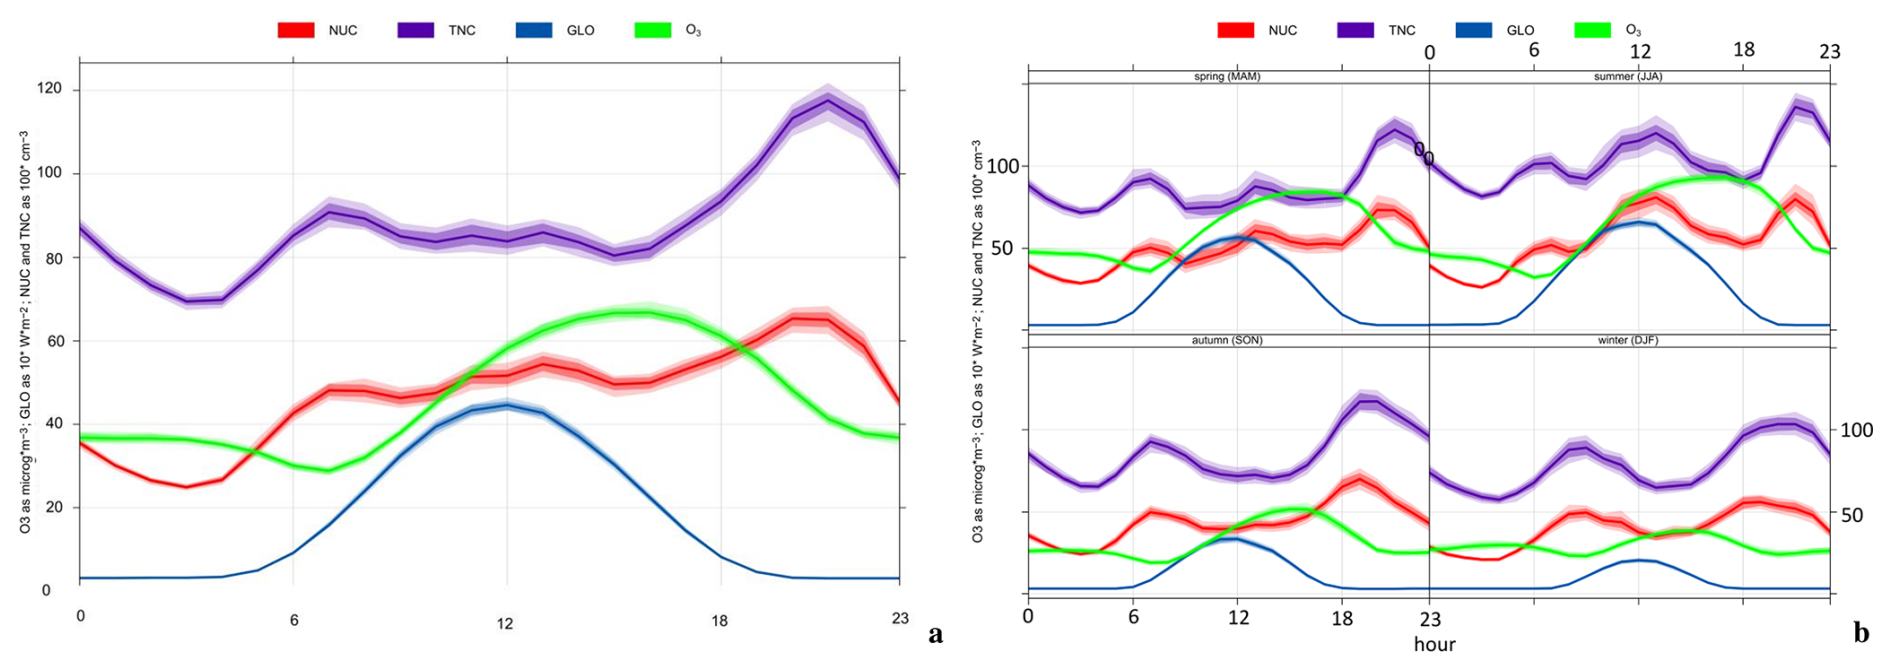
Figure 8The diurnal variation of hourly means, 2019–2021, NUC, TNC, GLO, and O3 in LAN (a); and for the four seasons separately (b). Shaded areas represent 75 % and 95 % confidence intervals.
Diurnal variations of AIT and ACC showed the highest concentration between 20:00 and 02:00, especially during Friday and Saturday nights (Fig. S5). ACC showed a second maximum between 07:00 and 09:00 during the week but not on weekends.
In LAN 2019–21, we found diurnal variability for PM1, PM2.5, and PM10, with PM1 having a minimum between 15:00 and 18:00 (Fig. S6). In contrast, PM10 in DAR showed a profile with a maximum concentration during rush hour at 08:00 and a minimum concentration in the morning hours of 03:00–04:00. On average, the diurnal variability during 2015–2021 was similar to LAN in 2019–2021.
Ozone showed a midday peak at 15:00 (Fig. S7) and a minimum at 07:00. In contrast, NO, NO2, and CO showed two peaks at 08:00–10:00 and 20:00–22:00 (see Figs. S7 and S8). SO2 showed the highest concentration between 09:00 and 13:00.
The TNC concentration showed three peak concentrations. The first is between 07:00 and 09:00 during traffic rush hours, which could be due to aircraft activity, as observed in many previous studies (Sun et al., 2019; Trechera et al., 2023). Traffic influence also plays a role, with the highest peak between 06:00 and 10:00 (Wehner et al., 2002). In LAN (see Fig. S5), we also observed a small TNC peak during late morning to midday. This midday TNC peak showed lower concentrations than the morning traffic rush hour peak. In contrast, the midday NUC peak exceeded the morning rush hour concentrations. The highest concentrations for both TNC and NUC were found during night hours (21:00–00:00), probably due to nocturnal inversion layers.
The pronounced midday TNC peak is consistent with regional or urban photo-nucleation processes, as well as fumigation from higher atmospheric layers rich in nucleation mode particles and ozone. The MLH grows due to convective dynamics, aviation, and/or power plants. This was observed with a higher midday peak in summer, compared to none in winter (see Fig. 8), which was attributed to photo-nucleation.
ACC showed a peak during morning rush hours on weekdays, indicating that car traffic was the source of this peak. Similarly, NO and NO2 showed higher peaks during rush hours on weekdays than on working weekdays (Figs. S5, S7).
CO showed a pattern for the evening/night peak independently of the weekday, indicating non-traffic sources, but the morning peak was reduced on Saturdays and even vanished on Sundays (Fig. S8).
3.3.4 Weekday variations
On Sundays, NUC (−20 %) and TNC (−15 %) were reduced compared to working weekdays (Fig. S5). Hourly variations during the week show that the maximum of the afternoon peak varies in relation to the morning peak from weekday to weekend. Diurnal variations of AIT showed the highest concentrations between 20:00 and 02:00 on Friday and Saturday nights. AIT was highest on Saturdays (Fig. S5). On the weekends, ACC was only slightly higher. We found a day of the week variability for PM10 in LAN and DAR (Fig. S6). Highest concentration was on Wednesdays/Thursdays and lowest on Sundays, with a difference of 3 µg m−3. PM10 concentrations were similar on Saturdays and Mondays.
NO and NO2 were highest during the week, with a minimum on Sunday (−25 % NO2). Ozone showed the inverse behaviour, with the maximum on Sunday and the minimum during the working days. CO was slightly lower, and SO2 showed a clearer minimum on Sundays.
On Sundays, we found reduced concentrations of NUC, TNC, and NO2 (and less CO). Also, from 2015 to 2021, on average, 54 % less traffic was counted at LAN_TC on Sundays than on Tuesdays through Thursdays (BASt, 2023). Therefore, we assume that the number of 10–30 nm particles was partly raised by car traffic during working weekdays, besides other causes like NPF. The afternoon NUC peak shifted from weekday to weekend. This might reveal that NUC and TNC were influenced by traffic. It is possible that the NUC-NPF peak in the afternoon is supplemented by the traffic-NUC peak, which decreases after traffic rush hours and is also reduced on Sundays.
Higher concentrations of AIT and, to a lesser extent, ACC, particularly on night before and after Saturday, may indicate the influence of increased barbecue and residential wood-heating activity over the weekend in the nearby residential area. This results in higher emissions of these larger particle modes. It is known that the combustion of solid fuels produces distributions with a modal diameter of approximately 100 nm (Hopke et al., 2022), which falls within both AIT and ACC. Wood-burning activities are also associated with higher benzene concentrations at 18:00 elsewhere (Hellén et al., 2008).
3.4 Correlation of particle modes with auxiliary pollutants and meteorological parameters in 2021
Due to the start of availability for PM in LAN from 2019 on, and because the COVID-19 lockdown caused a reduction in traffic in 2020, we focus on the last year of the time series 2021, which is less influenced by exceptional conditions, to compare different measured parameters with each other. The average concentration of four size modes and PM fractions, meteorological parameters, and auxiliary pollutants can be found in Table S3 with a coverage rate of between 92 % and 100 %.
The mean concentrations in DAR in 2021 were PM10 13 µg m−3; NO 4 µg m−3; NO2 17 µg m−3; CO 0.2 mg m−3; SO2 0.8 µg m−3; and ozone 42 µg m−3. In LAN, they were PM10 14 µg m−3, PM2.5 10 µg m−3, and PM1 9 µg m−3; TNC 8.3 × 103 cm−3, NUC 4.9 × 103 cm−3, AIT 2.9 × 103 cm−3, and ACC 1.0 × 103 cm−3.
The matrix in Fig. S9 shows the correlations between different particle fractions and auxiliary parameters in 2021. The particle number of TNC showed a significantly high to moderate correlation with NUC and AIT (R = 0.90 and R = 0.64, respectively) but a low correlation with ACC (R = 0.26). The LAN PM10 correlated highly and significantly with LAN PM1 and LAN PM2.5 (R = 0.73, 0.88) but showed a low negative correlation with NUC (R = −0.08).
NO2 in DAR correlated moderately with PM2.5 but not significantly (R = 0.44) and not with NUC (R = 0.09). NO2 correlated highest with CO as another traffic-related pollutant (R = 0.73). SO2 only correlated very low with NO2 and PM fractions (R = 0.18 and R = 0.15–0.17). Ozone correlated moderately with temperature and global radiation (R = 0.52, 0.45) but not with any of the particle fractions. Concerning the meteorological parameters, a low positive correlation is obtained for both TNC and NUC with temperature (R = 0.22 to 0.23) and a very low negative correlation with RH (R = −0.06 to −0.09). Negative correlations were also observed for wind speed with all size modes, moderate for AIT and ACC (R = −0.51) and low for NUC (R = −0.11). Using a multiple linear regression approach, temperature and wind speed were two of the six most influential parameters for the spatio-temporal variance of UFP (von Bismarck-Osten et al., 2013).
3.5 Comparison with the WHO classification
According to the WHO definition of UFPs, TNC has a lower limit of ≤ 10 nm and no restriction on the upper limit (WHO, 2021). The WHO classifies high concentrations as days > 10 000 cm−3 or hours > 20 000 cm−3. We discovered high concentrations in LAN on 23 %–59 % of days and 2 %–6 % of hours per year (see Table S5). The WHO limit for high UFPs in 24 h yr−1 was exceeded on 30 % of all days. During the lockdown, there were fewer exceedances (23 % d−1 and 2 % of hours) than in previous years (37 %–59 % of days and 5 %–6 %).
Considering the WHO classification for low concentrations per day (< 1000 cm−3), no day of the entire measurement campaign was in this category.
These findings are limited to this specific location and time period of campaign. In the future, these results should be compared with data from other stations to further discuss their representativeness for similar station types and other local specific sources.
3.6 Temporal variability of emissions from the airport
To estimate the temporal variability of emissions from air traffic at Frankfurt Airport, we show the variability of flight activity measured in terms of passengers carried (PAX) and aircraft movements such as landings and take-offs (LTOs).
Between 2015 and 2019, PAX at FRA averaged 65 million per year and increased by 2 % yr−1 (Schultheiß-Münch et al., 2022). PAX fell to 29 % in 2020 and 38 % in 2021, compared to previous years' averages. LTOs (490 000 on average) declined to 44 % and 55 % in 2020 and 2021, respectively. In 2023, the PAX and LTOs were 90 % of those in 2015–2019 (Schultheiß-Münch et al., 2024). The 95th percentile of the TNC fell by 25 % in spring 2020 compared to the previous year (see Fig. 2) before rising again. In Fig. 3a, the monthly mean values from the airport's wind sector also show a constant average of 17 × 103 cm−3 in 2015–2019. The values fell to 12 × 103 cm−3 in 2020 and then rose again slightly to 14 × 103 cm−3. This could also indicate that lower air traffic results in a lower maximum TNC.
The seasonal behaviour in 2023 is expected to be similar to the years preceding 2020. LTOs have a seasonal maximum plateau from June to October and a minimum in February, with approximately 70 % of the maximum (Schultheiß-Münch et al., 2024). TNC follows a similar pattern to LTOs, with a maximum in the summer, highest in July and August, and approximately 20 % higher concentrations from May to September compared to the remainder of the year. As a result, this time pattern could also indicate TNC caused by aircraft movements other than the new NPF in the summer (Sect. 3.3.2).
The 24 h fluctuation of LTOs from 2015 to 2021 is characterised by a ban on night flights between 23:00 and 05:00 since 2011. Some exceptions exist, such as approximately 3 % of the maximum daytime hours in 2019 (Gemeinnützige Umwelthaus GmbH, 2025). In 2019, the LTO rate is 0 % between 00:00 and 05:00, and 30 % from 05:00 to 07:00. It is highest between 07:00 and 22:00, with 80 % to 100 %: the three maxima are 07:00–13:00, 16:00, and 20:00, with the lowest at 18:00–19:00 at 80 %. As described in Sect. 3.3.3, NUC had a similar shape with three maxima (08:00, 13:00, and 21:00) but with a clearer small midday peak at 13:00 than TNC did. The TNC midday peak was most noticeable in the summer and completely absent in the winter. Because the LTO diurnal cycle is consistent throughout the year, this midday peak appears to be unaffected by air traffic or at least less so than the NPF.
Previous short-term studies of UFPs near FRA, including spatially resolved measurements (Gregor et al., 2015), demonstrated that FRA is a source of UFPs, particularly for small diameters in the NUC range. Atmospheric observations downwind of airports generally show increased UFPs, especially in the NUC range (Harrison et al., 2019; Hudda et al., 2014; Keuken et al., 2015). Elsewhere, it is confirmed that regional or urban photochemical NPF is not exclusively the cause of the high nucleation mode. An influence of airports is also described (Rivas et al., 2020).
The effect of airport emissions on the particle number concentration and three size classes starting from 10 nm was assessed at a site 6 km downwind from a major European airport (FRA) serving the metropolitan region Rhine-Main (Frankfurt (Main)).
Wind-influenced concentration analysis indicates that FRA is a strong potential source for nucleation and partly also for Aitken mode particles in an urban background station downwind from the airport. The average NUC concentrations were 2.5 times higher with wind from the airport than with other wind directions. We therefore draw the conclusion that aircraft emissions from a major airport within a 6 km radius seem to have an impact on NUC.
We discuss the value of long-term observations in understanding trends and investigating the effects of global events like pandemics on air pollution. In the year 2020 that was influenced by the COVID-19 lockdown, with the lowest flight traffic, the maximum TNC from airport direction was reduced to 25 % of the previous year's average, the lowest maximum in 6 years.
The WHO limit for high UFPs in 24 h (> 10 000 cm−3) yr−1 was exceeded on 30 % of all days.
The data that support the findings of this study are available at https://doi.org/10.5281/zenodo.17083383 (Gerwig et al., 2025).
The supplement related to this article is available online at https://doi.org/10.5194/ar-4-153-2026-supplement.
HG: conceptualisation, data curation, investigation, validation, visualisation, formal analysis, methodology, and writing (original draft, review, and editing). WB: software and writing (review and editing). KW: software, formal analysis, methodology, and writing (review and editing). HA: writing (review and editing). AW: methodology and writing (review and editing). WT: supervision and writing (review and editing).
The contact author has declared that none of the authors has any competing interests.
Publisher's note: Copernicus Publications remains neutral with regard to jurisdictional claims made in the text, published maps, institutional affiliations, or any other geographical representation in this paper. The authors bear the ultimate responsibility for providing appropriate place names. Views expressed in the text are those of the authors and do not necessarily reflect the views of the publisher.
We thank the German Environment Agency (UBA) for providing the measurement infrastructure. Auxiliary data were provided by the German Weather Service (DWD), HLNUG, and BAST. We are grateful for their assistance. We also acknowledge Karin Uhse and Sabrina Unglert for technical support and help with data processing.
This paper was edited by Daniele Contini and reviewed by two anonymous referees.
BASt – Automatische Straßenverkehrszählung: aktuelle Werte, https://www.bast.de/DE/Themen/Digitales/HF_1/Massnahmen/verkehrszaehlung/Aktuell/zaehl_aktuell_node.html (last access: 6 March 2026), 2023.
Birmili, W., Weinhold, K., Rasch, F., Sonntag, A., Sun, J., Merkel, M., Wiedensohler, A., Bastian, S., Schladitz, A., Löschau, G., Cyrys, J., Pitz, M., Gu, J., Kusch, T., Flentje, H., Quass, U., Kaminski, H., Kuhlbusch, T. A. J., Meinhardt, F., Schwerin, A., Bath, O., Ries, L., Gerwig, H., Wirtz, K., and Fiebig, M.: Long-term observations of tropospheric particle number size distributions and equivalent black carbon mass concentrations in the German Ultrafine Aerosol Network (GUAN), Earth Syst. Sci. Data, 8, 355–382, https://doi.org/10.5194/essd-8-355-2016, 2016.
Bousiotis, D., Brean, J., Pope, F. D., Dall'Osto, M., Querol, X., Alastuey, A., Perez, N., Petäjä, T., Massling, A., Nøjgaard, J. K., Nordstrøm, C., Kouvarakis, G., Vratolis, S., Eleftheriadis, K., Niemi, J. V., Portin, H., Wiedensohler, A., Weinhold, K., Merkel, M., Tuch, T., and Harrison, R. M.: The effect of meteorological conditions and atmospheric composition in the occurrence and development of new particle formation (NPF) events in Europe, Atmos. Chem. Phys., 21, 3345–3370, https://doi.org/10.5194/acp-21-3345-2021, 2021.
Brines, M., Dall'Osto, M., Beddows, D. C. S., Harrison, R. M., Gómez-Moreno, F., Núñez, L., Artíñano, B., Costabile, F., Gobbi, G. P., Salimi, F., Morawska, L., Sioutas, C., and Querol, X.: Traffic and nucleation events as main sources of ultrafine particles in high-insolation developed world cities, Atmos. Chem. Phys., 15, 5929–5945, https://doi.org/10.5194/acp-15-5929-2015, 2015.
Brock, C. A., Schröder, F., Kärcher, B., Petzold, A., Busen, R., and Fiebig, M.: Ultrafine particle size distributions measured in aircraft exhaust plumes, J. Geophys. Res.-Atmos., 105, 26555–26567, https://doi.org/10.1029/2000JD900360, 2000.
Carslaw, D. C. and Ropkins, K.: openair – An R package for air quality data analysis, Environ. Modell. Softw., 27–28, 52–61, https://doi.org/10.1016/j.envsoft.2011.09.008, 2012.
Cassee, F. R., Morawska, L., and Peters, A.: The White Paper on Ambient Ultrafine Particles: evidence for policy makers, “Thinking outside the box” Team, https://efca.net/files/WHITE PAPER-UFP evidence for policy makers (25 OCT).pdf (last access: 11 February 2026), 2019.
CEN: CEN/TS 17434:2020 - Ambient air - Determination of the particle number size distribution of atmospheric aerosol using a Mobility Particle Size Spectrometer (MPSS), https://standards.iteh.ai/catalog/standards/cen/a841bc08-ed34-4fa8-94ca-8c5e07b99db9/cen-ts-17434-2020 (last access: 11 February 2026), 2020.
CEN: prEN 16976 - Ambient air - Determination of the particle number concentration of atmospheric aerosol, https://standards.iteh.ai/catalog/standards/cen/ab8b1143-a1d3-481b-b268-38a3b1da18b7/pren-16976 (last access: 11 February 2026), 2023.
Chen, Y., Masiol, M., Squizzato, S., Chalupa, D. C., Zíková, N., Pokorná, P., Rich, D. Q., and Hopke, P. K.: Long-term trends of ultrafine and fine particle number concentrations in New York State: Apportioning between emissions and dispersion, Environ. Pollut., 310, 119797, https://doi.org/10.1016/j.envpol.2022.119797, 2022.
Cleveland, R. B., Cleveland, W. S., and Terpenning, I.: STL: A Seasonal-Trend Decomposition Procedure Based on Loess, J. Off. Stat., 6, 3–73, 1990.
DFS: Die DFS-Energiezentrale, Transmission Das Magazin der DFS Deutsche Flugsicherung GmbH, https://dfs.de/homepage/de/medien/publikationen/transmission-2-2022-online-1.pdf?cid=htt (last access: 6 March 2026), 2022.
Emeis, S., Schäfer, K., and Münkel, C.: Surface-based remote sensing of the mixing-layer height a review, Meteorol. Z., 17, 621–630, https://doi.org/10.1127/0941-2948/2008/0312, 2008.
Engler, C., Rose, D., Wehner, B., Wiedensohler, A., Brüggemann, E., Gnauk, T., Spindler, G., Tuch, T., and Birmili, W.: Size distributions of non-volatile particle residuals (Dp < 800 nm) at a rural site in Germany and relation to air mass origin, Atmos. Chem. Phys., 7, 5785–5802, https://doi.org/10.5194/acp-7-5785-2007, 2007.
European Parliament and Council of the European Union: Cleaner air for Europe, Directive - EU - 2024/2881, Document 32024L2881, EUR-Lex, ISSN 1977-06772024, 2024.
Gani, S., Chambliss, S. E., Messier, K. P., Lunden, M. M., and Apte, J. S.: Spatiotemporal profiles of ultrafine particles differ from other traffic-related air pollutants: lessons from long-term measurements at fixed sites and mobile monitoring, Environ. Sci.: Atmos., 1, 558–568, https://doi.org/10.1039/D1EA00058F, 2021.
Garcia-Marlès, M., Lara, R., Reche, C., Pérez, N., Tobías, A., Savadkoohi, M., Beddows, D., Salma, I., Vörösmarty, M., Weidinger, T., Hueglin, C., Mihalopoulos, N., Grivas, G., Kalkavouras, P., Ondracek, J., Zikova, N., Niemi, J. V., Manninen, H. E., Green, D. C., Tremper, A. H., Norman, M., Vratolis, S., Diapouli, E., Eleftheriadis, K., Gómez-Moreno, F. J., Alonso-Blanco, E., Wiedensohler, A., Weinhold, K., Merkel, M., Bastian, S., Hoffmann, B., Altug, H., Petit, J.-E., Acharja, P., Favez, O., Santos, S. M. D., Putaud, J.-P., Dinoi, A., Contini, D., Casans, A., Casquero-Vera, J. A., Crumeyrolle, S., Bourrianne, E., Poppel, M. V., Dreesen, F. E., Harni, S., Timonen, H., Lampilahti, J., Petäjä, T., Pandolfi, M., Hopke, P. K., Harrison, R. M., Alastuey, A., and Querol, X.: Source apportionment of ultrafine particles in urban Europe, Environ. Int., 194, 109149, https://doi.org/10.1016/j.envint.2024.109149, 2024.
Geiß, A., Wiegner, M., Bonn, B., Schäfer, K., Forkel, R., von Schneidemesser, E., Münkel, C., Chan, K. L., and Nothard, R.: Mixing layer height as an indicator for urban air quality?, Atmos. Meas. Tech., 10, 2969–2988, https://doi.org/10.5194/amt-10-2969-2017, 2017.
Gemeinnützige Umwelthaus GmbH: Flugbewegungen 2024, https://www.umwelthaus.org/fluglaerm/fluglaermmonitoring/monitoring-der-flugbewegungen/flugbewegungen-2024/ (last access: 11 February 2026), 2025.
Gerwig, H., Wiedensohler, A., Travnicek, W., Weinhold, K., Alas, H. D., and Birmili, W.: Particle Number Concentrations, Size Classes 10-500 nm and Auxiliary Data near a Major German Airport, 2015-2021, Version 1.0, Zenodo [data set], https://doi.org/10.5281/zenodo.17083383, 2025.
Gregor, M., Gerwig, H., and Wirtz, K.: High peak concentrations of alveolar lung deposited surface area and particle number during overflights before touchdown, https://geko.promeeting.it/abstract/DEF/Poster/1COA_P017.pdf (last access: 11 February 2026), 2015.
Harrison, R. M., Beddows, D. C. S., Alam, M. S., Singh, A., Brean, J., Xu, R., Kotthaus, S., and Grimmond, S.: Interpretation of particle number size distributions measured across an urban area during the FASTER campaign, Atmos. Chem. Phys., 19, 39–55, https://doi.org/10.5194/acp-19-39-2019, 2019.
Hellén, H., Hakola, H., Haaparanta, S., Pietarila, H., and Kauhaniemi, M.: Influence of residential wood combustion on local air quality, Sci. Total Environ., 393, 283–290, https://doi.org/10.1016/j.scitotenv.2008.01.019, 2008.
HLNUG: Luftmessstelle Darmstadt, Messdatenportal, https://www.hlnug.de/messwerte/datenportal/messstelle/2/1/0104/ (last access: 11 February 2026), 2023a.
HLNUG: Emissionskataster, https://www.hlnug.de/themen/luft/emissionen/emissionskataster (last access: 11 February 2026), 2023b.
Hopke, P. K., Feng, Y., and Dai, Q.: Source apportionment of particle number concentrations: A global review, Sci. Total Environ., 819, 153104, https://doi.org/10.1016/j.scitotenv.2022.153104, 2022.
Hudda, N., Gould, T., Hartin, K., Larson, T. V., and Fruin, S. A.: Emissions from an International Airport Increase Particle Number Concentrations 4-fold at 10 km Downwind, Environ. Sci. Technol., 48, 6628–6635, https://doi.org/10.1021/es5001566, 2014.
Hudda, N., Simon, M. C., Zamore, W., and Durant, J. L.: Aviation-Related Impacts on Ultrafine Particle Number Concentrations Outside and Inside Residences near an Airport, Environ. Sci. Technol., 52, 1765–1772, https://doi.org/10.1021/acs.est.7b05593, 2018.
Junkermann, W., Vogel, B., and Bangert, M.: Ultrafine particles over Germany – an aerial survey, Tellus B, 68, 29250, https://doi.org/10.3402/tellusb.v68.29250, 2016.
Kendall, M. G.: Rank correlation methods, 4th edn., 2d impression., Griffin, London, 202 pp., ISBN: 9780852641996, 1975.
Kerminen, V.-M., Chen, X., Vakkari, V., Petäjä, T., Kulmala, M., and Bianchi, F.: Atmospheric new particle formation and growth: review of field observations, Environ. Res. Lett., 13, 103003, https://doi.org/10.1088/1748-9326/aadf3c, 2018.
Keuken, M. P., Moerman, M., Zandveld, P., Henzing, J. S., and Hoek, G.: Total and size-resolved particle number and black carbon concentrations in urban areas near Schiphol airport (the Netherlands), Atmos. Environ., 104, 132–142, https://doi.org/10.1016/j.atmosenv.2015.01.015, 2015.
Languille, B., Gros, V., Petit, J.-E., Honoré, C., Baudic, A., Perrussel, O., Foret, G., Michoud, V., Truong, F., Bonnaire, N., Sarda-Estève, R., Delmotte, M., Feron, A., Maisonneuve, F., Gaimoz, C., Formenti, P., Kotthaus, S., Haeffelin, M., and Favez, O.: Wood burning: A major source of Volatile Organic Compounds during wintertime in the Paris region, Sci. Total Environ., 711, 135055, https://doi.org/10.1016/j.scitotenv.2019.135055, 2020.
Lorentz, H., Janicke, U., Jakobs, H., Schmidt, W., Hellebrandt, P., Ketzel, M., and Gerwig, H.: ULTRAFINE PARTICLE DISPERSION MODELLING AT AND AROUND FRANKFURT AIRPORT (FRA), GERMANY, in: 19th International Conference on Harmonisation within Atmospheric Dispersion Modelling for Regulatory Purposes, Bruges, Belgium, 3–6 June 2019, https://www.harmo.org/Conferences/Proceedings/_Bruges/publishedSections/H19-082 Helmut Lorentz.pdf (last access: 11 February 2026), 2019.
Lupascu, A., Easter, R., Zaveri, R., Shrivastava, M., Pekour, M., Tomlinson, J., Yang, Q., Matsui, H., Hodzic, A., Zhang, Q., and Fast, J. D.: Modeling particle nucleation and growth over northern California during the 2010 CARES campaign, Atmos. Chem. Phys., 15, 12283–12313, https://doi.org/10.5194/acp-15-12283-2015, 2015.
Ma, N. and Birmili, W.: Estimating the contribution of photochemical particle formation to ultrafine particle number averages in an urban atmosphere, Sci. Total Environ., 512–513, 154–166, https://doi.org/10.1016/j.scitotenv.2015.01.009, 2015.
Ma, N., Birmili, W., Müller, T., Tuch, T., Cheng, Y. F., Xu, W. Y., Zhao, C. S., and Wiedensohler, A.: Tropospheric aerosol scattering and absorption over central Europe: a closure study for the dry particle state, Atmos. Chem. Phys., 14, 6241–6259, https://doi.org/10.5194/acp-14-6241-2014, 2014.
Mann, H. B.: Nonparametric Tests Against Trend, Econometrica, 13, 245–259, https://doi.org/10.2307/1907187, 1945.
Masiol, M., Harrison, R. M., Vu, T. V., and Beddows, D. C. S.: Sources of sub-micrometre particles near a major international airport, Atmos. Chem. Phys., 17, 12379–12403, https://doi.org/10.5194/acp-17-12379-2017, 2017.
Ohlwein, S., Kappeler, R., Kutlar Joss, M., Künzli, N., and Hoffmann, B.: Health effects of ultrafine particles: a systematic literature review update of epidemiological evidence, Int. J. Public Health, 64, 547–559, https://doi.org/10.1007/s00038-019-01202-7, 2019.
Okuljar, M., Kuuluvainen, H., Kontkanen, J., Garmash, O., Olin, M., Niemi, J. V., Timonen, H., Kangasluoma, J., Tham, Y. J., Baalbaki, R., Sipilä, M., Salo, L., Lintusaari, H., Portin, H., Teinilä, K., Aurela, M., Dal Maso, M., Rönkkö, T., Petäjä, T., and Paasonen, P.: Measurement report: The influence of traffic and new particle formation on the size distribution of 1–800 nm particles in Helsinki – a street canyon and an urban background station comparison, Atmos. Chem. Phys., 21, 9931–9953, https://doi.org/10.5194/acp-21-9931-2021, 2021.
Putaud, J.-P., Pozzoli, L., Pisoni, E., Martins Dos Santos, S., Lagler, F., Lanzani, G., Dal Santo, U., and Colette, A.: Impacts of the COVID-19 lockdown on air pollution at regional and urban background sites in northern Italy, Atmos. Chem. Phys., 21, 7597–7609, https://doi.org/10.5194/acp-21-7597-2021, 2021.
Querol, X., Massagué, J., Alastuey, A., Moreno, T., Gangoiti, G., Mantilla, E., Duéguez, J. J., Escudero, M., Monfort, E., Pérez García-Pando, C., Petetin, H., Jorba, O., Vázquez, V., de la Rosa, J., Campos, A., Muñóz, M., Monge, S., Hervás, M., Javato, R., and Cornide, M. J.: Lessons from the COVID-19 air pollution decrease in Spain: Now what?, Sci. Total Environ., 779, 146380, https://doi.org/10.1016/j.scitotenv.2021.146380, 2021.
R Core Team: R: A language and environment for statistical computing, R Foundation for Statistical Computing, Vienna, Austria, https://www.r-project.org/ (last access: 6 March 2026), 2019.
RI-URBANS: GUIDANCE DOCUMENTS ON MEASUREMENTS & MODELLING OF NOVEL AIR QUALITY POLLUTANTS: ULTRAFINE PARTICLES/SIZE DISTRIBUTIONS, https://riurbans.eu/wp-content/uploads/2024/11/ENV_GUIDANCE-DOCUMENT_ST1_UFP_Definitive.pdf (last access: 11 February 2026), 2024.
Rivas, I., Beddows, D. C. S., Amato, F., Green, D. C., Järvi, L., Hueglin, C., Reche, C., Timonen, H., Fuller, G. W., Niemi, J. V., Pérez, N., Aurela, M., Hopke, P. K., Alastuey, A., Kulmala, M., Harrison, R. M., Querol, X., and Kelly, F. J.: Source apportionment of particle number size distribution in urban background and traffic stations in four European cities, Environ. Int., 135, 105345, https://doi.org/10.1016/j.envint.2019.105345, 2020.
Schneider, J., Hock, N., Weimer, S., Borrmann, S., Kirchner, U., Vogt, R., and Scheer, V.: Nucleation Particles in Diesel Exhaust: Composition Inferred from In Situ Mass Spectrometric Analysis, Environ. Sci. Technol., 39, 6153–6161, https://doi.org/10.1021/es049427m, 2005.
Schultheiß-Münch, M., Draxler, H.-A., and Jochem, H.: Frankfurt Airport Luftverkehrsstatistik 2021, https://www.google.com/url?sa=t&rct=j&q=&esrc=s&source=web&cd=&ved=2ahUKEwjfgq295ouTAxUagf0HHTxOKuoQFnoECB0QAQ&url=https%3A%2F%2Fwww.fraport.com%2Fcontent%2Fdam%2Ffraport-company%2Fdocuments%2Finvestoren%2Ffinanz--und-verkehrszahlen%2Fluftverkehrsstatistik%2FLuftverkehrsstatistik%25202021.pdf%2F_jcr_content%2Frenditions%2Foriginal.media_file.download_attachment.file%2FLuftverkehrsstatistik%25202021.pdf&usg=AOvVaw1Jn-3PizOdY0UBWe1P-xjv&opi=89978449 (last access: 6 March 2026), 2022.
Schultheiß-Münch, M., Draxler, H.-A., and Krumtung, A.: Frankfurt Airport Air Traffic Statistics 2023, https://www.fraport.com/content/dam/fraport-company/documents/investoren/eng/publications/annual-reports/Annual Report 2024.pdf/jcr_content/renditions/original./Annual Report 2024.pdf, (last access: 11 February 2026), 2024.
Sen, P. K.: Estimates of the Regression Coefficient Based on Kendall's Tau, J. Am. Stat. Assoc., 63, 1379–1389, https://doi.org/10.2307/2285891, 1968.
Stacey, B.: Measurement of ultrafine particles at airports: A review, Atmos. Environ., 198, 463–477, https://doi.org/10.1016/j.atmosenv.2018.10.041, 2019.
Sun, J., Birmili, W., Hermann, M., Tuch, T., Weinhold, K., Spindler, G., Schladitz, A., Bastian, S., Löschau, G., Cyrys, J., Gu, J., Flentje, H., Briel, B., Asbach, C., Kaminski, H., Ries, L., Sohmer, R., Gerwig, H., Wirtz, K., Meinhardt, F., Schwerin, A., Bath, O., Ma, N., and Wiedensohler, A.: Variability of black carbon mass concentrations, sub-micrometer particle number concentrations and size distributions: results of the German Ultrafine Aerosol Network ranging from city street to High Alpine locations, Atmos. Environ., 202, 256–268, https://doi.org/10.1016/j.atmosenv.2018.12.029, 2019.
Sun, J., Birmili, W., Hermann, M., Tuch, T., Weinhold, K., Merkel, M., Rasch, F., Müller, T., Schladitz, A., Bastian, S., Löschau, G., Cyrys, J., Gu, J., Flentje, H., Briel, B., Asbach, C., Kaminski, H., Ries, L., Sohmer, R., Gerwig, H., Wirtz, K., Meinhardt, F., Schwerin, A., Bath, O., Ma, N., and Wiedensohler, A.: Decreasing trends of particle number and black carbon mass concentrations at 16 observational sites in Germany from 2009 to 2018, Atmos. Chem. Phys., 20, 7049–7068, https://doi.org/10.5194/acp-20-7049-2020, 2020.
Theil, H.: A Rank-Invariant Method of Linear and Polynomial Regression Analysis, in: Henri Theil's Contributions to Economics and Econometrics: Econometric Theory and Methodology, edited by: Raj, B. and Koerts, J., Springer Netherlands, Dordrecht, 345–381, https://doi.org/10.1007/978-94-011-2546-8_20, 1992.
Trechera, P., Garcia-Marlès, M., Liu, X., Reche, C., Pérez, N., Savadkoohi, M., Beddows, D., Salma, I., Vörösmarty, M., Casans, A., Casquero-Vera, J. A., Hueglin, C., Marchand, N., Chazeau, B., Gille, G., Kalkavouras, P., Mihalopoulos, N., Ondracek, J., Zikova, N., Niemi, J. V., Manninen, H. E., Green, D. C., Tremper, A. H., Norman, M., Vratolis, S., Eleftheriadis, K., Gómez-Moreno, F. J., Alonso-Blanco, E., Gerwig, H., Wiedensohler, A., Weinhold, K., Merkel, M., Bastian, S., Petit, J.-E., Favez, O., Crumeyrolle, S., Ferlay, N., Martins Dos Santos, S., Putaud, J.-P., Timonen, H., Lampilahti, J., Asbach, C., Wolf, C., Kaminski, H., Altug, H., Hoffmann, B., Rich, D. Q., Pandolfi, M., Harrison, R. M., Hopke, P. K., Petäjä, T., Alastuey, A., and Querol, X.: Phenomenology of ultrafine particle concentrations and size distribution across urban Europe, Environ. Int., 172, 107744, https://doi.org/10.1016/j.envint.2023.107744, 2023.
Ungeheuer, F., van Pinxteren, D., and Vogel, A. L.: Identification and source attribution of organic compounds in ultrafine particles near Frankfurt International Airport, Atmos. Chem. Phys., 21, 3763–3775, https://doi.org/10.5194/acp-21-3763-2021, 2021.
van Pinxteren, D., Fomba, K. W., Spindler, G., Müller, K., Poulain, L., Iinuma, Y., Löschau, G., Hausmann, A., and Herrmann, H.: Regional air quality in Leipzig, Germany: detailed source apportionment of size-resolved aerosol particles and comparison with the year 2000, Faraday Discuss., 189, 291–315, https://doi.org/10.1039/C5FD00228A, 2016.
van Pinxteren, D., Mothes, F., Spindler, G., Fomba, K. W., and Herrmann, H.: Trans-boundary PM10: Quantifying impact and sources during winter 2016/17 in eastern Germany - ScienceDirect, Atmos. Environ., 200, 119–130, https://doi.org/10.1016/j.atmosenv.2018.11.061, 2019.
von Bismarck-Osten, C., Birmili, W., Ketzel, M., Massling, A., Petäjä, T., and Weber, S.: Characterization of parameters influencing the spatio-temporal variability of urban particle number size distributions in four European cities, Atmos. Environ., 77, 415–429, https://doi.org/10.1016/j.atmosenv.2013.05.029, 2013.
von Schneidemesser, E., Steinmar, K., Weatherhead, E. C., Bonn, B., Gerwig, H., and Quedenau, J.: Air pollution at human scales in an urban environment: Impact of local environment and vehicles on particle number concentrations, Sci. Total Environ., 688, 691–700, https://doi.org/10.1016/j.scitotenv.2019.06.309, 2019.
Vörösmarty, M., Hopke, P. K., and Salma, I.: Attribution of aerosol particle number size distributions to main sources using an 11-year urban dataset, Atmos. Chem. Phys., 24, 5695–5712, https://doi.org/10.5194/acp-24-5695-2024, 2024.
Wehner, B., Birmili, W., Gnauk, T., and Wiedensohler, A.: Particle number size distributions in a street canyon and their transformation into the urban-air background: measurements and a simple model study, Atmos. Environ., 36, 2215–2223, https://doi.org/10.1016/S1352-2310(02)00174-7, 2002.
Wehner, B., Petäjä, T., Boy, M., Engler, C., Birmili, W., Tuch, T., Wiedensohler, A., and Kulmala, M.: The contribution of sulfuric acid and non-volatile compounds on the growth of freshly formed atmospheric aerosols, Geophys. Res. Lett., 32, https://doi.org/10.1029/2005GL023827, 2005.
WHO: WHO global air quality guidelines: particulate matter (PM2.5 and PM10), ozone, nitrogen dioxide, sulfur dioxide and carbon monoxide, European Centre for Environment and Health, Bonn, Germany, https://apps.who.int/iris/bitstream/handle/10665/345329/9789240034228-eng.pdf (last access: 11 February 2026), 2021.
Wiedensohler, A., Birmili, W., Nowak, A., Sonntag, A., Weinhold, K., Merkel, M., Wehner, B., Tuch, T., Pfeifer, S., Fiebig, M., Fjäraa, A. M., Asmi, E., Sellegri, K., Depuy, R., Venzac, H., Villani, P., Laj, P., Aalto, P., Ogren, J. A., Swietlicki, E., Williams, P., Roldin, P., Quincey, P., Hüglin, C., Fierz-Schmidhauser, R., Gysel, M., Weingartner, E., Riccobono, F., Santos, S., Grüning, C., Faloon, K., Beddows, D., Harrison, R., Monahan, C., Jennings, S. G., O'Dowd, C. D., Marinoni, A., Horn, H.-G., Keck, L., Jiang, J., Scheckman, J., McMurry, P. H., Deng, Z., Zhao, C. S., Moerman, M., Henzing, B., de Leeuw, G., Löschau, G., and Bastian, S.: Mobility particle size spectrometers: harmonization of technical standards and data structure to facilitate high quality long-term observations of atmospheric particle number size distributions, Atmos. Meas. Tech., 5, 657–685, https://doi.org/10.5194/amt-5-657-2012, 2012.
Wiedensohler, A., Wiesner, A., Weinhold, K., Birmili, W., Hermann, M., Merkel, M., Müller, T., Pfeifer, S., Schmidt, A., Tuch, T., Velarde, F., Quincey, P., Seeger, S., and Nowak, A.: Mobility particle size spectrometers: Calibration procedures and measurement uncertainties, Aerosol Sci. Tech., 52, 146–164, https://doi.org/10.1080/02786826.2017.1387229, 2018.
Yao, L., Garmash, O., Bianchi, F., Zheng, J., Yan, C., Kontkanen, J., Junninen, H., Mazon, S. B., Ehn, M., Paasonen, P., Sipilä, M., Wang, M., Wang, X., Xiao, S., Chen, H., Lu, Y., Zhang, B., Wang, D., Fu, Q., Geng, F., Li, L., Wang, H., Qiao, L., Yang, X., Chen, J., Kerminen, V.-M., Petäjä, T., Worsnop, D. R., Kulmala, M., and Wang, L.: Atmospheric new particle formation from sulfuric acid and amines in a Chinese megacity, Science, 361, 278–281, https://doi.org/10.1126/science.aao4839, 2018.
Yu, F., Turco, R. P., and Kärcher, B.: The possible role of organics in the formation and evolution of ultrafine aircraft particles, J. Geophys. Res.-Atmos., 104, 4079–4087, https://doi.org/10.1029/1998JD200062, 1999.
Zhang, X., Karl, M., Zhang, L., and Wang, J.: Influence of Aviation Emission on the Particle Number Concentration near Zurich Airport, Environ. Sci. Technol., 54, 14161–14171, https://doi.org/10.1021/acs.est.0c02249, 2020.