the Creative Commons Attribution 4.0 License.
the Creative Commons Attribution 4.0 License.
 | 22 Nov 2023
Spatial distribution and variability of boundary layer aerosol particles observed in Ny-Ålesund during late spring in 2018
Barbara Harm-Altstädter
Konrad Bärfuss
Lutz Bretschneider
Martin Schön
Jens Bange
Ralf Käthner
Radovan Krejci
Mauro Mazzola
Kihong Park
Falk Pätzold
Alexander Peuker
Rita Traversi
Birgit Wehner
Astrid Lampert
This article aims to improve the understanding of the small-scale aerosol distribution affected by different atmospheric boundary layer (ABL) properties. In particular, transport and mixing of ultrafine aerosol particles (UFPs) are investigated as an indicator for possible sources triggering the appearance of new particle formation (NPF) at an Arctic coastal site. For this purpose, flexible measurements of uncrewed aerial systems (UASs) are combined with continuous ground-based observations at different altitudes, the Gruvebadet observatory close to the fjord at an altitude of 67 m above sea level (a.s.l.) and the observatory at Mount Zeppelin at an altitude of 472 m a.s.l. The two uncrewed research aircraft called ALADINA and MASC-3 were used for field activities at the polar research site Ny-Ålesund, Svalbard, between 24 April and 25 May 2018. The period was at the end of Arctic haze during the snowmelt season. A high frequency of occurrence of UFPs was observed, namely on 55 % of the airborne measurement days. With ALADINA, 230 vertical profiles were performed between the surface and the main typical maximum height of 850 m a.s.l., and the profiles were connected to surface measurements in order to obtain a 4-D picture of the aerosol particle distribution. Analyses of potential temperature, water vapor mixing ratio and aerosol particle number concentration of UFPs in the size range of 3–12 nm (N3−12) indicate a clear impact of the ABL's stability on the vertical mixing of the measured UFPs, which results in systematical differences of particle number concentrations at the two observatories. In general, higher concentrations of UFPs occurred near the surface, suggesting the open sea as the main source for NPF. Three different case studies show that the UFPs were rapidly mixed in the vertical and horizontal scale depending on atmospheric properties. In case of temperature inversions, the aerosol population remained confined to specific altitude ranges and was not always detected at the observatories. However, during another case study that was in relation to a persistent NPF event with subsequent growth rate, the occurrence of UFPs was identified to be a wide-spreading phenomenon in the vertical scale, as the observed UFPs exceeded the height of 850 m a.s.l. During a day with increased local pollution, enhanced equivalent black carbon mass concentration (eBC) coincided with an increase in the measured N3−12 in the lowermost 400 m but without subsequent growth rate. The local pollution was transported to higher altitudes, as measured by ALADINA. Thus, emissions from local pollution may play a role for potential sources of UFPs in the Arctic as well. In summary, a highly variable spatial and temporal aerosol distribution was observed with small scales at the polar site Ny-Ålesund, determined by atmospheric stability, contrasting surface and sources, and topographic flow effects. The UAS provides the link to understand differences measured at the two observatories at close distances but different altitudes.
- Article
(9189 KB) - Full-text XML
- BibTeX
- EndNote


The interactions between formation, growth, transport and vertical mixing of aerosol particles in the atmosphere need a more profound understanding, especially in the Arctic atmospheric boundary layer (ABL). In general, the Arctic is affected by a warming rate of the surface air temperature that is twice as high in comparison with the global average (IPCC, 2013) – an effect well known as “Arctic amplification” (AA, Serreze and Barry, 2011). The phenomenon implies vast changes in the feedback processes between the atmosphere and cryosphere (sea ice, snow, ice), mostly affected by and resulting in a rapid decrease in the sea ice extent and sea ice thickness (e.g., Stroeve et al., 2012; Dai et al., 2019). However, future scenarios of the Arctic climate are still not clear (e.g., Screen et al., 2018), and more observations are essential in order to better characterize the feedback mechanisms of the AA (Wendisch et al., 2017, 2022). Besides the main contributors of surface albedo, mixed-phase clouds and sea ice extent (e.g., Vavrus, 2004; Taylor et al., 2013; Zhang et al., 2018), aerosol particles are considered to play a key role in the AA (Serreze and Barry, 2011). This means, for instance, a direct effect of the aerosol particles on the Earth's radiation budget (Twomey, 1991; Haywood and Boucher, 2000), which is mainly triggered by the number concentration and chemical composition of the particles. In this context, carbonaceous aerosol particles like black carbon (BC) are of particular relevance, as BC strongly absorbs in the visible spectrum of the solar radiation, which ultimately leads to an increase in the ambient temperature (e.g., Bond et al., 2013). Additionally, the snow albedo might be reduced after deposition of BC on the snow-covered or frozen surfaces (Flanner et al., 2009), and aged carbonaceous particles may also have the potential to enhance cloud cover, as they can act as cloud condensation nuclei (CCN) or ice nuclei (IN). This might further reinforce the AA, as low-level clouds tend to warm the Arctic surface (Zhao and Garrett, 2015), except for short periods in the summer months (e.g., Intrieri et al., 2002; Kay and L'Ecuyer, 2013). However, the significance and magnitude of feedback mechanisms, initiated by the presence of aerosol particles in the Arctic, are still subject to current debates (e.g., Pithan and Mauritsen, 2014; He et al., 2019; Schmale et al., 2021).
This is also a reason why a deeper knowledge of the role of new particle formation is of crucial importance in the Arctic, as through subsequent growth, ultrafine aerosol particles (UFPs or nanoparticles, size <50 nm) can directly modify the radiation budget or act as CCN (Kerminen et al., 2012) as well and may therefore indirectly impact the Earth's radiation budget. Although median growth rates of 2.3 nm h−1 are low at Arctic research sites and comparable to boreal forest observations (Kerminen et al., 2018), NPF was frequently observed during the summer season with maximum aerosol particle concentrations of several thousand per cubic centimeter (e.g., Ström et al., 2009; Tunved et al., 2013; Freud et al., 2017). Currently, a large diversity of different factors contributing to new particle formation in the Arctic environment are known, where the most important factor, the intensity of the solar radiation (Kerminen et al., 2018; Nieminen et al., 2018), is of minor relevance in comparison to mid-latitude due to the lower solar elevation angles in the polar regions. It is still under discussion whether UFPs generally originate from new particle formation after subsequent growth of the gas-particle phase, as was found by Wiedensohler et al. (1996) in the Arctic maritime ABL during summer and autumn. Tunved et al. (2013) hypothesized that new particle formation likely occurred locally due to photo-chemical production, as increased number concentrations of UFPs were observed during the summer months, with the highest incoming solar radiation in Spitsbergen (Norway). But Tunved et al. (2013) took into account another possibility and hypothesized that the observed UFPs may have been entrained from the free troposphere (FT) and were possibly transported to the measurement site, as the measurements were carried out at the Zeppelin Observatory at a height of 472 m above sea level (a.s.l.) in Ny-Ålesund. The observations lead to the assumption that UFPs may have originated from aloft, most likely caused by high turbulence in the entrainment zone (EZ) that can trigger new particle formation, as was recognized previously for instance by Nilsson et al. (2001). Heintzenberg et al. (2017) analyzed a 10-year data set of new particle formation in the Svalbard area and excluded a potential connection to Arctic haze, and they concluded marine biological activity is a source for precursor gases of new particle formation due to photo-chemical reactions in summertime. However, new particle formation was observed earlier in springtime as well, and Dall'Osto et al. (2017) hypothesized sea ice melt is a possible trigger, as a clear connection was found between nucleation days and the highest ammonia gas concentrations (NH3). The idea is that biological precursor gases are emitted from the Arctic Ocean after sea ice melt during spring. But so far, the sources for atmospheric ammonia are still unclear, and some studies suggested sea bird colonies as a possible emission hot spot that might lead to the ternary nucleation process for new particle formation (Blackall et al., 2007; Riddick et al., 2012; Croft et al., 2016). Other studies consider iodines as a major source for new particle formation at high-latitude coastal areas (e.g., Allan et al., 2015; Sipilä et al., 2016), as well as iodic acid (HIO3) that was observed with the highest rates above pack ice in the central Arctic Ocean (Baccarini et al., 2020). In addition to this, dimethyl sulfide (DMS) is supposed to play an important role in new particle formation after its oxidation to methane sulfonic acid (MSA) and sulfuric acid (H2SO4) (Leaitch et al., 2013). For present scenarios in the maritime ABL, the availability of DMS may be one of the most dominant factors as a precursor gas for primary sulfate aerosol particles in the Arctic, especially related to the ongoing rapid decrease in the sea ice extent which might further accelerate the release of DMS (e.g., Gabric et al., 2005). This was recently verified by Lee et al. (2020), who further support the assumption of a local origin for new particle formation in Ny-Ålesund.
However, it is difficult to accurately determine the local source of UFPs in the Arctic ABL due to the limited number of measurements available for small particle sizes, in particular for 1 to 2 nm. Additionally, new particle formation in the ABL may be influenced by a combination of various factors that occur simultaneously on different scales. The lack of knowledge about the nucleation process and subsequent growth of aerosol particles in the vertical and horizontal distribution contributes to the uncertainty surrounding the role of aerosol particles on the AA. This is largely due to limited data availability in the Arctic region, caused by high cost and difficulty of access to research sites. There are data gaps due to the limited availability of suitable measurement methods that would allow for frequent profiling between the surface and the FT in the ABL. A comprehensive understanding of the life cycle of aerosol particles is crucial to identifying potential sources of new particle formation. To accomplish this, it is important to conduct spatiotemporal UFP measurements, encompassing nucleation, growth and mixing within the ABL. At this point, the use of suitably equipped uncrewed aerial systems (UASs; also called drones or remotely piloted aircraft systems, RPASs) has a high potential for achieving a better understanding of the spatial distribution of aerosol particles in relation to different ABL properties. The large flexibility is one of the main advantages of the UAS compared to tethered balloons or radiosondes that were used for vertical profiling during several studies in Ny-Ålesund (e.g., Moroni et al., 2015; Ferrero et al., 2016). The recently published report of Hann et al. (2021) summarized UAS applications that were previously carried out in Svalbard and provided a detailed overview of rapidly growing applications within the last few years, but activities in atmospheric research played a minor role. In particular, the spatial distribution of UFPs has not been studied yet but would be essential in order to document possible sources for new particle formation. Processes above land in comparison with processes above open water or sea ice can be investigated by UAS operations at low altitudes. In this article, the focus is on the results of aerosol observations rather than on the technical background of the campaign that was introduced in Lampert et al. (2020), and a general review of UAS campaigns in Svalbard is not in the scope of this publication; other case studies of the ALADINA period have already been the subject of publications and are shown in Lampert et al. (2020), Petäjä et al. (2020), Schön et al. (2022a) and Xavier et al. (2022).
The aim of this article is to present an overview of the UAS field campaign and the gained data in order to better understand the horizontal and vertical variability of aerosol particles in relation to the Arctic ABL. One of the main advantages of the UASs is to link observations between different research sites – here the Zeppelin Observatory (ZEP; 78∘56′ N, 11∘53′ E; 472 m a.s.l.) and the Gruvebadet facility (GRU; 78∘55′ N, 11∘56′ E; 67 m a.s.l.) – that provide long-term aerosol measurements at different altitudes. A connection between both stations is of vital importance to characterize dynamic effects like vertical mixing and horizontal transport on small scales, as well as to assess the role of the ABL's stability in the spatial distribution of UFPs.
The article is structured as follows: Sect. 2 provides an overview of the research area around Ny-Ålesund, the aerosol instrumentation at Gruvebadet and the Zeppelin Observatory as well as on board the UASs, the methods, and data availability during the experiment. The results are presented in Sect. 3, starting with a campaign overview of aerosol observations at the two research sites in comparison with vertical profiles of UFPs with a diameter in the size range of 3 and 12 nm (N3−12) derived from ALADINA. In summary, 230 vertical profiles of the aerosol particle number concentrations for different sizes and meteorological parameters like potential temperature θ and water vapor mixing ratio r are discussed in order to assess a correlation between the occurrence of UFP and ABL properties. In addition, three selected case studies are presented in more detail that focus on different aspects. The case studies comprise observations during the end of the Arctic haze period from 24–26 April 2018 (Case I), high variability of UFPs in the horizontal scale during a nucleation event on 20 May 2018 (Case II) and a study of increased UFPs that appeared during a day affected by pollution on 23 May 2018 (Case III). This study ends with a conclusion in Sect. 4.
2.1 Research site Ny-Ålesund
The topography around the international research area of Ny-Ålesund combines a highly variable terrain with tundra, hills, mountains, glaciers, fjords and the Arctic Ocean on small distances of a few hundred meters (see Fig. 1). The village of Ny-Ålesund (78∘55′ N, 11∘52′ E; 11 m a.s.l.; Fig. 1) belongs to the Svalbard islands and is located at the southern coast of the Kongsfjord, southwesterly at a distance of around 10 km away from the Kongsvegen glacier. The fjord is oriented in the northwest and southeast axis and defines the two main wind regimes at the measurement area in Ny-Ålesund. One wind sector originates from the flow from the direction of the Kongsvegen glacier, leading to high wind speed from east to southeast. The other wind regime is from south to southwest from the Arctic Ocean.
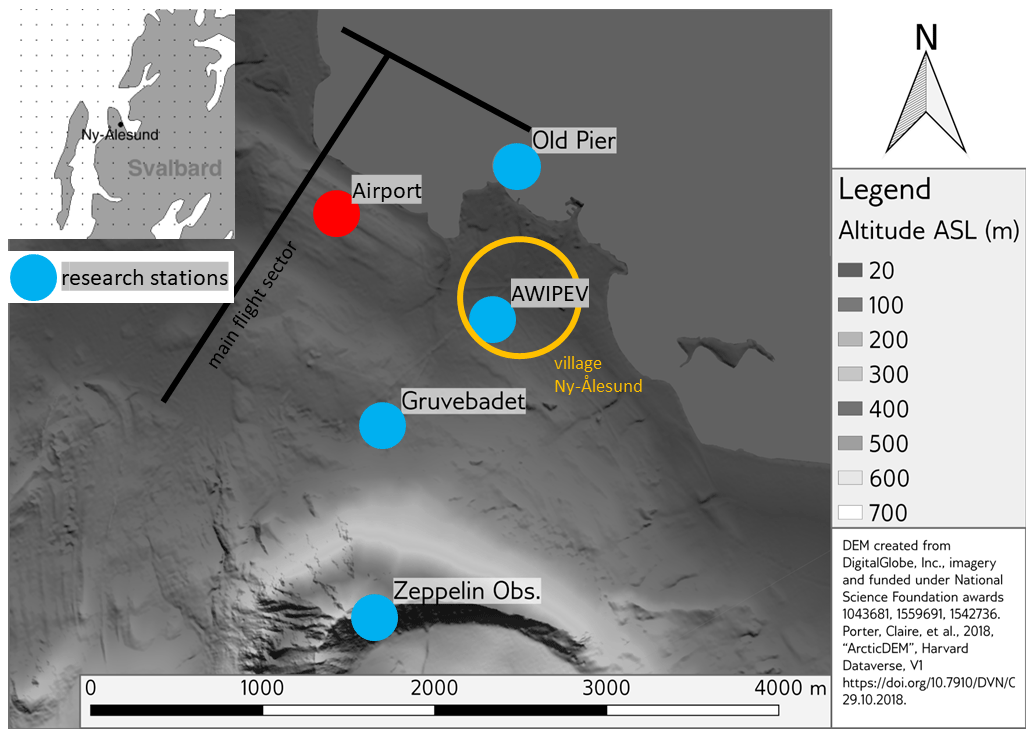
Figure 1The map represents the topography (grey shading in color bar) of the investigation area around Ny-Ålesund (yellow circle). Research flights were performed with the two UASs parallel to the airport (red point, approximately 40 m a.s.l.) and crossing the coast via horizontal legs (black lines) in April–May 2018. The aerosol in situ data used are from Gruvebadet (67 m a.s.l.) and the Zeppelin Observatory (472 m a.s.l.), and meteorological data from the AWIPEV station are taken into account.
During summer, there is also a frequent northwest to southwest wind, caused by drainage flows from Mount Zeppelin to the fjord and low wind speed from the open sea (e.g., Beine et al., 2001; Mazzola et al., 2016). However, the wind regimes are mainly valid for the lowermost 500 m (Graßl et al., 2022), as measured at Old Pier or at the Gruvebadet observatory, which is also influenced by a katabatic flow from the Broggerbreen in the west (Schön et al., 2022a). The latter is situated southwest of the village of Ny-Ålesund and southeast of the airfield at a respective distance of around 1 km (see Fig. 1). Beine et al. (2001) showed that wind speed and wind direction are different at the Zeppelin Observatory, which is located on the top of Mount Zeppelin at a distance of around 2.3 km south of the village. Most of the time, the station is within the ABL, but to a lesser extent observations represent conditions of the lowermost FT (e.g., Tunved et al., 2013). During spring, the research station is mainly influenced by southerly wind, so possible local pollution from the village should be of minor importance during the general highest research activity in Ny-Ålesund (Beine et al., 1996). This was recently verified by Dekhtyareva et al. (2018), who further investigated a significant non-linearity of the measured temperature between the Zeppelin Observatory and observations close to sea level altitude, as a result of the different altitude levels and complex terrain. The effect was particularly observed during the summer months and was most likely caused by wind shear as a result of different airflows that typically occur within the lowermost 500 m, and above 800 m the wind direction tends to merge into the synoptic flow (Graßl et al., 2022). Apart from a high impact of the topography on meteorological properties, the site is characterized by a high variability in the aerosol composition as well. For instance, Ström et al. (2003) and Tunved et al. (2013) showed a seasonal variability of the aerosol particle mode measured at the Zeppelin Observatory. In principle, the spring months (March–May) are dominated by accumulation-mode particles that mainly originate from long-range transport outside of the Arctic, a phenomenon called “Arctic haze”. The summer months (June–August) show a minor role of accumulation-mode particles and a domination of the nucleation mode, mainly linked to a low condensation sink (CS), referring to Park et al. (2017). During the rest of the year (September–February), the site is influenced by a low number concentration of accumulation-mode particles and also by a minor relevance of nucleation-mode particles with an overall minimum in September and October.
2.2 Aerosol monitoring
In situ observations of aerosol particles are taken into account from the Gruvebadet research station (GRU) and the Zeppelin Observatory (ZEP); see Fig. 2a. GRU data represent surface measurements, and observations at ZEP are mainly representative for conditions at the higher parts of the ABL and to a lesser extent in a transition zone between the ABL and FT.
A scanning mobility particle sizer (SMPS; model 3034, TSI Inc., USA) is deployed at GRU, which measures in the particle size range between 10 and 470 nm (Hogrefe et al., 2006; Lupi et al., 2016).
At ZEP, the aerosol size distribution is derived from a combination of a differential mobility particle sizer (DMPS) in the sizes of 5–810 and 10–790 nm. Further, UFPs of different sizes are determined with a nano-SMPS (nano-scanning mobility particle sizer) at ZEP, which is a combination of a nano-DMA (differential mobility analyzer; model 3085, TSI Inc., USA) and a CPC (condensation particle counter; model 3776, TSI Inc., USA) in 3 min temporal intervals. In order to provide information about possible local pollution at the investigation site, eBC mass concentration data are used, which are calculated from the aerosol light absorption coefficient measured with a multi-angle absorption photometer (MAAP; model 5012, Thermo Fisher Scientific Inc., USA), also deployed at ZEP. The Zeppelin Observatory in its full facility was recently presented in Platt et al. (2022) and shows more information about the instrumentation available at site.
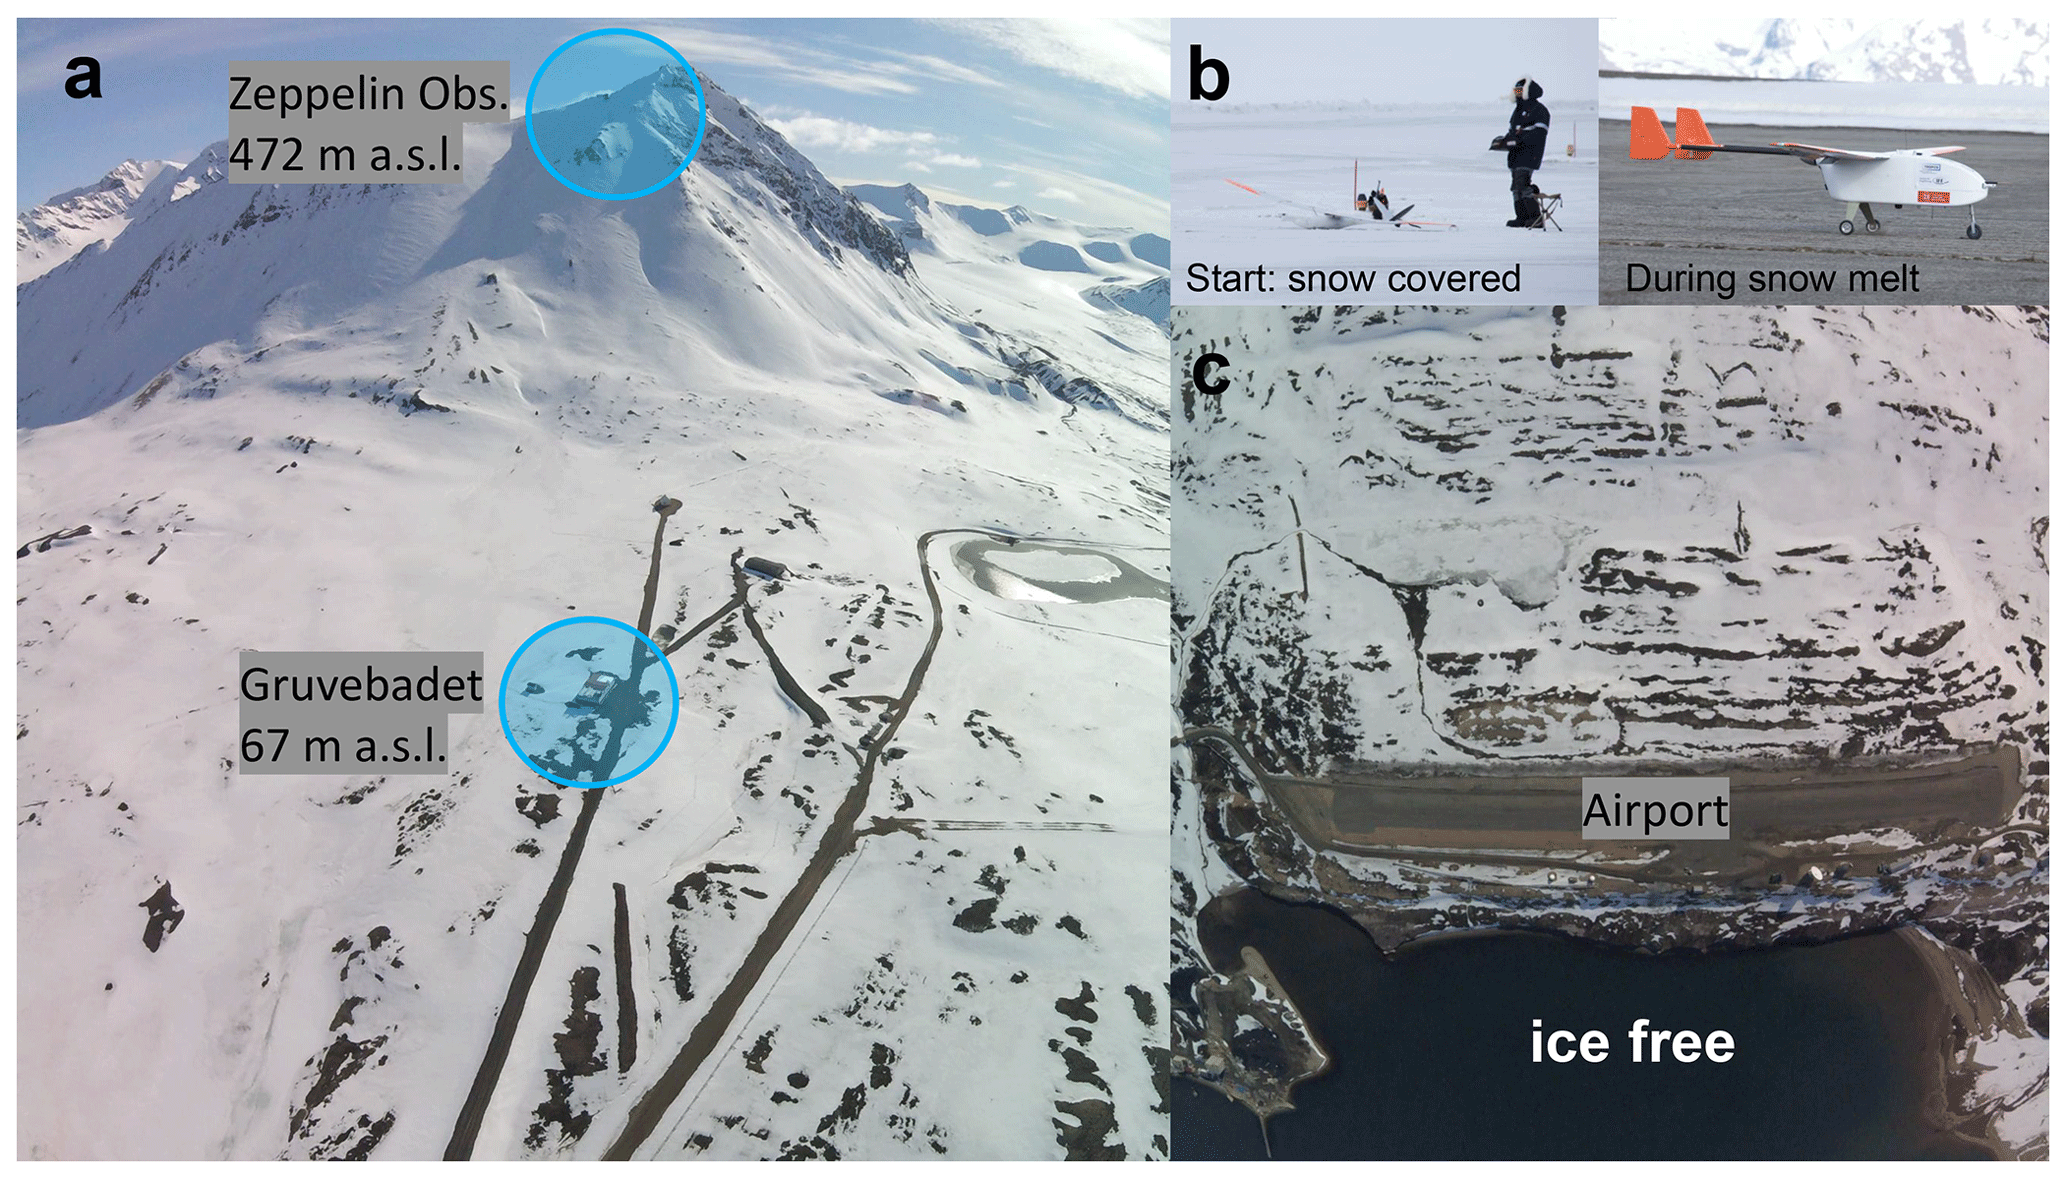
Figure 2(a) A bird's eye view of the two research stations Gruvebadet and the Zeppelin Observatory. (b) The two UASs, MASC-3 (left-hand side) and ALADINA (right-hand side), during research flights. (c) During the field experiment, snowmelt occurred and the water area around the coast was completely ice free. Pictures: © TU Braunschweig.
2.3 Uncrewed aerial systems (UASs)
Research flights with two UASs were performed at the local airfield in Ny-Ålesund (see Figs. 1 and 2c). In general, the measurement flights were oriented parallel to the airport and perpendicular over open-water areas near the coast (see Fig. 1) in order to investigate the horizontal distribution of aerosol particles and meteorological parameters above different surface conditions. Both UASs are fixed-wing aircraft developed for atmospheric research with a takeoff weight smaller than 25 kg and electrically powered. The cruising speed is less than 30 m s−1, which further results in a high temporal resolution of the measured data in comparison with a typically faster cruising speed of crewed aircraft of around 60–70 m s−1. In addition, the two UASs are equipped with autopilot systems and are automatically controlled during measurement flights after programming a well-defined flight path of the flight missions. One major challenge of the UAS application was the restricted frequency use of >2 GHz, as Ny-Ålesund is a radio silent zone. For this purpose, all modules had to be adapted from the typical 2.4 GHz and were run to work at 433 and 868 MHz, respectively. In the following, both systems are briefly introduced, as they differ in their designs and payloads.
The UAS ALADINA (Application of Light-weight Aircraft for Detecting IN situ Aerosol; Fig. 2b) is based on the aircraft family of type Carolo P360 and was designed at the Technische Universität Braunschweig. The fixed-wing airplane has a wingspan of 3.6 m, a takeoff weight of 24.8 kg and a mean flight duration of 35–45 min. Its first performance was described in Altstädter et al. (2015), but for the polar application shown here, the design of ALADINA and its instrumentation on board have undergone fundamental changes, which are presented in Lampert et al. (2020). The payload weighs around 4.5 kg and consists of meteorological sensors, aerosol instrumentation and batteries for measurement devices. Different types of temperature sensors, humidity sensors, and a multi-hole probe and two pyranometers are installed for the calculation of air temperature, humidity, 3-D wind vector and radiation properties. More information about the meteorological measurement unit is available in Bärfuss et al. (2018). Two condensation particle counters of the same type (CPC, model 3007, TSI Inc., USA) are used with different threshold diameters, which allow measurements of the aerosol particle number concentrations with a size of up to around 1 µm. The two CPCs were tested and modified by TROPOS (Leibniz Institute for Tropospheric Research) and are tuned down to cutoff sizes of 3 nm (CPC1) and 12 nm (CPC2), respectively. Thus, the study presented here takes into account the observed aerosol particle number concentration of UFPs in the size range between 3 and 12 nm, hereafter referred to N3−12, within an uncertainty of ±20 % at a 1 s temporal resolution (Altstädter et al., 2015). An optical particle counter (OPC; model GT-526S, Met One Instruments Inc., USA) measures the larger particles in six size channels. In this article, only one out of the total six size channels is considered, which is valid for particles with a size between 300 and 500 nm (N300−500), as larger particles were not detectable during the investigation period. The concentrations have a measurement error of ±15 % (Altstädter et al., 2015). The flow system of the original handheld instruments has been modified by substituting the internal pumps with a single, more powerful one (diaphragm pump 1420VP BLDC, Gardner Denver Thomas GmbH, Germany) and implementing orifices after the detectors, which are driven critically. The orifice diameters for the two CPCs are in. and provide a volume flow of approximately 125 mL min−1 under standard atmospheric conditions and in. for the OPC optics, which results in a volume flow of approximately 2 L min−1. Additionally, a micro-aethalometer (microAeth®; model AE51, λ=880 nm, AethLabs, USA) is implemented on board for detecting the equivalent black carbon (eBC) mass concentration, based on the light-absorbing measurement principle. The data handling and post-processing of the calculated eBC is equivalent to the performance presented in Altstädter et al. (2020). The AE51 is susceptible to humidity and temperature gradients (Altstädter et al., 2020), and its reliability is limited by artifacts in the attenuation signal that mainly correlate with a small aerosol background concentration (e.g., Pikridas et al., 2019) within a given accuracy of ±10 %, as stated by the manufacturer. Regarding a previous field campaign with ALADINA in West Africa, the uncertainty was calculated as ±200 ng eBC m−3 for a temporal resolution of 1 Hz. This is a critical point for the measurement reliability of the AE51 in the Arctic, firstly as the background aerosol number concentration is low in Svalbard, with around several hundred per cubic centimeter (Tunved et al., 2013), and secondly the eBC load is marginal and far below the specified detection limit of the AE51. For instance, a maximum of around 80 ng m−3 was measured in Ny-Ålesund between the years of 1998 and 2007 (Eleftheriadis et al., 2009), derived from an aethalometer of model AE31 which works at the same wavelength of λ=880 nm as the AE51. Due to the expected limited performance of the AE51, eBC measurements are not provided in a statistical analysis in this paper.
The UAS MASC-3 (Multi-Purpose Airborne Sensor Carrier) in its third version (Fig. 2b) was developed by Tübingen University (Germany). It has a wingspan of 4 m, a weight of 6.5 kg, and a maximum flight duration of 2 h, and it is described in more detail in Rautenberg et al. (2019). MASC-3 is equipped with a sensor system that consists of a multi-hole probe, a fine-wire platinum resistance thermometer and a slower digital humidity sensor. The high-resolution 3-D wind vector and air temperature can resolve turbulent fluctuations. For the field campaign in Ny-Ålesund, some adaptions had to be undertaken. For instance, all heated electronic parts were insulated in the hull with foam to maintain a stable temperature. The batteries were pre-heated before takeoff and insulated in foam in order to assure a warm temperature that is essential for safety reasons and for a long flight duration under cold ambient conditions.
2.4 UAS flights and ground-based data availability
Table 1 provides an overview of the individual measurement days and the data availability of the UAS ALADINA in Ny-Ålesund between 24 April and 25 May 2018. This includes information about the total number of vertical profiles that were performed with ALADINA for the specific measurement days. Flight operation with MASC-3 and aerosol data measured with SMPS at GRU, nano-SMPS, DMPS and MAAP at ZEP are shown in terms of data availability according to the ALADINA flights. During the investigation period, 49 research flights were operated with ALADINA on 11 different measurement days (see Table 1 and Figs. 3b and 4b), which led to a sampling time of around 29 h. In total, 230 vertical profiles and around 300 horizontal transects (mainly at the heights of 150, 300 and 450 m a.s.l.), called legs, were carried out during the field experiment.
Table 1As one of the main objectives of the study is filling missing information about the spatial distribution of aerosols between the two fixed long-term observatories, GRU and ZEP, this table shows the data availability of the additional instrumentation that was deployed during the ALADINA period. “NO” means not operated; “NA” stands for not available; “X” represents data availability of the instrumentation during the specific days when research flights were performed with ALADINA.
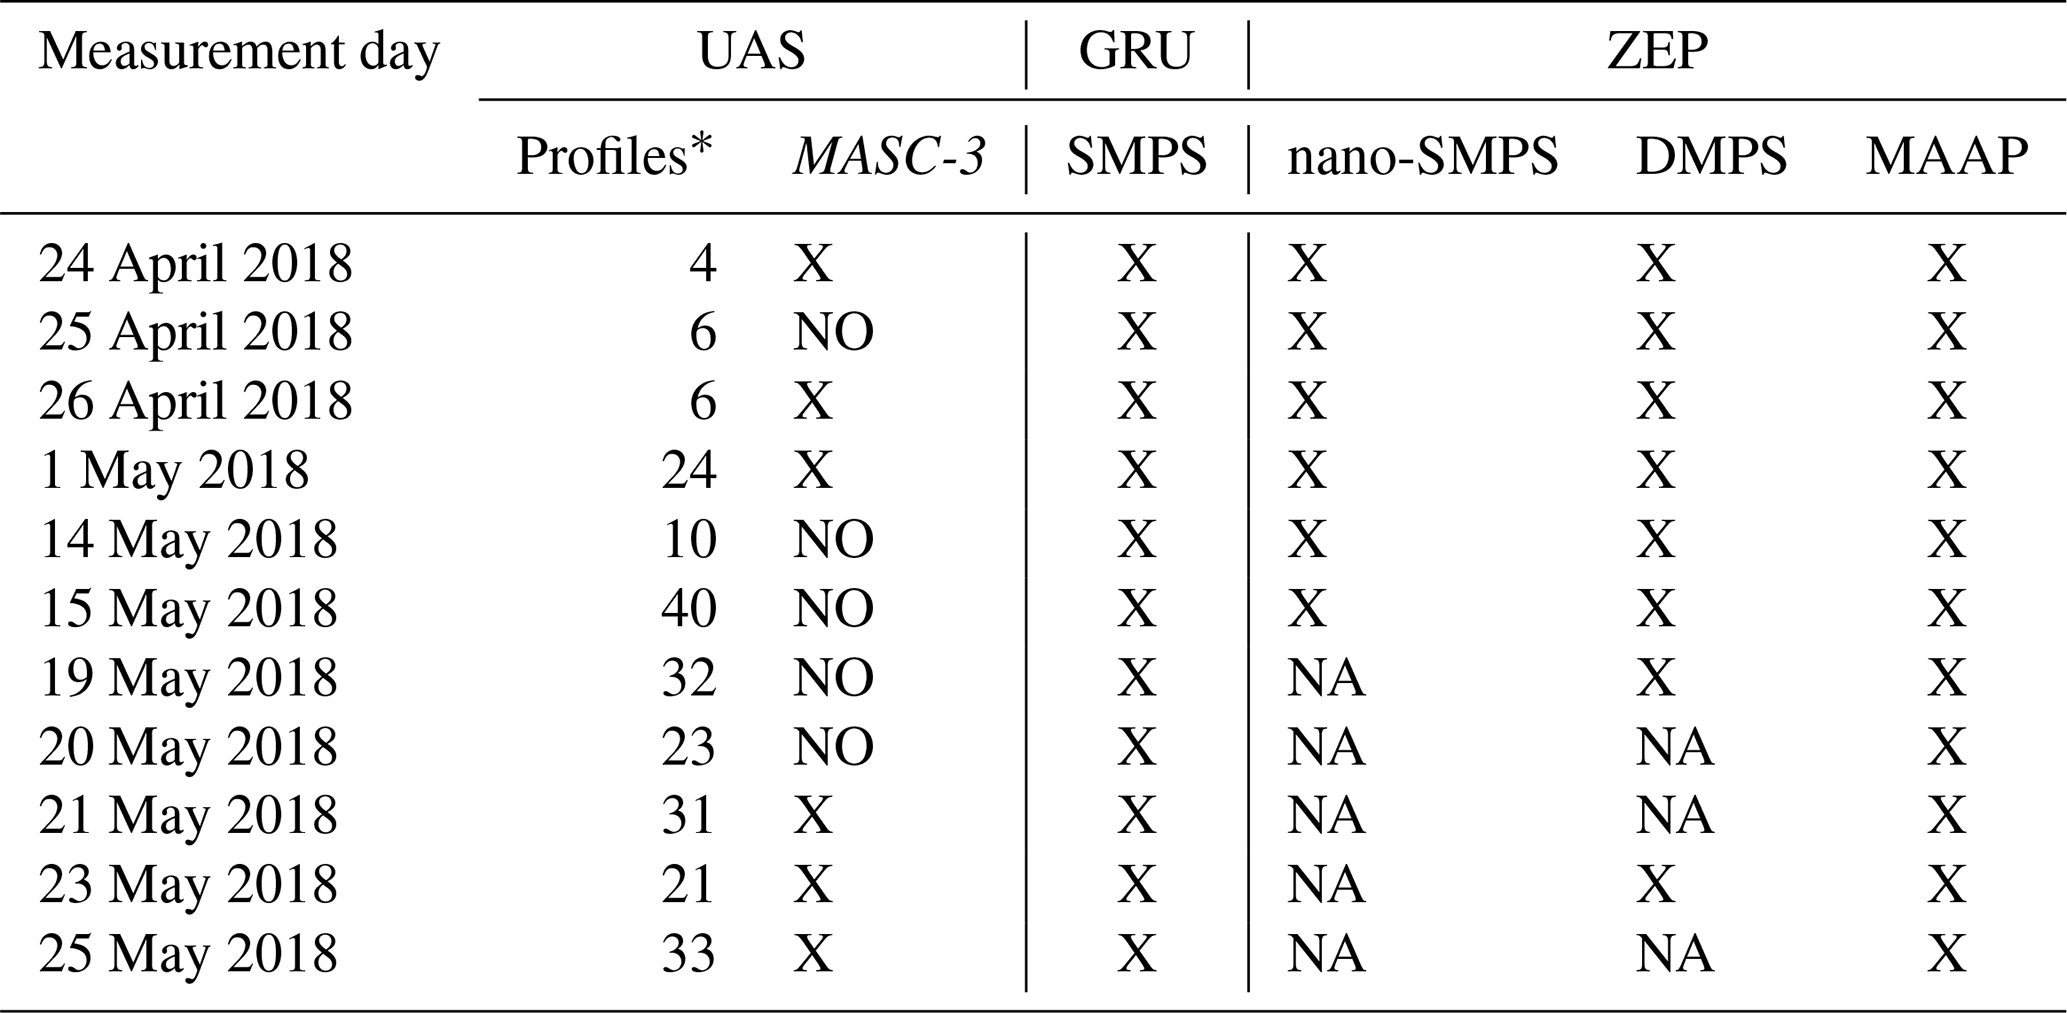
* Number of vertical profiles that were performed with the uncrewed aerial system (UAS) ALADINA within the indicated measurement day. In total, 230 vertical profiles were enabled during the measurement period; a summary of all profiles is used for the analysis shown in Figs. 7–8, and for a better orientation of the situation the profiles are presented in Figs. A1–A6 according to the time series of the individual parameters.
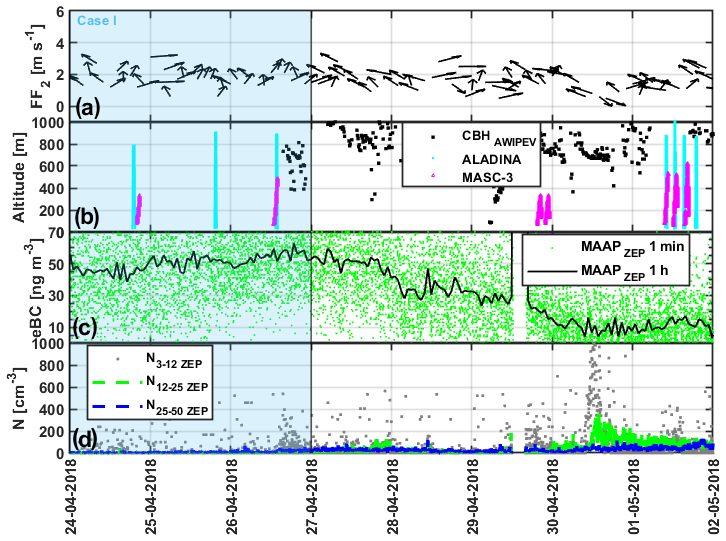
Figure 3Time series of selected parameters valid for the period between 00:00 UTC on 24 April and 00:00 UTC on 2 May 2018. From top to bottom: wind speed FF2 in meters per second (m s−1) and wind direction in a 2 h average at the 2 m level, as well as cloud base height (CBH) in meters (m) for a 10 min interval (black dot), all derived from the AWIPEV station and here shown in comparison with periods of ALADINA flights (cyan dot) and MASC-3 flights (magenta triangle). Equivalent black carbon mass concentration (eBC) is estimated from a MAAP in 1 min (green dot) and averaged for 1 h (black line), and the aerosol particle number concentration (N) was derived for different sizes from a nano-SMPS in 3 min intervals, both measured at the Zeppelin Observatory. The blue shading represents the 3 measurement days of ALADINA that are considered for a deeper analysis in the first case study (Case I, Sect. 3.3).
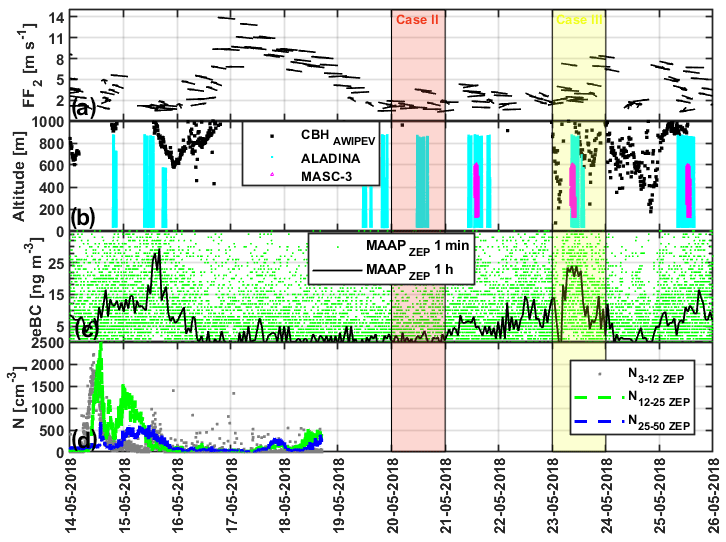
Figure 4The same as Fig. 3 but for the second measurement period of ALADINA between 00:00 UTC on 14 April 2018 and 00:00 UTC on 26 May 2018. The red shading indicates the time series of the second case study analyzed here (Case II, Sect. 3.4) that focuses on the horizontal distribution of N3−12, and the yellow shading stands for the period of the third case study (Case III, Sect. 3.5) that considers the occurrence of N3−12 along with a pollution event.
Horizontal flights were mainly performed with ALADINA in the last week of the campaign between 18 and 25 May 2018, and as the priority of the flight mission was vertical profiling with a typical maximum altitude of 850 m a.s.l., the horizontal legs are a short distance in order to enable as many vertical profiles as possible during one measurement flight limited by the batteries' capacity. The mean flight duration was around 35 min. For this reason, turbulent properties are not considered with ALADINA, as they require multiple horizontal flight patterns at constant altitude to guarantee statistical relevance.
However, this flight procedure was realized with the second UAS MASC-3 that was operated to a large degree at the same time on 6 common measurement days (see Table 1 and Figs. 3b and 4b). A total of 13 quality-assured research flights were performed on 7 different measurement days with a sampling time of around 17 h. The MASC-3 flight periods are summarized in the study of Schön et al. (2022a). A typical measurement flight consists of horizontal legs with a length of at least 1.5 km. The legs are repeated three to four times at each measurement altitude, typically between 50 and 600 m a.s.l. Within the flight duration of 1.5 to 2 h, approximately 40–50 legs are sampled, allowing us to calculate vertical profiles of the mean 3-D wind vector, temperature and humidity.
The first week of the flight campaign was mainly used for unpacking, preparation and test flights of both UASs. As a result of this, the majority of the research flights were carried out during May 2018 in a transition period between spring and early summer and were thus influenced by snowmelt, which can be further seen in the reduced snow-covered surfaces (Fig. 2). However, from 2 to 13 May 2018, no measurements were performed due to technical reasons. For safety reasons, the field application was limited to operation out of clouds, without precipitation and wind speed below 15 m s−1. Thus, a continuous flight program was not possible during the entire field period, which will be explained in more detail in the following.
For additional background information and in order to enable a better orientation of the temporal availability of the data that are used in this study, Figs. 3 and 4 display specifically chosen measurement parameters derived from different ground-based stations (e.g., wind speed, wind direction, cloud base height, eBC and N3−12), separated into two main episodes within the applied flight campaign. More precisely, the first section shows observations between 24 April and 2 May 2018, and the second part presents data from 14 until 26 May 2018. Figures 3a and 4a show time series of the measured wind speed and wind direction, observed at the AWIPEV research site at the height of 2 m (Maturilli, 2018a, b) in the village of Ny-Ålesund. In addition, time series of the ceiling in terms of cloud base height, measured at the AWIPEV station (Maturilli, 2018c, d), are presented in Figs. 3b and 4b together with the measurement periods of both UASs (see Figs. 3b and 4b). Due to heavy snowfall (Fig. 3b), no research flights were performed during the periods from 27–30 April 2018. In addition, in the presence of low-level clouds and high wind speed (Fig. 4b), no field activity was carried out on 16–18 and 24 May 2018.
In addition, the time series of different aerosol properties are presented in Figs. 3–4 to assure the clarity of the decision for the three selected case studies. Observations of eBC calculated from MAAP at the Zeppelin Observatory are shown for the ALADINA flight period (Figs. 3c and 4c), as well as nano-SMPS data for three different sizes of N3−12, N12−25 and N25−50 in Figs. 3d and 4d. The first case study investigates the period of the end of the Arctic haze between 24 and 26 April 2018 (Case I, Sect. 3.3, Fig. 3). The second case study focuses on the horizontal distribution of UFPs observed during a day when nucleation occurred at the site on 20 May 2018 (Case II, Sect. 3.4, Fig. 4). In order to discuss the impact of local pollution on the spatial distribution of UFPs, a day with a higher degree of local pollution was chosen, which can be further seen by the increase in the measured eBC from 0 to a maximum of 24 ng m−3 on 23 May 2018 (Case III, Sect. 3.5, Fig. 4).
However, the main focus of the ALADINA investigation is on linking observations of aerosol properties at the different observatories located at different altitudes. Subsequently, the discussions of the results start with an overview of the measured vertical profiles of UFPs in the size range of 3 to 12 nm that were performed with ALADINA in connection to the aerosol size distribution measured at the two observatories, GRU and ZEP.
3.1 Overview of the vertical variability of aerosol particles during the flight campaign
In order to discuss the spatial distribution of aerosol particles at the complex site, the time series of aerosol particles are shown in a 3-D representation in Figs. 5–6. Ground-based data were derived at two different altitudes: first close to the surface from a SMPS at GRU (Figs. 5–6a) and secondly from a DMPS at ZEP (Figs. 5–6b), measured at Mount Zeppelin. The continuous data are further compared with vertical profiles of N3−12 that are displayed in the background (Figs. 5–6c) for a potential link between the two research stations. The figures are further separated into two main episodes, matching the same time slots as presented in Sect. 2.4: for the first part between 24 April and 2 May 2018 (Fig. 5) and for the second part considering observations from 14 until 26 May 2018 (Fig. 6). At the beginning of the campaign, accumulation-mode particles were dominant at both sites with low number concentrations of a few hundred per cubic centimeter (Fig. 5) – most likely linked to the end of the Arctic haze period. The DMPS data at the Zeppelin Observatory were not available for the whole investigation period, which is characterized by data gaps that occurred from 00:00 UTC on 27 April until 00:00 UTC on 28 April 2018 and temporarily between 28 and 29 April 2018, which is, however, out of the ALADINA period. Nucleation-mode particles were not present at both sites, but sporadic occurrences of UFPs with short-term duration and no further growth of the particles can be identified and are most apparent at both sites in the evening hours on 26 April 2018. The vertical profiles of N3−12 show a similar picture by means of no appearance of UFPs in the vertical scale, except for a low enhancement of N3−12 with around 300 cm−3 on 26 April 2018.
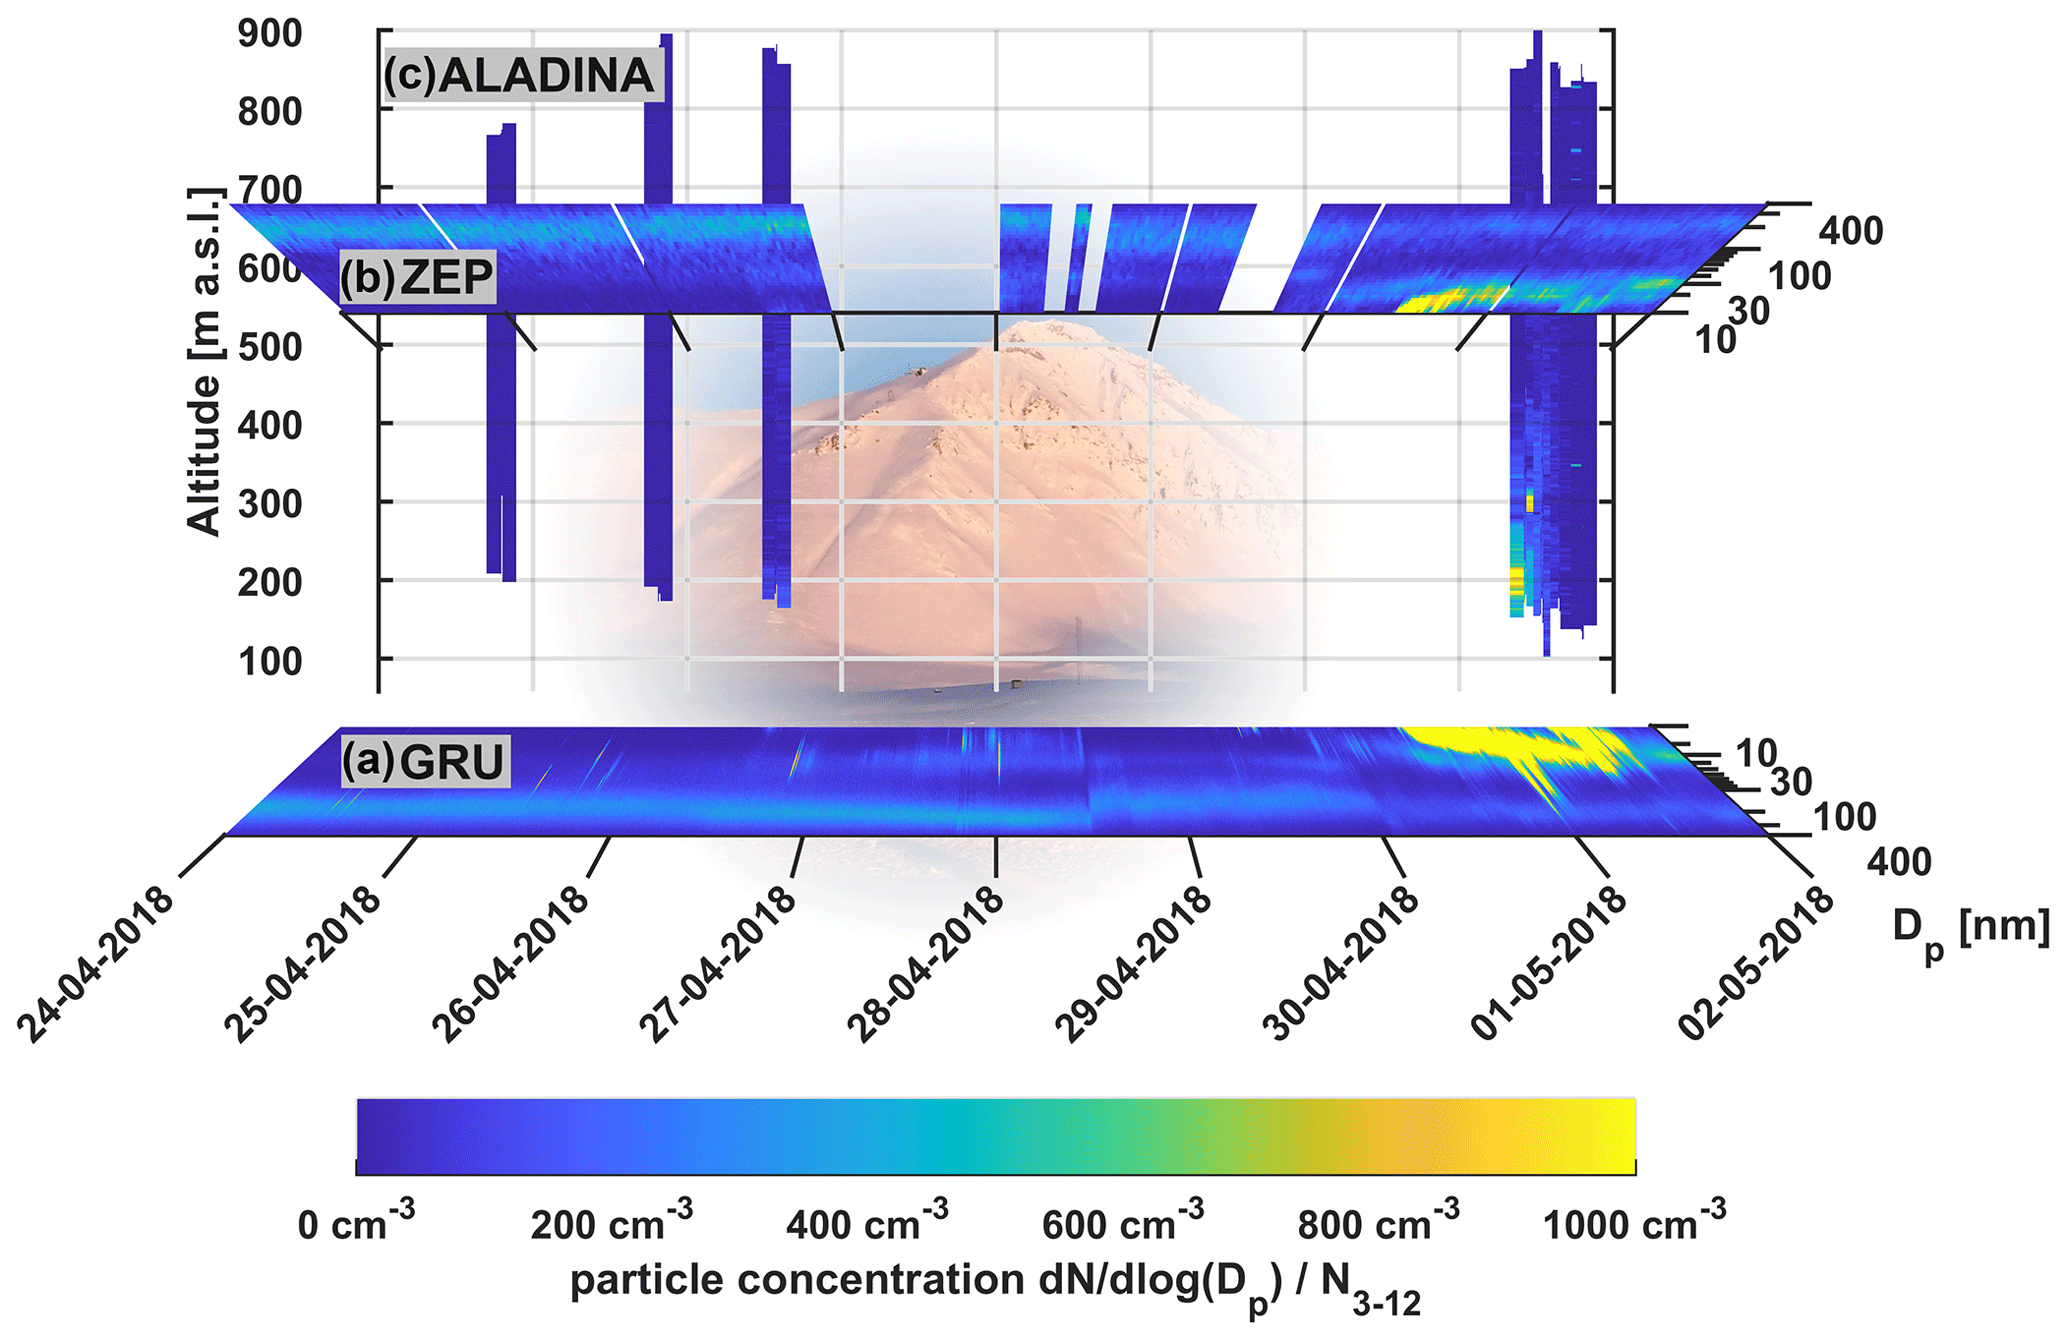
Figure 5Time series of aerosol particle number concentration for a size range between 10 and 400 nm, measured at the two fixed sites with a SMPS at Gruvebadet (a, bottom) and with a DMPS at the Zeppelin Observatory (b, top). Vertical profiles of N3−12 are shown as a projection between both stations in agreement with the same time series and with the equally chosen color bar ranging from 0 (blue) to 1000 cm−3 (yellow) that were performed with ALADINA (c, background) on 4 different measurement days during the first part of the flight campaign period.
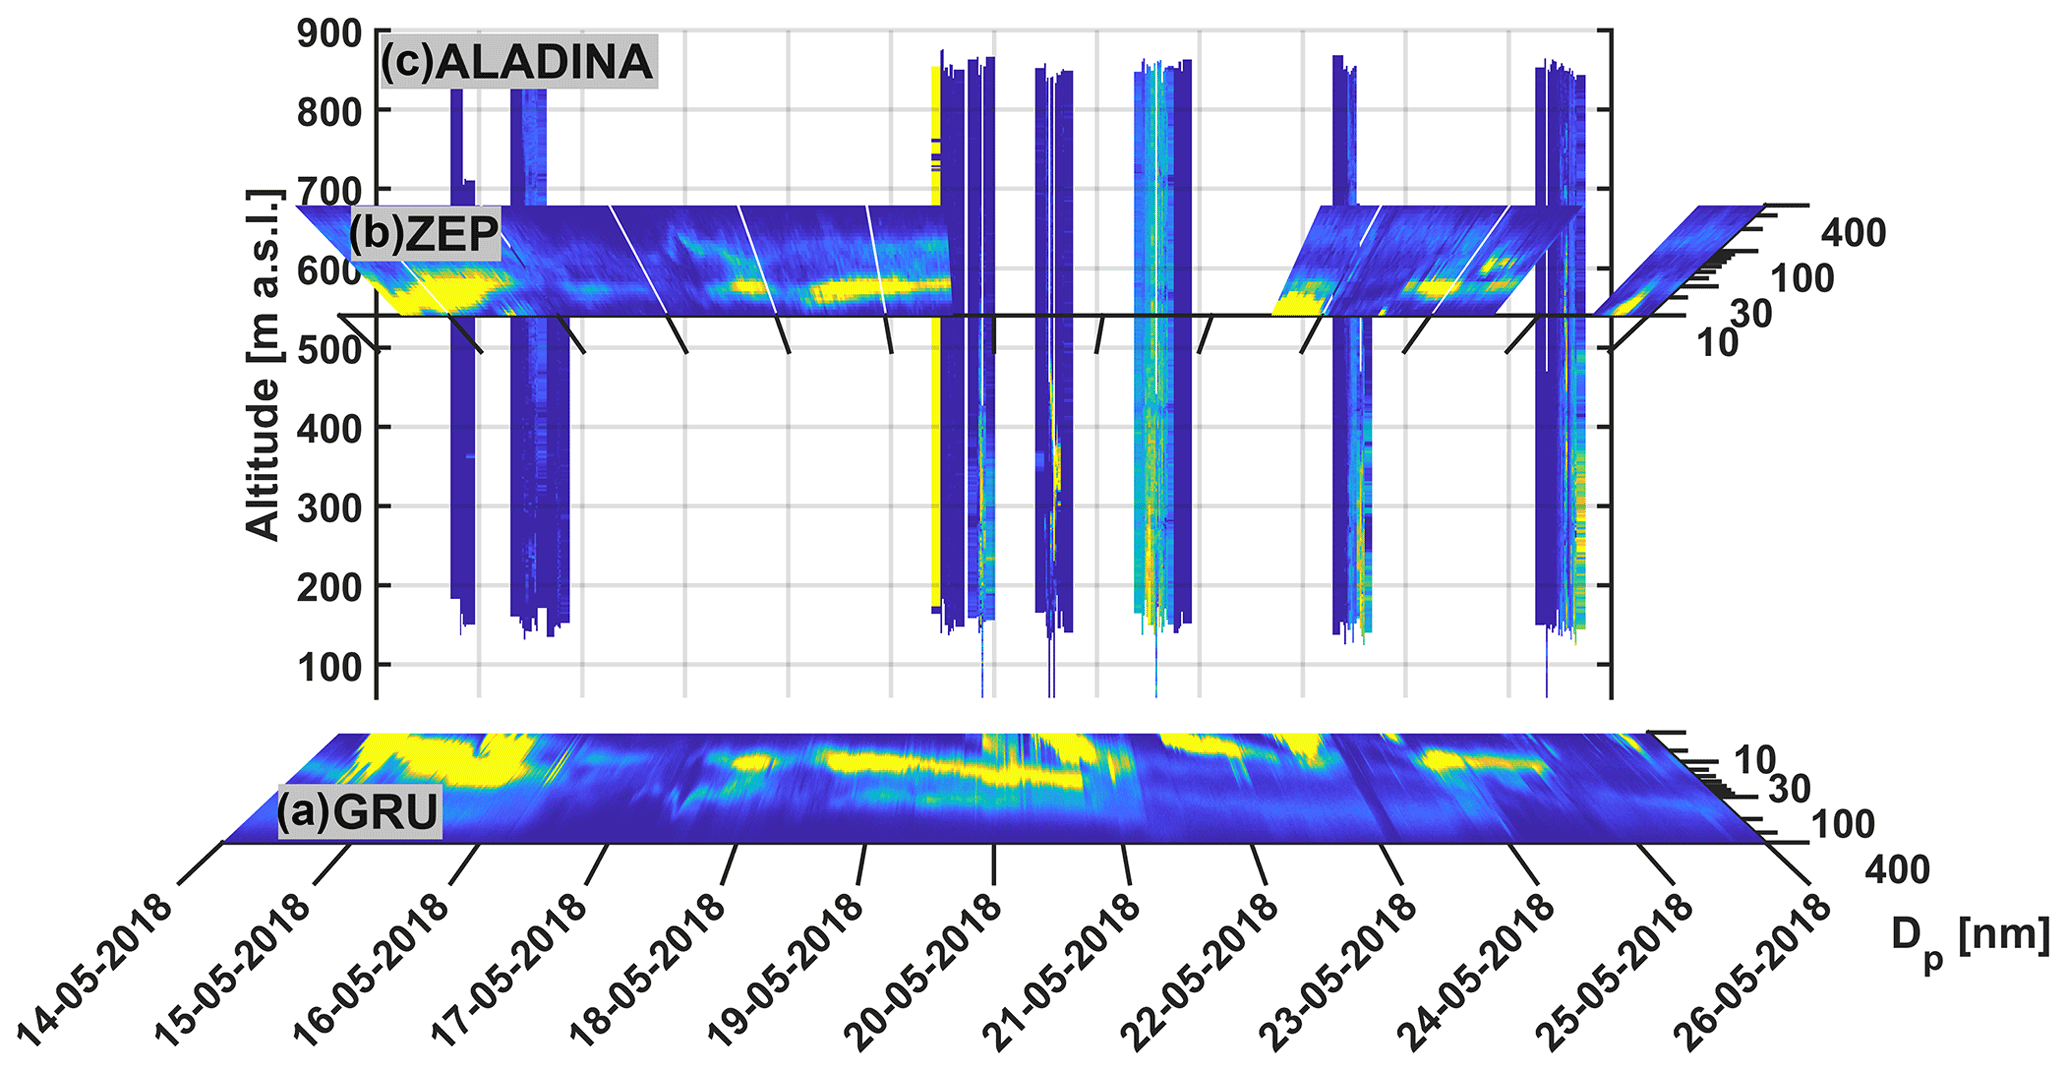
Figure 6The same parameters as shown in Fig. 5 but for the second episode of the UAS field campaign, when ALADINA performed research flights on 7 different days.
After 30 April 2018, accumulation-mode particles played a minor role and nucleation appeared at both sites but with discrepancies in the measured maximum of the number concentrations. As the measured number concentrations are higher at GRU, an origin for UFPs is possibly connected to a local source near the ground. At around midday on 1 May 2018, the subsequent growth of the particles stopped, and the vertical profiles of N3−12 present a clear domination of UFPs close to the ground and fewer particles above the altitude of 280 m a.s.l., thus supporting the idea of a potential hot spot of precursor gases or UFPs coming from the surface that were lifted upwards but prevented from mixing within the whole investigation altitude. During the second part of the field period (Fig. 6), the nucleation mode was significantly enhanced at both sites. However, only a small degree of new particle formation events with the typical growth of particle size with time, called class I in the classification of Kulmala et al. (2012), could be identified during the period, which is valid for the ALADINA measurement days on 14 and 21 May 2018. One explanation for the high occurrence of inhomogeneous particle growth may be related to rapid changes of air masses that occur frequently at the research area, mainly impacted by the complex terrain. Fast changes of air masses were dominant in May 2018 and most pronounced during the ALADINA observation days on 1, 15, 19 and 25 May 2018, which is evident from rapid shifts in the ground-based wind direction and increased wind speed from the AWIPEV station (see Figs. 3a–b and 4a–b) and by discontinuities in the observed cloud base height. Considering the vertical profiles of N3−12, which are further displayed in Fig. A3, high discrepancies are visible between ground-based observations and measurements at the higher altitude range valid for ZEP. This is of particular relevance for the observations on 19–20 May 2018, a period when nucleation was visible, and for the measurement day on 23 May 2018, where in both cases the highest number concentrations of N3−12 occurred below the height of ZEP. This demonstrates the pronounced impact of the ABL stability on the vertical mixing of UFPs, so sources of new particle formation from the ground were possibly prevented from mixing within the upper parts of the ABL; thus, the occurrence of new particle formation cannot be identified by solely taking into account observations at GRU and ZEP. However, both cases strongly differ from the observations on 21 May 2018, where a NPF event of class I was observed at GRU and the vertical profiles of N3−12 show an appearance of UFPs in the whole studied altitude range up to a maximum altitude of 850 m a.s.l., thus far exceeding the Zeppelin Observatory, so the nucleation event most likely reached the FT as well; in any case, the nucleation event of this class influenced the overall column investigated here.
Summarizing the observations during the presented 22 measurement days in Figs. 5–6, UFPs occurred frequently on 55 % of the 12 different measurement days, but the appearances of UFPs are mainly linked to non-defined NPF events; thus, they might not have been assessed after the typical classification for NPF events. Only three NPF events may have been classified as an NPF event with a subsequent growth rate which further results in a so-called banana shape (Heintzenberg et al., 2007). However, for most of the events, the particles' growth was interrupted and lasted until around midday of the following day, for instance during the observations on 30 April–1 May 2018, on 14–15 May 2018 and on 21–22 May 2018. By considering only the classic NPF event days, the frequency of occurrence is significantly reduced to a value of 23 %, as the classification is only applicable for 5 measurement days, which, however, coincides with the study of Lee et al. (2020), who considered a 2-year data set. The study calculated a mean growth rate (GR) of 2.66 nm h−1 for the particle size of 3 to 25 nm that is significantly lower in comparison with other sites in the world (e.g., Nieminen et al., 2018). Interestingly, the authors indicated high variances of the measured GR ranging from 0.48 to 6.54 nm h−1; thus, UFPs may grow at a rapid pace during some occasions, which is generally not assumed for polar studies. The measured highest values of the GR are similar to rural observations, and those high GR values were temporarily measured during the ALADINA period as well. Looking at the time series of the vertical profiles (for additional information, see Figs. A1–A3), only 4 out of the total 11 measurement days with ALADINA do not show any occurrence of UFPs in the size of N3−12, which can be explained by the following. The first three profiles were performed in April, when UFPs were not visible at both sites or solely apparent with a concentrations of a few hundred per cubic centimeter, as well as on a short temporal scale. The sporadic occurrence of UFPs is also visible in the temporary increase in N3−12 measured with nano-SMPS at ZEP (see Fig. 3d). On 14 May 2018, the aerosol particles have most likely reached larger sizes above 12 nm as a result of the subsequent growth rate of the particles, so they are out of the size range presented here.
3.2 Summary of the vertical distribution of aerosol particles and ABL properties measured with ALADINA
Figure 7 presents a statistical analysis (median, 25 % and 75 %, maximum) based on histograms which comprise all 230 vertical profiles that were performed with ALADINA during the period. More precisely, the histograms are based on vertical profiles of aerosol particle number concentration in different sizes (N3−12, N>12, N300−500), potential temperature (θ) and water vapor mixing ratio (r) between a typical height of 150–850 m a.s.l. that are further presented in Figs. A1–A6. This chosen altitude area excludes surface measurements with ALADINA, and due to safety reasons, the majority of the profiles started at an altitude of 100 m above ground level (a.g.l.), and as the airport is located at a level of around 40 m a.s.l., all profiles are bordered in the specific altitude above 150 m a.s.l. in order to provide the highest statistical relevance. Further, the dashed black line indicates the height of the Zeppelin Observatory. Note that the maxima of N3−12 and N300−500 are not provided in the graph in order to provide better readability of the analysis, as they are far outside of the measurement range. The vertical distribution of N3−12 shows a higher concentration close to the ground with decreasing number concentrations with increasing altitude. The median of N3−12 is low between 90 and 270 cm−3 with an overall minimum at the height of 550 m a.s.l., suggesting a generally low frequency of UFPs above ZEP. However, the total maximum of N3−12 exceeds 6200 cm−3 at the height of 640 m a.s.l.; thus, the highest number concentrations were found even above the height of the Zeppelin Observatory. Here it is important to note that the maximum is not shown in the graph in order to fulfill the readability of the vertical distribution of N3−12, as the maximum was far out of the 75 % range as well. The vertical profile of particles with a particle size larger than 12 nm (N>12) displays equally higher number concentrations on the ground and decreasing values with growing altitude. The median of N>12 varies between 420 and 950 cm−3 for the entire altitude range. In addition, the total maximum of 14 500 cm−3 was measured at the height of 800 m a.s.l., but to a greater extent the highest number concentrations appear below 330 m a.s.l. and are associated with strongly variable number concentrations ranging from 1320 to 13 000 cm−3.
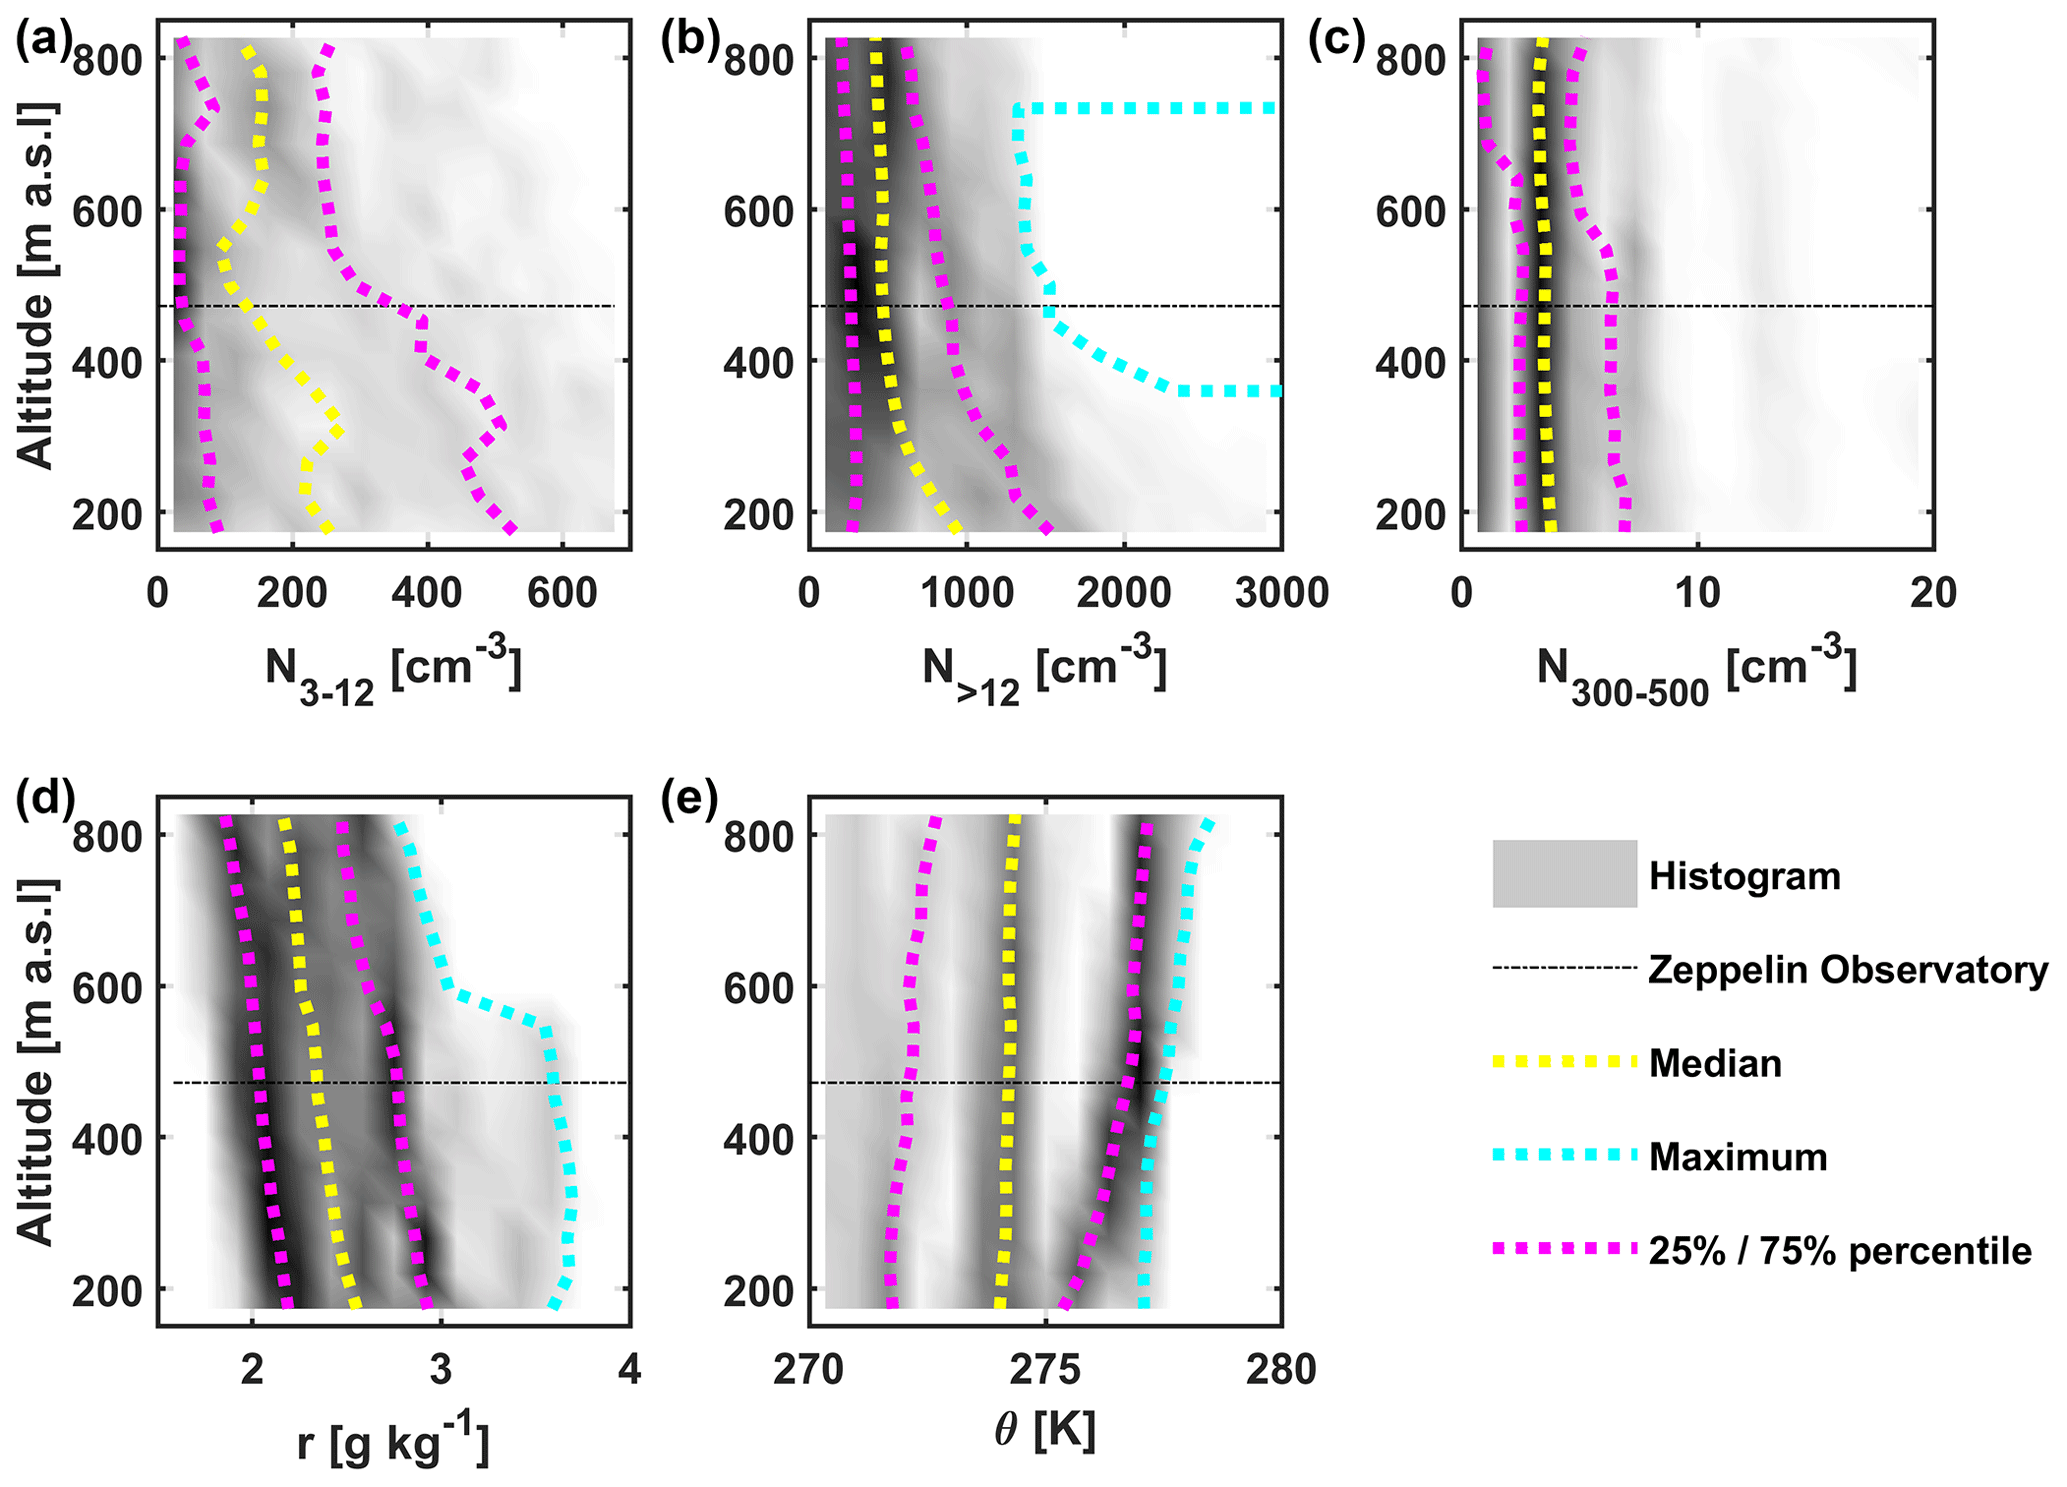
Figure 7Histograms (color coded in grey) based on 230 vertical profiles performed with ALADINA. Aerosol particle number concentration in particles per cubic centimeter (cm−3) for different sizes of (a) N3−12, (b) N>12 and (c) N300−500; (d) water vapor mixing ratio r in grams per kilogram (g kg−1); and (e) potential temperature θ in kelvin (K). The yellow line represents the calculated median of all profiles, the cyan line stands for the specific maximum and the bright magenta lines mark the measurement range between 25 % and 75 %.
Considering the vertical distribution of particles larger than 300 nm (N300−500), only several particles per cubic centimeter were detected during the period, meaning less than 7 cm−3 for the interquartile of 75 %. Again, the maximum is not included in the graph due to the same reason as explained for the vertical profiles of N3−12, as it is far out of the measurement area represented by the interquartile of 75 %. After subsequent nucleation – valid for the measurement days on 14, 15, 19, 23 and 25 May 2018 – UFPs grew to larger sizes and were recorded by the OPC. For instance, a total maximum of 120 cm−3 occurs in the whole altitude after the NPF event on 14–15 May 2018. In general, the highest number concentrations were measured during April 2018 due to the main presence of accumulation-mode particles. The vertical distribution of the water vapor mixing ratio r indicates an influence of maritime air masses with enhanced moisture close to the ground and dryer air lifted above. The median of r decreases from 2.6 g kg−1 at 150 m a.s.l. to 2.2 g kg−1 at the height of 850 m a.s.l., and the total maximum of 3.7 g kg−1 was measured on 15 May 2018, when the cloud base height reached low altitudes of 600 m a.s.l. (see Fig. 4), so the UAS was not operated as high as usual in order to assure a safe mission. The vertical profiles of θ show a higher variability in the vertical scale, ranging from stable conditions in the 75 % line below the height of 400 m a.s.l. and a generally well-mixed stratification with respect to the median of θ that represents a marginal deviation of 0.33 K in the whole altitude range between 150 and 850 m a.s.l., thus leading to the assumption of a high potential of mixing of UFPs within the ABL.
In contrast to the summary that takes into account all vertical profiles (Fig. 7), Fig. 8 depicts the same selected parameters but under the requirements that solely vertical profiles are considered as histograms when UFPs are detectable at both research sites and the difference between the two CPCs on ALADINA passes the total concentration of 500 cm−3. These criteria were chosen in order to avoid any likely impact of artifacts on the appearance of UFPs. The vertical profiles of N3−12 show a similar distribution, by means of a general decline of number concentration with growing altitude. However, a higher variability is visible in the vertical between the heights of 150 and 550 m a.s.l., in contrast to the summary when all vertical profiles are considered for the analysis. The same effect is obvious in the vertical profiles of particles with a size larger than 12 nm, indicating a general decrease in the number concentrations with altitude but with higher gradients below the height of 550 m a.s.l., thus mostly in agreement with the vertical pattern of N3−12. The vertical distribution of N300−500 shows minimal number concentrations below 10 cm−3 in the whole altitude range. In comparison with all profiles, the maximum of N300−500 is visible in this graph, as it is significantly reduced to a minimum of 9 cm−3 at the height of 360 m a.s.l. and a maximum of 27 cm−3 at the lowest calculated height of 150 m a.s.l.
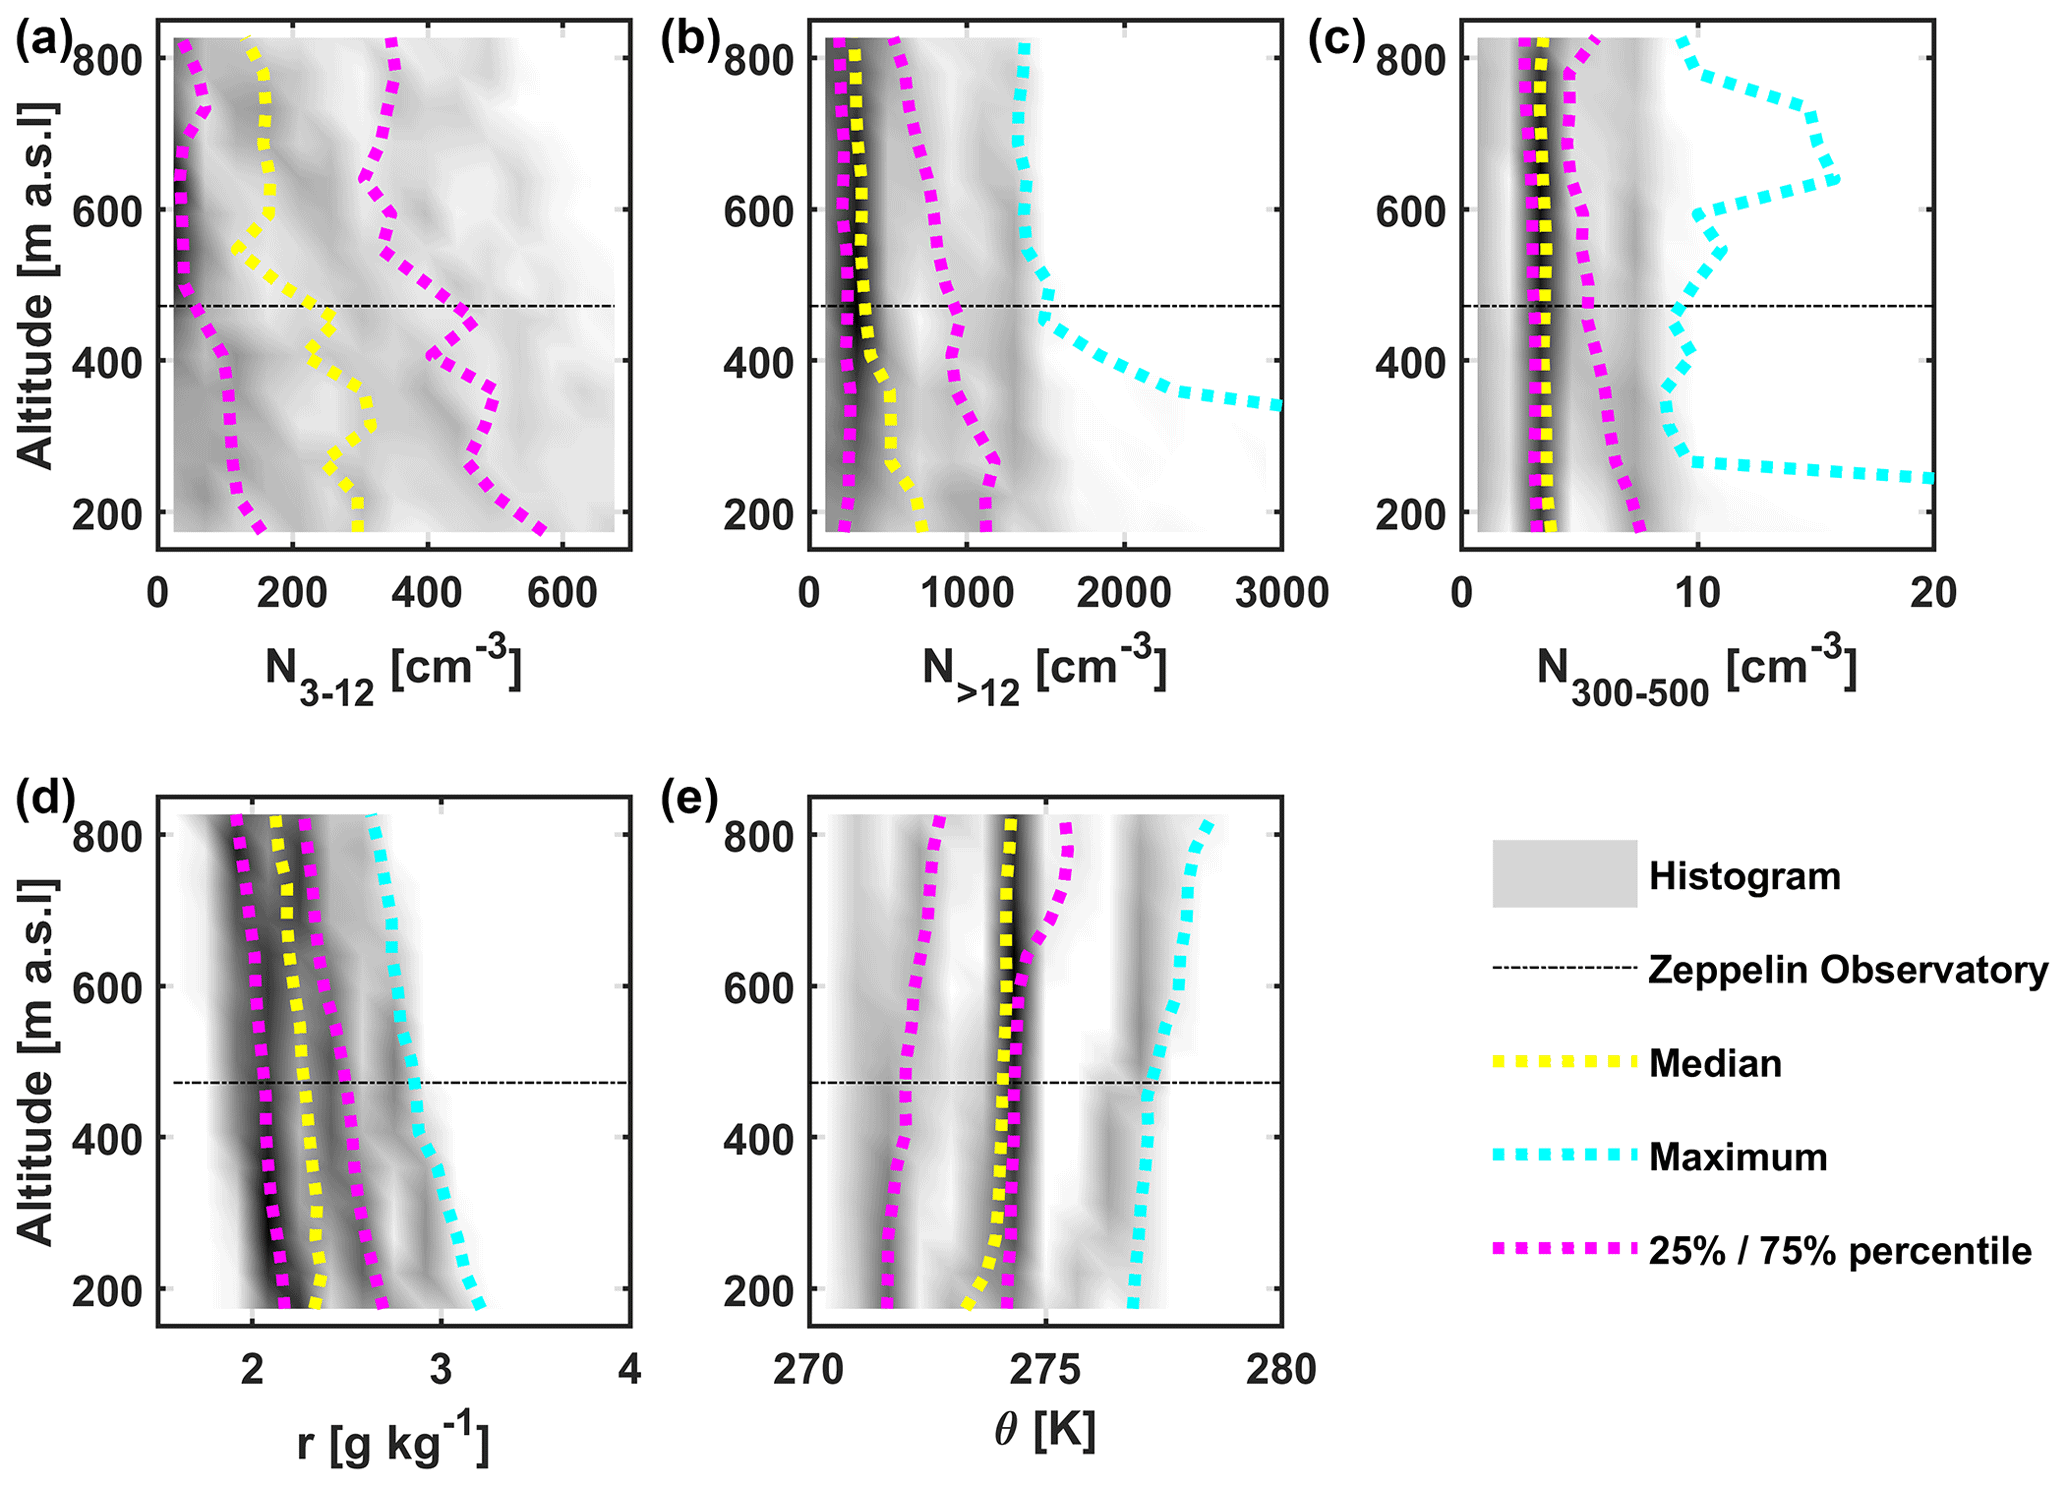
Figure 8The same as discussed in Fig. 7 but with a different chosen criterion for the statistical analysis. Vertical profiles of the parameters are solely considered when they are subject to the condition that UFPs were apparent at both ground-based stations and N3−12 exceeds values of 500 cm−3. The choice was made in order to exclude observations that may correlate with artifacts of the CPCs measurement range.
The vertical distribution of the water vapor mixing ratio r indicates an impact of dryer air masses on the enhanced appearance of UFPs, as the median is reduced in comparison with all profiles, by ranging between 2.1 and 2.4 g kg−1. In addition, the maximum of r decreases as well to 2.6–3.2 g kg−1, which is in agreement with UFPs that occur more frequently during cloud-free phases. The vertical profiles of the potential temperature θ demonstrate stronger gradients of the ABL for the chosen criteria. The median vertical profile of θ displays a generally well-mixed layer except for a pronounced inversion layer in the lowermost 300 m a.s.l. that further coincides with the highest measured UFP concentration and a general marginal accumulation mode at the same altitude.
In principle, and valid for both situations, the vertical distribution of UFPs shows higher number concentrations close to the ground. This corresponds with enhanced moisture near the surface, which can be explained by the fact that the site is directly situated at the coast, which may imply a high potential for local water vapor and other precursor sources originating from the sea. One of the major dominant sources for the measured UFPs may be linked to MSA as a precursor, as recently shown in Beck et al. (2021). In addition, according to the vertical profiles, UFPs occur at the Zeppelin Observatory and even above, meaning that NPF may achieve larger spatial scales and may even exist within the FT. The summary shows a clear impact of the ABL stability on the vertical distribution of UFPs, as the vertical profiles of θ significantly differ by means of a well-mixed ABL (median) for all selected vertical profiles, and more inversion layers are present for taking into account only the NPF days with the chosen NPF criterion. Interestingly, large gradients of UFPs occur in the vertical distribution in both cases in the lowermost 550 m a.s.l, even when a generally well-mixed ABL is apparent. This implies that additional effects, most likely linked to wind shear due to the complex topography, contribute to the high variability of UFPs in the vertical scale. All vertical profiles in Figs. 7–8 indicate discrepancies of the measured parameters between the two ground-based stations, GRU and ZEP, so the question of which of the research sites might be the most representative one for aerosol long-term monitoring at an Arctic coastal site arises.
Here it is important to note that these two graphs were chosen for a general overview, and the results are solely based on observations during the 11 measurement days with ALADINA, when the weather conditions allowed a safe field operation with the UAS. Thus, and based on the fact that a high difference exists in observations between the two ground-based stations, further case studies are discussed in the following sections in more detail in order (1) to better understand the impact of the ABL stability on the aerosol distribution in the vertical scale; (2) to access a likely influence of horizontal effects like wind shear and local sources that may better explain discrepancies at the two different ground-based observations; and (3) to demonstrate the capabilities of ALADINA, which enables additional investigations like studying the amount of accumulation-mode particles with the integrated OPC. For this purpose, specific selected case studies are shown. Case I considers selected vertical profiles of aerosol particles during the end of the Arctic haze period on 24–26 April 2018 (see Sect. 3.3). Case II takes into account horizontal observations of N3−12 on 20 May 2018, where a persistent NPF event was measured on the ground (see Sect. 3.4), and Case III on 23 May 2018 represents a day with ship activity at the port and enhanced local traffic (see Sect. 3.5).
3.3 Case I: sporadic appearance of UFPs during the end of Arctic haze influenced by onshore wind on 26 April 2018
During the first part of the field experiment in April 2018, the aerosol composition was affected by Arctic haze in Ny-Ålesund and was thus influenced by phenomena on regional scales. This can be supported by a clearly enhanced accumulation mode that was apparent at both research sites, as presented in Fig. 5, and by the similar measured number concentrations presented for other Arctic research sites like Alert station in Canada (Abbatt et al., 2019) or at Villum Research Station in Greenland, as shown in Nguyen et al. (2016) and Dall'Osto et al. (2019) during measurements in April of different years. In addition, the 1 h averaged eBC calculated from MAAP as an indicator of air pollution (Fig. 3c) reached the highest values up to 60 ng m−3 during the period of 2–30 April 2018 and then decreased to 5–22 ng m−3; thus, Arctic haze was no longer apparent at the site.
Figure 9 displays four selected vertical profiles of θ, r, N>3 and N300−500 measured with ALADINA between the height of 0–900 m a.s.l. at 18:45 UTC on 24 April 2018 (black line), at 19:20 UTC on 25 April 2018 (green line), and at 13:30 UTC (cyan line) and at 13:58 UTC (blue line) on 26 April 2018. In addition, the calculated horizontal wind direction dd is presented based on two research flights that were performed with MASC-3, which started at 20:00 UTC on 24 April 2018 (black circle) and at 12:52 UTC on 25 April 2018 (cyan circle). For a better orientation, the heights of GRU and ZEP are indicated in the figure as well.
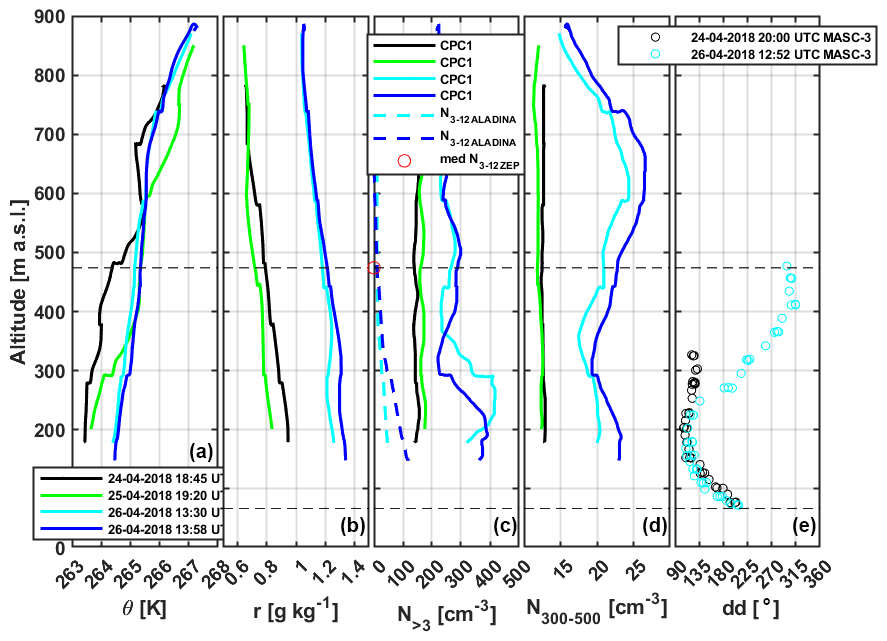
Figure 9Case I: selected vertical profiles measured with the two UASs, ALADINA and MASC-3, between 24 and 26 April 2018. (a) Potential temperature θ in kelvin (K), (b) water vapor mixing ratio r in grams per kilogram (g kg−1), (c) aerosol particle number concentration in particles per cubic centimeter (cm−3) of different sizes N>3, N3−12, and (d) N300−500 measured with ALADINA (solid lines) and (e) horizontal wind direction dd in degree estimated along with measurement flights of MASC-3 (circles). For a comparison, the median concentration of N3−12 ZEP is shown (red circle), averaged for the same time period of the ALADINA profiles.
The ABL shows multilayer structures which are visible in all four different vertical profiles of θ but are most pronounced during the second profile on 25 April 2018, where two distinguished inversion layers are present at the two height levels of 300 and 600 m a.s.l., respectively. In general, the water vapor mixing ratio r reached marginal values, but the effect of local maritime air, which was advected from the coast, is visible to a small degree in the vertical distribution in terms of enhanced values of r close to the ground, which decreases with altitude. The aerosol particle number concentration measured with the CPC1 in sizes between 3 and 1 µm (N>3) shows two main layers in the vertical scale. Low number concentrations of around 150 cm−3 were observed on 24 April 2018 as well as on 25 April 2018. In contrast to those observations, enhanced number concentrations were visible in the lowermost 360 m a.s.l., with a maximum of 400 cm−3 at 13:30 UTC on 26 April 2018. N3−12 was not detectable with ALADINA between 24 April 2018 (dashed cyan line) and 25 April 2018 (dashed blue line) but occurred to a small degree below the specified inversion layer at around 300 m a.s.l. and was enhanced in lower altitudes reaching maxima of 50 and 120 cm−3 at the height of 150 m a.s.l. on 26 April 2018, assuming a weak local source for UFPs that originated from the surface. However, due to the existence of the inversion layer, mixing was suppressed. The general low appearance of N3−12 coincides with the observations of the nano-SMPS (Fig. 3d) in terms of the same particle size and for the measurement period. However, the situation changed during the day, when N3−12 occurred more frequently but still on a sporadic pace along with low-level clouds and wind direction from SW on the ground but disappeared completely at midnight. According to the vertical patterns of wind direction dd, wind shear is visible on 24 and 25 April 2018, changing from SE to E between the height of GRU and the height of 200 m a.s.l., and four wind regimes existed on 26 April 2018, further influenced by a shift from E to NNW within the altitude range between GRU and ZEP. Projecting the current wind direction to the topography, the calculated horizontal wind indicates in the vertical scale an origin from Mount Zeppelin between the surface and up to the height of around 150–200 m a.s.l., where the wind direction merged to onshore wind with a wind direction of SE, and this wind regime coincided with higher number concentrations of N3−12. Between the height of 250 and 400 m a.s.l., the wind turned to offshore wind, in accordance with a decrease in N3−12 in the vertical pattern. Above 400 m a.s.l., the fourth wind regime was identified, which originated from the water but upwards from the fjord in the NW direction along with an enhancement of N300−500, which is, however, only lifted upwards from the inversion layer in the higher-altitude region, leading to the assumption of a high degree of sea salt aerosol that was measured within the particle size of 300 to 500 nm.
To sum up the findings based on the vertical profiles shown here, the vertical distribution of aerosol particles was strongly connected to ABL properties. In particular, gradients with enhanced and locally confined concentrations were linked to the ABL stability and were significantly affected by the current wind field. In addition, UFPs tended to occur during the end phase of Arctic haze with only low concentrations and solely sporadically on short temporal intervals (see Figs. 3 and 4) without any subsequent growth of the particles. This could be related to the existence of the high pre-population of larger particles that suppressed NPF most likely due to altered polluted emissions that were transported to the site. However, this case study considers observations of number concentrations with a few hundred per cubic centimeter and lower; thus, the aerosol sensors of ALADINA worked on their detection limits. The low UFP concentrations are confirmed by the UFPs measured sporadically at ZEP (see Fig. 3d) as well.
3.4 Case II: high variability of the horizontal distribution of UFPs observed during nucleation on 20 May 2018
Figure 10 shows the horizontal distribution of N3−12, scattered above a satellite image. The flight legs were performed at three different constant altitudes (marked in white and from left to right: 173–192, 314–334 and 458–478 m a.s.l.) during four measurement flights (from top to bottom) with ALADINA between a period from 11:44 to 14:34 UTC on 20 May 2018. Each flight pattern (black line) consists of legs that cross the coast in the direction from the airport to the sea – a full operation above open water by heading SE with a distance of around 2 km. The turnaround from the sea back to the airfield is used for achieving the next altitude level; thus, this part is not considered for the study as the variability may be attributed to changes in the altitude.
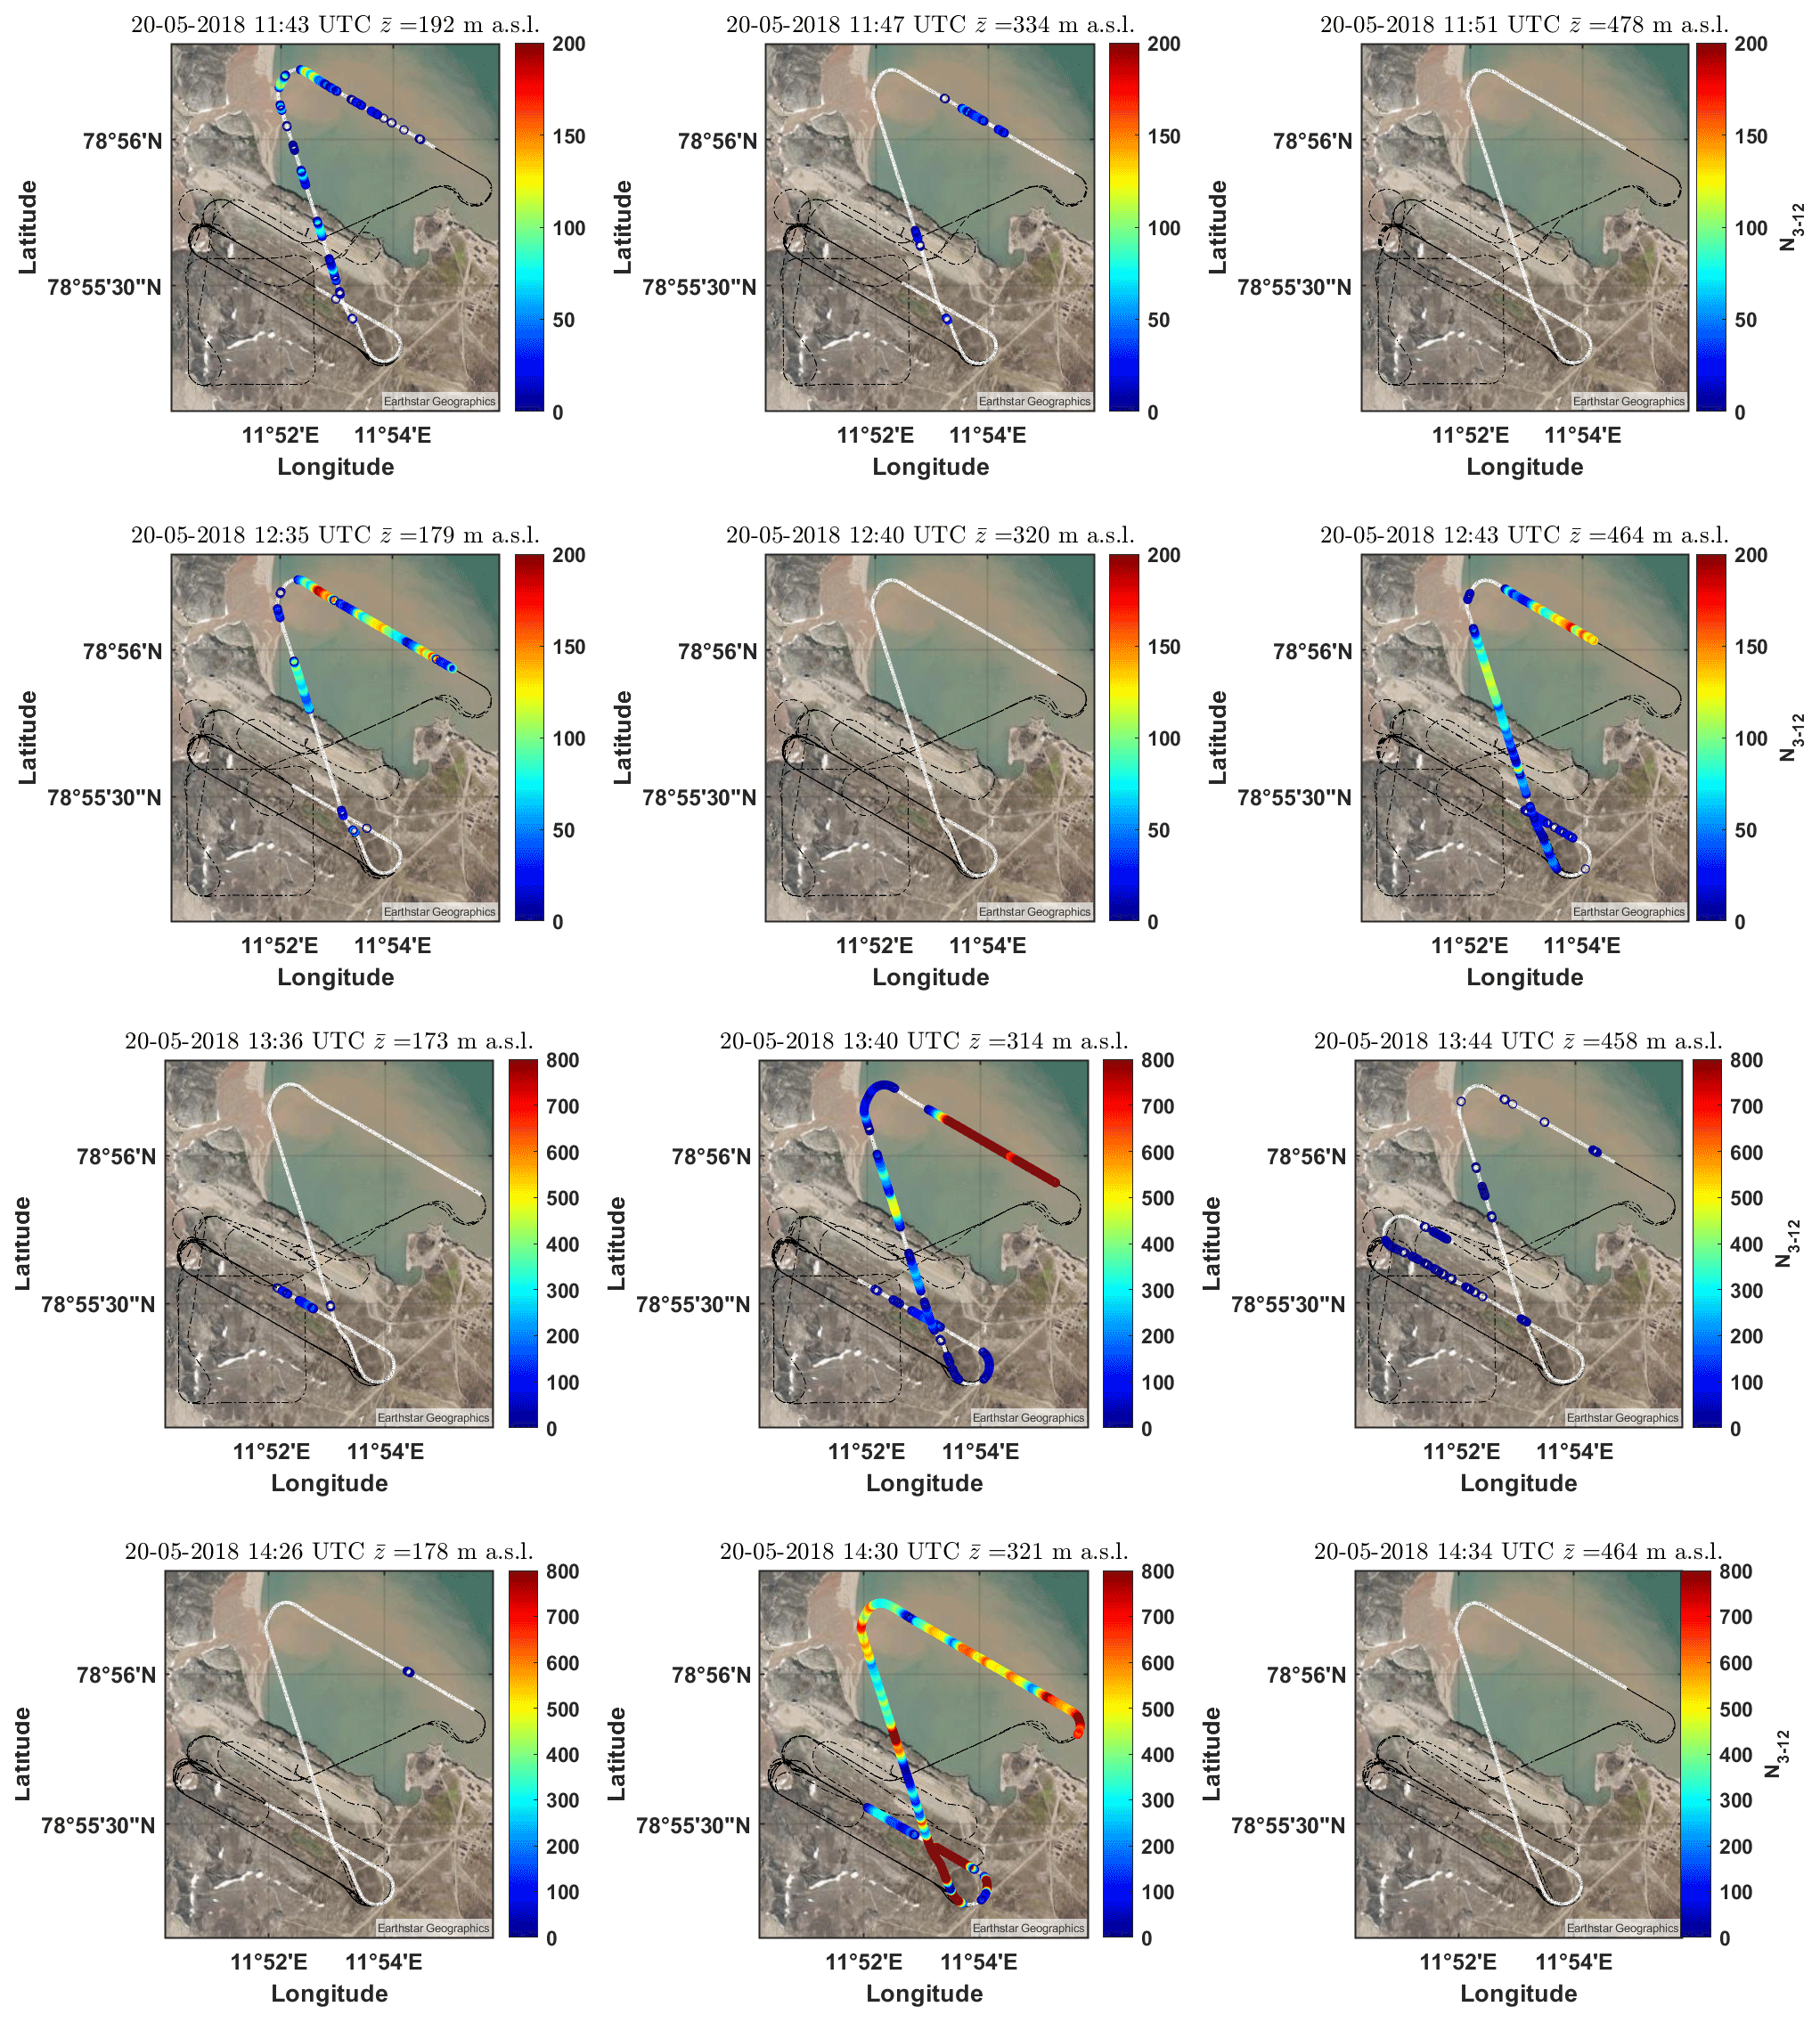
Figure 10Case II: horizontal distribution of N3−12 observed during four (out of five) research flights that were carried out with ALADINA on 20 May 2018. The horizontal legs were obtained at three different altitude levels, directed from the airport to the sea (SE to NW), above the sea heading E and coming back to the airfield. The color bar ranges from 0 (blue) to 200 cm−3 (red) for the first and second flight and is enhanced to a maximum of 800 cm−3 for the third and fourth research flights. Source of the satellite image: Earthstar Geographics.
This day was chosen for analyses as the research flights were performed continuously when nucleation mode appeared at GRU with an ongoing subsequent growth rate which started at around 12:00 UTC (Fig. 6). At 11:43 UTC, an enhanced aerosol particle number concentration of N3−12 occurred near the coast and above the sea at the mean altitude of 192 m a.s.l. with minimal concentrations of 50–120 particles cm−3. Several minutes later, on the same horizontal scale but at a mean height of 334 m a.s.l., N3−12 reached marginal number concentrations, and no UFPs were visible at the higher altitude range of 478 m a.s.l, which is almost the same height level as Mount Zeppelin. According to the vertical profiles of θ (Fig. A5), the ABL was stably stratified below Mount Zeppelin, so a mixing of particles up to the FT was not possible. This implies that the occurrence of N3−12 most likely originates close to the ground with the main source coming from the sea, and a further mixing is prevented in upper parts of the ABL due to stable conditions. The situation changes at midday, when N3−12 is apparent at the lowest altitude of 179 m a.s.l., with the highest number concentrations of more than 200 cm−3 above the sea. At 12:40 UTC, N3−12 disappears at the height of around 320 m a.s.l. and arises with high variability of the measured number concentrations at the height of 464 m a.s.l. with pronounced concentrations above the open water. In the afternoon at 13:36 UTC, only a few particles were detected at the height level of 173 m a.s.l., but the number concentration increased significantly to more than 800 cm−3 at the upper height of 314 m a.s.l. at 13:40 UTC, and UFPs disappeared at the height of 458 m a.s.l. Interestingly, the spatial distribution of UFPs is similar almost 1 h later, but the total number concentration shows a higher variability in the horizontal scale at the height of 321 m a.s.l., indicating either a transport of UFPs coming from the coast in direction to the village of Ny-Ålesund or a second local hot spot that initiated the sporadic occurrence of UFPs.
In general, the horizontal investigation of N3−12 indicates a high variability in the selected altitude regions that could not be identified by solely taking into account ground-based observations. A more frequent appearance of UFPs is visible above the sea in comparison with a generally lower measured number concentration above land and close to the airport. However, this was the opposite during the last research flight on this day, when N3−12 showed the highest concentration near the village. In addition, it was verified that N3−12 is strongly related to the ABL stability, so different layers of UFPs may have coexisted at specific altitude levels as a result of prohibited vertical mixing within the ABL. Rapid changes, like wind shear on a small spatial scale, may indicate a high impact of the topography, so UFPs have been transported to the site but most likely originated elsewhere and existed for longer periods within locally confined vertical altitude ranges.
3.5 Case III: polluted local emissions as a source for UFPs on 23 May 2018
This case study considers observations during a day with enhanced local pollution that was emitted at the port by ship and car traffic as a result of enhanced logistical activity in comparison with other days when no supply was delivered to the port. The hypothesis of potential anthropogenic emissions can be verified by the increase in eBC based on the MAAP observations in the morning hours, shown in Fig. 4. A maximum of 24 ng m−3 eBC was measured at around noon and then eBC decreased on a rapid temporal scale to 10 ng m−3 eBC in the afternoon. Interestingly, the enhanced eBC coincided with a sporadic occurrence of UFPs that was measured at both research sites at the same time (see Fig. 6). However, the observed UFPs did not grow to larger particle sizes; instead they disappeared in the afternoon when snow fall was apparent at the measurement site, which can be further seen by the significant decrease in the cloud top base (see Fig. 4). Figure 11 shows the horizontal distribution of N3−12 during the morning hours when the supply was delivered to the site. During the first and second flight, low concentrations of N3−12 were measured in all three different altitude levels, but the concentrations increased when the UAS was heading to the village and port. Higher concentrations of N3−12 were observed during the third flight, here shown along patterns in three different altitudes between 10:31 and 10:39 UTC. The values exceed 400 cm−3 with the main origin from the village. Thus, UFPs may be released from polluted emissions via ship and car traffic at this site.
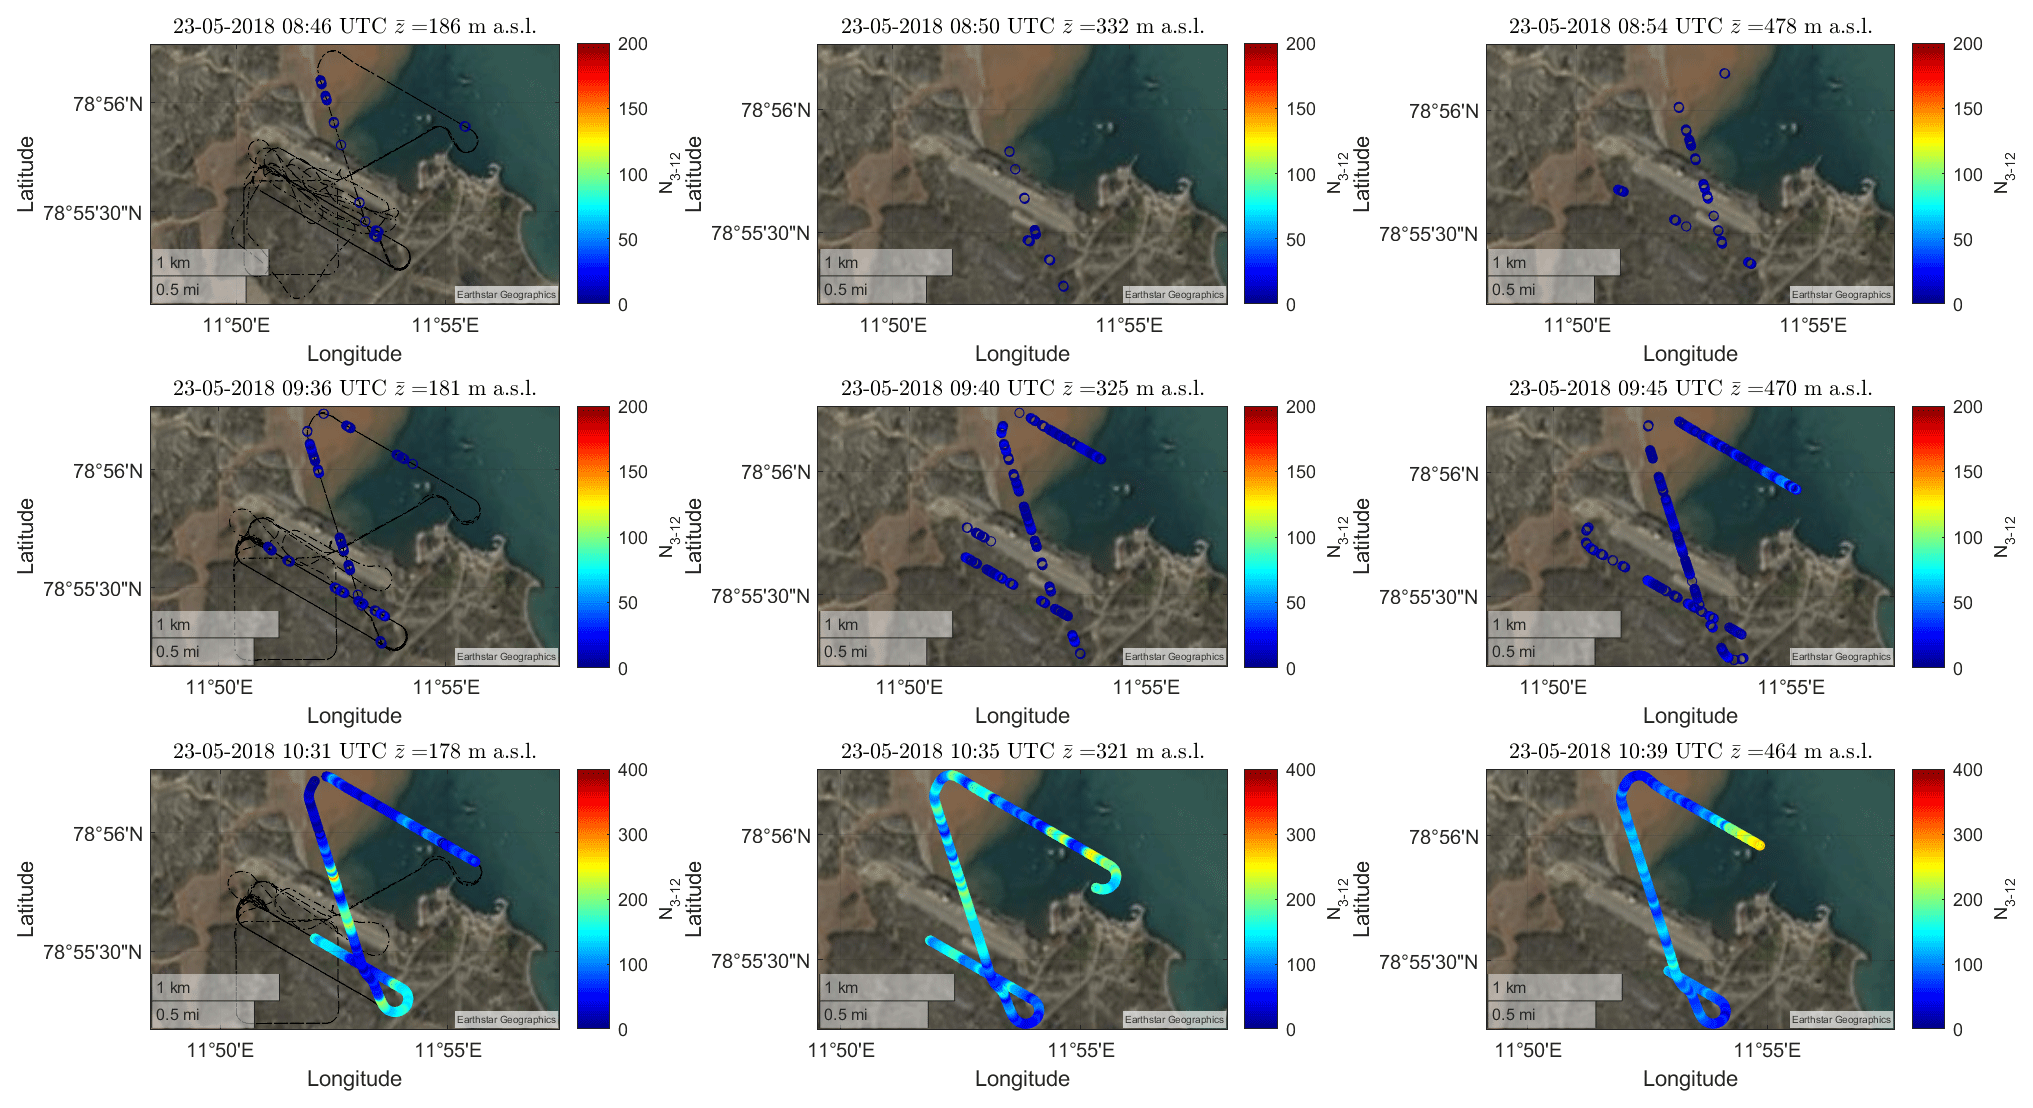
Figure 11Case III: horizontal distribution of N3−12 measured during three (out of six) research flights at three different altitudes between 08:46 and 10:39 UTC on 23 May 2018. The color bar ranges from 0 (blue) to 200 cm−3 as well as up to 400 cm−3 (red) during the last flight presented here. Source of the satellite image: Earthstar Geographics.
The main findings of the performed UAS field experiment are briefly summarized before finally concluding the study in Sect. 4.
-
The study presents a unique data set of aerosol particles and meteorological parameters in the spatial scale, measured with the two UASs, ALADINA and MASC-3, which are linked to long-term measurements of aerosol particles observed at two different altitudes.
-
The integrated setup of ALADINA allows us to investigate different sizes of aerosols, ranging from UFPs to accumulation mode, thus providing a high potential of covering the spatial distribution of different phenomena like sources of NPF, mixing and transport of UFPs, and the distribution of larger particles that may have been transported to the site via long-range transport, for instance within the Arctic haze period.
-
Within the UAS period, UFPs occurred frequently in Ny-Ålesund but mainly over a short period of time, and these days would not have been identified as NPF events if surface measurements were taken into account alone. By considering the summary of all performed vertical profiles of UFPs, the highest number concentrations appeared near the ground and were strongly affected by a stably stratified ABL. In cases where UFPs were observed at both research stations, accumulation-mode particles played only a minor role in the aerosol population, thus leading to the assumption that during the start of the UAS period, when the Arctic haze was in the last phase, the large pre-population of accumulation-mode particles inhibited the particles’ growth.
-
By reflecting the measured potential temperature and mixing ratio in the vertical scale, ABL properties play a crucial role in the vertical distribution of aerosols, so the observations at Gruvebadet differ in many cases from the measurements at Mount Zeppelin.
-
Other case studies show that UFPs can coexist at different altitudes as a result of a stably stratified ABL, which was further supported by investigations of a high variability of UFPs in the horizontal scale.
The two UASs, ALADINA and MASC-3, were used for studying atmospheric properties and aerosol particle spatial distributions at the research area of Ny-Ålesund during the melting season between 24 April and 25 May 2018. In total, 49 research flights were carried out on 11 measurement days with ALADINA to investigate the horizontal and vertical distribution of aerosol particles between the ground and up to a maximum height of 850 m a.g.l., which led to 230 vertical profiles during the flight period. MASC-3 was used to analyze the wind field and was operated in parallel during 6 common measurement days. This article provides an overview of the campaign and the ensemble of flights. The results presented here focus on the vertical distribution of the measured atmospheric parameters of potential temperature, water vapor mixing ratio and aerosol particles, ranging from the nucleation mode of UFPs with a size between 3 and 12 nm to the accumulation mode with particles larger than 300 nm. The vertical profiles were linked to continuously measured time series of aerosol size distribution derived from the two research sites which are deployed for long-term measurements at different altitudes in order to provide a 4-D picture of aerosol properties. In general, high discrepancies of the UFP concentration were observed between the two research sites, assuming a large impact of the ABL dynamics on the occurrence by means of transport of UFPs.
On 26 April 2018 and during the Arctic haze period, the vertical distribution of aerosol particles was significantly affected by wind shear, which mainly results from the complex terrain of the investigation area. With MASC-3, horizontal flight legs were performed near Ny-Ålesund above land and above open-water areas from the Kongsfjord in order to link between transport of UFPs. Here it is obvious that UFPs existed over short period of time and were connected to onshore wind, thus assuming biological activity from the open water as a main contributor for the origin of UFPs. On 19–21 May 2018, the highest number concentrations of N3−12 were observed in relation to a persistent inversion layer that existed within the altitude area. Further, the appearance of UFPs was a wide-spreading event reaching the whole investigation altitude. However, a clear source could not be identified, as the formation process had already started during the airborne experiment. In addition, on 23 May 2018, UFPs were solely observed below the altitude of the Zeppelin Observatory during a day affected by local traffic, which coincided with an increase in eBC since the morning hours. For validation, the airborne eBC data were compared with ZEP and were, however, not in a good agreement, reaching an overestimation of up to 8 times in comparison with fixed point data at the similar altitude. This in turn is not an artifact; the only reasonable explanation for this is linked to low background aerosol concentration; thus, the AE51 was working within the detection limit and is not a feasible tool for operations in a generally clean environment.
To conclude, this study may help to address fundamental open questions based on the feature of the shown spatial distribution of aerosol particles and the correlation with ABL properties. For instance, at which altitude does NPF take place? However, this question cannot be directly answered, as according to the vertical profiles of the measured UFPs, a clear typical height could not be identified, as UFPs were observed on the ground but to a greater extent also within all studied altitudes. During some event on 1 May 2018, UFPs occurred at ZEP before they were measured on the ground; thus, a mixture of transport and entrainment might play a dominant role in the appearance of UFPs at the measurement site as well. Nevertheless, a trend in which UFPs are more enhanced close to the ground can be seen, thus leading to the assumption of a high potential of local sources, most likely linked to the open sea, but it cannot be ruled out that sea ice melt was another trigger for NPF as well. Considering the shown horizontal variability of UFPs, it seems that UFPs are restricted to at least some hot spot but can coexist in different altitude levels as well. Thus, ABL properties have a significant influence on the vertical and horizontal distribution, but it cannot be excluded that other sources were present simultaneously during the period, and this cannot be investigated in detail in a limited area of a few square kilometers (km2).
Altogether, the use of uncrewed aerial systems leads to new opportunities to investigate small-scale variability, relate aerosol distributions to local atmospheric dynamics and connect observation sites. Besides process understanding, the data sets are urgently needed for validating high-resolution simulations for complex terrain in order to transfer results to different sites and derive larger-scale impact.
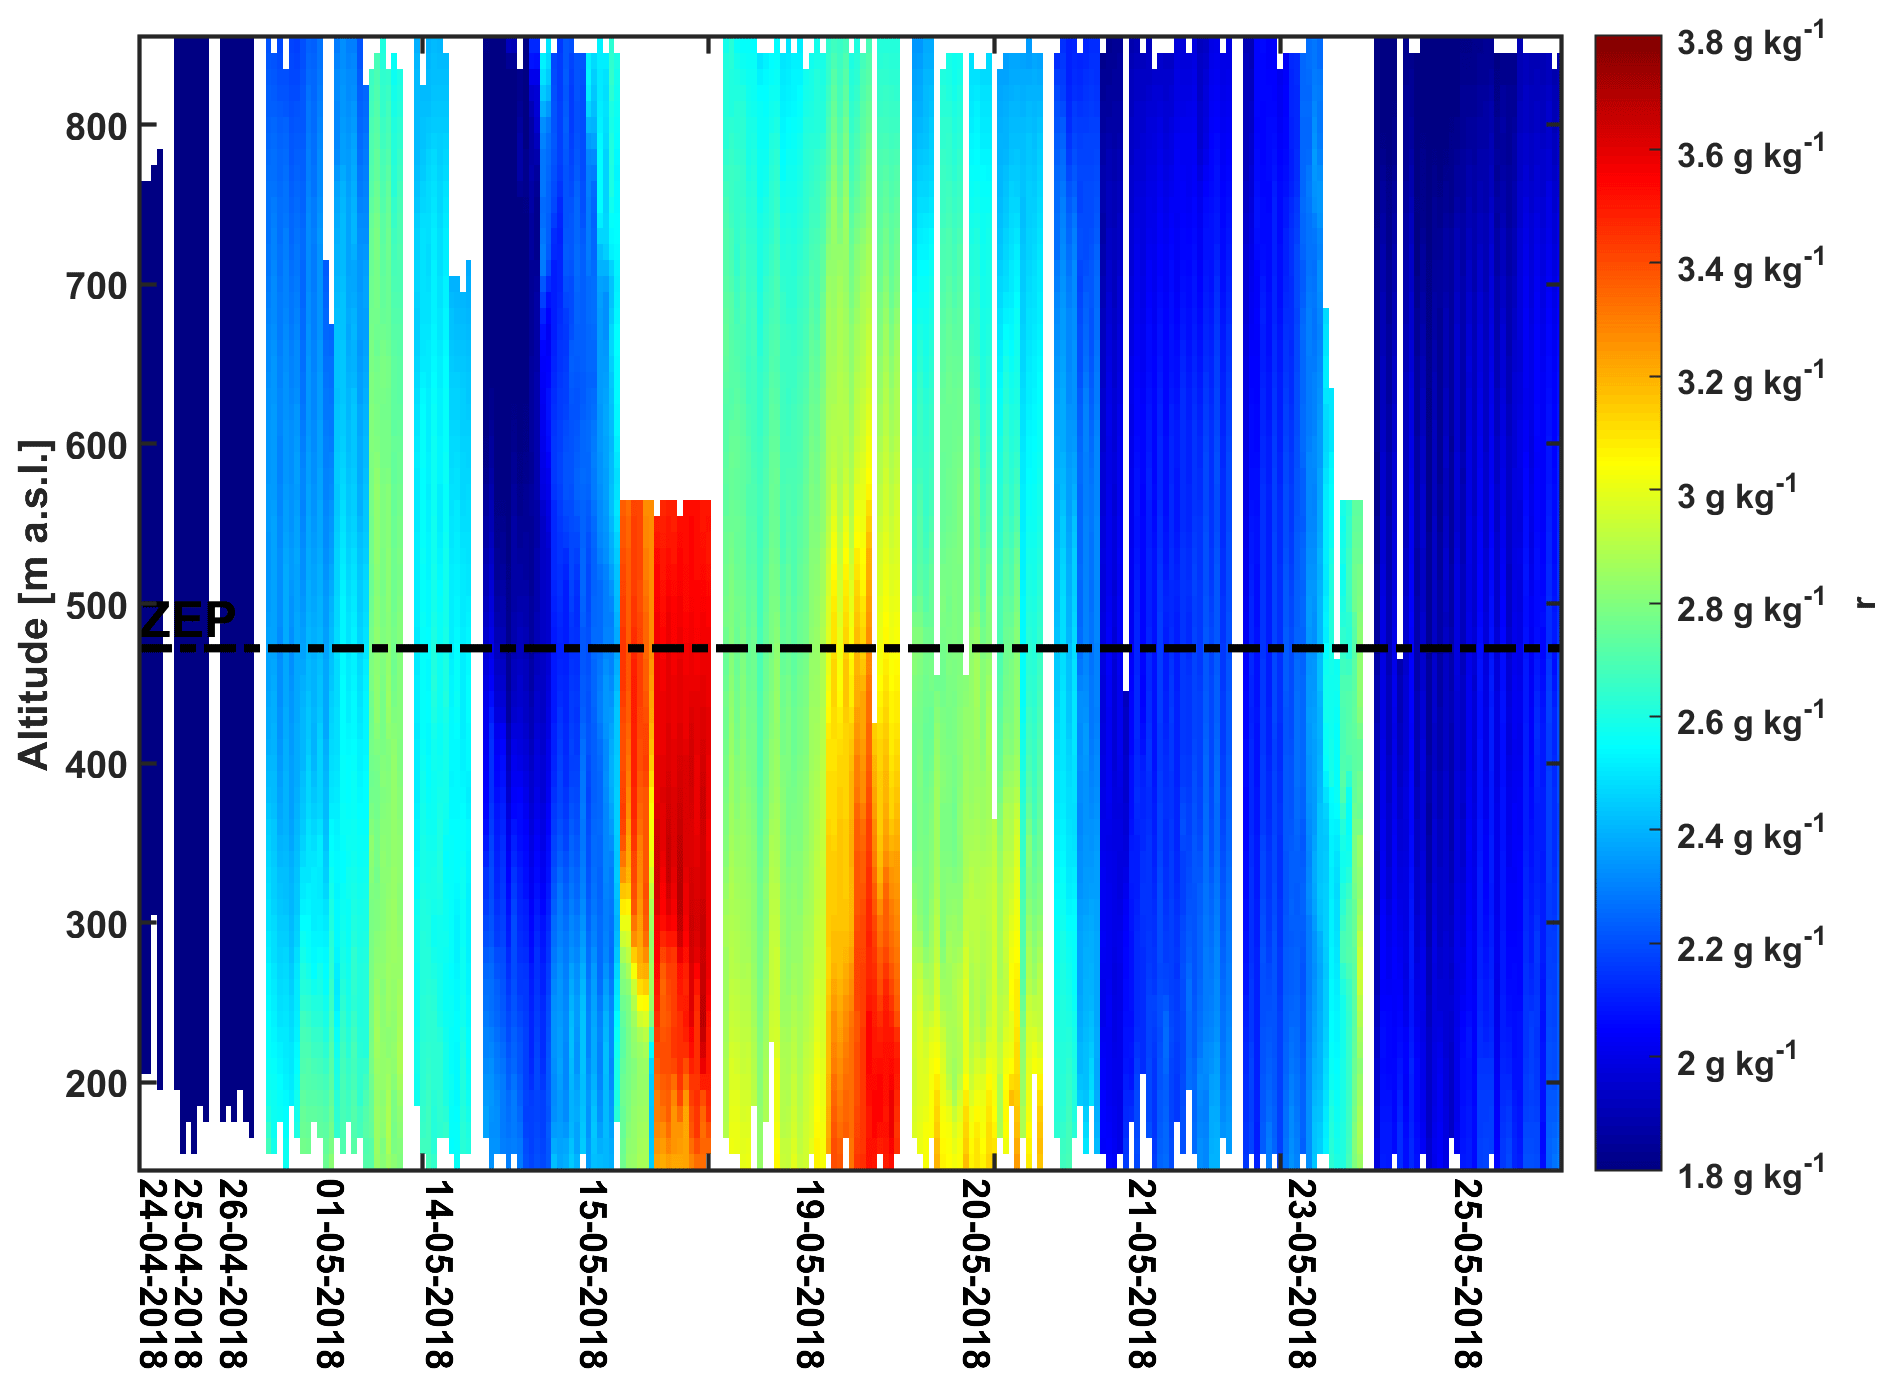
Figures A1–A6 display the time series of the measured vertical profiles at the altitude range of selected parameters of 150 to 850 m a.s.l. during the whole investigation period. The color bar is indicated in the respective individual graphs. The authors intended to provide those figures in order to allow a better reproducibility of the outcome of the analyses represented by the normalized histograms, shown in Figs. 7 and 8.
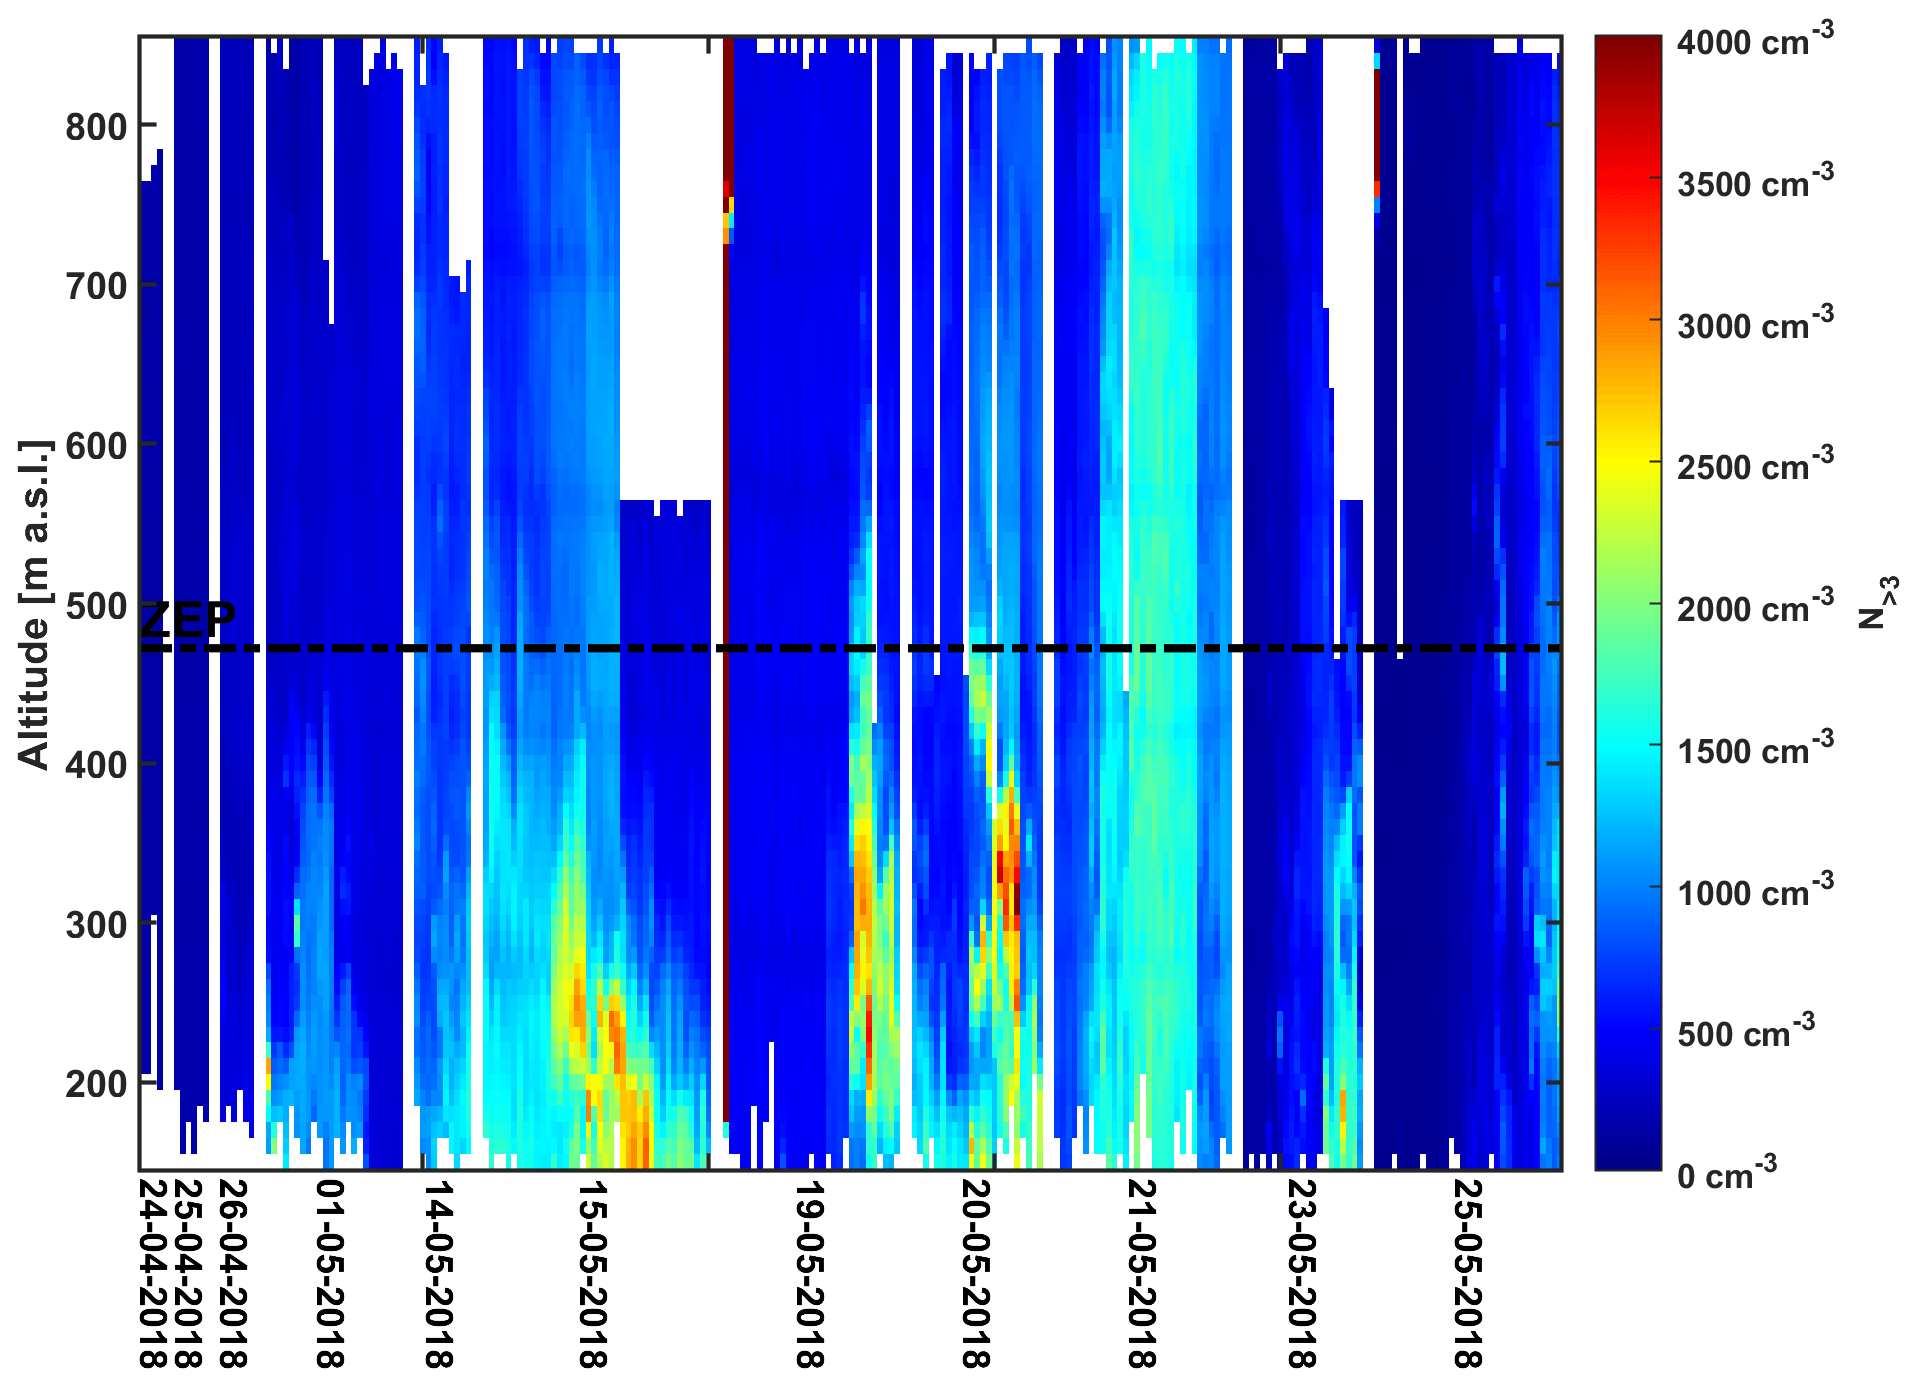
Figure A1Time series of 230 vertical profiles of aerosol particle number concentration measured with CPC1 in particles per cubic centimeter (cm−3) for sizes between 3 nm and 1 µm (N>3) on ALADINA in Ny-Ålesund between 24 April and 25 May 2018. The color bar ranges from 0 cm−3 (blue) to 4000 cm−3 (red). The dashed black line represents the height of the Zeppelin Observatory (ZEP). Additional information: the analyses presented in Figs. 7–8 are subject to the profiles shown here in terms of normalized histograms.
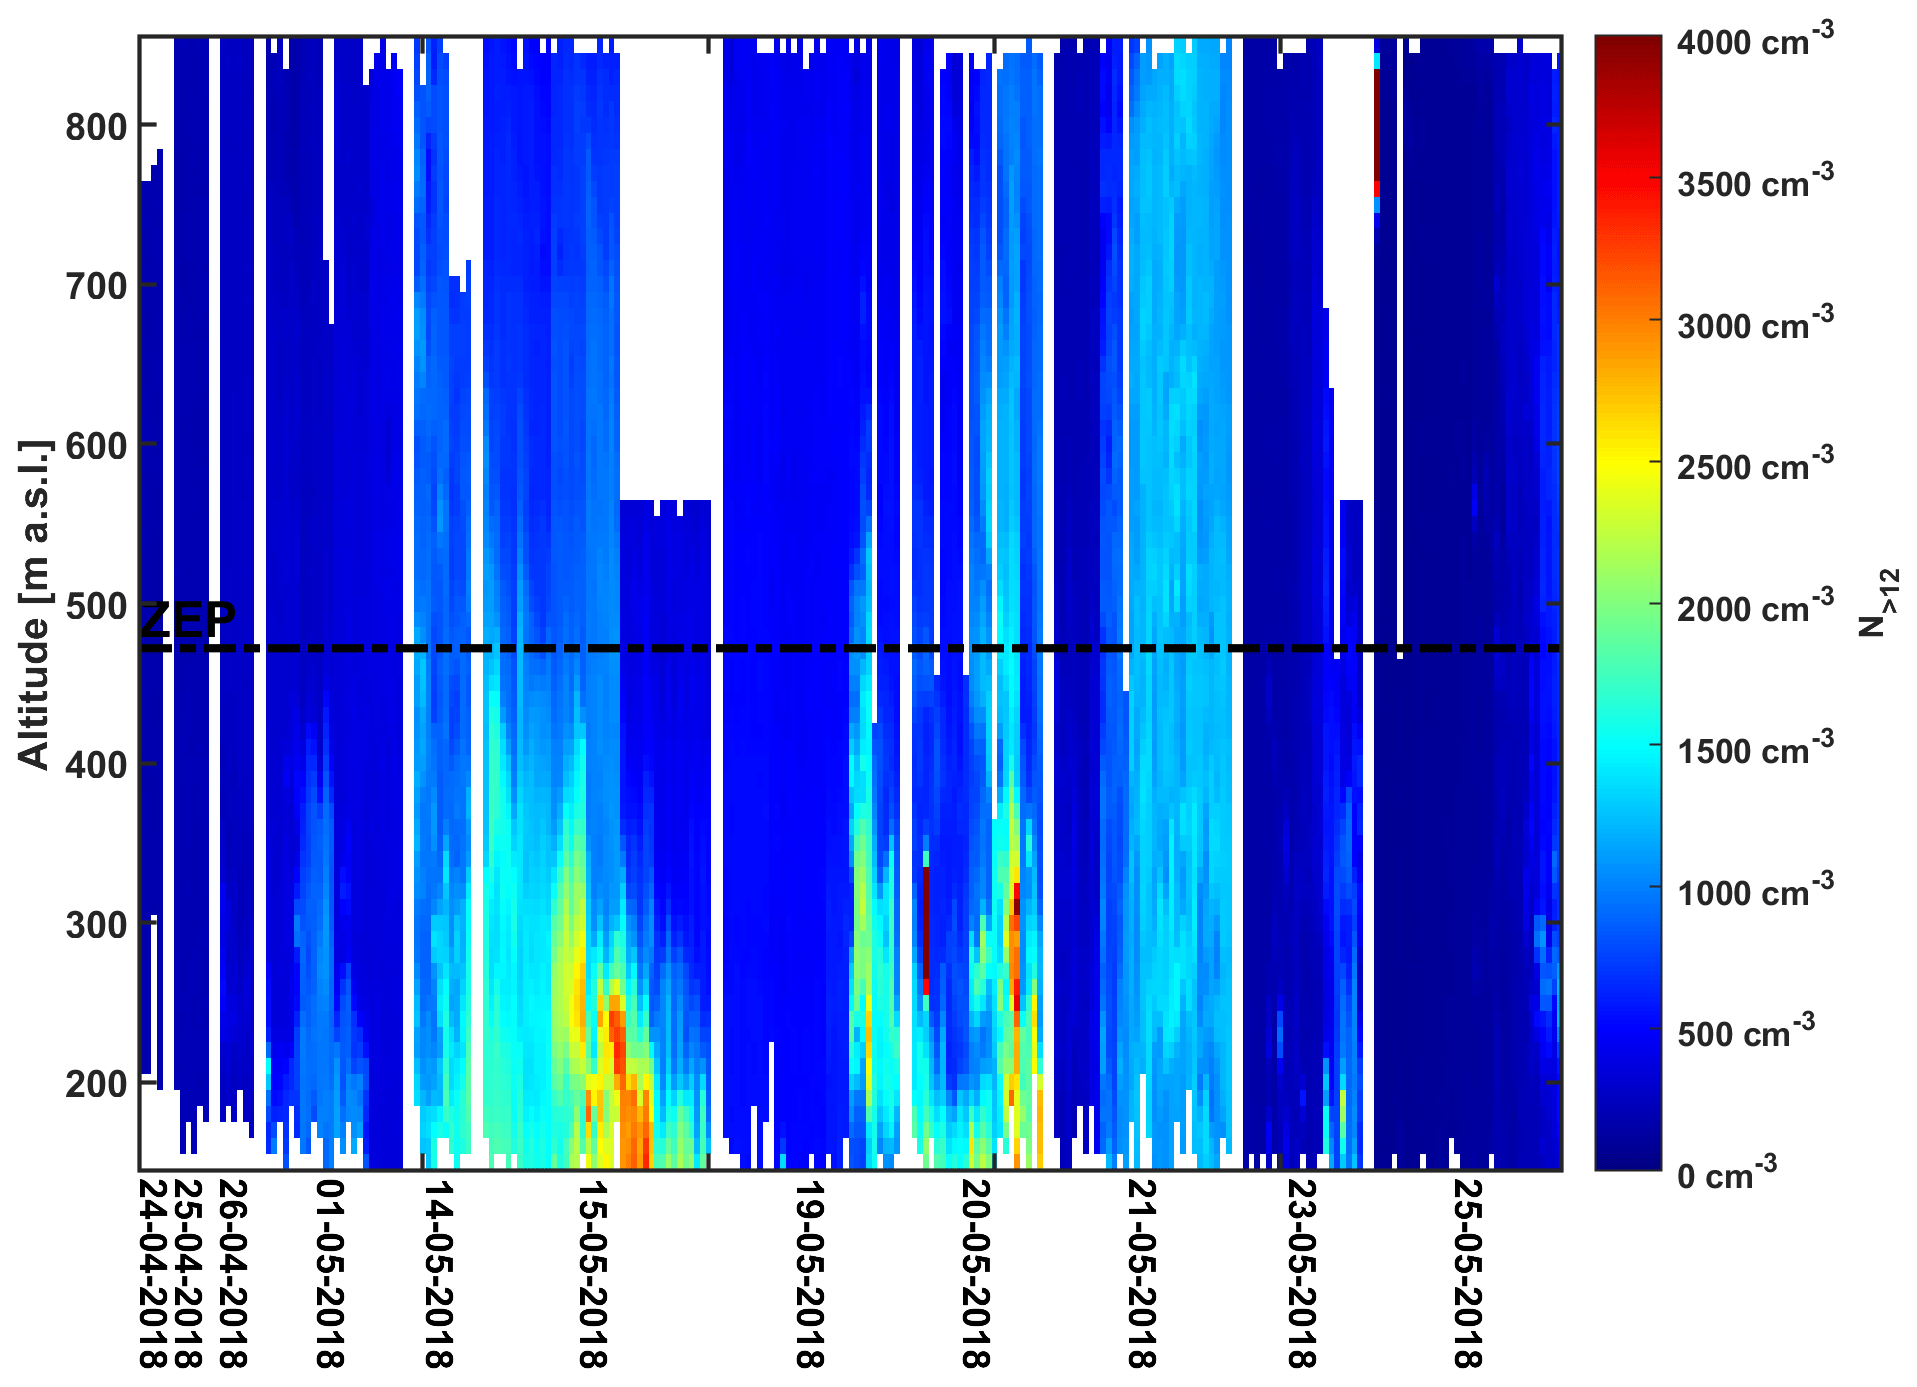
Figure A2The same as Fig. A1 but for time series of the vertical profiles of aerosol particle number concentration measured with CPC2 in particles per cubic centimeter (cm−3) for sizes between 12 nm and 1 µm (N>12) on ALADINA in Ny-Ålesund between 24 April and 25 May 2018. The color bar ranges from 0 cm−3 (blue) to 4000 cm−3 (red).
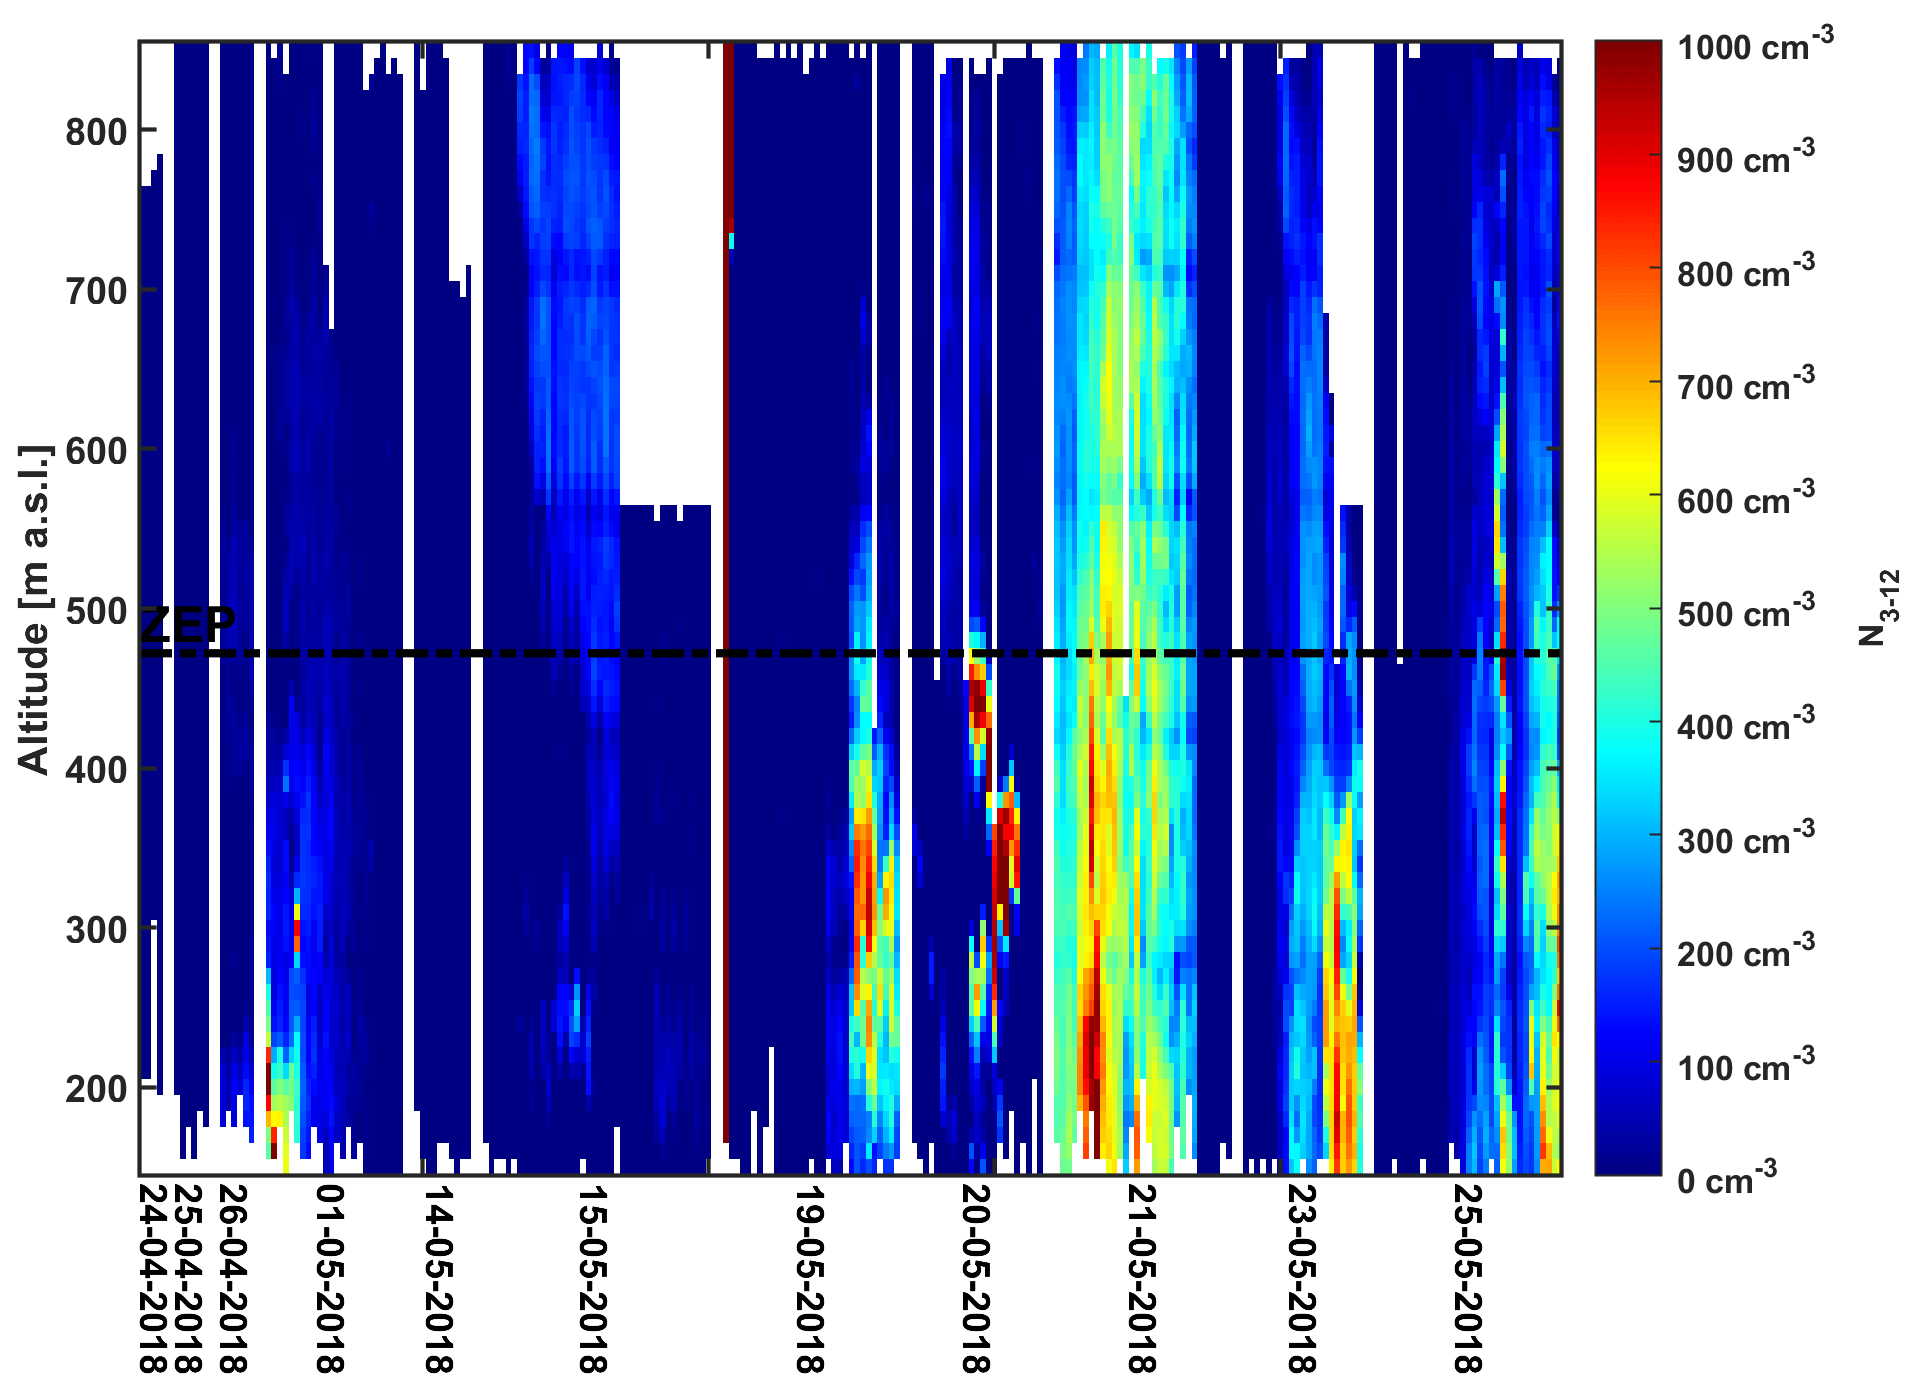
Figure A3The same as Fig. A1 but for time series of vertical profiles of aerosol particle number concentration calculated from the difference between CPC1 and CPC2 in particles per cubic centimeter (cm−3) for sizes between 3 and 12 nm (N3−12) on ALADINA in Ny-Ålesund between 24 April and 25 May 2018. The color bar ranges from 0 cm−3 (blue) to 1000 cm−3 (red).
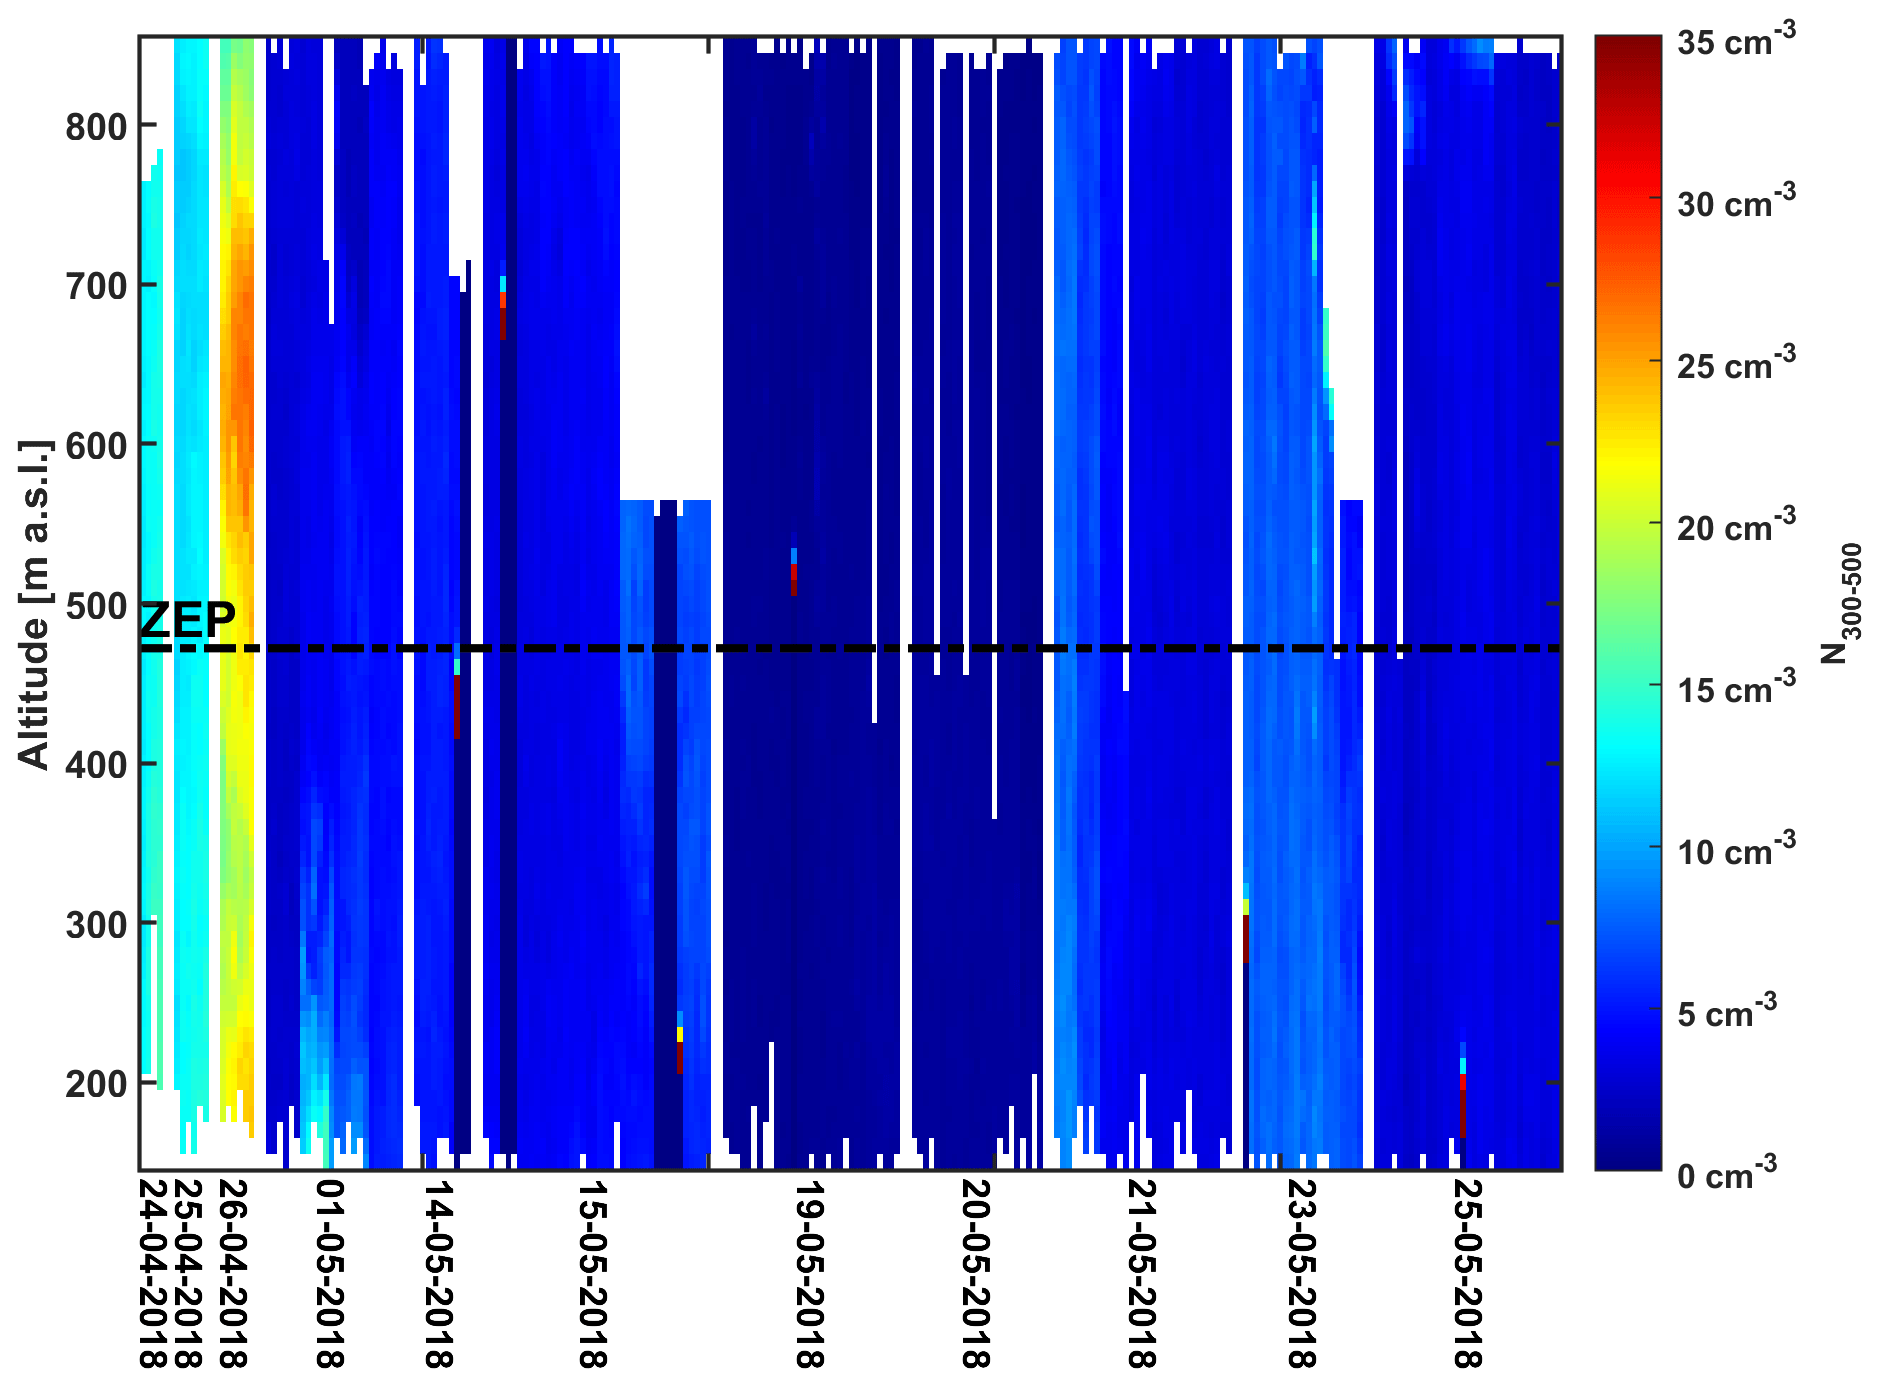
Figure A4The same as Fig. A1 but here for vertical profiles of aerosol particle number concentration measured with the first channel of the OPC within the size of 300 and 500 nm (N300−500) in particles per cubic centimeter (cm−3) on ALADINA during the field period in Ny-Ålesund between 24 April and 25 May 2018. The color bar ranges from 0 cm−3 (blue) to 35 cm−3 (red). The other channels of the OPC are not considered for the study shown here, as the number concentrations larger than 500 nm were out of the detection limit.
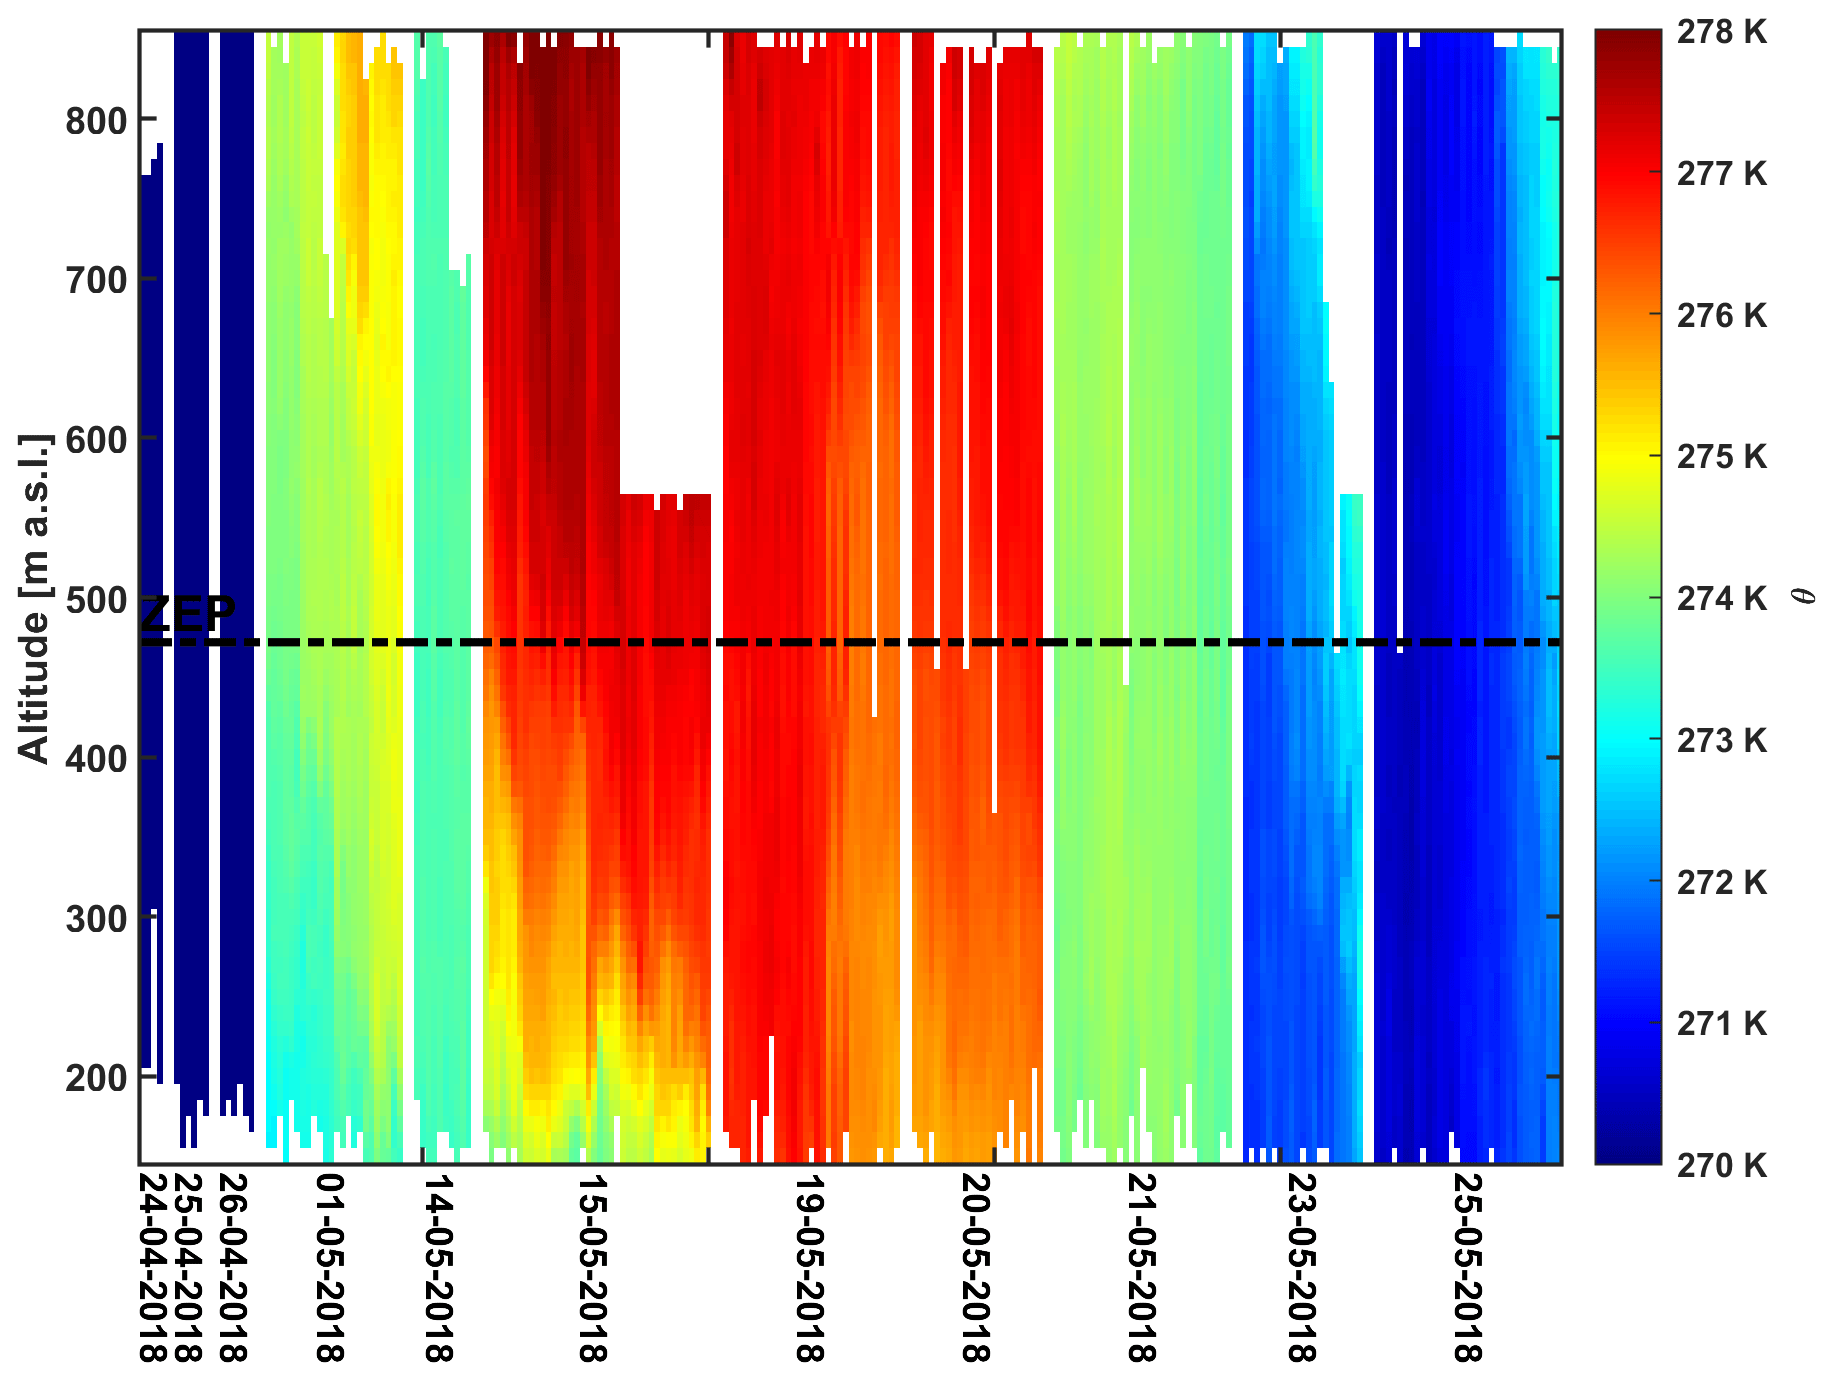
Figure A5The same as Fig. A1 but here for vertical profiles of potential temperature θ in kelvin (K) measured with ALADINA in Ny-Ålesund between 24 April and 25 May 2018. The color bar ranges from 270 K (blue) to 278 K−3 (red).
The UAS and AWIPEV data are publicly accessible from PANGAEA: ALADINA at https://doi.org/10.1594/PANGAEA.947132 (Harm-Altstädter et al., 2022); MASC-3 at https://doi.org/10.1594/PANGAEA.946961 (Schön et al., 2022b); and ground-based meteorology observations at https://doi.org/10.1594/PANGAEA.894667 (Maturilli, 2018a), https://doi.org/10.1594/PANGAEA.894668 (Maturilli, 2018b), https://doi.org/10.1594/PANGAEA.892411 (Maturilli, 2018c) and https://doi.org/10.1594/PANGAEA.892413 (Maturilli, 2018d). SMPS data from GRU are available upon request to Mauro Mazzola (mauro.mazzola@cnr.it) or Rita Traversi. Contact Radovan Krejci (radovan.krejci@aces.su.se) for MAAP and DMPS data from ZEP and Kihong Park (kpark@gist.ac.kr) for nano-SMPS data from ZEP.
AL, BW and JB initiated the project. LB, RK, FP, KB and AP prepared ALADINA for the polar field activity, including calibration of aerosol sensors, setting up the new design and sensor development. KB, FP and LB were responsible for planning the flight strategy, data acquisition and post-processing of ALADINA. BHA, KB, MS, BW, JB, LB, RK and AP participated in the field campaign and collected data. BHA, AL and BW analyzed and interpreted the data and contributed to text. KB, BHA and MS contributed to the figures. RKR provided DMPS and MAAP data, MM and RT handed over SMPS data from Gruvebadet, and KP sent nano-SMPS data. BHA wrote the main text, and all authors reviewed the manuscript.
The contact author has declared that none of the authors has any competing interests.
Publisher’s note: Copernicus Publications remains neutral with regard to jurisdictional claims made in the text, published maps, institutional affiliations, or any other geographical representation in this paper. While Copernicus Publications makes every effort to include appropriate place names, the final responsibility lies with the authors.
We thank Markus Hermmann from TROPOS for his help in setting up the aerosol instrumentation in ALADINA. The authors gratefully acknowledge Roland Neuber and Christoph Ritter from the Alfred Wegener Institute (AWI) for their support during the preparation of the field campaign. We thank the AWIPEV base and crew for hosting the participants and in particular Piotr Kupiszewski and Rudolf Denkmann for valuable assistance at the site. We extend a special thanks to Rune Storvold from the Norwegian Research Centre (NORCE) for enabling access to the facility at the airport. The data were analyzed in cooperation with the Transregio project TRR 172 (AC)3, funded by the German Research Foundation under project ID 268020496. The aerosol research at the Zeppelin Observatory was supported by a National Research Foundation of Korea grant from the Korean Government (MSIT, the Ministry of Science and ICT) (NRF-2021M1A5A1065425) (KOPRI-PN23011). The research activity at Gruvebadet was made possible by projects PRIN-20092C7KRC001 and RIS 3693 Gruvebadet Atmospheric Laboratory Project (GRUVELAB) as well as by the coordination of the National Research Council (CNR), which manages the Italian Arctic station Dirigibile Italia through the Institute of Polar Sciences (ISP).
This research has been supported by the Deutsche Forschungsgemeinschaft (grant nos. LA 2907/5-3, WI 1449/22-3 and BA 1988/14-3).
This paper was edited by Daniele Contini and reviewed by two anonymous referees.
Abbatt, J. P. D., Leaitch, W. R., Aliabadi, A. A., Bertram, A. K., Blanchet, J.-P., Boivin-Rioux, A., Bozem, H., Burkart, J., Chang, R. Y. W., Charette, J., Chaubey, J. P., Christensen, R. J., Cirisan, A., Collins, D. B., Croft, B., Dionne, J., Evans, G. J., Fletcher, C. G., Galí, M., Ghahreman, R., Girard, E., Gong, W., Gosselin, M., Gourdal, M., Hanna, S. J., Hayashida, H., Herber, A. B., Hesaraki, S., Hoor, P., Huang, L., Hussherr, R., Irish, V. E., Keita, S. A., Kodros, J. K., Köllner, F., Kolonjari, F., Kunkel, D., Ladino, L. A., Law, K., Levasseur, M., Libois, Q., Liggio, J., Lizotte, M., Macdonald, K. M., Mahmood, R., Martin, R. V., Mason, R. H., Miller, L. A., Moravek, A., Mortenson, E., Mungall, E. L., Murphy, J. G., Namazi, M., Norman, A.-L., O'Neill, N. T., Pierce, J. R., Russell, L. M., Schneider, J., Schulz, H., Sharma, S., Si, M., Staebler, R. M., Steiner, N. S., Thomas, J. L., von Salzen, K., Wentzell, J. J. B., Willis, M. D., Wentworth, G. R., Xu, J.-W., and Yakobi-Hancock, J. D.: Overview paper: New insights into aerosol and climate in the Arctic, Atmos. Chem. Phys., 19, 2527–2560, https://doi.org/10.5194/acp-19-2527-2019, 2019. a
Allan, J. D., Williams, P. I., Najera, J., Whitehead, J. D., Flynn, M. J., Taylor, J. W., Liu, D., Darbyshire, E., Carpenter, L. J., Chance, R., Andrews, S. J., Hackenberg, S. C., and McFiggans, G.: Iodine observed in new particle formation events in the Arctic atmosphere during ACCACIA, Atmos. Chem. Phys., 15, 5599–5609, https://doi.org/10.5194/acp-15-5599-2015, 2015. a
Altstädter, B., Platis, A., Wehner, B., Scholtz, A., Wildmann, N., Hermann, M., Käthner, R., Baars, H., Bange, J., and Lampert, A.: ALADINA – an unmanned research aircraft for observing vertical and horizontal distributions of ultrafine particles within the atmospheric boundary layer, Atmos. Meas. Tech., 8, 1627–1639, https://doi.org/10.5194/amt-8-1627-2015, 2015. a, b, c
Altstädter, B., Deetz, K., Vogel, B., Babić, K., Dione, C., Pacifico, F., Jambert, C., Ebus, F., Bärfuss, K., Pätzold, F., Lampert, A., Adler, B., Kalthoff, N., and Lohou, F.: The vertical variability of black carbon observed in the atmospheric boundary layer during DACCIWA, Atmos. Chem. Phys., 20, 7911–7928, https://doi.org/10.5194/acp-20-7911-2020, 2020. a, b
Baccarini, A., Karlsson, L., Dommen, Duplessis, P., Vüllers, J., Brook, I. M., Saiz-Lopez, A., Salter, M., Tjernström, M., Baltensperger, U., Zieger, P., and Schmale, J.: Frequent new particle formation over the high Arctic pack ice by enhanced iodine emissions, Nat. Commun., 11, 4924, https://doi.org/10.1038/s41467-020-18551-0, 2020. a
Bärfuss, K., Pätzold, F., Altstädter, B., Kathe, E., Nowak, S, Bretschneider, L., Bestmann, U., and Lampert, A.: New Setup of the UAS ALADINA for Measuring Boundary Layer Properties, Atmospheric Particles and Solar Radiation, Atmosphere, 9, 1–21, https://doi.org/10.3390/atmos9010028, 2018. a
Beck, L. J., Sarnela, N., Junninen, H., Hoppe, C. J. M., Garmash, O., Bianchi, F., Riva, M., Rose, C., Peräkylä, O., Wimmer, D., Kausiala, O., Jokinen, T., Ahonen, L., Mikkilä, J., Hakala, J., He, X. C., Kontkanen, J., Wolf, K. K. E., Cappelletti, D., Mazzola, M., Traversi, R., Petroselli, C., Viola, A. P., Vitale, V., Lange, R., Massling, A., Nøjgaard, J. K., Krejci, R., Karlsson, L., Zieger, P., Jang, S., Lee, K., Vakkari, V., Lampilahti, J., Thakur, R. C., Leino, K., Kangasluoma, J., Duplissy, E. M., Siivola, E., Marbouti, M., Tham, Y. J., Saiz-Lopez, A., Petäjä, T., Ehn, M., Worsnop, D. R., Skov, H., Kulmala, M., Kerminen, V. M., and Sipilä, M.: Differing Mechanisms of New Particle Formation at Two Arctic Sites, Geophys. Res. Lett., 48, e2020GL091334, https://doi.org/10.1029/2020GL091334, 2021. a
Beine, H., Engardt, M., Jaffe, D., Hov, Ø., Holmén, K., and Stordal, F.: Measurements of NOx and aerosol particles at the Ny-Ålesund Zeppelin mountain station on Svalbard: influence of regional and local pollution sources, Atmos. Environ., 30, 1067–1079, 1996. a
Beine, H., Argentini, S., Maurizi, A., Mastrantonio, G., and Viola, A.: The local wind field at Ny-Ålesund and the Zeppelin mountain at Svalbard, Meteorol. Atmos. Phys., 78, 107–113, https://doi.org/10.1007/s007030170009, 2001. a, b
Blackall, T. D., Wilson, L. J., Theobald, M. R., Milford, C., Nemitz, E., Bull, J., Bacon, P. J., Hamer, K. C., Wanless, S., and Sutton, M. A.: Ammonia emissions from seabird colonies, Geophys. Res. Lett., 34, L10801, https://doi.org/10.1029/2006GL028928, 2007. a
Bond, T. C., Doherty, S. J., Fahey, D. W., Forster, P. M., Berntsen, T., DeAngelo, B. J., Flanner, M. G., Ghan, S., Karcher, B., Koch, D., Kinne, S., Kondo, Y., Quinn, P. K., Sarofim, M. C., Schultz, M. G., Schulz, M., Venkataraman, C., Zhang, H., Zhang, S., Bellouin, N., Guttikunda, S. K., Hopke, P. K., Jacobson, M. Z., Kaiser, J. W., Klimont, Z., Lohmann, U., Schwarz, J. P., Shindell, D., Storelvmo, T., Warren, S. G., and Zender, C. S.: Bounding the role of black carbon in the climate system: A scientific assessment, J. Geophys. Res.-Atmos., 118, 5380–5552, https://doi.org/10.1002/jgrd.50171, 2013. a
Croft, B., Wentworth, G. R., Martin, R. V., Leaitch, W. R., Murphy, J. G., Murphy, B. N., Kodros, J. K., Abbatt, J. P., and Pierce, J. R.: Contribution of Arctic seabird-colony ammonia to atmospheric particles and cloud-albedo radiative effect, Nat. Commun., 7, 13444, https://doi.org/10.1038/ncomms13444, 2016. a
Dai, A., Luo, D., Song, M., and Liu, J.: Arctic amplification is caused by sea-ice loss under increasing CO2, Nat. Commun., 10, 121, https://doi.org/10.1038/s41467-018-07954-9, 2019. a
Dall'Osto, M., Beddows, D. C. S., Tunved, P., Krejci, R., Ström, J., Hansson, H.-C., Yoon, Y. J., Ki-Tae Park, Becagli, S., Udisti, R., Onasch, T., O'Dowd, C. D., Simó, R., and Harrison, R. M.: Arctic sea ice melt leads to atmospheric new particle formation, Sci. Rep.-UK, 7, 3318 https://doi.org/10.1038/s41598-017-03328-1, 2017. a
Dall'Osto, M., Beddows, D. C. S., Tunved, P., Harrison, R. M., Lupi, A., Vitale, V., Becagli, S., Traversi, R., Park, K.-T., Yoon, Y. J., Massling, A., Skov, H., Lange, R., Strom, J., and Krejci, R.: Simultaneous measurements of aerosol size distributions at three sites in the European high Arctic, Atmos. Chem. Phys., 19, 7377–7395, https://doi.org/10.5194/acp-19-7377-2019, 2019. a
Dekhtyareva, A., Holmén, K., Maturilli, M., Hermansen, O., and Graversen, R.: Effect of seasonal mesoscale and microscale meteorological conditions in Ny-Ålesund on results of monitoring of long-range transported pollution, Polar Res., 37, 1508196, https://doi.org/10.1080/17518369.2018.1508196, 2018. a
Eleftheriadis, K., Vratolis, S., and Nyeki, S.: Aerosol black carbon in the European Arctic: Measurements at Zeppelin station, Ny-Ålesund, Svalbard from 1998–2007, Geophys. Res. Lett., 36, L02809, https://doi.org/10.1029/2008GL035741, 2009. a
Ferrero, L., Cappelletti, D., Busetto, M., Mazzola, M., Lupi, A., Lanconelli, C., Becagli, S., Traversi, R., Caiazzo, L., Giardi, F., Moroni, B., Crocchianti, S., Fierz, M., Močnik, G., Sangiorgi, G., Perrone, M. G., Maturilli, M., Vitale, V., Udisti, R., and Bolzacchini, E.: Vertical profiles of aerosol and black carbon in the Arctic: a seasonal phenomenology along 2 years (2011–2012) of field campaigns, Atmos. Chem. Phys., 16, 12601–12629, https://doi.org/10.5194/acp-16-12601-2016, 2016. a
Flanner, M. G., Zender, C. S., Hess, P. G., Mahowald, N. M., Painter, T. H., Ramanathan, V., and Rasch, P. J.: Springtime warming and reduced snow cover from carbonaceous particles, Atmos. Chem. Phys., 9, 2481–2497, https://doi.org/10.5194/acp-9-2481-2009, 2009. a
Freud, E., Krejci, R., Tunved, P., Leaitch, R., Nguyen, Q. T., Massling, A., Skov, H., and Barrie, L.: Pan-Arctic aerosol number size distributions: seasonality and transport patterns, Atmos. Chem. Phys., 17, 8101–8128, https://doi.org/10.5194/acp-17-8101-2017, 2017. a
Gabric, A. J., Qu, B., Matrai, P., and Hirst, A. C.: The simulated response of dimethyl sulphide production in the Arctic Ocean to global warming, Tellus B, 57, 391–403, https://doi.org/10.3402/tellusb.v57i5.16564, 2005. a
Graßl, S., Ritter, C., and Schulz, A.: The Nature of the Ny-Ålesund Wind Field Analysed by High-Resolution Windlidar Data, Remote Sens.-Basel, 14, 3771, https://doi.org/10.3390/rs14153771, 2022. a, b
Hann, R., Altstädter, B., Betlem, P., Deja, K., Dragańska-Deja, K., Ewertowski, M., Hartvich, F., Jonassen, M., Lampert, A., Laska, M., Sobota, I., Storvold, R., Tomczyk, A., Wojtysiak, K., and Zagórski, P.: Scientific Applications of Unmanned Vehicles in Svalbard (UAV Svalbard), edited by: Moreno-Ibáñez, M., Hagen, J. O., Hübner, C., Lihavainen, H., and Zaborska, A., SESS report 2020, Svalbard Integrated Arctic Earth Observing System, Longyearbyen, 78–103, https://doi.org/10.5281/zenodo.4293283, 2021. a
Harm-Altstädter, B., Bärfuss, K., Bretschneider, L., Käthner, R., Pätzold, F., Peuker, A., Wehner, B., and Lampert, A.: Arctic aerosol and atmospheric observations with the unmanned research aircraft ALADINA in Ny-Ålesund, Spitsbergen, April/May 2018, PANGAEA [data set], https://doi.org/10.1594/PANGAEA.947132, 2022. a
Haywood, J. and Boucher, O.: Estimates of the direct and indirect radiative forcing due to tropospheric aerosols: A review, Rev. Geophys., 38, 513–543, https://doi.org/10.1029/1999RG000078, 2000. a
He, M., Hu, Y., Chen, N., Wang, D., Huang, J., and Stamnes, K.: High cloud coverage over melted areas dominates the impact of clouds on the albedo feedback in the Arctic, Sci. Rep.-UK, 9, 9529, https://doi.org/10.1038/s41598-019-44155-w, 2019. a
Heintzenberg, J., Wehner, B., and Birmilli, W.: “How to find bananas in the atmospheric aerosol”: new approach for analyzing atmospheric nucleation and growth events, Tellus B, 59, 273–282, https://doi.org/10.1111/j.1600-0889.2007.00249.x, 2007. a
Heintzenberg, J., Tunved, P., Galí, M., and Leck, C.: New particle formation in the Svalbard region 2006–2015, Atmos. Chem. Phys., 17, 6153–6175, https://doi.org/10.5194/acp-17-6153-2017, 2017. a
Hogrefe, O., Lala, G., Frank, B., Schwab, J., and Demerjian, K.: Field evaluation of a TSI 3034 scanning mobility particle sizer in New York City: Winter 2004 intensive campaign, Aerosol Sci. Tech., 40, 753–762, https://doi.org/10.1080/02786820600721846, 2006. a
Intrieri, J., Fairall, C. W., Shupe, M., Persson, P., Andreas, E., Guest, P., and Moritz, R.: An annual cycle of Arctic surface cloud forcing at SHEBA, J. Geophys. Res., 107, 8039, https://doi.org/10.1029/2000JC000439, 2002. a
IPCC: Climate Change 2013: The Physical Science Basis. Contribution of Working Group I to the Fifth Assessment Report of the Intergovernmental Panel on Climate Change, edited by: Stocker, T. F., Qin, D., Plattner, G.-K., Tignor, M., Allen, S. K., Boschung, J., Nauels, A., Xia, Y., Bex, V., and Midgley, P. M., Cambridge University Press, Cambridge, United Kingdom and New York, NY, USA, 1535 pp., 2013. a
Kay, J. E. and L'Ecuyer, T.: Observational constraints on Arctic Ocean clouds and radiative fluxes during the early 21st century, J. Geophys. Res.-Atmos., 118, 7219–7236, https://doi.org/10.1002/jgrd.50489, 2013. a
Kerminen, V.-M., Paramonov, M., Anttila, T., Riipinen, I., Fountoukis, C., Korhonen, H., Asmi, E., Laakso, L., Lihavainen, H., Swietlicki, E., Svenningsson, B., Asmi, A., Pandis, S. N., Kulmala, M., and Petäjä, T.: Cloud condensation nuclei production associated with atmospheric nucleation: a synthesis based on existing literature and new results, Atmos. Chem. Phys., 12, 12037–12059, https://doi.org/10.5194/acp-12-12037-2012, 2012. a
Kerminen, V.-M., Chen, X., Vakkari, V., Petäjä, T., Kulmala, M., and Bianchi, F.: Atmospheric new particle formation and growth: review of field observations, Environ. Res. Lett., 13, 103003, https://doi.org/10.1088/1748-9326/aadf3c, 2018. a, b
Kulmala, M., Petäjä, T., Nieminen, T., Sipilä, M., Manninen, H. E., Lehtipalo, K., Dal Maso, M., Aalto, P. P., Junninen, H., and Paasonen, P.: Measurement of the nucleation of atmospheric aerosol particles, Nat. Protoc., 7, 1651–1667, https://doi.org/10.1038/nprot.2012.091, 2012. a
Lampert, A., Altstädter, B., Bärfuss, K., Bretschneider, L., Sandgaard, J., Michaelis, J., Lobitz, L., Asmussen, M., Damm, E., Käthner, R., Krüger, T., Lüpkes, C., Nowak, S., Peuker, A., Rausch, T., Reiser, F., Scholtz, A., Sotomayor Zakharov, D., Gaus, D., Bansmer, S., Wehner, B., and Pätzold, F.: Unmanned Aerial Systems for Investigating the Polar Atmospheric Boundary Layer—Technical Challenges and Examples of Applications, Atmosphere, 11, 1–25, https://doi.org/10.3390/atmos11040416, 2020. a, b, c
Leaitch, W. R., Sharma, S., Huang, L., Toom-Sauntry, D., Chivulescu, A., Macdonald, A. M., von Salzen, K., Pierce, J. R., Bertram, A. K., Schroder, J. C., Shantz, N. C., Chang, R. Y.-W., and Norman, A.-L.: Dimethyl sulfide control of the clean summertime Arctic aerosol and cloud, Elementa, 1, 00017, https://doi.org/10.12952/journal.elementa.000017, 2013. a
Lee, H., Lee, K., Lunder, C. R., Krejci, R., Aas, W., Park, J., Park, K.-T., Lee, B. Y., Yoon, Y. J., and Park, K.: Atmospheric new particle formation characteristics in the Arctic as measured at Mount Zeppelin, Svalbard, from 2016 to 2018, Atmos. Chem. Phys., 20, 13425–13441, https://doi.org/10.5194/acp-20-13425-2020, 2020. a, b
Lupi, A., Busetto, M., Becagli, S., Giardi, F., Lanconelli, C., Mazzola, M., Udisti, R., Hansson, H.-C., Henning, T., Petkov, B., Ström, J., Krejci, R., Tunved, P., Viola, A. P., and Vitale, V.: Multi-seasonal ultrafine aerosol particle number concentration measurements at the Gruvebadet observatory, Ny-Ålesund, Svalbard Islands, Rend. Lincei.-Sci. Fis. Nat., 27, 59–71, https://doi.org/10.1007/s12210-016-0532-8, 2016. a
Maturilli, M.: Continuous meteorological observations at station Ny-Ålesund (2018-04). Alfred Wegener Institute - Research Unit Potsdam, PANGAEA [data set], https://doi.org/10.1594/PANGAEA.894667, 2018a. a, b
Maturilli, M.: Continuous meteorological observations at station Ny-Ålesund (2018-05). Alfred Wegener Institute - Research Unit Potsdam, PANGAEA [data set], https://doi.org/10.1594/PANGAEA.894668, 2018b. a, b
Maturilli, M.: Expanded measurements from station Ny-Ålesund (2018-04). Alfred Wegener Institute - Research Unit Potsdam, PANGAEA [data set], https://doi.org/10.1594/PANGAEA.892411, 2018c. a, b
Maturilli, M.: Expanded measurements from station Ny-Ålesund (2018-05). Alfred Wegener Institute - Research Unit Potsdam, PANGAEA [data set], https://doi.org/10.1594/PANGAEA.892413, 2018d. a, b
Mazzola, M., Viola, A. P., Lanconelli, C., and Vitale, V.: Atmospheric observations at the Amundsen-Nobile Climate Change Tower in Ny-Ålesund, Svalbard, Rend. Fis. Acc. Lincei, 27, 7–18, https://doi.org/10.1007/s12210-016-0540-8, 2016. a
Moroni, B., Becagli, S., Bolzacchini, E., Busetto, M., Cappelletti, D., Crocchianti, S., Ferrero, L., Frosini, D., Lanconelli, C., Lupi, A., Maturilli, M., Mazzola, M., Perrone, M., Sangiorgi, G., Traversi, R., Udisti, R., Viola, A., and Vitale, V.: Vertical Profiles and Chemical Properties of Aerosol Particles upon Ny-Ålesund (Svalbard Islands), Adv. Meteorol., 2015, 292081, https://doi.org/10.1155/2015/292081, 2015. a
Nguyen, Q. T., Glasius, M., Sørensen, L. L., Jensen, B., Skov, H., Birmili, W., Wiedensohler, A., Kristensson, A., Nøjgaard, J. K., and Massling, A.: Seasonal variation of atmospheric particle number concentrations, new particle formation and atmospheric oxidation capacity at the high Arctic site Villum Research Station, Station Nord, Atmos. Chem. Phys., 16, 11319–11336, https://doi.org/10.5194/acp-16-11319-2016, 2016. a
Nieminen, T., Kerminen, V.-M., Petäjä, T., Aalto, P. P., Arshinov, M., Asmi, E., Baltensperger, U., Beddows, D. C. S., Beukes, J. P., Collins, D., Ding, A., Harrison, R. M., Henzing, B., Hooda, R., Hu, M., Hõrrak, U., Kivekäs, N., Komsaare, K., Krejci, R., Kristensson, A., Laakso, L., Laaksonen, A., Leaitch, W. R., Lihavainen, H., Mihalopoulos, N., Németh, Z., Nie, W., O'Dowd, C., Salma, I., Sellegri, K., Svenningsson, B., Swietlicki, E., Tunved, P., Ulevicius, V., Vakkari, V., Vana, M., Wiedensohler, A., Wu, Z., Virtanen, A., and Kulmala, M.: Global analysis of continental boundary layer new particle formation based on long-term measurements, Atmos. Chem. Phys., 18, 14737–14756, https://doi.org/10.5194/acp-18-14737-2018, 2018. a, b
Nilsson, E. D., Rannik, Ü., Kulmala, M., Buzorius, G., and O'Dowd, C. D.: Effects of continental boundary layer evolution, convection, turbulence and entrainment, on aerosol formation, Tellus B, 53, 441–461, https://doi.org/10.1034/j.1600-0889.2001.d01-31.x, 2001. a
Park, K.-T., Jang, S., Lee, K., Yoon, Y. J., Kim, M.-S., Park, K., Cho, H.-J., Kang, J.-H., Udisti, R., Lee, B.-Y., and Shin, K.-H.: Observational evidence for the formation of DMS-derived aerosols during Arctic phytoplankton blooms, Atmos. Chem. Phys., 17, 9665–9675, https://doi.org/10.5194/acp-17-9665-2017, 2017. a
Petäjä, T., Duplissy, E.-M., Tabakova, K., Schmale, J., Altstädter, B., Ancellet, G., Arshinov, M., Balin, Y., Baltensperger, U., Bange, J., Beamish, A., Belan, B., Berchet, A., Bossi, R., Cairns, W. R. L., Ebinghaus, R., El Haddad, I., Ferreira-Araujo, B., Franck, A., Huang, L., Hyvärinen, A., Humbert, A., Kalogridis, A.-C., Konstantinov, P., Lampert, A., MacLeod, M., Magand, O., Mahura, A., Marelle, L., Masloboev, V., Moisseev, D., Moschos, V., Neckel, N., Onishi, T., Osterwalder, S., Ovaska, A., Paasonen, P., Panchenko, M., Pankratov, F., Pernov, J. B., Platis, A., Popovicheva, O., Raut, J.-C., Riandet, A., Sachs, T., Salvatori, R., Salzano, R., Schröder, L., Schön, M., Shevchenko, V., Skov, H., Sonke, J. E., Spolaor, A., Stathopoulos, V. K., Strahlendorff, M., Thomas, J. L., Vitale, V., Vratolis, S., Barbante, C., Chabrillat, S., Dommergue, A., Eleftheriadis, K., Heilimo, J., Law, K. S., Massling, A., Noe, S. M., Paris, J.-D., Prévôt, A. S. H., Riipinen, I., Wehner, B., Xie, Z., and Lappalainen, H. K.: Overview: Integrative and Comprehensive Understanding on Polar Environments (iCUPE) – concept and initial results, Atmos. Chem. Phys., 20, 8551–8592, https://doi.org/10.5194/acp-20-8551-2020, 2020. a
Pikridas, M., Bezantakos, S., Močnik, G., Keleshis, C., Brechtel, F., Stavroulas, I., Demetriades, G., Antoniou, P., Vouterakos, P., Argyrides, M., Liakakou, E., Drinovec, L., Marinou, E., Amiridis, V., Vrekoussis, M., Mihalopoulos, N., and Sciare, J.: On-flight intercomparison of three miniature aerosol absorption sensors using unmanned aerial systems (UASs), Atmos. Meas. Tech., 12, 6425–6447, https://doi.org/10.5194/amt-12-6425-2019, 2019. a
Pithan, F. and Mauritsen, T.: Arctic amplification dominated by temperature feedbacks in contemporary climate models, Nat. Geosci., 7, 181–184, https://doi.org/10.1038/ngeo2071, 2014. a
Platt, S. M., Hov, Ø., Berg, T., Breivik, K., Eckhardt, S., Eleftheriadis, K., Evangeliou, N., Fiebig, M., Fisher, R., Hansen, G., Hansson, H.-C., Heintzenberg, J., Hermansen, O., Heslin-Rees, D., Holmén, K., Hudson, S., Kallenborn, R., Krejci, R., Krognes, T., Larssen, S., Lowry, D., Lund Myhre, C., Lunder, C., Nisbet, E., Nizzetto, P. B., Park, K.-T., Pedersen, C. A., Aspmo Pfaffhuber, K., Röckmann, T., Schmidbauer, N., Solberg, S., Stohl, A., Ström, J., Svendby, T., Tunved, P., Tørnkvist, K., van der Veen, C., Vratolis, S., Yoon, Y. J., Yttri, K. E., Zieger, P., Aas, W., and Tørseth, K.: Atmospheric composition in the European Arctic and 30 years of the Zeppelin Observatory, Ny-Ålesund, Atmos. Chem. Phys., 22, 3321–3369, https://doi.org/10.5194/acp-22-3321-2022, 2022. a
Rautenberg, A., Schön, M., Zum Berge, K., Mauz, M., Manz, P., Platis, A., Kesteren, B., Suomi, I., Kral, S., and Bange, J.: The Multi-Purpose Airborne Sensor Carrier MASC-3 for Wind and Turbulence Measurements in the Atmospheric Boundary Layer, Sensors, 19, 2292, https://doi.org/10.3390/s19102292, 2019. a
Riddick, S. N., Dragosits, U., Blackall, T. D., Daunt, F., Wanless, S., and Sutton, M. A.: The global distribution of ammonia emissions from seabird colonies, Atmos. Environ., 55, 319–327, https://doi.org/10.1016/j.atmosenv.2012.02.052, 2012. a
Schmale, J., Zieger, P., and Ekman, A. M. L.: Aerosols in current and future Arctic climate, Nat. Clim. Change, 11, 95–105, https://doi.org/10.1038/s41558-020-00969-5, 2021. a
Schön, M., Suomi, I., Altstädter, B., van Kesteren, B., zum Berge, K., Platis, A., Wehner, B., Lampert, A., and Bange, J.: Case studies of the wind field around Ny-Ålesund, Svalbard, using unmanned aircraft, Polar Res., 41, 1–15, https://doi.org/10.33265/polar.v41.7884, 2022a. a, b, c
Schön, M., zum Berge, K., Platis, A., and Bange, J.: UAS-based measurement of wind vector, temperature and humidity in Ny-Alesund, Svalbard, during April and May 2018, PANGAEA [data set], https://doi.org/10.1594/PANGAEA.946961, 2022b. a
Screen, J. A., Deser, C., Smith, D. M., Zhang, X., Blackport, R., Kusher, P. J., Oudar, T., McCusker, K. E., and Sun, L.: Consistency and discrepancy in the atmospheric response to Arctic sea-ice loss across climate models, Nat. Geosci., 11, 155–163, https://doi.org/10.1038/s41561-018-0059-y, 2018. a
Serreze, M. C. and Barry, R. G.: Processes and impacts of Arctic amplification: A research synthesis, Global Planet. Change, 77, 85–96, https://doi.org/10.1016/j.gloplacha.2011.03.004, 2011. a, b
Sipilä, M., Sarnela, N., Jokinen, T., Henschel, H., Junninen, H., Kontkanen, J., Richters, S., Kangasluoma, J., Franchin, A., Peräkylä, O., Rissanen, M. P., Ehn, M., Vehkamäki, H., Kurten, T., Berndt, T., Petäjä, T., Worsnop, D., Ceburnis, D., Kerminen, V.-M., Kulmala, M., and O'Dowd, C.: Molecular-scale evidence of aerosolparticle formation via sequential addition of HIO3, Nature, 537, 532–534, https://doi.org/10.1038/nature19314, 2016. a
Ström, J., Umegard, J., Torseth, K., Tunved, P., Hansson, H. C., Holmen, K., Wismann, V., Herber, A., and Konig-Langlo, G.: One year of particle size distribution and aerosol chemical-composition measurements at the Zeppelin Station, Svalbard, March 2000–March 2001, Phys. Chem. Earth, 28, 1181–1190, https://doi.org/10.1016/j.pce.2003.08.058, 2003. a
Ström, J., Engvall, A., Delbart, F., Krejci, R., and Treffeisen, R.: On small particles in the Arctic summer boundary layer: observations at two different heights near Ny-Ålesund, Svalbard, Tellus B, 61, 473–482, https://doi.org/10.1111/j.1600-0889.2009.00412.x, 2009. a
Stroeve, J. C., Serreze, M. C., Holland, M. M., Kay, J. E., Maslanik, J., and Barrett, A. P.: The Arctic’s rapidly shrinking sea ice cover: A research synthesis, Clim. Change, 110, 1005–1027, https://doi.org/10.1007/s10584-011-0101-1, 2012. a
Taylor, P. C., Cai, M., Hu, A., Meehl, J., Washington, W., and Zhang, G. J.: A decomposition of feedback contributions to polar warming amplification, J. Climate, 26, 7023–7043, https://doi.org/10.1175/JCLI-D-12-00696.1, 2013. a
Tunved, P., Ström, J., and Krejci, R.: Arctic aerosol life cycle: linking aerosol size distributions observed between 2000 and 2010 with air mass transport and precipitation at Zeppelin station, Ny-Ålesund, Svalbard, Atmos. Chem. Phys., 13, 3643–3660, https://doi.org/10.5194/acp-13-3643-2013, 2013. a, b, c, d, e, f
Twomey, S.: Aerosols, clouds and radiation, Atmos. Environ. A-Gen., 25, 2435–2442, https://doi.org/10.1016/0960-1686(91)90159-5, 1991. a
Vavrus, S.: The impact of cloud feedbacks on Arctic climate under greenhouse forcing, J. Climate, 17, 603–615, https://doi.org/10.1175/1520-0442(2004)017<0603:TIOCFO>2.0.CO;2 2004. a
Wendisch, M., Brückner, M., Burrows, J. P., Crewell, S., Dethloff, K., Ebell, K., Lüpkes, C., Macke, A., Notholt, J., Quaas, J., Rinke, A., and Tegen, I.: Understanding causes and effects of rapid warming in the Arctic, Eos, 98, 22–26, https://doi.org/10.1029/2017EO064803, 2017. a
Wendisch, M., Brückner, M., Crewell, S., Ehrlich, A., Notholt, J., Lüpkes, C., Macke, A., Burrows, J. P., Rinke, A., Quaas, J., Maturilli, M., Schemann, V., Shupe, M. D., Akansu, E. F., Barrientos-Velasco, C., Bärfuss, K., Blechschmidt, A.-M., Block, K., Bougoudis, I., Bozem, H., Böckmann, C., Bracher, A., Bresson, H., Bretschneider, L., Buschmann, M., Chechin, D. G., Chylik, J., Dahlke, S., Deneke, H., Dethloff, K., Donth, T., Dorn, W., Dupuy, R., Ebell, K., Egerer, U., Engelmann, R., Eppers, O., Gerdes, R., Gierens, R., Gorodetskaya, I. V., Gottschalk, M., Griesche, H., Gryanik, V. M., Handorf, D., Harm-Altstädter, B., Hartmann, J., Hartmann, M., Heinold, B., Herber, A., Herrmann, H., Heygster, G., Höschel, I., Hofmann, Z., Hölemann, J., Hünerbein, A., Jafariserajehlou, S., Jäkel, E., Jacobi, C., Janout, M., Jansen, F., Jourdan, O., Jurányi, Z., Kalesse-Los, H., Kanzow, T., Käthner, R., Kliesch, L. L., Klingebiel, M., Knudsen, E. M., Kovács, T., Körtke, W., Krampe, D., Kretzschmar, J., Kreyling, D., Kulla, B., Kunkel, D., Lampert, A., Lauer, M., Lelli, L., von Lerber, A., Linke, O., Löhnert, U., Lonardi, M., Losa, S. N., Losch, M., Maahn, M., Mech, M., Mei, L., Mertes, S., Metzner, E., Mewes, D., Michaelis, J., Mioche, G., Moser, M., Nakoudi, K., Neggers, R., Neuber, R., Nomokonova, T., Oelker, J., Papakonstantinou-Presvelou, I., Pätzold, F., Pefanis, V., Pohl, C., van Pinxteren, M., Radovan, A., Rhein, M., Rex, M., Richter, A., Risse, N., Ritter, C., Rostosky, P., Rozanov, V. V., Ruiz Donoso, E., Saavedra-Garfias, P., Salzmann, M., Schacht, J., Schäfer, M., Schneider, J., Schnierstein, N., Seifert, P., Seo, S., Siebert, H., Soppa, M. A., Spreen, G., Stachlewska, I. S., Stapf, J., Stratmann, F., Tegen, I., Viceto, C., Voigt, C., Vountas, M., Walbröl, A., Walter, M., Wehner, B., Wex, H., Willmes, S., Zanatta, M., and Zeppenfeld, S.: Atmospheric and Surface Processes, and Feedback Mechanisms Determining Arctic Amplification: A Review of First Results and Prospects of the (AC)3 Project, B. Am. Meteorol. Soc., 104, E208–E242, https://doi.org/10.1175/BAMS-D-21-0218.1, 2022. a
Wiedensohler, A., Covert, D. S., Swietlicki, E., Aalto, P., Heintzenberg, J., and Leck, C.: Occurrence of an ultrafine particle mode less than 20 nm in diameter in the marine boundary layer during Arctic summer and autumn, Tellus B, 48, 213–222, https://doi.org/10.1034/j.1600-0889.1996.t01-1-00006.x, 1996. a
Xavier, C., Baykara, M., Wollesen de Jonge, R., Altstädter, B., Clusius, P., Vakkari, V., Thakur, R., Beck, L., Becagli, S., Severi, M., Traversi, R., Krejci, R., Tunved, P., Mazzola, M., Wehner, B., Sipilä, M., Kulmala, M., Boy, M., and Roldin, P.: Secondary aerosol formation in marine Arctic environments: a model measurement comparison at Ny-Ålesund, Atmos. Chem. Phys., 22, 10023–10043, https://doi.org/10.5194/acp-22-10023-2022, 2022. a
Zhang, W., Miller, P. A., Jansson, C., Samuelsson, P., Mao, J., and Smith, B.: Self-Amplifying Feedbacks Accelerate Greening and Warming of the Arctic, Geophys. Res. Lett., 45, 7102-–7111, https://doi.org/10.1029/2018GL077830, 2018. a
Zhao, C. and Garrett, T. J.: Effects of Arctic haze on surface cloud radiative forcing, Geophys. Res. Lett., 42, 557–564, https://doi.org/10.1002/2014GL062015, 2015. a
- Abstract
- Introduction
- Description of the measurement site, instrumentation and data availability
- Results and discussions
- Concluding remarks
- Appendix A: Time series of vertical profiles of selected measurement parameters based on ALADINA during the investigation period in Ny-Ålesund
- Data availability
- Author contributions
- Competing interests
- Disclaimer
- Acknowledgements
- Financial support
- Review statement
- References