the Creative Commons Attribution 4.0 License.
the Creative Commons Attribution 4.0 License.
 | 22 Dec 2023
Nanoparticle ranking analysis: determining new particle formation (NPF) event occurrence and intensity based on the concentration spectrum of formed (sub-5 nm) particles
Diego Aliaga
Santeri Tuovinen
Tinghan Zhang
Janne Lampilahti
Xinyang Li
Lauri Ahonen
Tom Kokkonen
Tuomo Nieminen
Simo Hakala
Pauli Paasonen
Federico Bianchi
Doug Worsnop
Veli-Matti Kerminen
Markku Kulmala
Here we introduce a new method, termed “nanoparticle ranking analysis”, for characterizing new particle formation (NPF) from atmospheric observations. Using daily variations of the particle number concentration at sizes immediately above the continuous mode of molecular clusters, here in practice 2.5–5 nm (i.e. ΔN2.5−5), we can determine the occurrence probability and estimate the strength of atmospheric NPF events. After determining the value of ΔN2.5−5 for all the days during a period under consideration, the next step of the analysis is to rank the days based on this simple metric. The analysis is completed by grouping the days either into a number of percentile intervals based on their ranking or into a few modes in the distribution of log (ΔN2.5−5) values. Using 5 years (2018–2022) of data from the SMEAR II station in Hyytiälä, Finland, we found that the days with higher (lower) ranking values had, on average, both higher (lower) probability of NPF events and higher (lower) particle formation rates. The new method provides probabilistic information about the occurrence and intensity of NPF events and is expected to serve as a valuable tool to define the origin of newly formed particles at many types of environments that are affected by multiple sources of aerosol precursors.
- Article
(7191 KB) - Full-text XML
-
Supplement
(507 KB) - BibTeX
- EndNote


Atmospheric new particle formation (NPF) events take place, though with variable frequencies, in most of the continental environments (e.g. Wang et al., 2017; Kerminen et al., 2018; Nieminen et al., 2018; Chu et al., 2019; Bousiotis et al., 2021), and this phenomenon appears to be connected with both regional cloud condensation nuclei production (e.g. Peng et al., 2014; Petäjä et al., 2022) and urban haze formation (Guo et al., 2014; Kulmala et al., 2021, 2022a). The various impacts of atmospheric NPF events depend essentially on their frequency of occurrence and intensity, with the latter determined by time-averaged particle formation and growth rates. Quantifying the main characteristics of NPF in different environments, as well as connecting these characteristics to emissions and atmospheric processes, is therefore vital for our better understanding of the potential influences of atmospheric NPF on air quality, climate, and weather.
Field measurements have been (and will likely continue to be) the primary source of data on the occurrence and intensity of atmospheric NPF (Kerminen et al., 2018, and references therein). Traditionally, the most common way to estimate the NPF event frequency from atmospheric observations is to classify individual measurement days into a small number of categories, from which one then calculates the fraction of days during which NPF events occurs (Dal Maso et al., 2005; Kulmala et al., 2012; Dada et al., 2018). Such NPF event classification methods, while widely applied in the scientific literature, tend to be subjective and time-consuming, and they often result in a large fraction of days for which it is difficult to estimate whether a NPF event took place or not. The subjectivity and time-constraint issues can be alleviated using automatic or semi-automatic methods applied to field measurement data (e.g. Joutsensaari et al., 2018; Zaidan et al., 2018; Su et al., 2022), but the problem of having a larger fraction of days that are difficult to classify tends to remain.
An alternative way to approach the NPF event frequency is to define some indicator, based on quantities obtained from field measurements, that predicts NPF events in a more probabilistic way (Hyvönen et al., 2005; McMurry et al., 2005; Kuang et al., 2010; Jayaratne et al., 2015; Cai et al., 2021; Olin et al., 2022). The benefits of such approaches compared to the traditional NPF event classification methods are that they are usually faster and more easily applicable to all measurement days. However, the indicators developed so far tend to be sensitive to the dominant NPF pathway and possibly other site-specific factors, requiring a priori knowledge of the mechanisms involved in NPF at any given site or requiring complementary measurements, such as concentration measurements of sulfuric acid and other precursor gases that are not always available in the field.
In the vast majority of studies, the intensity of NPF was estimated only for days showing clear signs of both particle formation and subsequent particle growth. This is an undesirable feature, since atmospheric NPF appears to proceed on other types of days as well, albeit typically with weaker intensities (Kulmala et al., 2022b). Currently available tools have a hard time in quantifying these weak-intensity (yet often non-negligible) periods of NPF because of instrumental limitations and heterogeneities in measured air masses, limiting determination of both particle formation and growth rates.
In this paper, we present a novel approach, the nanoparticle ranking analysis, for characterizing NPF from atmospheric observations. In the following sections, we begin by introducing and detailing the nanoparticle ranking analysis. Subsequently, we offer an overview of the measurement site and the instruments employed in our study. Finally, we outline the procedure for calculating the formation rate, as well as the utilization of the traditional classification method. Both components will then be used to demonstrate the effectiveness of our novel approach.
2.1 Description of the nanoparticle ranking analysis
nanoparticle ranking analysis is designed to characterize NPF events in an objective, quantifiable, and replicable manner. Our foundational supposition, which is in alignment with earlier observations of atmospheric ions (e.g. Tammet et al., 2014; Leino et al., 2016), asserts that the daily fluctuation of the particle number concentrations within the 2.5–5 nm diameter range (ΔN2.5−5) is acutely sensitive to the presence of atmospheric NPF. The range is defined with a lower limit of 2.5 nm to prevent interference from the continuous mode of molecular clusters (Kulmala et al., 2007). Moreover, detecting particles at this size inherently indicates that nucleation and growth are occurring in the atmosphere. The upper limit is set at 5 nm to maintain a strong signal while minimizing the impact from primary ultrafine particle sources, such as traffic emissions. These emissions are observed to decrease rapidly in concentration, favouring smaller particle sizes (Rönkkö and Timonen, 2019; Ketzel and Berkowicz, 2004). While the specific range can be adjusted based on site conditions and available instrumentation, it is recommended not to exceed 7 nm to avoid potential non-NPF-related disturbances in the signal.
Building upon this premise, our method quantifies NPF events using their corresponding ΔN2.5−5 value (formal description in Sect. 2.1.1). This value practically represents the daily difference between the maximum and minimum concentrations of these particles, and it conveniently serves as a unique and continuous metric. The approach yields a single representative value for each measurement day. The maximum and minimum values can be constrained to specific time windows denominated “active” and “background” periods (as described below), in which these values are anticipated. This helps mitigate potential interference from well-known primary emission sources such as traffic.
Subsequently, we employ a two-fold approach: firstly, the derived ΔN2.5−5 values are used to rank NPF events, and secondly, we scrutinize the logarithmic distribution of these values to discern any dominant modes. These modes can be further fitted using Gaussian curves, thereby serving as a useful tool to differentiate between varying intensity levels (or modes) of NPF. We anticipate that these dual outputs will facilitate a deeper understanding of the mechanisms underpinning NPF for specific sites. The former can be compared with continuous parameters linked to NPF, such as precursor gases, condensation sinks, meteorological conditions, and the time over land of the associated air mass. In contrast, the latter can be aligned with categorical elements like synoptic patterns, transport mechanisms, or volcanic eruptions. The modes also make the comparison between different sites more robust as it is possible to, for example, justify the comparison between “intense events” in different environments (i.e. compare their frequency and intensity) for the highest mode. Such a comparison would be more challenging using just a specific numerical threshold ( a certain limit), as this approach might not account for potential differences in condensation/coagulation sink or other parameters affecting NPF, in addition to NPF itself.
While there is no strict minimum on the number of days required to implement this method, we advise a baseline of 1 month to increase the likelihood of obtaining a representative sample of NPF intensity and occurrence. However, more extensive datasets are preferable, with multi-year and multi-season time series being optimal.
2.1.1 Steps to calculate ΔN2.5−5
The following steps outline our approach for analysing the days based on the ΔN2.5−5 spectrum:
- 1.
Extract the time series of the particle number concentration (). This is done in the size interval immediately above the continuous mode of molecular clusters from the particle number size distribution (Fig. 1a–b). In our case, we use the particles in the size range of 2.5–5 nm.
- 2.
Smooth the N2.5−5 time series. This is done to mitigate the influence of potential spurious signals on the ranking value. In our case, we applied a rolling median over 2 h intervals. This approach reduces the impact of noise or outliers, ensuring a more reliable and accurate ranking assessment.
- 3.
Identify diurnal background and active regions. Background regions are generally characterized by times of the day that have minimal diurnal values, whereas active regions exhibit maximal diurnal values of N2.5−5. To identify these regions more accurately, we recommend dividing the dataset into seasons and examining the diurnal behaviour in each season separately (Fig. 1c). This is particularly important in environments with high levels of particle emissions (particularly nanoparticle emissions), such as urban environments, in which poorly chosen time regions could result in values of ΔN2.5−5 that are considerably affected by these emissions.
- 4.
Find the background number concentration for each day . The background concentration corresponding to a given day is determined based on the median value of N2.5−5 in the so-called background region after applying the 2 h rolling smoothing of the time series (step 2). For Hyytiälä, this time window is between 21:00 and 06:00 LT (local time; the time zone for all instances in the text is LT) (Fig. 1d). The window boundaries are selected so that they contain the seasonal daily median minimums (Fig. 1c). These boundaries are site specific, and slightly different values are expected for other sites.
- 5.
Find the active peak daytime number concentration for each day. The active peak concentration corresponding to a given day is determined based on the max value of N2.5−5 in the so-called active region. Note that the N2.5−5 time series has been previously smoothed to a 2 h rolling median (step 2), and this will impact the maximum value. For Hyytiälä, the active time window is between 06:00 and 18:00 (Fig. 1d).
- 6.
Determine the change in number concentration (ΔN2.5−5) for each day. This value is defined as
and it is the metric used to characterize the strength of potential NPF occurrence for the corresponding day (Fig. 1d).
- 7.
Rank and group the days. Rank the days in percentiles based on their corresponding value of ΔN2.5−5 and group the days based on 5 % intervals (Fig. 2) to assess the corresponding potential NPF pattern of each interval.
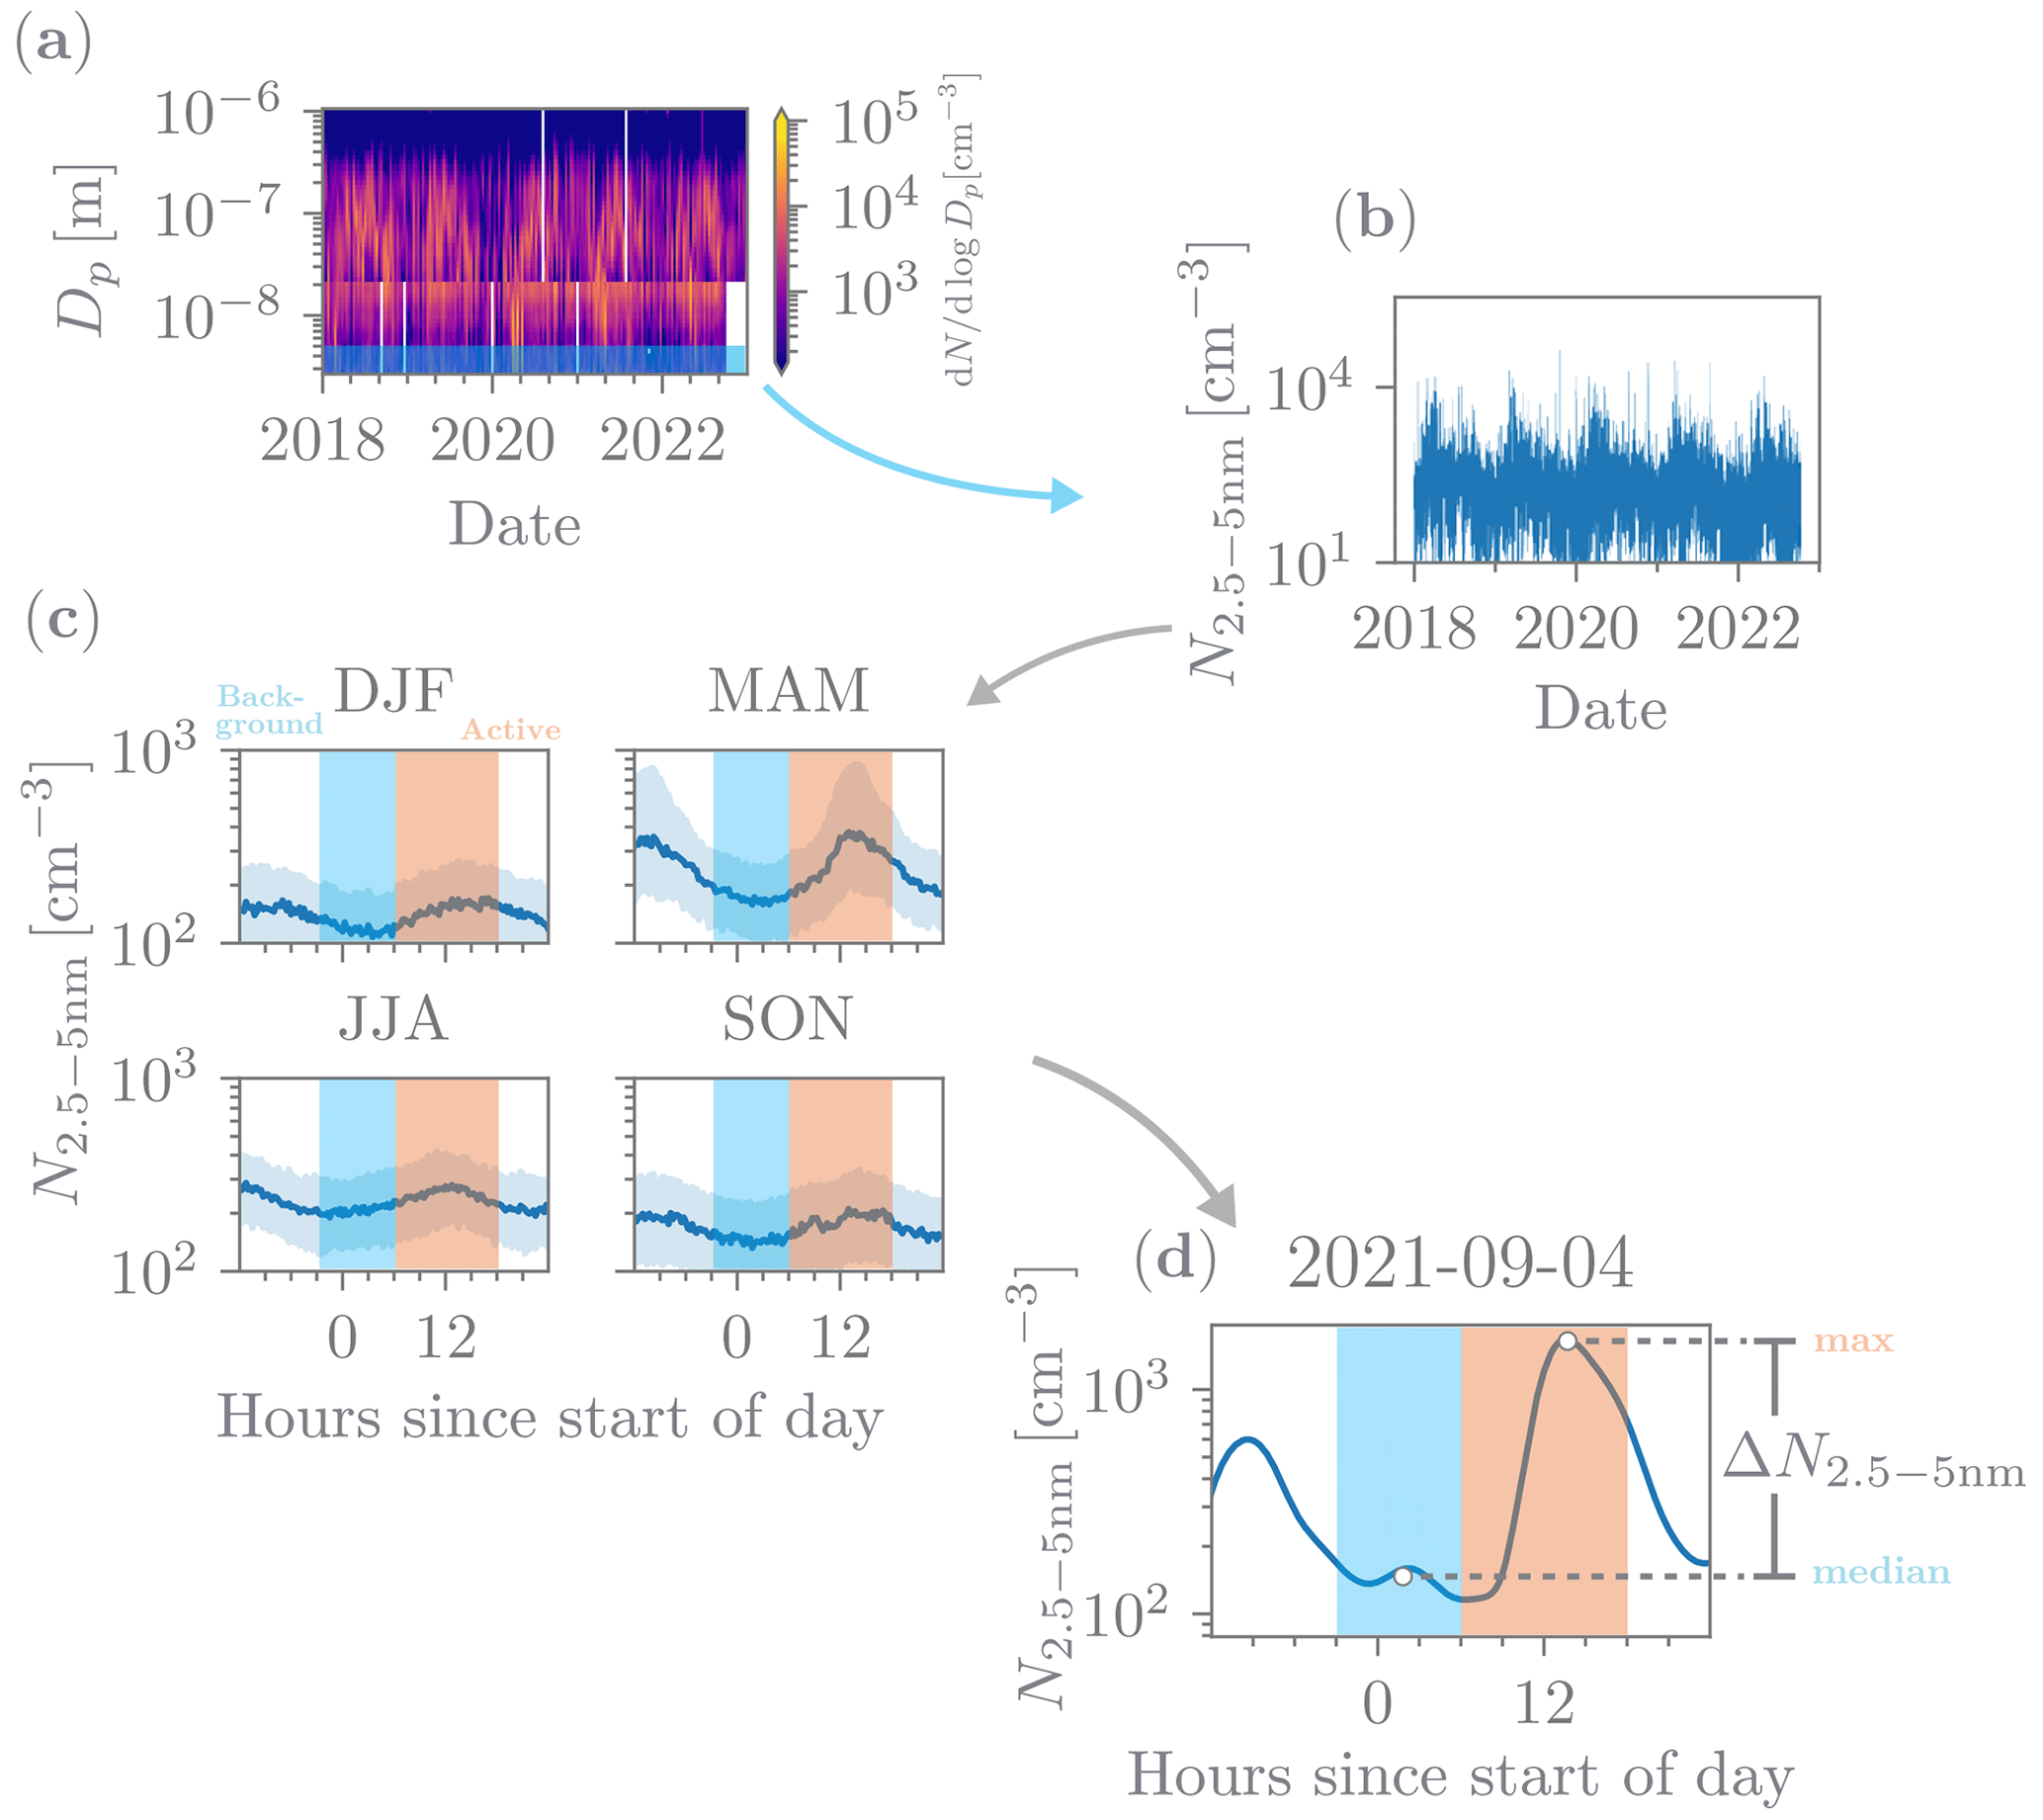
Figure 1Diagram illustrating the process used to calculate the ΔN2.5−5 metric. The methodology involves extracting particle concentrations in the 2.5 to 5 nm range (b) from the particle number size distribution time series (a), followed by grouping the time series by season and plotting daily patterns identifying the background and active zones (c). The final step calculates the daily difference for each day – here exemplified by 4 September 2021 – between the maximum concentration in the active region and the median concentration in the background region (d).
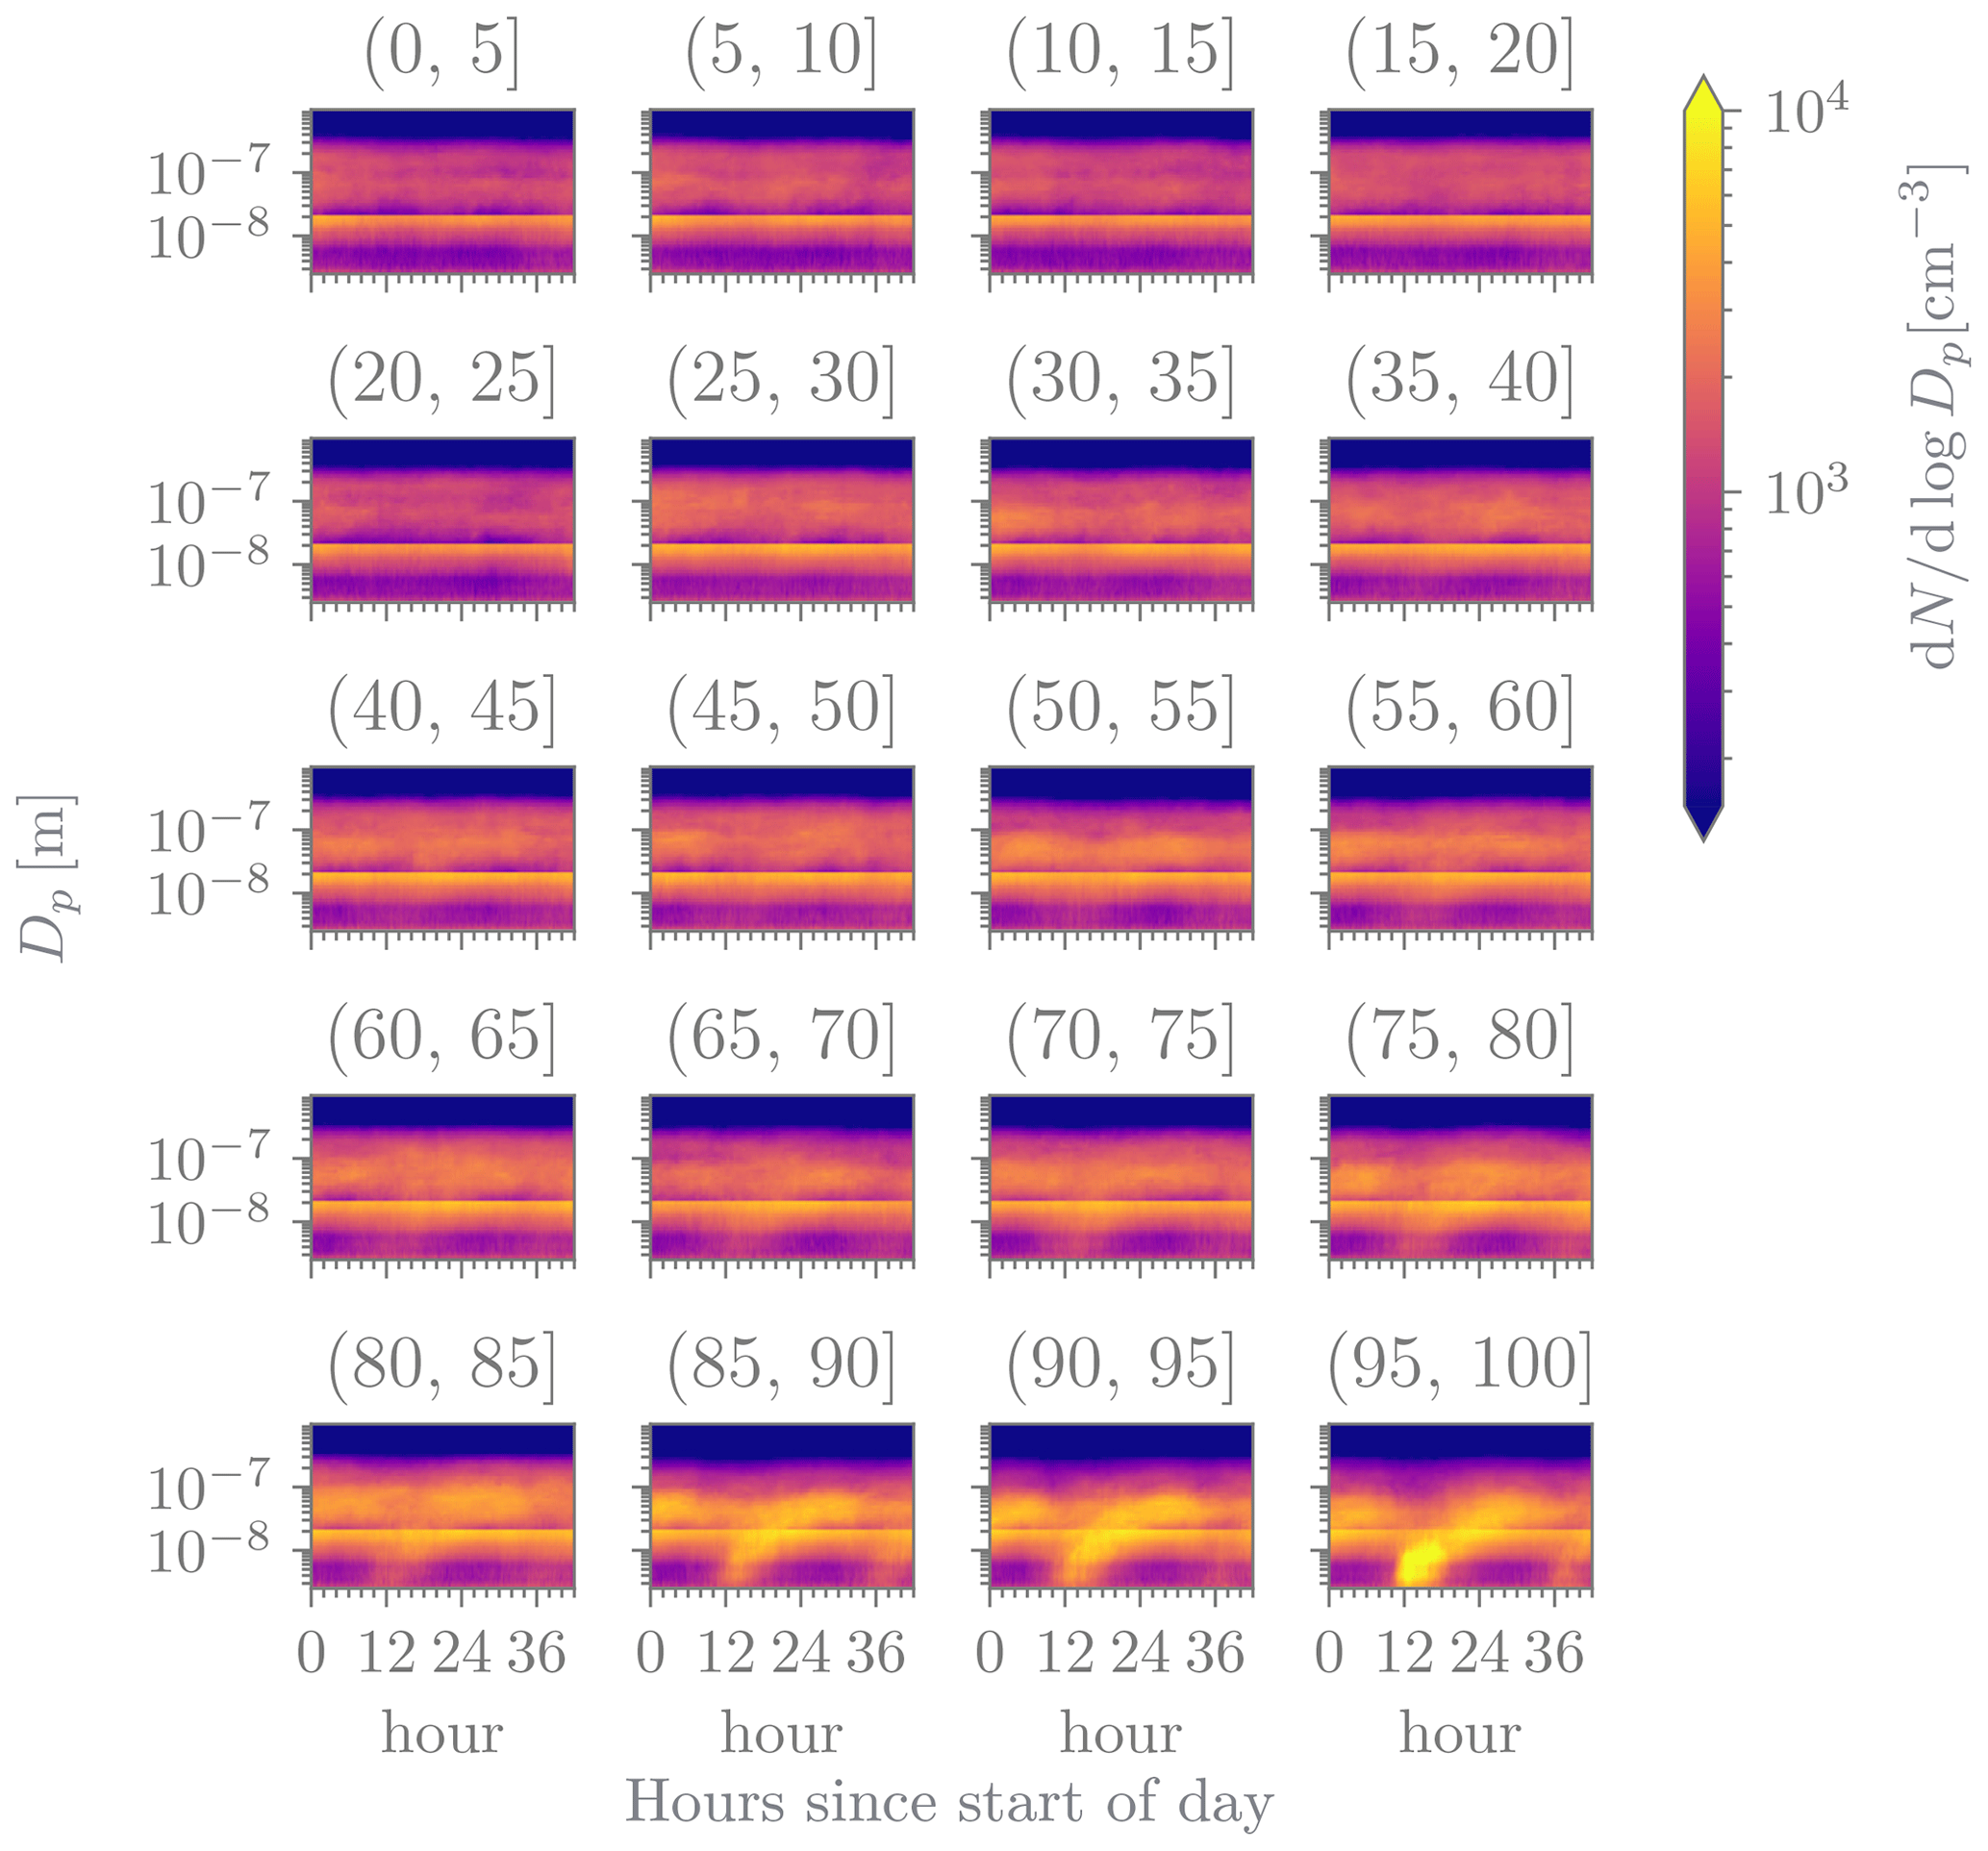
Figure 2Daily median number particle size distributions grouped into 5 % intervals based on the ΔN2.5−5 ranks. The diameter limits (y axis) in the surface plots are 2.5 and 1000 nm and are used to illustrate the shape of the potential NPF events in each interval. For illustration purposes, the particle number concentrations obtained from the neutral cluster and air ion spectrometer (NAIS, 2.5–20 nm) and the differential mobility particle sizer (DMPS, 20–1000 nm) are combined.
2.1.2 NPF mode fitting
The log (ΔN2.5−5) distribution can be used to identify NPF modes based on their intensity. The procedure is as follows: first, the log (ΔN2.5−5) distribution is depicted (Fig. 3a), and a visual assessment is made to determine the number of Gaussian curves needed to describe the distribution – in our case, three curves. Next, the distribution is fitted using three Gaussian functions (g1, g2, g3). Initial guesses for the Gaussian's centre, width, and amplitude as well as their allowed range in the fitting algorithm are provided based on visual inspection. The division between these groups is determined by finding the midpoint between the centres of two subsequent Gaussians (Fig. 3, dashed line). The intensity of NPF events is assessed within each group by plotting the diurnal median particle number size distribution (Fig. 4, third row) so that both visual (Fig. 4, first row) and statistical (Fig. 4, second row) inspections of the diurnal variation of N2.5−5 can be performed for each group.
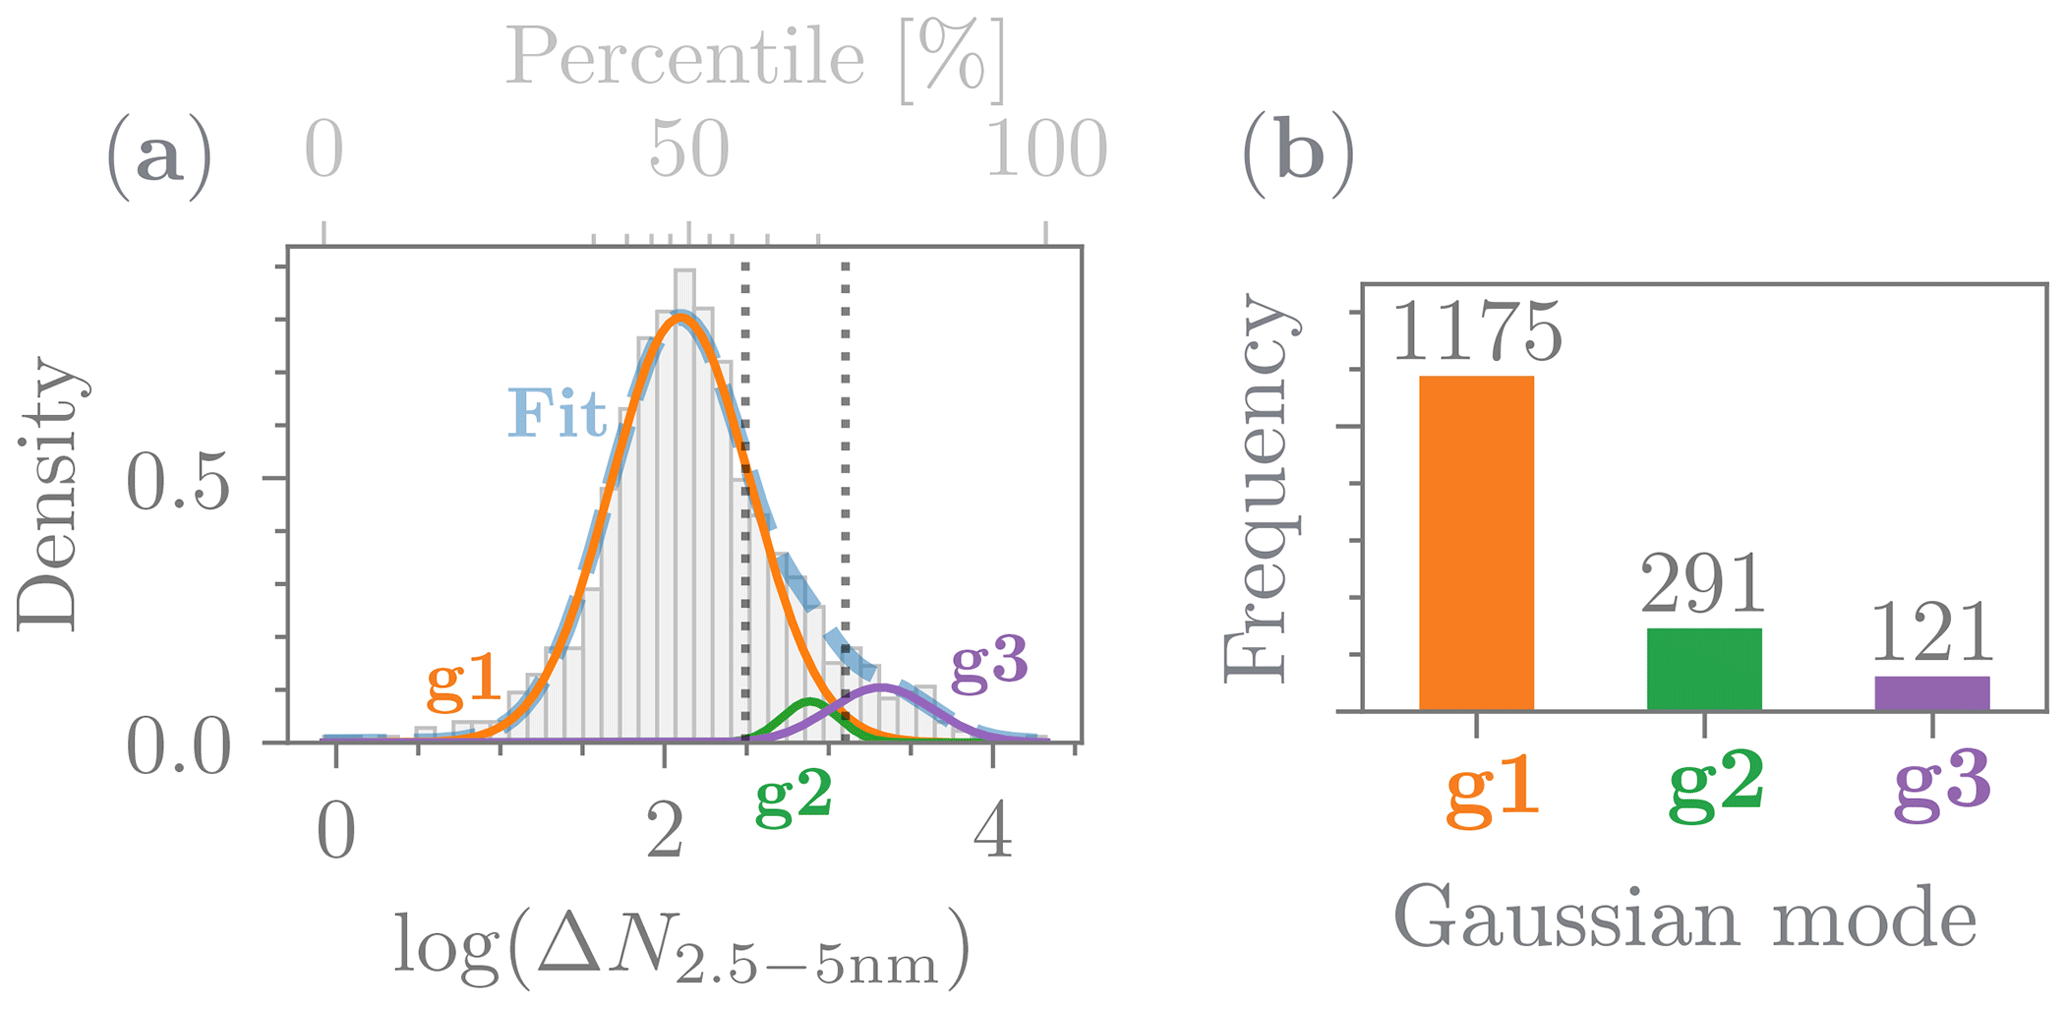
Figure 3(a) Density histogram (grey) based on the daily log (ΔN2.5−5) values. Additionally, three Gaussian curves (g1, g2, g3) are fitted (sky blue) to the distribution. (b) Number of days belonging to each of the identified Gaussian curves in panel (a). The regions corresponding to each group are determined by calculating the middle distance (dashed lines) between adjacent Gaussian curve centres.
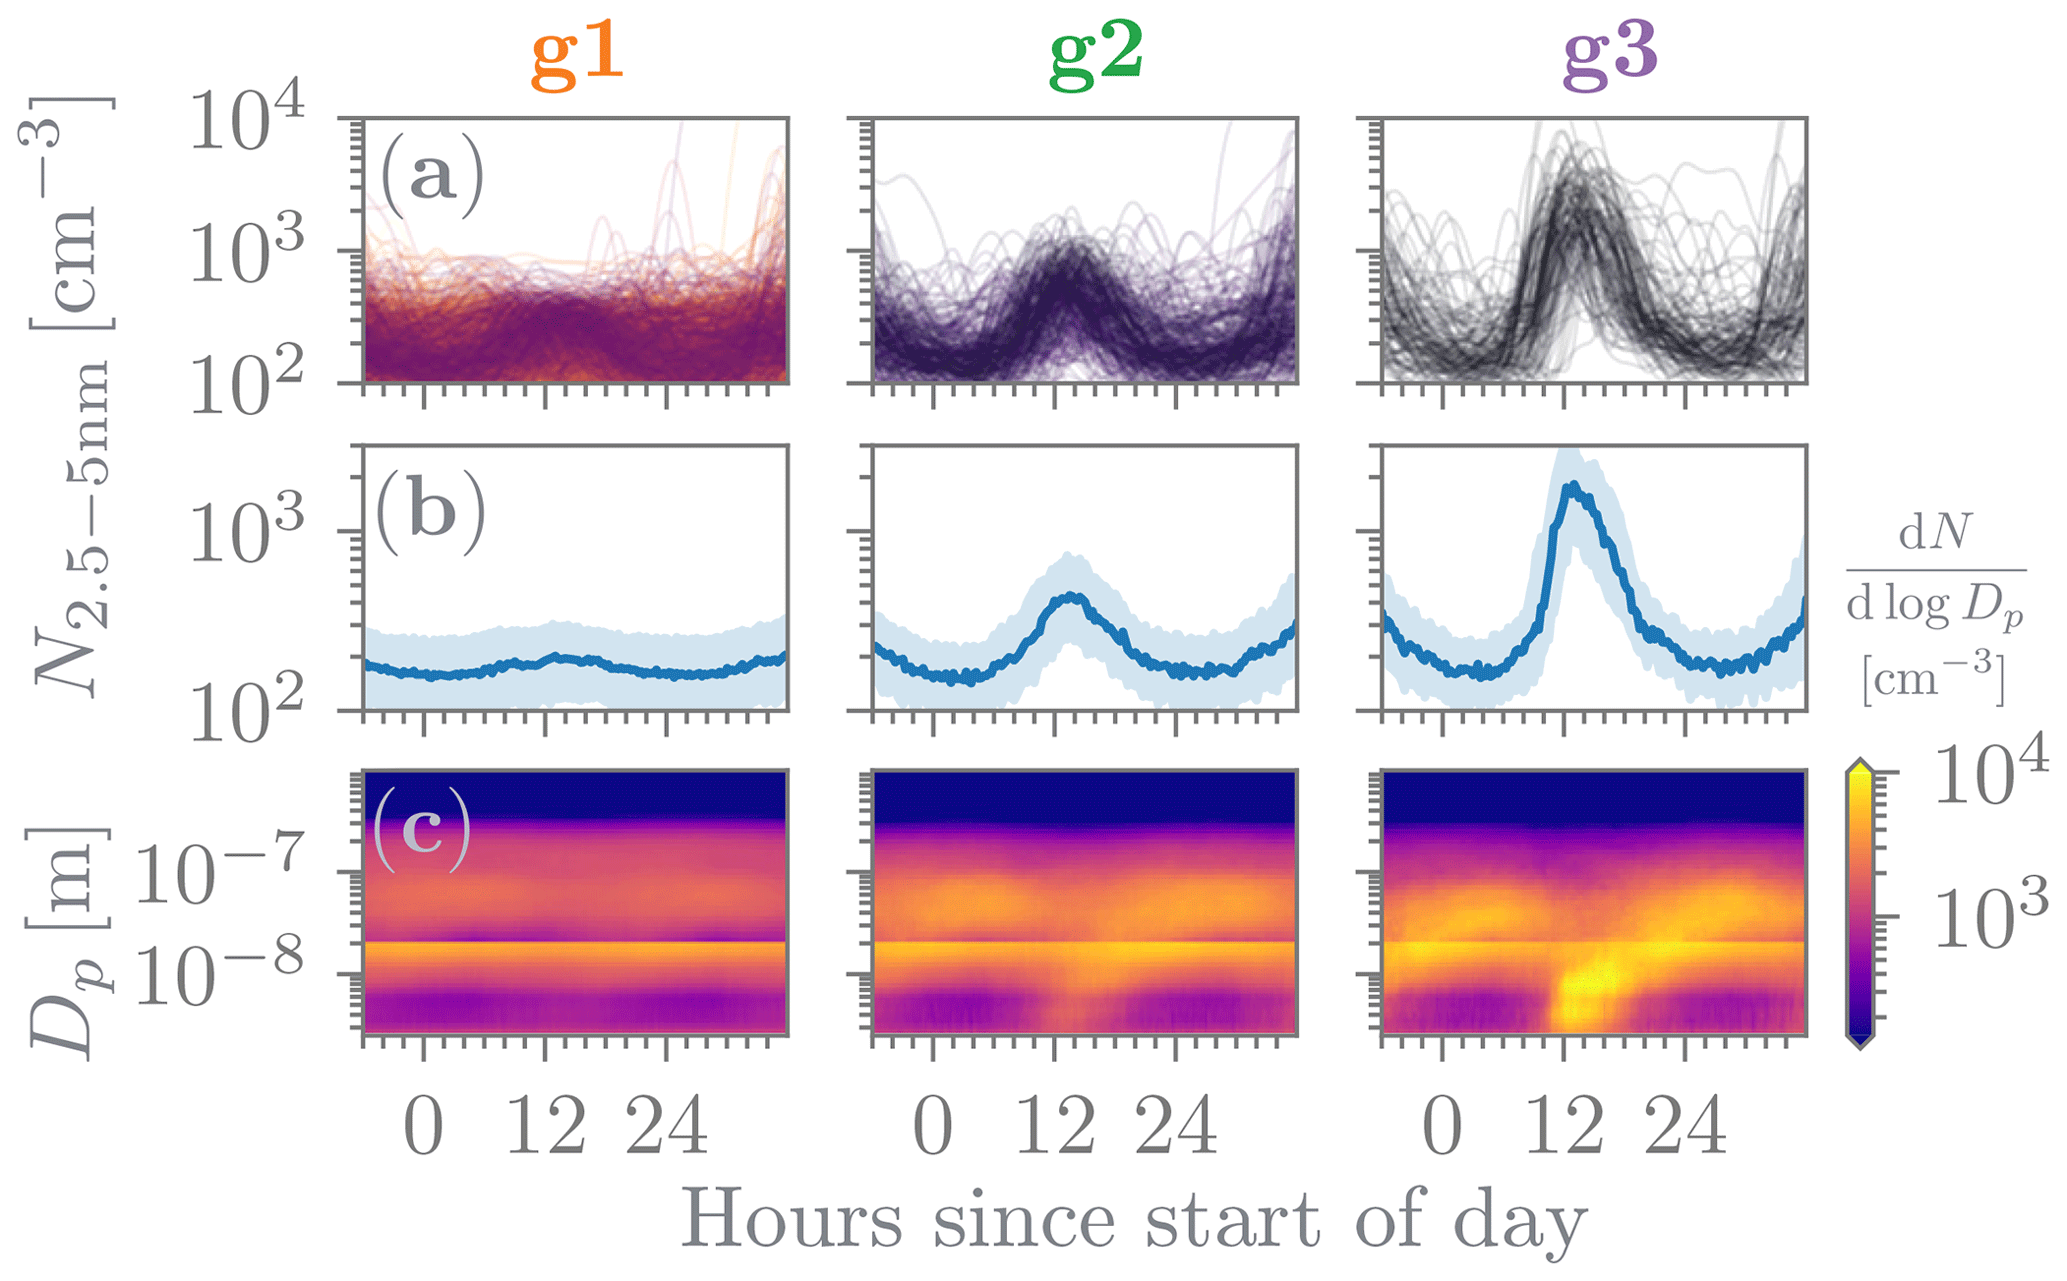
Figure 4The first row displays the daily curve of particle concentrations in the range of 2.5 to 5 nm, grouped into three columns: g1, g2, and g3. The second row shows the median and interquartile range of the daily curves shown in the first row. The third row presents the median particle number distribution for the days belonging to each group g.
2.2 Description of the dataset
2.2.1 Site description
All the measurements were conducted at the Station for Measuring Ecosystem–Atmosphere Relations (SMEAR) II, in Hyytiälä, southern Finland (61∘51′ N, 24∘17′ E; 181 m a.s.l.; Hari and Kulmala, 2005; Hari et al., 2013). The SMEAR II station is located in a boreal pine forest, in a rural environment. The nearest large city is Tampere, located approximately 60 km southwest of the station, with a population of around 200 000 residents. Additionally, comprehensive observations of trace gases and soil–atmosphere fluxes, as well as meteorological variables, have been concurrently conducted at the site. More details about the station can be found from Hari and Kulmala (2005).
2.2.2 Neutral cluster and air ion spectrometer (NAIS)
We used data from the NAIS (neutral cluster and air ion spectrometer, Airel Ltd; Mirme and Mirme, 2013). The NAIS measures the number size distributions of ions and total particles in the electrical mobility diameter ranges 0.8–42 and 2.5–42 nm, respectively.
The NAIS has two measurement columns operating in parallel, one for each polarity. During ion measurements, the positive and negative ions are simultaneously measured in the two columns. During particle measurements, aerosol particles are charged to opposite polarities using corona chargers and simultaneously measured in both columns. The particle data below about 2 nm are contaminated by charger ions and are not included in the measured size range for particles. Air ions and charged particles are separated based on their electrical mobilities and detected in a multichannel differential mobility analyser (DMA).
Particle number size distribution (PNSD) data from the negative polarity were used, and the number concentrations of total particles between 2.5 and 5 nm were determined based on interpolation. The number concentrations of 2.5–5 nm particles were used in the nanoparticle ranking analysis presented in this study. A visual screening process was performed to identify and remove faulty or rain- or snow-contaminated measurements from the dataset (11 removed days).
2.2.3 Differential mobility particle sizer
The differential mobility particle sizer (DMPS) measures both the neutral and charged PNSDs (Aalto et al., 2001). A typical DMPS setup contains a bipolar charger to assess the equilibrium charge distribution, a DMA (differential mobility analyser) to sample particles at specific particle sizes, and a CPC (condensation particle counter) to measure particle number concentrations.
At the Hyytiälä site, the measurements are taken with a twin-DMPS system consisting of two separate DMPSs operated in parallel. The first DMPS determines the size distribution of small particles, 3–50 nm in diameter, and the other measures larger particles, 15–1000 nm in size. Together they cover the size range of 3–1000 nm. The CPCs used for particle counting are a TSI-3025 and a TSI-3010 (TSI Inc.), respectively. Both DMPSs contain a dryer at the inlet, with a continuous sheath flow with a relative humidity below 30 % to enable measuring the particle size under relatively dry conditions. The measurement height of the DMPS system is at ground level at the station (∼ 2 m), and the time resolution of the measurements is 10 min. The DMPS outputs were inverted following the normal pseudo-inversion routine with DMA kernels (Stolzenburg, 1988). The inverted outputs were used for visualization of the nanoparticle ranking analysis percentile bin separation (Fig. 2), as well as for the traditional NPF event classification and calculations of particle formation rates.
2.2.4 Traditional event classification
We compare the ranks from the nanoparticle ranking analysis with the traditional NPF event classification (see Sect. 3, Fig. 7) introduced by Dal Maso et al. (2005). The traditional event classification categorizes days into NPF event days, undefined days, and non-event days by visually analysing the particle number size distribution data from a DMPS on a day-to-day basis. This classification procedure characterizes NPF events by the growth of a new mode of particles in the sub-25 nm range over a time span of hours. Additionally, the classified NPF events are divided into three sub-classes (events Ia, Ib, and II) based on the level of confidence determined by particle growth and formation rates. A detailed description of the traditional NPF event classification can be found in Dal Maso et al. (2005).
2.2.5 Particle formation rate (J) calculations
The particle formation rates () describe the flux of growing particles past some diameter and were calculated following the scheme described in Kulmala et al. (2012). The formula is shown below:
where the first term stands for the observed time derivative of particle number concentration calculated from particle number size distributions (PNSD) from DMPS measurements. In our case, we chose i and u such that nm and nm. The second term describes the coagulational scavenging which considers the sum of coagulation sinks of particles from each size bin where K is the coagulation coefficient of particles in the size and . The sum is over all bins from the DMPS between and nm. A correction factor for particle hygroscopic growth is applied when calculating coagulation sinks as described by Laakso et al. (2004), who developed a hygroscopic growth factor specifically for Hyytiälä as a function of measured relative humidity. This method can increase the accuracy when estimating the coagulation sink of particles over different sizes, where their hygroscopic properties also differ.
The last term in Eq. (2) accounts for particle losses due to growth into larger sizes. We used the maximum concentration method described in Kulmala et al. (2012) to calculate the particle growth rate GR3,7) from days that were classified as having NPF events (events Ia, Ib, and II) based on the guideline illustrated in Dal Maso et al. (2005), which is briefly discussed in the previous section. Since determining individual growth rates for non-event days is not possible with the existing methods, we determined the GR for non-event days by calculating a median GR3,7) based on the method described by Kulmala et al. (2022a). This method first takes the diurnal median PNSD for all non-events and then normalizes each size bin by the maximum value of that bin, thus revealing the hidden growing mode for these non-event days (same normalization is used in Fig. 9). This procedure allows for the quantification of the growth rate and subsequently the calculation of J3 for each individual non-event day. In short, for non-event days, we follow the same procedure used to calculate event-day J3 except that instead of using the GR3,7) for a specific day – which cannot be calculated for single non-event days – we use the median GR3,7) of all non-event days. As comparison, the median GR3,7) values for event and non-event days were 5.1 and 3.6 nm h−1, respectively.
In this section, we present the findings of our research derived from nanoparticle ranking analysis. We focus on the comparison between the ΔN2.5−5 metric – either directly or via its ranks – and traditional parameters in the study of NPF. Specifically, we examine the comparison of ΔN2.5−5 and diurnal N2.5−5 concentration patterns (Fig. 5), new particle formation rates (Fig. 6), traditional classification of events (Fig. 7), and seasonality (Fig. 8). Finally, we apply the normalization proposed by Kulmala et al. (2022b) to reveal quiet NPF patterns in the percentile interval bins (Fig. 9). These results provide valuable insights into the effectiveness and applicability of our proposed metric in capturing key aspects of NPF dynamics.
Figure 5 shows the median particle number concentrations N2.5−5 for different hours of the day and for different intensity rank values. We can see that the concentration profile throughout the day is relatively similar for rank values approximately below 50 % with little variation in N2.5−5. However, for ranks above 50 % slight increases in N2.5−5 during daytime hours are observed. As the rank increases, values of N2.5−5 are correspondingly higher. In addition, increased daytime particle concentrations last longer for days with higher intensity ranks. For example, for rank values of 85 %–90 % the increased concentrations are mainly present between 12:00 and 18:00, while for rank values of 95 %–100 % they last 2 to 3 h longer, from approximately 11:00 until 19:00–20:00. Figure 5 shows how the analysis method presented can be used to study the particle concentrations as well as hours of the day during which NPF potentially takes place.
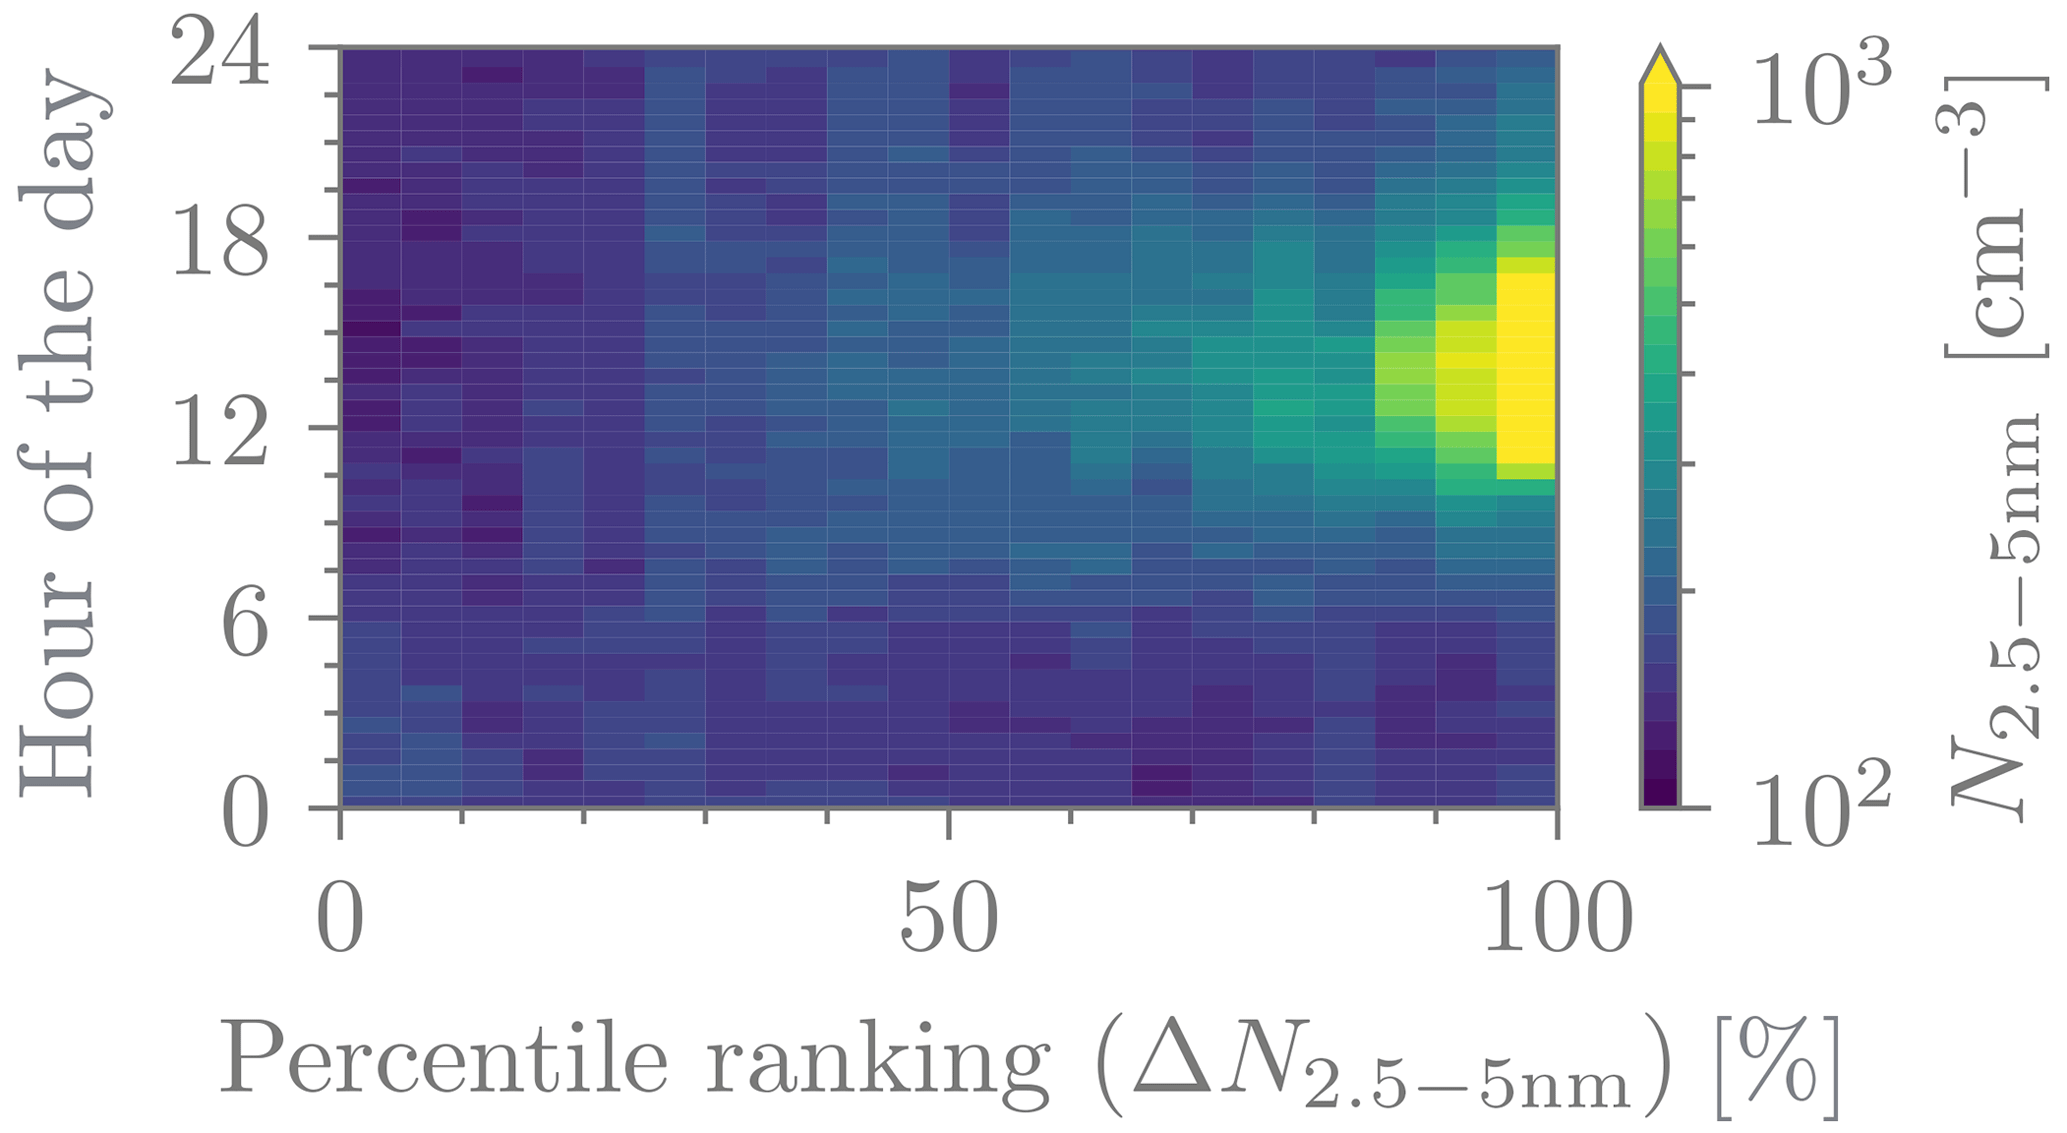
Figure 5Median 2.5–5 nm particle number concentrations (N2.5−5 nm) for different times of the day and for different percentile ranking values, which were based on ΔN2.5−5 nm. The percentile rankings have been divided into 5 % intervals, while hourly time resolution was used.
Figure 6a and b show the particle formation rate, J3, as a function of ΔN2.5−5 and of the percentile ranking, respectively. The value of J3 clearly increases with increasing ΔN2.5−5 and, as a result, with an increasing percentile ranking. J3 is the highest in group g3 and the lowest in group g1. In group g1, corresponding to percentile rankings smaller than about 70 %, average values of J3 slowly increase with increased rank. In group g2, and especially in group g3, the increase of J3 with increasing rank is stronger. The majority of cases with J3 larger than 0.1 cm−3 s−1 occur when the percentile ranking is larger than 80 %, with these values mostly belonging to groups g2 and g3. Therefore, Fig. 6 illustrates the clear connection of ranking with intensity of atmospheric NPF. If the percentile rank of the day is high, the intensity of NPF can also be expected to be relatively high.
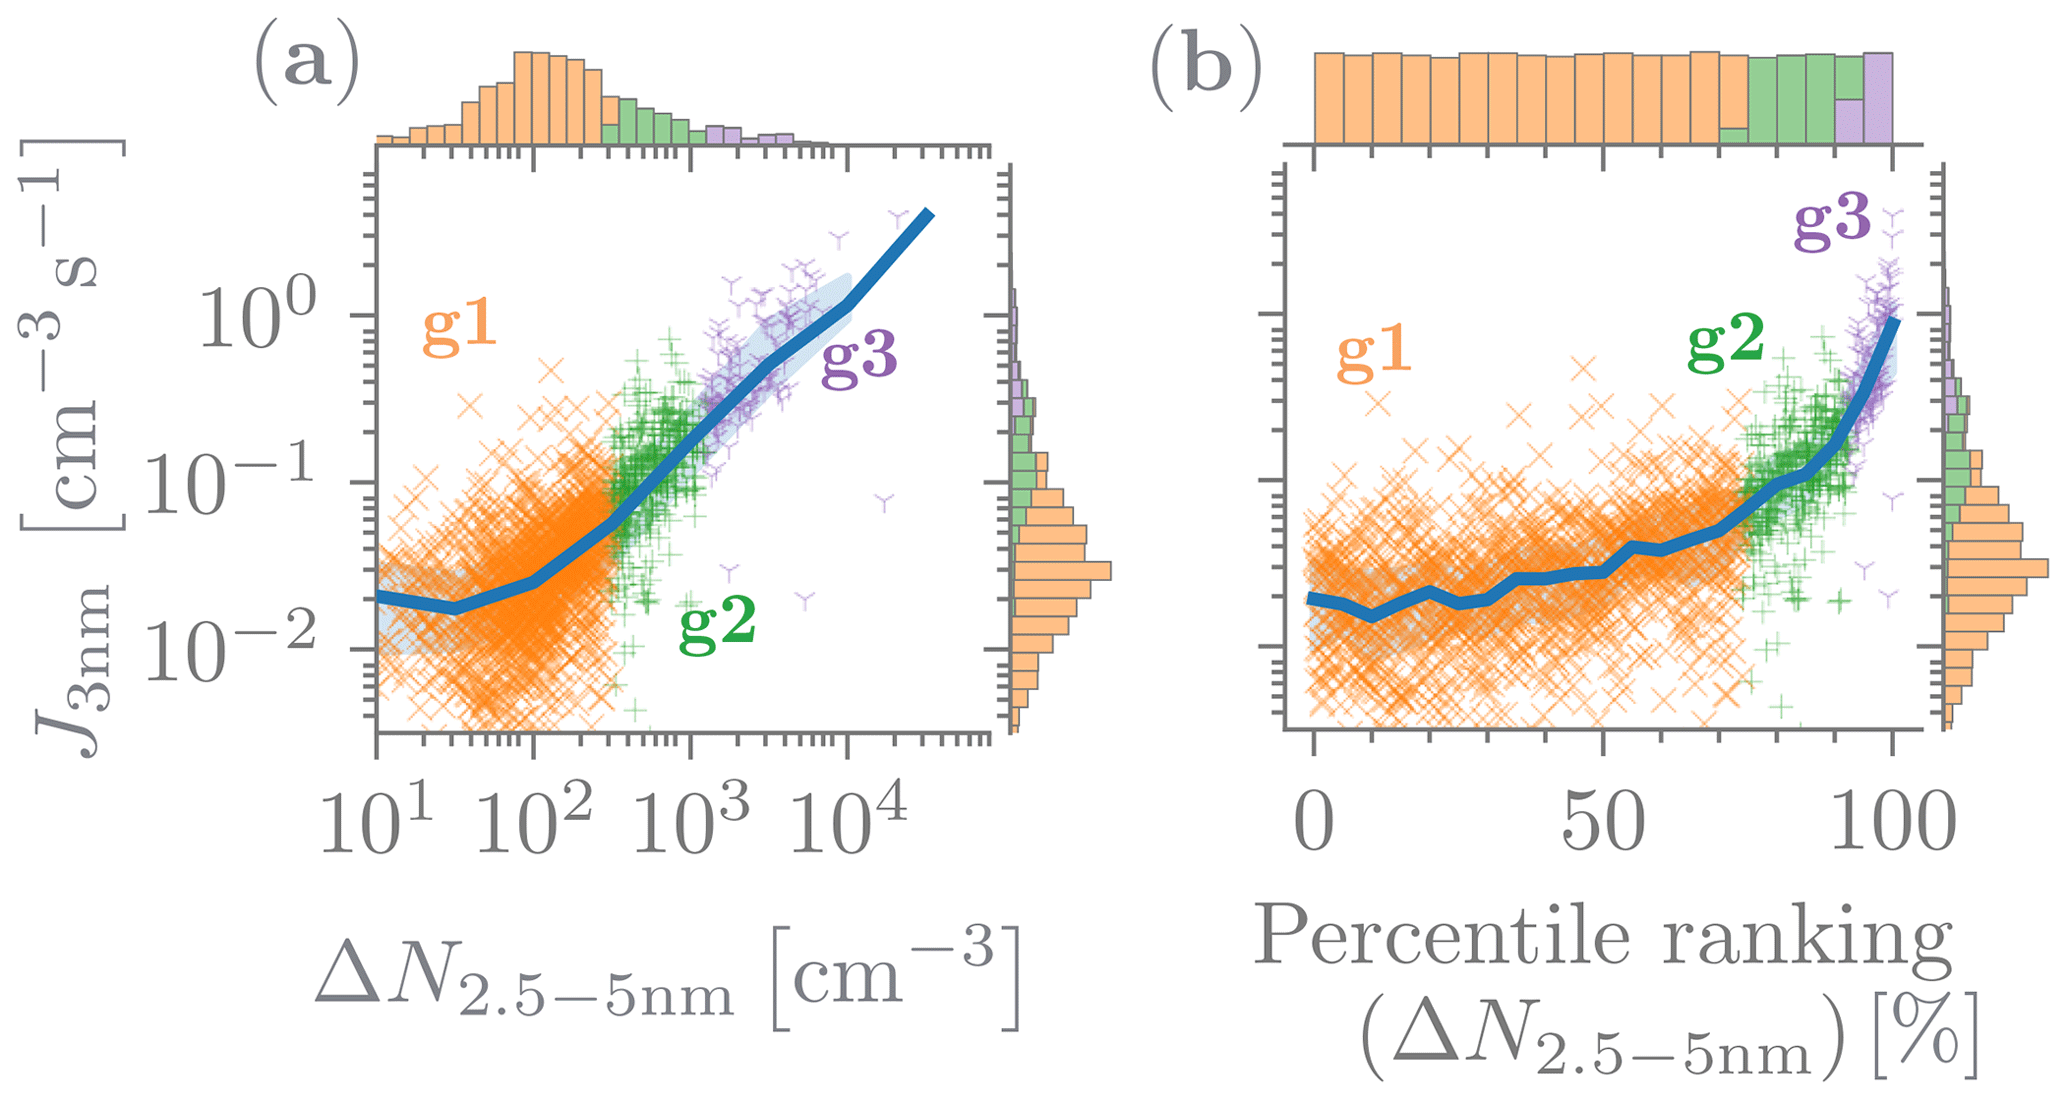
Figure 6(a) Daily ΔN2.5−5 (x) vs. J (y) colour-coded by group g. The blue line represents the median, and the shaded region indicates the interquartile range. At the top of the panels, histograms of ΔN2.5−5 values are presented, while on the right-hand sides histograms of J values are shown, both colour-coded by group g. (b) Similar to panel (a) but using percentile ranking instead of ΔN2.5−5.
Previously, studies of continuous variables and their effect on NPF have been constrained by a binary division of days into NPF event and non-event days. Figure 6 demonstrates that the novel nanoparticle ranking analysis presented here can be compared with continuous variables, such as the particle formation rate, in investigating NPF. In this case, we use the day's maximum J3 and compare it to its corresponding ΔN2.5−5 (Fig. 6a) and percentile ranking (Fig. 6b). For the location and dataset considered here, this daily J3 maximum in general corresponds to a time window similar to or very close in time to the time when the max N2.5−5 (Fig. 1d) is found for each individual day. It should be noted that, in addition to NPF, the value of ΔN2.5−5, and thus the intensity rank, can be affected by factors such as coagulation sink, other sources of sub-5 nm particles, and ion or particle production associated with, for example, rain. In our case, the days included in our analysis were visually screened for precipitation to account for this. As a result, while the presented method characterizes NPF intensity statistically, some individual days might have lower NPF intensity than their corresponding rank would suggest.
Figure 7 shows the distribution of different NPF event classes, as per the traditional classification scheme, for the different percentile rankings. The number of days classified as non-events is the highest when the rank is close to zero, and most of the days with ranks below 50 % are classified as non-event days. The number of non-event days decreases with an increasing rank value, such that only a couple of days above the percentile rank of 90 % are classified as non-event days, representing a marginal fraction of all the days. The fraction of days classified as NPF event days starts to clearly grow after the percentile ranking is over 65 %. However, in Hyytiälä most days are classified as NPF event days only for percentile rankings larger than 85 %. In conclusion, Fig. 6 illustrates the connection of the proposed ranking method with the intensity of particle formation, and Fig. 7 illustrates its connection with the probability of the occurrence of atmospheric NPF events.
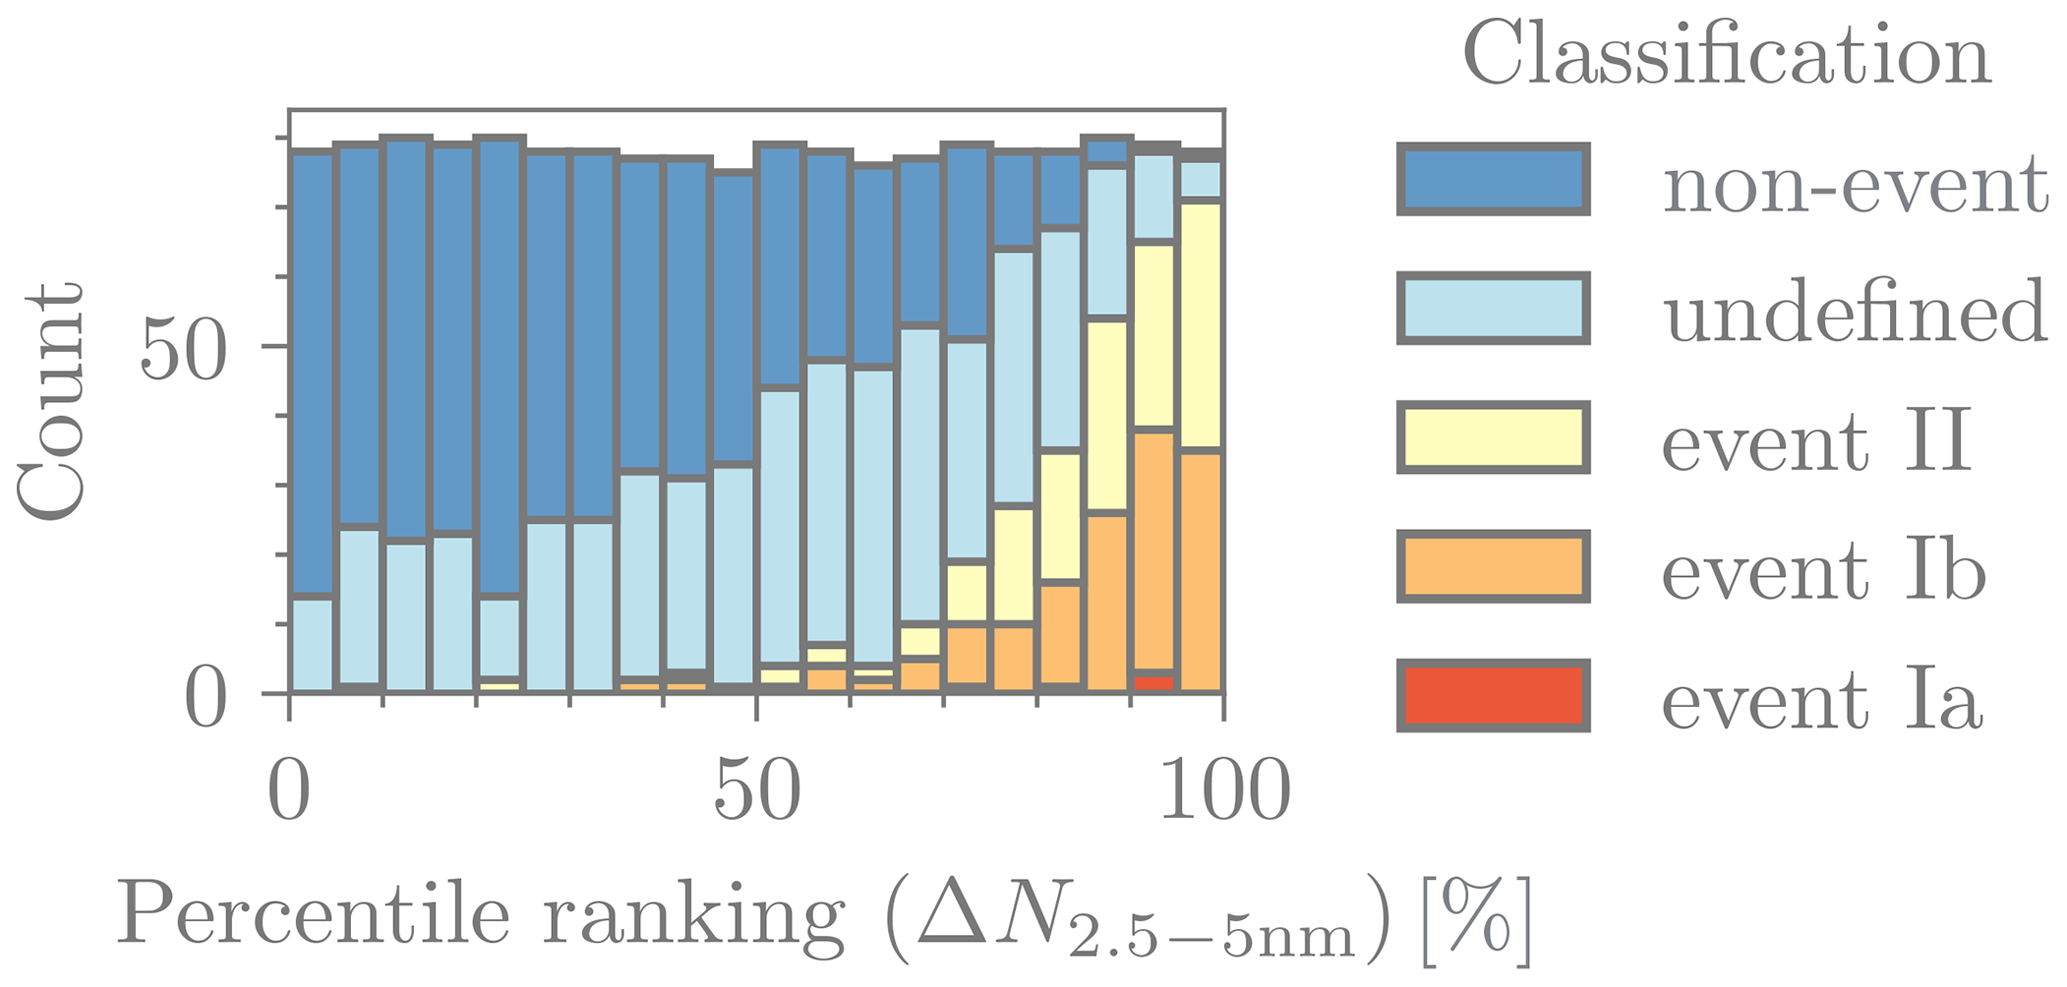
Figure 7Comparison between percentile ranking and traditional classification. This histogram displays the percentile rankings divided into 5 % bins and colour-coded based on the classification: blue (non-event), light blue (undefined), yellow (event II), orange (event Ib), and red (event Ia).
Figure 8 highlights the benefits of utilizing a continuous variable, such as ΔN2.5−5, to characterize new particle formation. This continuous nature enables the application of techniques like a rolling median filter, which is exclusive to non-categorical variables. In the figure, each red point represents a day, while the blue curve results from a 30 d rolling median. This representation distinctly reveals the seasonality of NPF occurrence, indicating a heightened intensity and/or occurrence probability during spring. Employing a categorical classification for NPF events would complicate this analysis considerably. Lastly, as illustrated in Fig. 9, the combination of the normalization method proposed by Kulmala et al. (2022b) and the percentile bin intervals (as shown in Fig. 2) significantly enhances the visibility of NPF event patterns, even in ranges that precede those depicted in Fig. 2. A well-defined NPF event pattern becomes observable starting from the rank of about 55 %, with a less obvious pattern discernible starting from the ranks of about 25 %. Moreover, the observation that each successively higher interval reveals an increasingly distinct NPF event pattern strongly suggests that nanoparticle ranking analysis effectively orders these events, even when they initially seem indistinct.
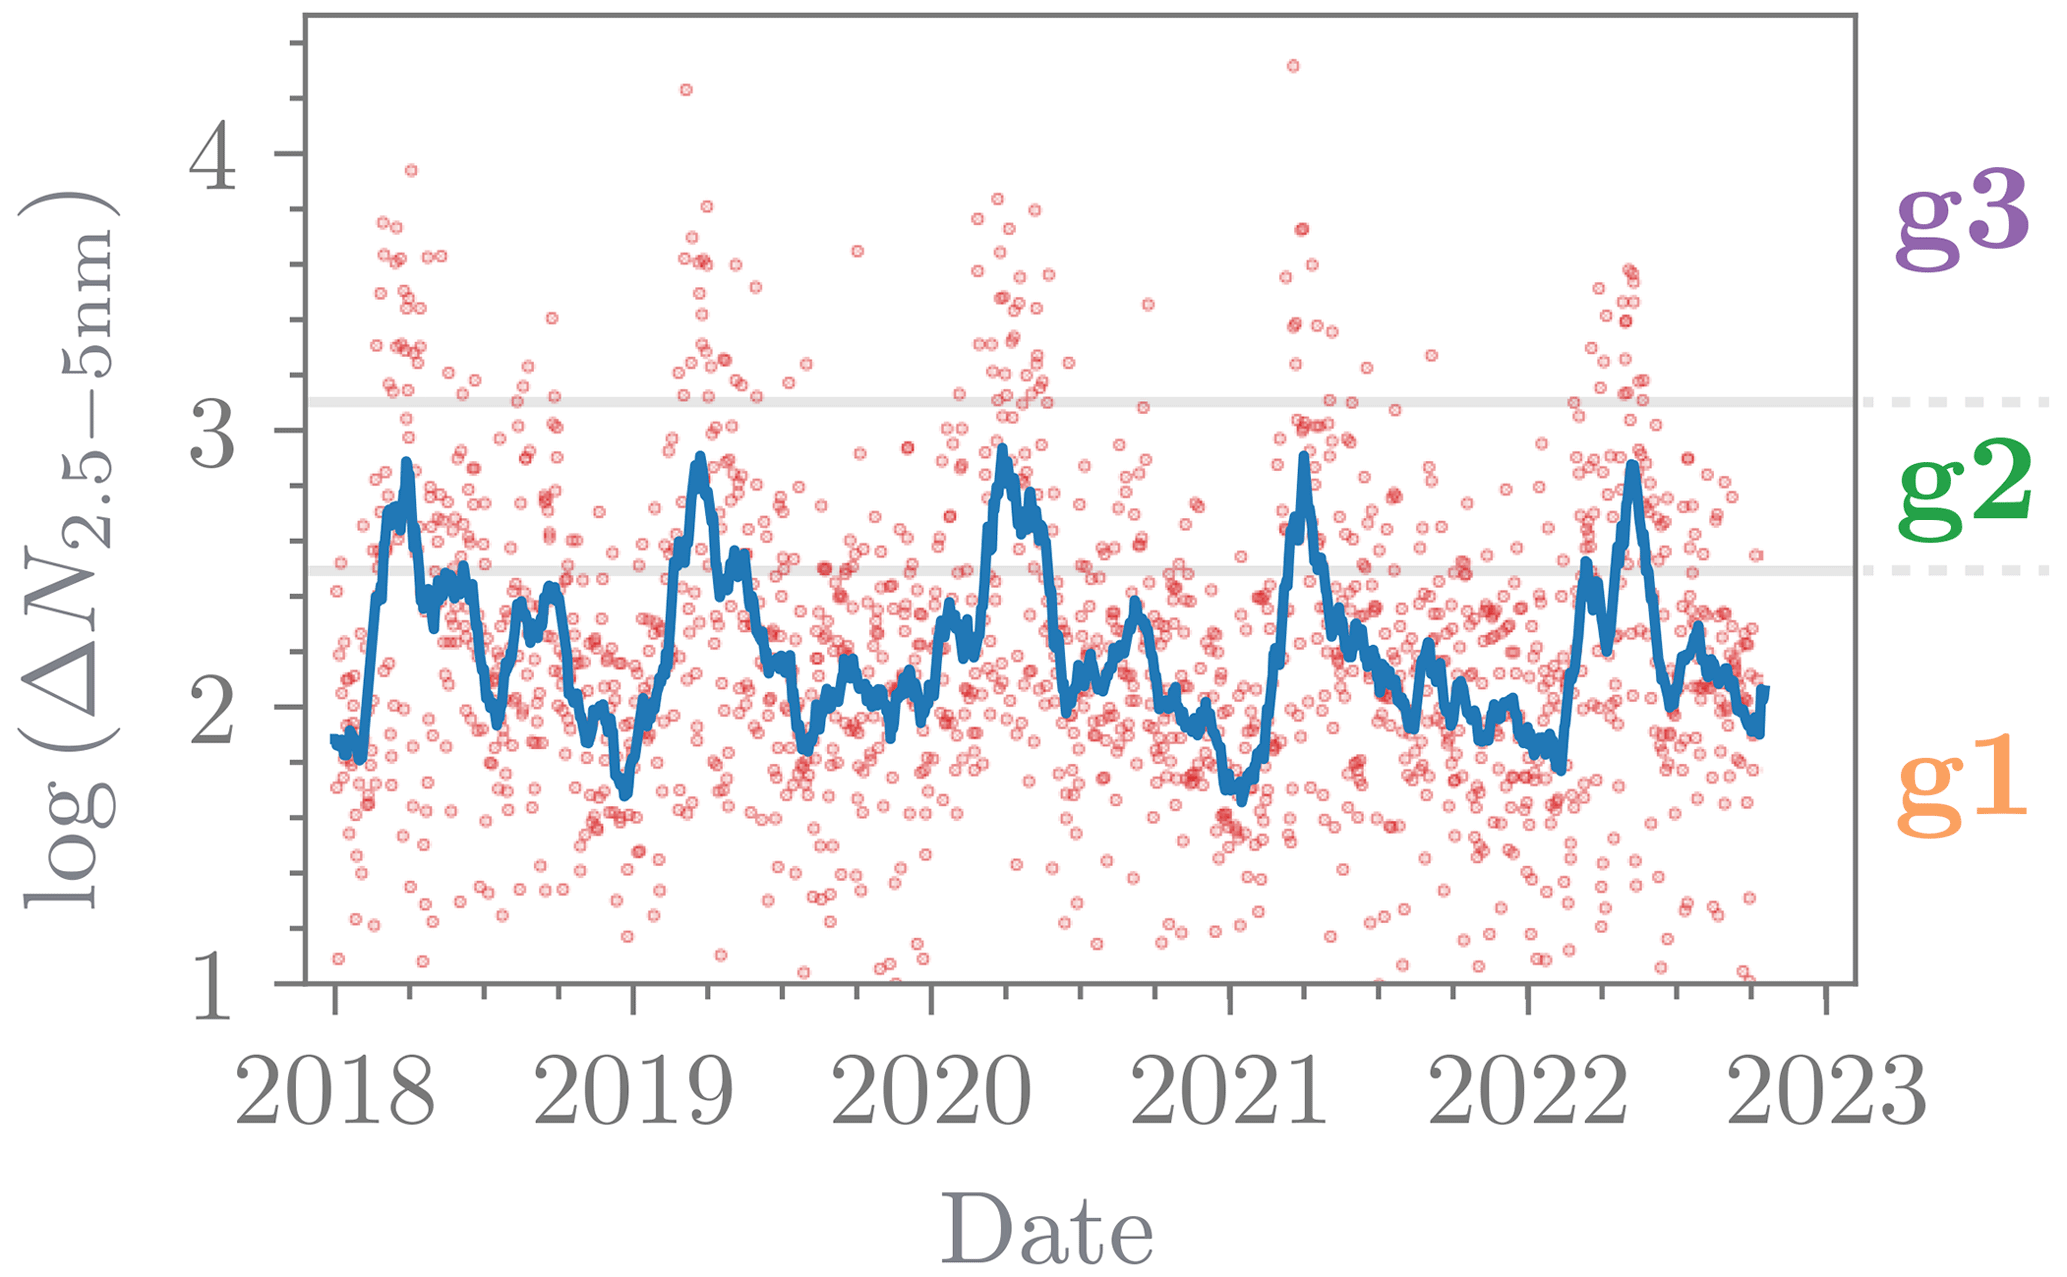
Figure 8Daily time series of ΔN2.5−5. The red dots represent the daily values, while the blue line shows the 30 d rolling median. The shaded areas delineate the regions corresponding to the modes g1, g2, and g3.
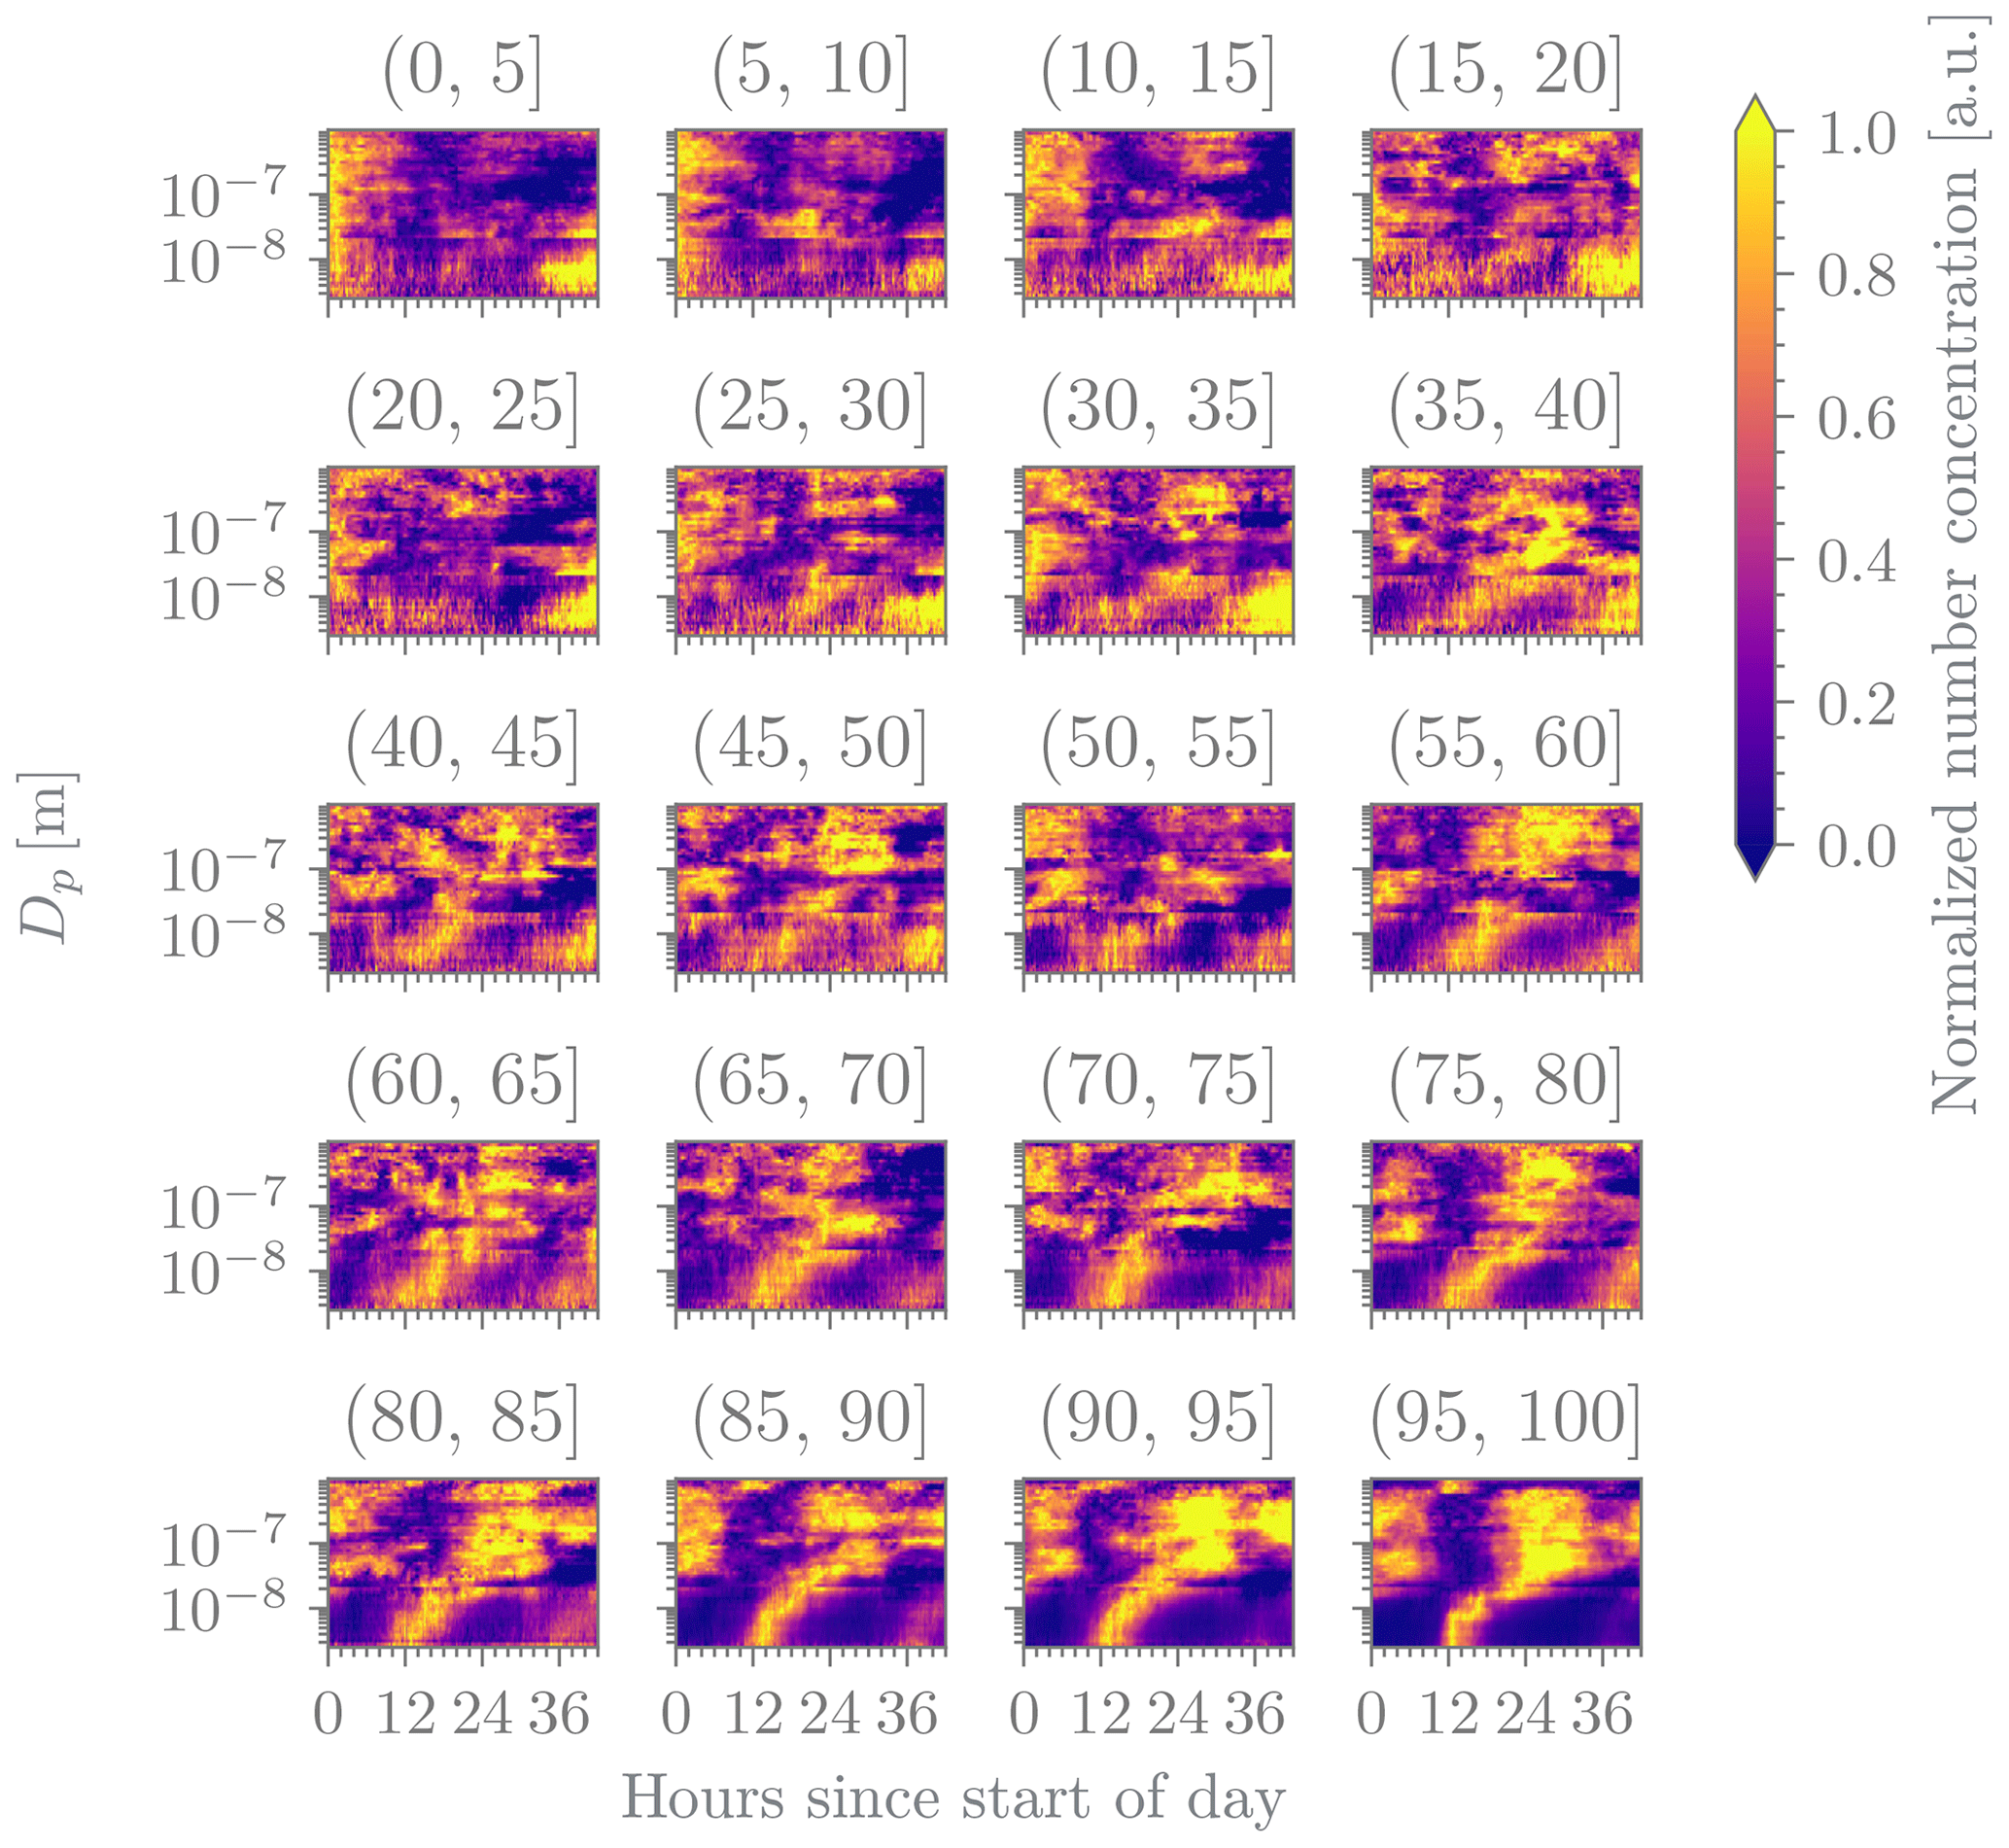
Figure 9Similar to Fig. 2 but using the normalization proposed by Kulmala et al. (2022b). In short, for every 5 % interval, each size bin is linearly scaled based on its median, maximum, and minimum so that values span from 0 to 1.
Finally, the modes derived from the distribution of log (ΔN2.5−5) may indicate distinct sources, including regional, meteorological, or emissions-related factors. It is crucial to contrast these findings with available precursor gases, transport patterns, and meteorological variables. Further studies applying this methodology in various scenarios will provide insights into, and guidance for, effectively implementing this new metric.
Now we address potential limitations of the proposed NPF metric (ΔN2.5−5). It is important to acknowledge that the high values in this metric could be influenced by factors such as pollution or by ions or particles produced by either rain (Wimmer et al., 2018) or blowing snow (Chen et al., 2017). On the other hand, a similar formation rate of new particles will result in a lower concentration of 2.5–5 nm particles when the coagulation sink is higher, as a larger fraction of the formed particles are scavenged by the pre-existing particles (e.g. Kerminen and Kulmala, 2002; Lehtinen et al., 2007). Consequently, an event with a high NPF ranking may not necessarily correspond to an atmospheric NPF event (in case of rain or other particle sources), and, likewise, both intensity and rank of any NPF event may be influenced by varying background aerosol conditions. However, no NPF event classification scheme or metric method is entirely exempt from errors, and the observation of NPF events is always dependent on measurement instruments (their size range and noise level) and whether the formation rate is high enough to produce an observable increase in particle concentrations over the influence of coagulation sink and other sub-5 nm particle sources. Depending on the dataset, one may want to filter out such influencing factors before applying nanoparticle ranking analysis, e.g. by manually removing all days with rain (as done in this study) or blowing snow or by carefully choosing the background region so that the effects of polluted primary sources in the 2.5–5 nm range are diminished.
The application of our new method to different scenarios requires understanding of the specific dynamics unique to each site. Variations in the time windows of active and background regions are expected, and these might even vary within the same site depending, for example, on the time of the year. Thus, step 3 (Fig. 1c) is very important. Additionally, the metric utilized in this study (Eq. 1) may not be optimally suited for other sites. For example, in environments with high pollution, the background concentration of N2.5−5 may consistently remain elevated. In such cases, it may be more appropriate to calculate the ratio between the active and background time windows rather than simply subtracting them. The method will likely not work at roadside or curbside sites as the sub-5nm population is highly sensitive to traffic emissions at these distances (Rönkkö et al., 2017). However traffic influence on the smallest particle sizes diminishes exponentially with distance from these sources, and at distances larger than 100 m the number concentration of these particles is very similar to the background (Rönkkö and Timonen, 2019, and references therein). Furthermore, in urban background environments, ultrafine particle pollution peaks stemming from traffic emissions and those linked to new particle formation (NPF) tend to occur at slightly different times – traffic emissions peak in the morning, while NPF peaks around midday (Trechera et al., 2023). Therefore, a thoughtful selection of both active and background regions, coupled with a reasonable distance of several hundred metres from traffic sources, is likely to enhance the effectiveness of applying this method in these environments.
Finally, the specific range can be adjusted based on site conditions and available instrumentation, it is recommended not to exceed 7 nm to avoid potential non-NPF-related disturbances in the signal. A sensitivity analysis of different size range combinations and reduction functions against classical event classification is provided in Fig. S1 in the Supplement.
Formation of fresh atmospheric aerosol particles is a worldwide phenomenon. Here we present a new method to analyse NPF events. Instead of traditional binary NPF event day vs. non-event day analysis, we have developed nanoparticle ranking analysis, which ranks the days based on the concentration of 2.5–5 nm particles seamlessly from very low values to high ones. At the same time, the frequency (or mode) of high-ranking values – earlier referred to as clear NPF event days – and low-ranking values (clear non-event days) can be obtained.
The new nanoparticle ranking analysis method is an automatic and objective way to characterize two important aspects of NPF events, namely their intensity and occurrence probability. This method integrates the traditional analysis of investigating NPF on NPF event days and the approach by Kulmala et al. (2022b) investigating NPF on the days when a NPF event is not observed. The days with high (low) ranking values show typically higher (lower) particle formation rates.
Our finding enables new ways to investigate connections between different days. This includes studying how factors such as vapour concentrations, precursor gases, condensation sinks, meteorology, and transport mechanisms impact the intensity and occurrence probability of NPF. In the future, it will be important to investigate connections of the ΔN2.5−5 metric – or its ranks – with atmospheric conditions in different environments. While testing this method in other environments is not yet completed and will be presented in other publications, we envision that the new method is applicable to many other types of environments and, besides providing probabilistic information about the occurrence and intensity of NPF, has potential to provide valuable insight into the origin of newly formed particles at sites affected by multiple sources of aerosol precursors.
Code for the data analysis performed in this study can be downloaded from the following repository hosted at GitHub (https://github.com/daliagachc/ranking-hy_zenodo), and an archive of the repository can also be found at https://doi.org/10.5281/zenodo.10231522 (Aliaga, 2023a).
The dataset used for this study can be downloaded from https://doi.org/10.5281/zenodo.10231189 (Aliaga, 2023b).
The supplement related to this article is available online at: https://doi.org/10.5194/ar-1-81-2023-supplement.
MK conceptualized the original idea. DA developed the method with help from MK, VMK, and PP. DA performed the analysis with help from ST, TZ, JL, XL, and SH. JL and TN collected the data. DA prepared and edited the manuscript with contributions from all co-authors.
At least one of the (co-)authors is a member of the editorial board of Aerosol Research. The peer-review process was guided by an independent editor, and the authors also have no other competing interests to declare.
Publisher’s note: Copernicus Publications remains neutral with regard to jurisdictional claims made in the text, published maps, institutional affiliations, or any other geographical representation in this paper. While Copernicus Publications makes every effort to include appropriate place names, the final responsibility lies with the authors.
The Doctoral School in Atmospheric Sciences at the University of Helsinki (ATM-DP) is acknowledged. University of Helsinki support via ACTRIS-HY is acknowledged. The Support of the technical and scientific staff in Hyytiälä is acknowledged. Diego Aliaga acknowledges the use of ChatGPT (GPT-3.5;4) in improving the writing style of certain excerpts in this article and takes full responsibility for the content. Diego Aliaga acknowledges the valuable ideas provided by Myriam Agrò and Sasu Karttunen regarding the evaluation of the method's performance. Diego Aliaga wants to thank Sara Blichner for her thoughtful comments and support during the writing process.
This research has been supported by the following:
-
ACCC Flagship funded by the Academy of Finland (grant nos. 337549 (UH) and 337552 (FMI))
-
Academy Professorship funded by the Academy of Finland (grant no. 302958)
-
Academy of Finland (grant nos. 1325656, 311932, 334792, 316114, 325647, 325681, 347782, and 337549)
-
“Quantifying carbon sink, CarbonSink+ and their interaction with air quality”, INAR project funded by the Jane and Aatos Erkko Foundation
-
“Gigacity” project funded by the Wihuri Foundation
-
European Research Council (ERC) project ATM-GTP (grant no. 742206)
-
European Commission, H2020 Research Infrastructures (CHAPAs grant no. 850614; FORCeS grant no. 821205)
-
Horizon Europe Infrastructures (FOCI grant no. 101056783).
This paper was edited by Hilkka Timonen and reviewed by three anonymous referees.
Aalto, P., Hämeri, K., Becker, E., Weber, R., Salm, J., Mäkelä, J. M., Hoell, C., O'dowd, C. D., Karlsson, H., Hansson, H.-C., Väkevä, M., Koponen, I. K., Buzorius, G., and Kulmala, M.: Physical characterization of aerosol particles during nucleation events, Tellus B, 53, 344, https://doi.org/10.3402/tellusb.v53i4.17127, 2001.
Aliaga, D.: daliagachc/ranking-hy_zenodo: rel_v01, Zenodo [code], https://doi.org/10.5281/zenodo.10231522, 2023a.
Aliaga, D.: DATA for Nano Ranking Analysis: determining NPF event occurrence and intensity based on the concentration spectrum of formed (sub-5 nm) particles, Version v1, Zenodo [data set], https://doi.org/10.5281/zenodo.10231189, 2023b.
Bousiotis, D., Pope, F. D., Beddows, D. C. S., Dall'Osto, M., Massling, A., Nøjgaard, J. K., Nordstrøm, C., Niemi, J. V., Portin, H., Petäjä, T., Perez, N., Alastuey, A., Querol, X., Kouvarakis, G., Mihalopoulos, N., Vratolis, S., Eleftheriadis, K., Wiedensohler, A., Weinhold, K., Merkel, M., Tuch, T., and Harrison, R. M.: A phenomenology of new particle formation (NPF) at 13 European sites, Atmos. Chem. Phys., 21, 11905–11925, https://doi.org/10.5194/acp-21-11905-2021, 2021.
Cai, R., Yan, C., Worsnop, D. R., Bianchi, F., Kerminen, V.-M., Liu, Y., Wang, L., Zheng, J., Kulmala, M., and Jiang, J.: An indicator for sulfuric acid–amine nucleation in atmospheric environments, Aerosol Sci. Technol., 55, 1059–1069, https://doi.org/10.1080/02786826.2021.1922598, 2021.
Chen, X., Virkkula, A., Kerminen, V.-M., Manninen, H. E., Busetto, M., Lanconelli, C., Lupi, A., Vitale, V., Del Guasta, M., Grigioni, P., Väänänen, R., Duplissy, E.-M., Petäjä, T., and Kulmala, M.: Features in air ions measured by an air ion spectrometer (AIS) at Dome C, Atmos. Chem. Phys., 17, 13783–13800, https://doi.org/10.5194/acp-17-13783-2017, 2017.
Chu, B., Kerminen, V.-M., Bianchi, F., Yan, C., Petäjä, T., and Kulmala, M.: Atmospheric new particle formation in China, Atmos. Chem. Phys., 19, 115–138, https://doi.org/10.5194/acp-19-115-2019, 2019.
Dada, L., Chellapermal, R., Buenrostro Mazon, S., Paasonen, P., Lampilahti, J., Manninen, H. E., Junninen, H., Petäjä, T., Kerminen, V.-M., and Kulmala, M.: Refined classification and characterization of atmospheric new-particle formation events using air ions, Atmos. Chem. Phys., 18, 17883–17893, https://doi.org/10.5194/acp-18-17883-2018, 2018.
Dal Maso, M., Kulmala, M., Riipinen, I., Wagner, R., Hussein, T., Aalto, P. P., and Lehtinen, K.: Formation and growth of fresh atmospheric aerosols: eight years of aerosol size distribution data from SMEAR II, Hyytiälä, Finland, Boreal Environ. Res., 10, 323–336, 2005.
Guo, S., Hu, M., Zamora, M. L., Peng, J., Shang, D., Zheng, J., Du, Z., Wu, Z., Shao, M., Zeng, L., Molina, M. J., and Zhang, R.: Elucidating severe urban haze formation in China, P. Natl. Acad. Sci. USA, 111, 17373–17378, https://doi.org/10.1073/pnas.1419604111, 2014.
Hari, P. and Kulmala, M.: Station for Measuring Ecosystem-Atmosphere Relations (SMEAR II), Boreal Environ. Res., 10, 315–322, 2005.
Hari, P., Nikinmaa, E., Pohja, T., Siivola, E., Bäck, J., Vesala, T., and Kulmala, M.: Station for Measuring Ecosystem-Atmosphere Relations: SMEAR, in: Physical and Physiological Forest Ecology, edited by: Hari, P., Heliövaara, K., and Kulmala, L., Springer Netherlands, Dordrecht, 471–487, https://doi.org/10.1007/978-94-007-5603-8_9, 2013.
Hyvönen, S., Junninen, H., Laakso, L., Dal Maso, M., Grönholm, T., Bonn, B., Keronen, P., Aalto, P., Hiltunen, V., Pohja, T., Launiainen, S., Hari, P., Mannila, H., and Kulmala, M.: A look at aerosol formation using data mining techniques, Atmos. Chem. Phys., 5, 3345–3356, https://doi.org/10.5194/acp-5-3345-2005, 2005.
Jayaratne, E. R., Clifford, S., and Morawska, L.: Atmospheric Visibility and PM10 as Indicators of New Particle Formation in an Urban Environment, Environ. Sci. Technol., 49, 12751–12757, https://doi.org/10.1021/acs.est.5b01851, 2015.
Joutsensaari, J., Ozon, M., Nieminen, T., Mikkonen, S., Lähivaara, T., Decesari, S., Facchini, M. C., Laaksonen, A., and Lehtinen, K. E. J.: Identification of new particle formation events with deep learning, Atmos. Chem. Phys., 18, 9597–9615, https://doi.org/10.5194/acp-18-9597-2018, 2018.
Kerminen, V.-M. and Kulmala, M.: Analytical formulae connecting the “real” and the “apparent” nucleation rate and the nuclei number concentration for atmospheric nucleation events, J. Aerosol Sci., 33, 609–622, https://doi.org/10.1016/S0021-8502(01)00194-X, 2002.
Kerminen, V.-M., Chen, X., Vakkari, V., Petäjä, T., Kulmala, M., and Bianchi, F.: Atmospheric new particle formation and growth: review of field observations, Environ. Res. Lett., 13, 103003, https://doi.org/10.1088/1748-9326/aadf3c, 2018.
Ketzel, M. and Berkowicz, R.: Modelling the fate of ultrafine particles from exhaust pipe to rural background: an analysis of time scales for dilution, coagulation and deposition, Atmospheric Environment, 38, 2639–2652, https://doi.org/10.1016/j.atmosenv.2004.02.020, 2004.
Kuang, C., Riipinen, I., Sihto, S.-L., Kulmala, M., McCormick, A. V., and McMurry, P. H.: An improved criterion for new particle formation in diverse atmospheric environments, Atmos. Chem. Phys., 10, 8469–8480, https://doi.org/10.5194/acp-10-8469-2010, 2010.
Kulmala, M., Riipinen, I., Sipila, M., Manninen, H. E., Petaja, T., Junninen, H., Maso, M. D., Mordas, G., Mirme, A., Vana, M., Hirsikko, A., Laakso, L., Harrison, R. M., Hanson, I., Leung, C., Lehtinen, K. E. J., and Kerminen, V.-M.: Toward Direct Measurement of Atmospheric Nucleation, Science, 318, 89–92, https://doi.org/10.1126/science.1144124, 2007.
Kulmala, M., Petäjä, T., Nieminen, T., Sipilä, M., Manninen, H. E., Lehtipalo, K., Dal Maso, M., Aalto, P. P., Junninen, H., Paasonen, P., Riipinen, I., Lehtinen, K. E. J., Laaksonen, A., and Kerminen, V.-M.: Measurement of the nucleation of atmospheric aerosol particles, Nat. Protoc., 7, 1651–1667, https://doi.org/10.1038/nprot.2012.091, 2012.
Kulmala, M., Dada, L., Daellenbach, K. R., Yan, C., Stolzenburg, D., Kontkanen, J., Ezhova, E., Hakala, S., Tuovinen, S., Kokkonen, T. V., Kurppa, M., Cai, R., Zhou, Y., Yin, R., Baalbaki, R., Chan, T., Chu, B., Deng, C., Fu, Y., Ge, M., He, H., Heikkinen, L., Junninen, H., Liu, Y., Lu, Y., Nie, W., Rusanen, A., Vakkari, V., Wang, Y., Yang, G., Yao, L., Zheng, J., Kujansuu, J., Kangasluoma, J., Petäjä, T., Paasonen, P., Järvi, L., Worsnop, D., Ding, A., Liu, Y., Wang, L., Jiang, J., Bianchi, F., and Kerminen, V.-M.: Is reducing new particle formation a plausible solution to mitigate particulate air pollution in Beijing and other Chinese megacities?, Faraday Discuss., 226, 334–347, https://doi.org/10.1039/D0FD00078G, 2021.
Kulmala, M., Cai, R., Stolzenburg, D., Zhou, Y., Dada, L., Guo, Y., Yan, C., Petäjä, T., Jiang, J., and Kerminen, V.-M.: The contribution of new particle formation and subsequent growth to haze formation, Environ. Sci. Atmos., 2, 352–361, https://doi.org/10.1039/D1EA00096A, 2022a.
Kulmala, M., Junninen, H., Dada, L., Salma, I., Weidinger, T., Thén, W., Vörösmarty, M., Komsaare, K., Stolzenburg, D., Cai, R., Yan, C., Li, X., Deng, C., Jiang, J., Petäjä, T., Nieminen, T., and Kerminen, V.-M.: Quiet New Particle Formation in the Atmosphere, Front. Environ. Sci., 10, 912385, https://doi.org/10.3389/fenvs.2022.912385, 2022b.
Laakso, L., Petäjä, T., Lehtinen, K. E. J., Kulmala, M., Paatero, J., Hõrrak, U., Tammet, H., and Joutsensaari, J.: Ion production rate in a boreal forest based on ion, particle and radiation measurements, Atmos. Chem. Phys., 4, 1933–1943, https://doi.org/10.5194/acp-4-1933-2004, 2004.
Lehtinen, K. E. J., Dal Maso, M., Kulmala, M., and Kerminen, V.-M.: Estimating nucleation rates from apparent particle formation rates and vice versa: Revised formulation of the Kerminen–Kulmala equation, J. Aerosol Sci., 38, 988–994, https://doi.org/10.1016/j.jaerosci.2007.06.009, 2007.
Leino, K., Nieminen, T., Manninen, H., Petäjä, T., Kerminen, V., and Kulmala, M.: Intermediate ions as a strong indicator of new particle formation bursts in a boreal forest, Boreal Environ. Res., 21, 274–286, 2016.
McMurry, P. H., Fink, M., Sakurai, H., Stolzenburg, M. R., Mauldin, R. L., Smith, J., Eisele, F., Moore, K., Sjostedt, S., Tanner, D., Huey, L. G., Nowak, J. B., Edgerton, E., and Voisin, D.: A criterion for new particle formation in the sulfur-rich Atlanta atmosphere, J. Geophys. Res., 110, D22S02, https://doi.org/10.1029/2005JD005901, 2005.
Mirme, S. and Mirme, A.: The mathematical principles and design of the NAIS – a spectrometer for the measurement of cluster ion and nanometer aerosol size distributions, Atmos. Meas. Tech., 6, 1061–1071, https://doi.org/10.5194/amt-6-1061-2013, 2013.
Nieminen, T., Kerminen, V.-M., Petäjä, T., Aalto, P. P., Arshinov, M., Asmi, E., Baltensperger, U., Beddows, D. C. S., Beukes, J. P., Collins, D., Ding, A., Harrison, R. M., Henzing, B., Hooda, R., Hu, M., Hõrrak, U., Kivekäs, N., Komsaare, K., Krejci, R., Kristensson, A., Laakso, L., Laaksonen, A., Leaitch, W. R., Lihavainen, H., Mihalopoulos, N., Németh, Z., Nie, W., O'Dowd, C., Salma, I., Sellegri, K., Svenningsson, B., Swietlicki, E., Tunved, P., Ulevicius, V., Vakkari, V., Vana, M., Wiedensohler, A., Wu, Z., Virtanen, A., and Kulmala, M.: Global analysis of continental boundary layer new particle formation based on long-term measurements, Atmos. Chem. Phys., 18, 14737–14756, https://doi.org/10.5194/acp-18-14737-2018, 2018.
Olin, M., Okuljar, M., Rissanen, M. P., Kalliokoski, J., Shen, J., Dada, L., Lampimäki, M., Wu, Y., Lohila, A., Duplissy, J., Sipilä, M., Petäjä, T., Kulmala, M., and Dal Maso, M.: Measurement report: Atmospheric new particle formation in a coastal agricultural site explained with binPMF analysis of nitrate CI-APi-TOF spectra, Atmos. Chem. Phys., 22, 8097–8115, https://doi.org/10.5194/acp-22-8097-2022, 2022.
Peng, J. F., Hu, M., Wang, Z. B., Huang, X. F., Kumar, P., Wu, Z. J., Guo, S., Yue, D. L., Shang, D. J., Zheng, Z., and He, L. Y.: Submicron aerosols at thirteen diversified sites in China: size distribution, new particle formation and corresponding contribution to cloud condensation nuclei production, Atmos. Chem. Phys., 14, 10249–10265, https://doi.org/10.5194/acp-14-10249-2014, 2014.
Petäjä, T., Tabakova, K., Manninen, A., Ezhova, E., O'Connor, E., Moisseev, D., Sinclair, V. A., Backman, J., Levula, J., Luoma, K., Virkkula, A., Paramonov, M., Räty, M., Äijälä, M., Heikkinen, L., Ehn, M., Sipilä, M., Yli-Juuti, T., Virtanen, A., Ritsche, M., Hickmon, N., Pulik, G., Rosenfeld, D., Worsnop, D. R., Bäck, J., Kulmala, M., and Kerminen, V.-M.: Influence of biogenic emissions from boreal forests on aerosol–cloud interactions, Nat. Geosci., 15, 42–47, https://doi.org/10.1038/s41561-021-00876-0, 2022.
Rönkkö, T. and Timonen, H.: Overview of Sources and Characteristics of Nanoparticles in Urban Traffic-Influenced Areas, J. Alzheimers Dis., 72, 15–28, https://doi.org/10.3233/JAD-190170, 2019.
Rönkkö, T., Kuuluvainen, H., Karjalainen, P., Keskinen, J., Hillamo, R., Niemi, J. V., Pirjola, L., Timonen, H. J., Saarikoski, S., Saukko, E., Järvinen, A., Silvennoinen, H., Rostedt, A., Olin, M., Yli-Ojanperä, J., Nousiainen, P., Kousa, A., and Dal Maso, M.: Traffic is a major source of atmospheric nanocluster aerosol, P. Natl. Acad. Sci. USA, 114, 7549–7554, https://doi.org/10.1073/pnas.1700830114, 2017.
Stolzenburg, M. R.: An Ultrafine Aerosol Size Distribution Measuring System, PhD thesis, Department of Mechanical Engineering, University of Minnesota, Minneapolis, MN, USA, 1988.
Su, P., Joutsensaari, J., Dada, L., Zaidan, M. A., Nieminen, T., Li, X., Wu, Y., Decesari, S., Tarkoma, S., Petäjä, T., Kulmala, M., and Pellikka, P.: New particle formation event detection with Mask R-CNN, Atmos. Chem. Phys., 22, 1293–1309, https://doi.org/10.5194/acp-22-1293-2022, 2022.
Tammet, H., Komsaare, K., and Hõrrak, U.: Intermediate ions in the atmosphere, Atmos. Res., 135–136, 263–273, https://doi.org/10.1016/j.atmosres.2012.09.009, 2014.
Trechera, P., Garcia-Marlès, M., Liu, X., Reche, C., Pérez, N., Savadkoohi, M., Beddows, D., Salma, I., Vörösmarty, M., Casans, A., Casquero-Vera, J. A., Hueglin, C., Marchand, N., Chazeau, B., Gille, G., Kalkavouras, P., Mihalopoulos, N., Ondracek, J., Zikova, N., Niemi, J. V., Manninen, H. E., Green, D. C., Tremper, A. H., Norman, M., Vratolis, S., Eleftheriadis, K., Gómez-Moreno, F. J., Alonso-Blanco, E., Gerwig, H., Wiedensohler, A., Weinhold, K., Merkel, M., Bastian, S., Petit, J.-E., Favez, O., Crumeyrolle, S., Ferlay, N., Martins Dos Santos, S., Putaud, J.-P., Timonen, H., Lampilahti, J., Asbach, C., Wolf, C., Kaminski, H., Altug, H., Hoffmann, B., Rich, D. Q., Pandolfi, M., Harrison, R. M., Hopke, P. K., Petäjä, T., Alastuey, A., and Querol, X.: Phenomenology of ultrafine particle concentrations and size distribution across urban Europe, Environ. Int., 172, 107744, https://doi.org/10.1016/j.envint.2023.107744, 2023.
Wang, Z., Wu, Z., Yue, D., Shang, D., Guo, S., Sun, J., Ding, A., Wang, L., Jiang, J., Guo, H., Gao, J., Cheung, H. C., Morawska, L., Keywood, M., and Hu, M.: New particle formation in China: Current knowledge and further directions, Sci. Total Environ., 577, 258–266, https://doi.org/10.1016/j.scitotenv.2016.10.177, 2017.
Wimmer, D., Buenrostro Mazon, S., Manninen, H. E., Kangasluoma, J., Franchin, A., Nieminen, T., Backman, J., Wang, J., Kuang, C., Krejci, R., Brito, J., Goncalves Morais, F., Martin, S. T., Artaxo, P., Kulmala, M., Kerminen, V.-M., and Petäjä, T.: Ground-based observation of clusters and nucleation-mode particles in the Amazon, Atmos. Chem. Phys., 18, 13245–13264, https://doi.org/10.5194/acp-18-13245-2018, 2018.
Zaidan, M. A., Haapasilta, V., Relan, R., Junninen, H., Aalto, P. P., Kulmala, M., Laurson, L., and Foster, A. S.: Predicting atmospheric particle formation days by Bayesian classification of the time series features, Tellus B, 70, 1530031, https://doi.org/10.1080/16000889.2018.1530031, 2018.
- Abstract
- Introduction
- Methods
- Results of applying the method in the boreal forest
- Considerations and limitations of the method and its applicability to other sites
- Conclusions
- Code availability
- Data availability
- Author contributions
- Competing interests
- Disclaimer
- Acknowledgements
- Financial support
- Review statement
- References
- Supplement