the Creative Commons Attribution 4.0 License.
the Creative Commons Attribution 4.0 License.
 | 13 Jun 2024
Atmospheric ice-nucleating particles in the eastern Mediterranean and the contribution of mineral and biological aerosol
Bethany V. Wyld
Naama Reicher
Matan Alayof
Daniella Gat
Alberto Sanchez-Marroquin
Sebastien N. F. Sikora
Alexander D. Harrison
Yinon Rudich
Benjamin J. Murray
While the atmosphere in the eastern Mediterranean is part of the dust belt, it encounters air masses from Europe, the Mediterranean Sea, and the Sahara and Arabian Desert that bring with them a whole host of potential dust and bioaerosol compositions and concentrations via long-range transport. The consequential changes in the populations of ice-nucleating particles (INPs), aerosols that influence weather and climate by the triggering of freezing in supercooled cloud water droplets, including in the convective cloud systems in the region, are not so well understood beyond the influence of desert dust storms in increasing INP concentrations. Here, we undertook an intensive INP measurement campaign in Israel to monitor changes in concentrations and activity from four major air masses, including the potential for activity from biological INPs. Our findings show that the INP activity in the region is likely dominated by the K-feldspar mineral content, with southwesterly air masses from the Sahara and easterly air masses from the Arabian Desert markedly increasing both aerosol and INP concentrations. Most intriguingly, a handful of air masses that passed over the Nile Delta and the northern Fertile Crescent, regions containing fertile agricultural soils and wetlands, brought high INP concentrations with strong indicators of biological activity. These results suggest that the Fertile Crescent could be a sporadic source of high-temperature biological ice-nucleating activity across the region that could periodically dominate the otherwise K-feldspar-controlled INP environment. We propose that these findings warrant further exploration in future studies in the region, which may be particularly pertinent given the ongoing desertification of the Fertile Crescent that could reveal further sources of dust and fertile soil-based INPs in the eastern Mediterranean region.
- Article
(7623 KB) - Full-text XML
-
Supplement
(3667 KB) - BibTeX
- EndNote


Clouds play an important role in weather and climate due to precipitation and their radiative properties, but their representation in cloud-feedback and climate models retains a high degree of uncertainty due to a deficiency in our understanding of a number of dynamic and microphysical processes, including cloud–aerosol interactions (Ceppi et al., 2017; Storelvmo, 2017). A rare class of aerosol particles known as ice-nucleating particles (INPs) is able to catalyse the formation of ice in supercooled cloud water droplets at temperatures higher than around −35 °C (Murray et al., 2012; Hoose and Möhler, 2012; Kanji et al., 2017), below which cloud droplets can freeze homogeneously (Herbert et al., 2015; Rosenfeld and Woodley, 2000).
The presence of INPs can thus alter the ratio of water to ice in mixed-phase clouds and influence their albedo and lifetime (Lohmann and Feichter, 2005). Therefore, an accurate representation of INPs in global models is important, particularly in a changing climate (Murray et al., 2021), but this is currently lacking (Kanji et al., 2017; Vergara-Temprado et al., 2017) since INPs are not only rare but also highly variable globally in terms of their activity (defined here as the number of ice-nucleating active sites per surface area of material, ns(T)), concentrations, transport, processing, sources, and sinks.
To better characterise atmospheric INPs, it is necessary to undertake field campaigns that collect essential and seasonal data on INP properties from around the globe and to determine the origins of those INPs and their effects on clouds. The eastern Mediterranean is a fascinating location in terms of the varying air mass trajectories that reach it and the potential for vastly different INP populations associated with each, which could influence the clouds in the region, e.g. deep convective cloud systems (Funatsu et al., 2007). A large proportion of air flowing into deep convective clouds can come directly from the boundary layer; hence boundary layer aerosols are of direct relevance for the development of deep convective clouds (Hoffmann et al., 2015; Hawker et al., 2021). Dayan (1986) studied 5 d back trajectories from Israel over a 5-year period and identified five major source regions of air masses: (i) northwest Europe, crossing the Mediterranean Sea, throughout the whole year, (ii) north-easterly continental flow originating in eastern Europe during the summer season, (iii) infrequent south-easterly flow from the Syrian and Arabian deserts that occurred mainly during autumn (fall), (iv) south-westerly flow along the northern African coast most frequent during late winter and spring, and (v) south-southwesterly flow from inland northern Africa that mostly occurred during winter and spring.
One of the major features of the region are the dust events associated with the Sahara, Syrian and Arabian deserts (Dayan et al., 1991; Ganor, 1994, 1991; Ganor and Mamane, 1982; Yaalon and Ganor, 1979; Mamane et al., 1980; Athanasopoulou et al., 2016; Reicher et al., 2018, 2019). Transported dust can have residence times of hours to weeks (Ganor, 1991, 1994; Kubilay et al., 2000) and can cover heights of up to 6 km above mean sea level (a.m.s.l.) during transport (Israelevich et al., 2002). Dayan et al. (1991) found that Saharan events usually have high dust loadings and last for 2–4 d. Conversely, those from the Arabian Desert last for shorter periods (∼ 1–2 d) and are restricted to a more shallow atmospheric transport layer (up to ∼ 2000 m a.m.s.l.) that may prevent their passing much beyond the eastern Mediterranean.
Saharan dust events are important in terms of INP population and sources in the eastern Mediterranean (Ganor, 1994), particularly as the number of dust days caused by African dust each year increased decade by decade until around 2010 (Ganor et al., 2010), although this trend has recently reversed (Nissenbaum et al., 2023). In addition to dust, westerly air flows can bring high levels of sea salt from the Mediterranean Sea (Levin and Lindberg, 1979; Foner and Ganor, 1992) and biogenic sulfate aerosols (Ganor et al., 2000). Dust storms that pass over the Mediterranean Sea can contain internally mixed dust and sea salt (Levin et al., 2005).
There have been a handful of INP measurement campaigns in the eastern Mediterranean region, specifically around Israel, and it is unsurprising given the importance of Saharan dust that several studies have either focussed on the effect of Saharan dust events or have drawn conclusions from them. Studies have shown that INP activity doubled during “dust days” compared to “clean days” (a relative term in the region), with south-westerly air masses from the Sahara contributing to the “dust days”, while the “clean days” comprised north-westerly air masses from Europe (Levi and Rosenfeld, 1996; Ardon-Dryer and Levin, 2014). Aircraft analysis of winter cumulus clouds found that INP concentrations roughly approximated measured ice crystal concentrations within about 1 order of magnitude (Gagin, 1975).
Size-resolved INP analysis has demonstrated that ice-nucleating activity (in terms of ice-active site surface density, ns(T)) during dust events increased with increasing aerosol particle size and concentration and that the activity of supermicron particles was similar for different dust events, suggesting that mineral species common across these regions were controlling ice nucleation (Reicher et al., 2018, 2019). This latter hypothesis was similarly proposed during a study of INPs from three locations on the Saudi Arabian peninsula (Roesch et al., 2021), with the ice-nucleating activity being comparable to that of Saharan dust. However, a study of Saharan and non-Saharan transported dust samples from various locations showed that sieved and milled surface samples from Israel demonstrated some of the lowest ice-nucleating activities amongst all samples (Boose et al., 2016). Further INP analysis in Israel during the annual Lag BaOmer bonfire festival event showed that, despite an increase in total aerosol concentrations, there was no associated increase in INPs (Ardon-Dryer and Levin, 2014), which is consistent with studies during similar bonfire events in the United Kingdom (Adams et al., 2020).
A number of campaigns have taken place in Cyprus in the eastern Mediterranean, northwest of Israel. Ground-based filter samples collected from air masses passing over land and oceans sectors found no significant differences between their INP concentrations at temperatures lower than −15 °C, implying that the INP population was dominated by long-range transported aerosol (Gong et al., 2019). However, a few samples showed elevated activity at temperatures greater than −15 °C, which suggested a population of biological INPs speculated to originate in Cyprus. As a result, the researchers proposed that the standard methods of parameterising ice-nucleating activity (e.g. for desert dusts), such as ns(T), are unsuitable if the aerosol particle composition is unknown. During the INUIT–BACCHUS–ACTRIS campaign, vertical profiles over Cyprus using UASs suggested that ice-nucleating activity was dominated by Saharan dust in the lower and middle troposphere, with concentrations of an order of magnitude higher than at ground level, which may have comprised weak marine and terrestrial sources in Cyprus (Schrod et al., 2017). These data were later used to validate a new method for vertical profiling of INPs (Marinou et al., 2019) using ground-based and spaceborne lidar observations from the campaign combined with INP parameterisations (DeMott et al., 2010, 2015).
Several ship campaigns have taken place in the seas around Israel. INPs measured in sea-spray aerosol (SSA) and the sea surface microlayer (SML) in the western and central regions of the Mediterranean Sea showed lower than expected concentrations and were presumed to be due to the oligotrophic nature of the Mediterranean Sea (Trueblood et al., 2021). Interestingly, a dust wet deposition event demonstrated that, while INP concentrations in the SML increased by an order of magnitude almost immediately, the concentrations in the SSA took 3 d to increase. A cruise in 1979 that crossed the Mediterranean, Red, and Arabian seas showed that the highest INP concentrations were measured in the southern section of the Red Sea (Prodi et al., 1983), correlating with the mass concentration of mineral aerosol apart from when SSA production was high. However, we note several other instances in that dataset where the INP data increased much higher, relatively speaking, than the mineral content did, suggesting that other non-mineral INPs, e.g. biological INPs, may have been present. A more recent cruise around the Arabian Peninsula included INP measurements in the Red Sea (Beall et al., 2022), with the researchers noting that agricultural soil dust from the Nile Delta region exhibited greater heat sensitivity that is indicative of biological INP content. As a consequence of this and in noting that aerosol ageing can have an effect on INP activity, the researchers, similar to Gong et al. (2019), proposed that mineral dust parameterisations alone may not be suitable for the representation of regional ice-nucleating activity when the INP population is not dominated by the mineral dust content.
To better understand INP concentrations and activity in the eastern Mediterranean region beyond dust events, we undertook an intensive 2-week field campaign in Rehovot, Israel, in October–November 2018 where we collected ground-based filter samples for INP analysis by immersion mode droplet freezing assays. Given the variety of air masses received by this location, we hoped to determine whether some sources could potentially influence local INP populations over the typical dust events. During this campaign we experienced four major air masses that we were able to study: (i) a southwesterly dust event from the Sahara that passed over the fertile Nile Delta region, (ii) a northwesterly air mass from Europe, (iii) a prolonged easterly event from the Arabian Desert that contained air with both high and low loadings of dust, and (iv) an air mass that passed over the agriculturally important northern Fertile Crescent region before sweeping eastward to the sampling site.
2.1 Aerosol sampling and preparation of particle suspensions
Atmospheric aerosol samples were collected over 10 d, from 25 October to 3 November 2018, from the roof of the Department of Earth and Planetary Sciences building at the Weizmann Institute of Science in Rehovot, Israel (31°54′26.1′′ N, 34°48′37.7′′ E, ∼ 80 m a.m.s.l.). Aerosol sampling was performed using two different methodologies: (1) the collection of aerosol particles onto filters and (2) the sampling of aerosol particles into water using an impinger. Aqueous suspensions of particles were prepared in both instances using purified water (18.2 MΩ cm at 25 °C, 0.22 µm filtered) that was collected every morning from a Thermo Scientific™ Barnstead™ GenPure™ water purification system and stored in 50 mL polypropylene centrifuge tubes (Sarstedt Ltd.).
Filter-based sampling for INP analysis was performed using our previously described technique (O'Sullivan et al., 2018). Two BGI PQ100 ambient air samplers (Mesa Laboratories, Inc., Lakewood, CO, USA) with PM10 (particulate matter of ≤ 10 µm diameter) inlet heads were purchased from Air Monitors (Tewkesbury, UK) and were employed in order to draw air through porous filters onto which aerosol particles were adsorbed. The BGI PQ100 is used as an Environmental Protection Agency (EPA) Reference Method for PM10 (designation no. RFPS-1298-124). PM10 aerosols were sampled onto Whatman® Nuclepore™ track-etched membrane polycarbonate filters (1.0 µm pore size, 47 mm diameter filters, purchased from Sigma-Aldrich, Dorset, UK) at a flow rate of 16.67 L min−1 (1 m3 h−1). While the filters had 1.0 µm pore sizes, studies have demonstrated that membrane filters are able to capture particles much smaller than the given pore size (Soo et al., 2016; Lindsley, 2016); 1.0 µm pore size polycarbonate filters have been shown to have collection efficiencies of 50 %–90 % for particle sizes of 0.01–0.2 µm and 90 %–100 % for particle sizes larger than 0.2 µm (Burton et al., 2006; Lindsley, 2016).
Filter-based sampling for INP analysis was performed using two main strategies: (i) the collection of samples for 3 h every morning and 3 h every afternoon (yielding 3000 L of sampled air for each sample) and (ii) the collection of samples for 24 h from midday to midday (24 000 L of sampled air). The 3 h samples were collected using one PQ100 sampler and the 24 h samples using a second PQ100 sampler. Collection of the 3 h samples was intended to provide a relatively short time resolution of the INP measurements, while the 24 h samples were originally collected to achieve a large volume of sampled air since it was not immediately clear how much air would need to be sampled to obtain an INP signal. However, the sampler used for the 24 h samples failed during collection of the fourth sample between 28–29 October after 17.5 h, and no further 24 h samples were collected from that point.
In one experiment during the afternoon of 29 October 2018, the two samplers were run side by side for 3 h, with one collecting PM10 aerosol onto a filter as usual and the other collecting PM1 aerosol simultaneously onto a second filter via the use of a PM1 adaptor (SCC 2.229 Cyclone, Mesa Labs) inserted into the sampler. Two handling blanks were also performed for the filter-based sampling by attaching a HEPA (high-efficiency particulate air) filter to the BGI PQ100 sampler and pulling filtered air through a track-etched membrane filter. One handling blank filter was sampled for 1 h during the early stages of the campaign and another filter sampled for 3 h during the latter stages.
Details of the sampling times and volumes of air sampled for each filter collected are provided in Table S1 in the Supplement. Filters collected for INP analysis were removed from the BGI PQ100 sampling system and immediately inserted into a 50 mL centrifuge tube (Sarstedt Ltd., Leicester, UK) using tweezers, then 4 mL of purified water added via pipette. The tube was shaken vigorously for several seconds before being vortexed on a vortex mixer (Labnet VX100) for 5 min, allowing the adsorbed aerosol particles to be washed off the filter and into suspension ready for analysis via a droplet freezing assay.
Impinger samples were collected during the afternoon for 7 d of the campaign using a Bertin Technologies Coriolis® Micro air sampler, purchased from Air Monitors. This impinger measures particles larger than 0.5 µm, with a collection efficiency, D50 (i.e. the particle size at which the collection efficiency is 50 %), of < 0.5 µm (Bertin Technologies, 2024; Carvalho et al., 2008). Impingers have previously been successfully employed by several research groups for INP sampling and analysis (Šantl-Temkiv et al., 2017; Garcia et al., 2012), including the use of a Coriolis Micro for the detection of ice-nucleating proteins by genetic sequencing (Els et al., 2019). Here, ambient air was aspirated into a cone filled with 10 mL of purified water, with aerosol particles that entered the sampler inlet being centrifuged to the wall of the cone and extracted from the air into the water. Sampling was performed in multiple 10 min intervals (the maximum runtime of the sampler), at a flow rate of either 100 L min−1 or 300 L min−1, until 6000 L of air had been sampled into the water-filled cone. A lid was screwed onto the cone once it had been removed from the sampler to prevent contamination. Purified water was added to the cone following each sampling interval due to evaporation losses during sampling, and the final volume of water in the cone (∼ 5–10 mL) was determined by weight at the end of the collection period.
A handling blank was performed for the impinger samples by filling a sampling cone with purified water, attaching it to the impinger, and then removing it and screwing a lid onto it ready for droplet freezing assay analysis of the water. It was not possible at the time to pull HEPA-filtered air through the sampler for the handling blank due to the awkward shape of the inlet. Details of the sampling times and final water volumes are provided in Table S1 in the Supplement. The water from the cone was analysed directly via a droplet freezing assay.
2.2 Heat treatment of aerosol suspensions
An aliquot of every aqueous suspension from the filter samples and the impinger samples was subjected to a heat treatment test. Heat treatments are used to test for the presence of heat-labile ice-nucleating materials (O'Sullivan et al., 2018; Christner et al., 2008b, a; Daily et al., 2022), which are generally equated to ice-nucleating proteins that suggest the presence of biogenic INPs (e.g. bacteria or fungi). Such tests can only be used to indicate of the possibility of biogenic INPs being present but cannot alone provide definitive evidence. Since some minerals can also lose their activity upon heating, the assumption that a loss of activity may be due to ice-nucleating proteins is considered to only be viable if the main mineral dust component is microcline K-feldspar, which does not lose activity following heat treatment (Daily et al., 2022).
The aerosol compositions of dust events in Israel mainly compromise calcite (59 ± 15 %), quartz (23 ± 7 %), dolomite (11 ± 8 %), feldspars (5 ± 3 %), halite (2 ± 1 %), and traces of clay minerals (Ganor and Mamane, 1982; Foner and Ganor, 1992; Ganor, 1975). While the carbonates (calcite and dolomite) and quartz dominate the composition, it is the feldspars that are thought to be the most important factor for the nucleation of ice in mixed-phase clouds (Atkinson et al., 2013; Kiselev et al., 2017). While different feldspars have vastly different ice-nucleating activities (Harrison et al., 2016), microcline potassium (K)-rich feldspar exhibits much greater activity than quartz or Na–Ca feldspars (plagioclase series) (Harrison et al., 2019).
As a consequence, the presence of K-feldspar, even at concentrations of around only 1 % (Harrison et al., 2022), is expected to dominate the ice-nucleating ability of airborne desert dust. Boose et al. (2016) analysed sieved and milled surface dust from Israel and found K-feldspar contents of 1.7 ± 0.3 % and 1.4 ± 0.3 %, respectively, and agreed with Ganor and Mamane (1982), Foner and Ganor (1992), and Ganor (1975) that the samples were comprised mostly of carbonates. Based on this, we assume here that microcline K-feldspar is the dominant component of the mineral dust in Israel in terms of ice-nucleating activity, and so the heat test for biogenic INPs remains viable.
Heat treatment was performed by adding 1 mL of aqueous suspension to a sealed glass vial and heating at 95 °C for 30 min in a bath of boiling water, consistent with the recommendations of Daily et al. (2022). The sample was then allowed to cool to room temperature prior to analysis via a droplet freezing assay for comparison to the untreated sample. A control test was also performed by performing droplet freezing assays on an aliquot of purified water before and after being subjected to heat treatment.
2.3 Droplet freezing assays for INP analysis using the µL-NIPI
All aqueous suspensions from the filter-based samples (3 and 24 h collection periods) and the impinger-based samples were analysed using the Microlitre Nucleation by Immersed Particle Instrument (µL-NIPI) (Whale et al., 2015) immediately following their collection and preparation. This involved setting the droplet freezing apparatus up in the laboratories of the Weizmann Institute of Science. The advantage of analysing the samples immediately following collection was that we reduced the possibility of changes in the INP population that have been observed on storage and transport of filter samples (Beall et al., 2020).
Hydrophobic glass slides (22 mm Ø × 0.22 mm siliconised glass, Hampton Research, Aliso Viejo, CA, USA) were washed with ethanol and purified water, dried with dry nitrogen gas, and placed atop the cold plate of a Stirling engine-based cold stage (EF600, Grant Asymptote Ltd., Cambridge, UK).
Sample tubes/cones of aqueous suspension were shaken vigorously and vortexed on a vortex mixer for 5 min, and then ∼ 40 droplets (1 µL volume each) were pipetted onto the hydrophobic glass slide. A Perspex shield was placed over the glass slide to form a chamber, which was purged with dry N2 gas to prevent the formation of condensation on the cold stage. The cold stage was cooled at a rate of 1 °C min−1 to −40 °C, and videos were recorded via a webcam as the array of droplets froze, with the droplet freezing temperatures being determined by synchronisation of the videos with the cold-plate temperature measurements. The temperature error of the µL-NIPI was ±0.4 °C (Whale et al., 2015).
2.4 Processing of droplet freezing assay data
Droplet freezing assay analysis of the aqueous suspensions of collected ambient aerosol allowed the fraction of the droplets frozen as a function of temperature, fice(T), to be determined using Eq. (1) (Vali, 1971, 1994):
where nice(T) is the number of droplets frozen at temperature T, and ntot is the total number of droplets. The fraction frozen values represent the raw data for the droplet freezing assays, and these are shown for all of the campaign results in Figs. S1–S7 in the Supplement.
Early in the campaign (from 25 to 30 October 2018), the bulk of the droplets in the purified water blanks froze in the region of around −23 to −29 °C. However, on 31 October 2018, a change occurred in the blanks, and from that point until the end of the campaign the majority of droplets froze from around to −21 to −26 °C, thus exhibiting a noticeable increase in the background signal. The cause of this change in the quality of the blanks could not be identified, despite several possibilities being tested. To compare sample data against the appropriate set of blanks, the blanks were separated into two categories: (i) “early” blanks analysed between 25 and 30 October 2018 and (ii) the poorer “later” blanks analysed from 31 October to 4 November 2018. The fraction frozen data for these two sets of blanks are shown in Fig. S1 in the Supplement.
Handling blanks were performed in order to assess the extent of contamination that could occur as part of the handling of the samples, using the methods described earlier for the filter and impinger samples. The results are shown in Fig. S2 in the Supplement and show little difference between the handling blanks and the purified water, demonstrating that there was little, if any, contamination introduced into the samples as part of the handling procedure.
Controls for the heat test were also performed by heating purified water and testing it before and after the treatment. Two such tests were performed: one using an “early” blank and one using a “later” blank. The results are shown in Fig. S3 in the Supplement. The control test using water from the “early” part of the campaign demonstrated a small increase in ice-nucleating activity following the heat treatment. However, the control test for the “later” blank demonstrated that the heated water had a similar activity to the unheated water, and the heated “early” water showed similar results to both the heated and unheated “later” water. This suggests very clean blanks (e.g. the “early” untreated water here) are prone to a small amount of contamination upon heating, whereas blanks already containing some notable contamination are unaffected by further heating. Given this, and the fact that no decrease in activity of the purified water blanks was observed following heating, the heat test was determined to be viable for the ambient aerosol samples.
Fraction frozen curves were generated for the aerosol samples and can be found in the Supplement: results for the 3 h filter samples are shown in Fig. S4, the 24 h filter samples are shown in Fig. S5, the impinger samples are shown in Fig. S6, and the heat tests for all of the samples are shown alongside the unheated results in Fig. S7. The plots also show the blanks, and the data for both the blanks and the samples are separated into the “early” and “later” categories so that the samples can be compared against their appropriate blanks.
2.5 Background subtraction of INP data
The data shown in the fraction frozen curves were used to perform background subtraction of the blanks from the sample data in order to remove the influence of impurities from the INP signal. This procedure is described in detail by Vali (2019) and Sanchez-Marroquin et al. (2021). The first step was to bin the data from all of the individual droplet freezing assays, both the blanks and samples, into 0.5 °C temperature intervals, and then calculate the differential freezing nucleus spectrum, k(T) (cm−3 °C−1), using Eq. (2) (Vali, 2019, 1971):
where v is the droplet volume (1 µL, i.e. 0.001 cm3), T is the temperature interval (0.5 °C), N is the number of unfrozen droplets in the temperature interval, and N is the number of droplets frozen in the temperature interval.
The k(T) values for the background data (i.e. the purified water blanks) were obtained by combining all of the droplet freezing temperatures within the respective “early blank” and “later blank” populations. The average and standard deviation of the k(T) values in each temperature bin were determined, and these are shown in Fig. S8 in the Supplement.
These average blank k(T) values for the “early” and “later” populations were subtracted from the sample k(T) values for each temperature bin, as shown in Fig. S9 in the Supplement. Uncertainty values were determined by calculating the randomness of active site distribution within the droplet population during the droplet freezing experiments via Monte Carlo simulations (Harrison et al., 2019), the Poisson uncertainties in the data, and the standard deviation of the background k(T) values, with these uncertainties being combined in quadrature to give the final error values for the sample data. Following the background subtraction of the data in terms of k(T), the final values were converted into the cumulative integrated ice-active site volume density, K(T), a singular approximation, by summing the background-subtracted sample k(T) values for temperatures warmer than T, as per Eq. (3):
The singular approximation assumes that ice nucleation is temperature-dependent and time-independent, that each droplet freezes due to a single nucleation event, droplet freezing occurs at a characteristic temperature depending on the nature of the INPs, and that each droplet contains the same average surface area of ice-nucleating particles. The nucleation of many materials is actually both site- and time-dependent (Knopf et al., 2020; Vali, 2008), but for simplicity we make the assumption here that time dependence is second order (Vali, 2008; Holden et al., 2019, 2021) and so apply the singular approximation.
The K(T) values for the samples calculated using Eq. (3), for both the “early” and “later” populations, are shown in Fig. S10 in the Supplement. From the background-subtracted K(T) values, the INP concentrations, NINP (L−1 of sampled air), are calculated using Eq. (4):
where Vwash is the volume of water used to wash the particles off a collection filter and into suspension or the volume of water in the cone of the impinger (see Table S1), and Vair is the volume of sampled air onto the filter or into the impinger cone (see Table S1). INP concentrations for both the “early” and “later” samples populations for all samples are shown in Fig. S11 in the Supplement.
The ice-nucleating activity of the aerosol throughout the campaign was quantified via calculation of the ice-active site density per surface area, ns(T) (cm−2), from NINP using Eq. (5):
where dS is the surface area concentration of particles in the sampled air (cm2 L−1), assuming that the total surface area was equal to the surface area of mineral dust. dS was calculated for each filter and impinger sampling time based on the OPC and SMPS data (described below) and is provided for each sample in Table S2 in the Supplement in terms of µ m2 cm−3.
2.6 Meteorological data
Local meteorological data were obtained from the Israel Meteorological Service (IMS; https://ims.gov.il/en, last access: 16 May 2024) station no. 44, Beit Dagan: 32°00′26.3′′ N, 34°48′49.6′′ E; 31 m elevation; approximately 11 km north of the campaign site. These data include temperature, atmospheric pressure, rainfall, wind direction, wind speed, and relative humidity.
2.7 Aerosol monitoring
PM10 mass concentrations were obtained from the Israeli Ministry of Environment (IME; https://air.sviva.gov.il/, last access: 16 May 2024) and were measured at the Rehovot station (station no. 56; 31°53′ N, 34°48′ E) located ∼ 1 km from the sampling site, and the concentrations for each sampling period are provided in Table S2 in the Supplement. The 5 min mean data were used, alongside air mass back trajectories and wind directions, to help categorise the air masses each day, as described in Sect. 3.1 and by Gat et al. (2021).
Aerosol sizes and concentrations were also monitored at the sampling site during the campaign using several instruments. An optical particle counter (OPC; GRIMM Technologies Model 1.109) monitoring in the range of 0.25–32 µm was used continuously throughout the campaign and provided data every 6 s. A Scanning Mobility Particle Sizer (SMPS) spectrometer (Model 3938, TSI Inc.) was used to take measurements in the range of 14.1–710.5 nm on a daily basis during the filter and impinger sampling periods.
Since the SMPS was not run continuously throughout the campaign, illustrated time series data for comparison with meteorological conditions show only the OPC measurements. However, for processing of aerosol sample data, the OPC and SMPS data were combined to determine the particle concentration (dN), PM10 mass concentrations, and dS in the size range of 14.1 nm to 10 µm (due to the use of a PM10 filter sampler). PM10, PM2.5, and PM1 mass concentrations were calculated using a particle density, ρ, of 1.0 g cm−3 from the OPC data as this provided the best comparison with the IME station data. However, given that mineral dust has a density of 2.65 g cm−3, the PM10 mass concentrations were also calculated using this value for comparison. In order to combine the OPC and SMPS data, the SMPS particle sizes were converted from the mobility-equivalent particle diameter, dme, to the volume-equivalent sphere diameter, dp, using Eq. (6), as per Möhler et al. (2008):
where χ is the dynamic shape factor that accounts for the shapes of non-spherical particles. Möhler et al. (2008) described how secondary organic aerosols (SOAs) had a χ of 1.0, while dry minerals and dusts could have a χ of 1.3, with mixtures of minerals/dusts and SOAs having χ values of 1.1–1.2. The optical particle diameter measurements from the OPC were assumed to be equivalent to the volume-equivalent diameter already, as per Peters et al. (2006), and so were used as is.
A χ value of 1.1 was used when handling the SMPS data from this campaign as it offered the best agreement between the OPC and SMPS data in and , while the uncertainties when processing the data included the effect of varying the χvalue between 1.0 and 1.2 to account for variability in the types of the aerosols and since the and occasionally matched well between the SMPS and OPC when using these values. Following the conversion of the SMPS data to dp, the overlap in the SMPS and OPC particle size ranges was addressed by restricting the SMPS size range to 0.0128–0.315 µm (Dp) and the OPC size range to 0.325–10 µm for PM10 as this offered the best agreement in and ,
2.8 Size-resolved biological analysis
Size-segregated ambient dust particles were analysed for their bacterial and fungal content as described by Gat et al. (2021). Aerosol particles were collected onto Cyclopore polycarbonate filters every day of the campaign using a micro-orifice uniform deposit impactor (MOUDI; MSP Corporation model 110-R) (Marple et al., 1991), which operated at 30 L min−1 for 8 h, similarly to Huffman et al. (2013) and Mason et al. (2015). The collection efficiencies for the stages of this MOUDI are provided in Reicher et al. (2019). DNA was extracted from the filters using the DNeasy® PowerWater® kit (Qiagen) with slight modifications to the manufacturer's protocol: elution was divided into two steps, adding 50 µL of elution buffer (EB) solution and centrifuging at 13 000 g for 1 min each time. The filters were cut in half, and half of each filter was stored as a backup at −20 °C.
The amount of DNA that was collected on each filter was very small, nearly below the minimal threshold that can allow amplification and detection by polymerase chain reaction (PCR). Therefore, two filter halves from sequential MOUDI sampler stages were combined in each PowerWater® bead tube, which enabled the extraction of a sufficient amount of DNA, as well as keeping an identical back-up. Stages 2 (D50 = 5.6 µm) and 3 (D50 = 3.2 µm) of the MOUDI were combined to give the “coarse” particle size range (3–18 µm), stages 4 (D50 = 1.8 µm) and 5 (D50 = 1.0 µm) were combined to give the “intermediate” particle size range (0.3–3 µm), and stages 6 (D50 = 0.6 µm) and 7 (D50 = 0.3 µm) refer to the “fine” particle size range (< 1.3 µm). After extraction, the DNA samples were stored at −20 °C for further analysis. Blank filters were extracted similarly.
Total bacterial and fungal concentrations were determined by quantitative polymerase chain reaction (qPCR), using primers listed in Table S3 in the Supplement. Bacterial DNA was analysed via amplicon sequencing of the 16S rRNA gene, while fungal activity was analysed using the ribosomal internal transcribed spacer (ITS) region. qPCR reactions were performed as follows: 10 µL of SensiFAST® SYBR mix (Bioline), 2 µL each of forward and reverse primers (initial concentration of 10 mM each, with a final concentration of 1 mM each), 2 µL of extracted DNA (template), and 4 µL of PCR-grade deionised water (DI) to a total reaction volume of 20 µL, with triplicates for each DNA sample and a negative control (i.e. a blank filter). qPCR was conducted separately for ITS and 16S. Amplification was performed in 96-well plates using a StepOnePlus® Real-Time PCR instrument (Thermo Fisher Scientific), as follows: 5 min at 95 °C, followed by 40 cycles of 5 s at 95 °C, and 30 s at 60 or 52 °C for 16S or ITS annealing temperatures, respectively. A melting curve stage at 60–95 °C was included, confirming substrate-specific amplification. Standard curves were constructed using known concentrations of plasmids containing the relevant genes along with a non-template control.
2.9 Air mass back trajectories
The National Oceanic and Atmospheric Administration (NOAA) Air Resources Laboratory's HYSPLIT (Hybrid Single Particle Lagrangian Integrated Trajectory) model (https://www.ready.noaa.gov, last access: 16 May 2024) (Stein et al., 2016; Fleming et al., 2012; Draxler and Hess, 1998; Rolph et al., 2017) was used to generate 72 h back trajectories of the movements of air masses to the sampling region during the field campaign. Back trajectories were obtained for 10:00 local time (08:00 UTC) and 18:00 LT (16:00 UTC) every day of the campaign.
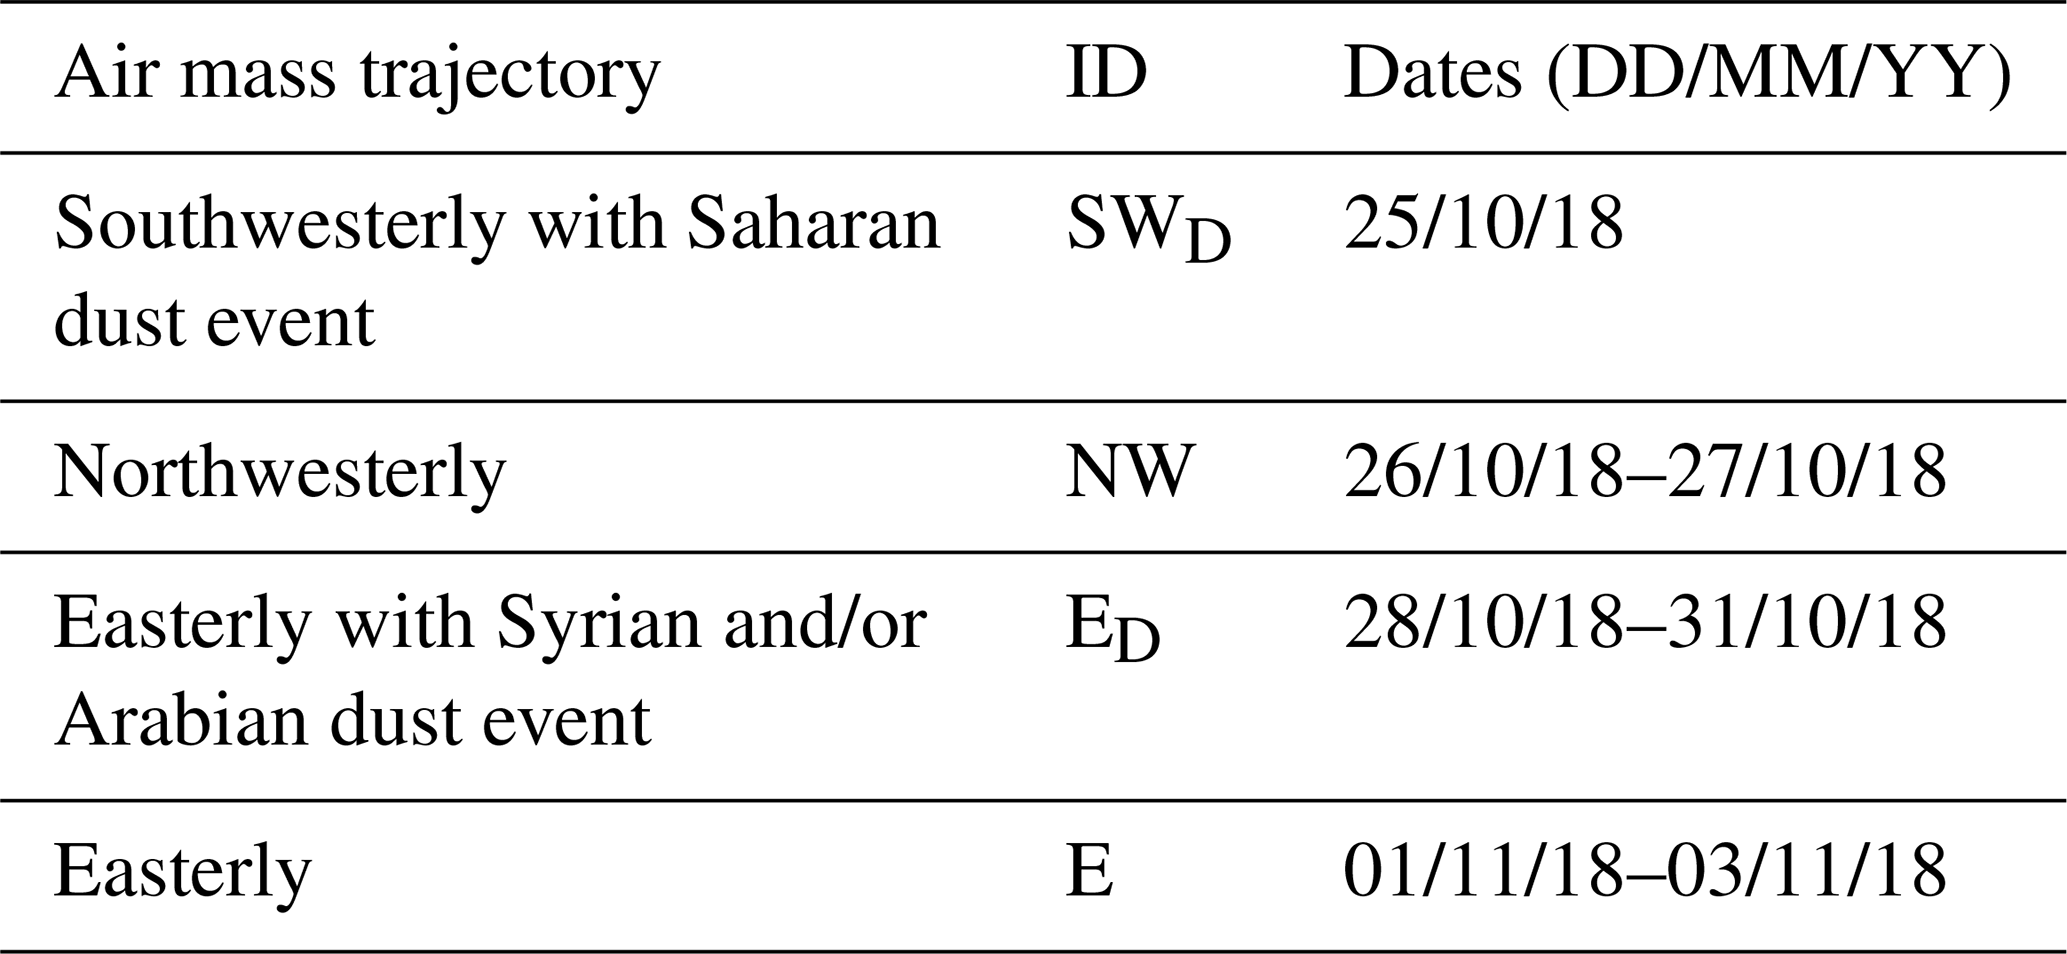
The 72 h duration of the back trajectories was chosen as a consensus in order to assess the long-range transport of air masses while limiting the trajectory error (Kahl and Samson, 1986; Karaca et al., 2009; Sari et al., 2020). The trajectories were calculated for three arrival heights (500, 1500, and 2500 m) because mineral dust is transported below 3 km in this season (Gobbi et al., 2004). In most cases, all three trajectories travelled in the same path, and therefore air mass classifications (see Table 1) were based on the three of them. However, even if only one trajectory originated in a dust source area, and high PM10 concentrations (from the IME site) were measured, this would be defined as the dust origin.
Table 1Classification of air mass trajectory categories as per Gat et al. (2021), which was part of the same field campaign. Days with dust events are identified with a subscript “D” and were identified as dust events if the PM10 loading for the day exceeded 44 µg m−3 (Krasnov et al., 2016; Gat et al., 2021). Dates are in the DD/MM/YY format.
3.1 Ice-nucleating particle concentrations
Of the different types of sampling performed (3 h filters, 24 h filters, 20 min impinger samples), the 3 h filter samples provide a more complete and consistent time series for the campaign; hence they are the main results presented here. The final INP concentrations for the 3 h filter samples, collected every morning and afternoon throughout the campaign, are presented in Fig. 1a and demonstrate a range of variability in INP concentrations during the 2-week campaign, from ∼ 0.2–14 INP L−1 of air in the temperature range of −10 to −25 °C. Concentrations were sufficiently high, and even with the relatively short sampling times and volumes employed here they were largely above the baseline of the cold-stage instrument, enough to be well above the lowest freezing temperature of the instrument (see Fig. S9 in the Supplement), varying between ∼ 0.1–2 INP L−1 at −20 °C.
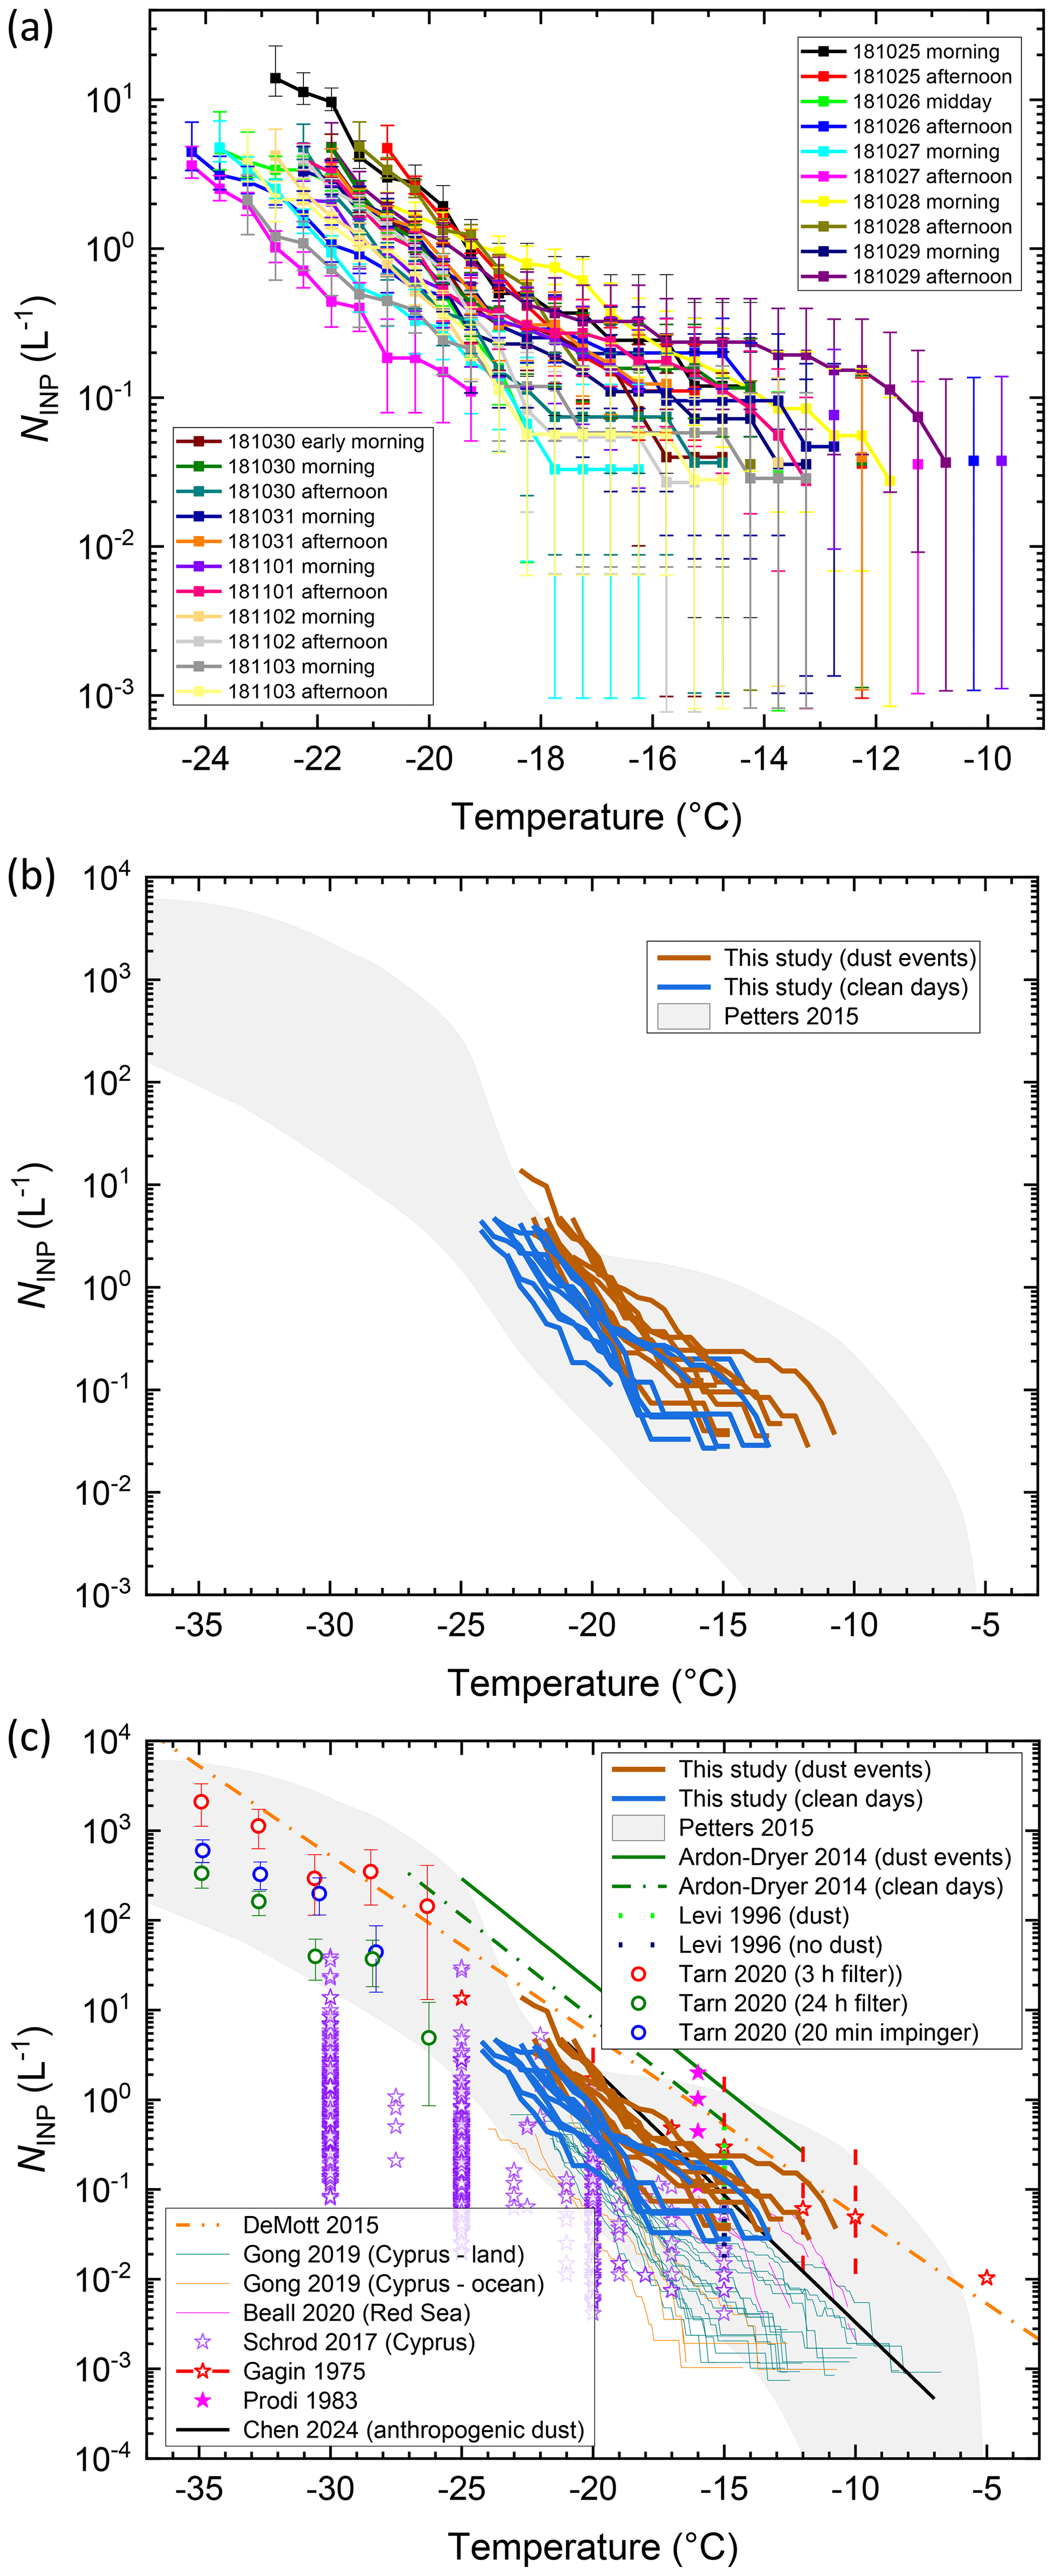
Figure 1Plots showing ice-nucleating particle (INP) concentrations (NINP) in Israel. (a) Background-subtracted INP concentration spectra for samples collected for 3 h onto filters from 25 October–4 November 2018. The temperature error is estimated to be 0.4 °C (Whale et al., 2015). Dates are given in the YYMMDD format. (b) The same data shown represented as being from a dust event (brown) or a clean day (blue), overlaid onto the INP concentration range of precipitation samples compiled by Petters and Wright (2015) shown in grey. (c) Comparison of INP concentration data from this study to literature data obtained in Israel and in nearby regions of the eastern Mediterranean. Literature data are represented as discrete data points (Gagin, 1975; Levi and Rosenfeld, 1996; Schrod et al., 2017; Tarn et al., 2020) or as lines (Beall et al., 2022; Gong et al., 2019) as appropriate. Also shown are parameterisations for mineral dust from DeMott et al. (2015) and for anthropogenic dust from Chen et al. (2024).
Some INP concentrations also exhibited a “hump” of activity at the warmer range of freezing temperatures (in particular the “181029 afternoon” sample), which could be indicative of biological INP activity (Schnell, 1981; Conen et al., 2011; O'Sullivan et al., 2014, 2018). This phenomenon is discussed in further detail later in the article.
The 24 h filter data, shown in Figs. S11a and S12 in the Supplement, show consistent INP concentrations that reside within the median of the 3 h filter data. This is likely a consequence of averaging the INP data over such a long period of time during changes in NINP between high and low values, for example if there were rapid changes in NINP with diurnal cycles or changes in air masses. This highlights the need for shorter time resolution measurements.
The NINP values from the Coriolis® impinger, measuring particles > 0.5 µm, are shown in Figs. S11 and S13 in the Supplement, were collected on a timescale of 20 min (60 min in one case) and showed a large degree of variability depending on the air mass; this will be described further when discussing the time series of the campaign. Further, as for the 3 h filter results, the “181029 afternoon” impinger results exhibited a notable potential “biological hump” on NINP at the warmer temperatures, which will be explored alongside the 3 h filter data later in the article.
Figure 1b illustrates the 3 h filter data shown in Fig. 1a but now separated into two populations: “dust events” and “clean days”. The categorisation of these populations is prescribed by Gat et al. (2021), who performed an analysis of airborne bacterial and fungal communities during the same campaign. Air masses were categorised based on the back trajectories for a given day, as assigned by Gat et al. (2021) previously, and these are shown in Table 1. Days during which the PM10 concentrations (using data from the IME site) for the entire day were greater than 44 µg m−3 were classified as dust events as per Krasnov et al. (2016) and were designated with a subscript “D”. Thus, INP measurements taken on days designated as dust events are shown as brown lines in Fig. 1b, while those on clean days are shown as blue lines. However, it must be noted that the region is typically dusty regardless; hence the term “clean days” is relative. Most “clean days” would still be dusty but below the 44 µg m−3 threshold. Also shown in Fig. 1b are the boundaries of the global INP data compiled from precipitation sample data from between 1971–2014 by Petters and Wright (2015) to provide context for where these campaign data sit.
3.2 Comparison to literature NINP data
INP concentrations from this campaign are plotted against relevant literature data in Fig. 1c. The results demonstrate that, with only a few exceptions at temperatures warmer than ∼ −19 °C, the dust days had consistently higher INP concentrations than the clean days. The data fit largely well within the boundaries of the global INP from Petters and Wright (2015), with the eastern Mediterranean data sitting in the middle of the compiled data above ∼ −24 °C.
When compared to the INP concentrations measured by Gong et al. (2019) in Cyprus from both land and oceanic sources at an earlier time in the year (2–30 April 2017), our clean day data are consistent with much of the land sector data and much higher than the ocean sector data. However, data obtained in the Red Sea (5–7 July 2017), with air masses flowing over the Nile Delta and the Sinai Peninsula, by Beall et al. (2022) during a ship campaign, compare well with much of the dust event data from our campaign. Only a portion of the data of Schrod et al. (2017), taken at altitudes of 717–2550 m a.m.s.l. over Cyprus using UASs, are in the same temperature regime as our INP measurements, but in the ranges of −17.5 to −22.5 °C the datasets compare well despite the altitude difference, although the Schrod et al. (2017) data typically cover a wider INP concentration range.
Aircraft and ground-based measurements by Gagin (1975) in Israel showed INP concentrations similar to ours at −20 °C, and while there is some comparison at −15 and −12 °C, the concentrations tend to trend higher than all but our most active samples. Levi and Rosenfeld (1996) collected filter samples at ground level for INP analysis at −15 °C, using a static thermal diffusion chamber, during dust events and clean days. Their results showed that INP concentrations more than doubled during dust storms.
The data from Tarn et al. (2020) were obtained using three of the same samples collected during the October–November 2018 campaign: a 3 h filter sample (“181031 afternoon”), a 24 h filter sample (“181025 to 181026 (24 h)”), and an impinger sample (“181103 afternoon (impinger)”). These samples were analysed using the Lab-on-a-Chip Nucleation by Immersed Particle Instrument (LOC-NIPI). The LOC-NIPI is a continuous flow cold-stage instrument that analyses 100 µm diameter droplets (∼ 520 pL). Although these data do not overlap in temperature with the µL-NIPI data (using 1 µL droplet arrays), they extend the INP data to colder temperatures and are complementary to the 3 h filter results shown here.
The “dust event” and “clean day” data of Ardon-Dryer and Levin (2014) from ground-based measurements are much higher in concentration compared to all other available literature data from the region but showed similar trends to those illustrated here. The INP parameterisation of DeMott et al. (2015) for mineral dust particles larger than 0.5 µm was calculated based on the OPC data and is shown in Fig. 1c, but it is much higher than the bulk of the INP data from the region. The recent parameterisation for anthropogenic INPs of Chen et al. (2024), which uses supermicron aerosol concentrations to estimate heat-resistant INP concentrations from sources such as traffic-influenced road dust, sits at the top end of our INP data below about −15 °C, though the sampling site, being in a ubiquitously dusty environment and prone to air masses from varied locations, was a very different to the metropolis from which the parameterisation was derived. It is therefore difficult to compare the parameterisation directly in terms of INP concentration, but given the presence of mineral dust in the region, particularly of K-feldspar, the influence of anthropogenic dust is not expected to be a dominant source of INPs.
3.3 Time series of the eastern Mediterranean campaign
A time series of multiple datasets for the duration of the campaign in Rehovot, Israel, from 25 October to 3 November 2018, is provided in Fig. 2. Meteorological data obtained from the IMS station in Beit Dagan (11 km away) are shown in Fig. 2a–e. Aerosol data measured using the GRIMM OPC are provided for particle concentrations (dN) (Fig. 2f), PM mass concentrations (Fig. 2g), and particle size distributions in terms of Dp vs. (Fig. 2h). The SMPS data are not represented here as the SMPS was not used continuously, unlike the OPC, though the SMPS data were used when calculating ns(T). The raw particle count data for both the OPC and SMPS are illustrated in Figs. S14 and S15 in the Supplement, respectively. A higher-resolution version of the Dp vs. plot comprising both the OPC and SMPS data, and for the full size range up to 32 µm, is shown in Fig. S16a in the Supplement. The surface area distribution (dS) in terms of Dp vs. for the OPC and SMPS data, for the full size range, is shown in Fig. S16b in the Supplement. Figure 2g shows the PM10 data from both the OPC and the IME station and shows good agreement when a particle density of 1 g cm−3 was assumed when processing the OPC data. However, since mineral dust can have a density of 2.65 g cm−3, the OPC data were also processed using this density value to demonstrate the upper limit of PM10 mass concentration, highlighting an approximately 2–3 × increase compared to the values processed using 1 g cm−3 during periods when more coarse particles were measured in higher concentrations (see Fig. 2h).
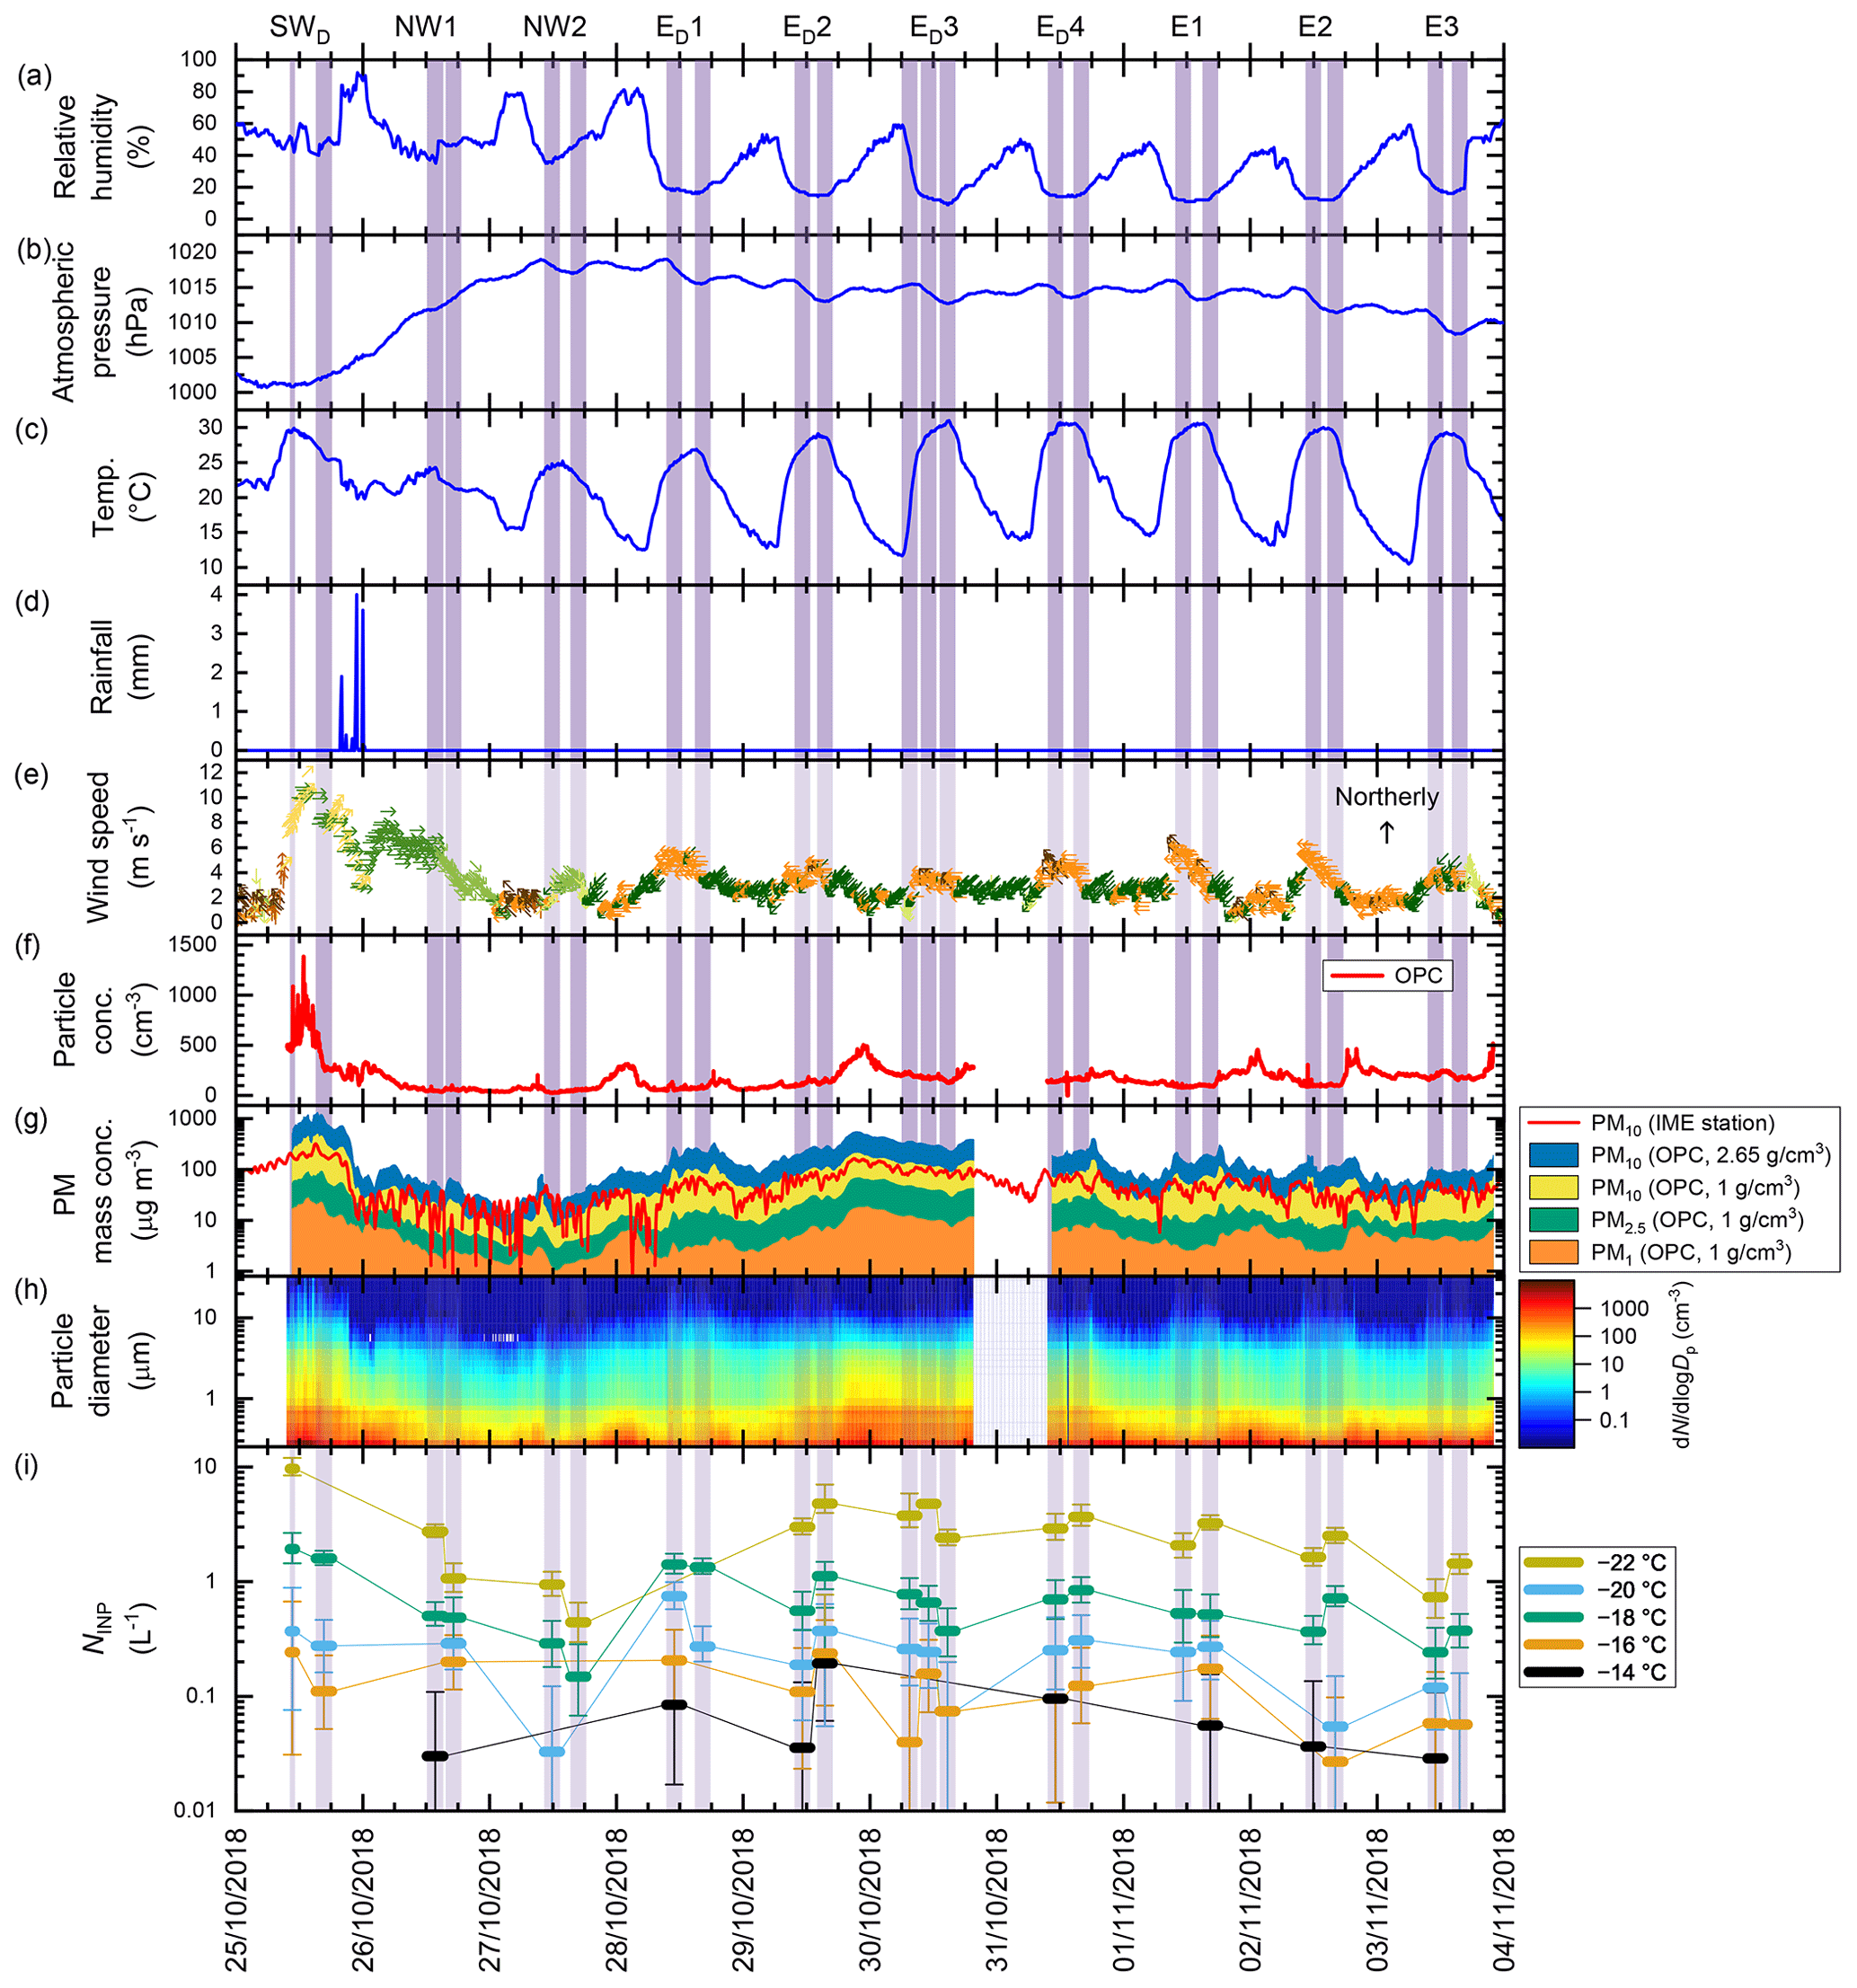
Figure 2Time series of meteorological and aerosol data for the field campaign in Rehovot, Israel, with dates in the DD/MM/YYYY format. The air mass category for each day is provided at the top (e.g. SWD, NW1 …). The 3 h filter sampling times are shown as vertical purple bars. (a–e) Meteorological data from the Israel Meteorological Service (IMS) station at Beit Dagan: (a) relative humidity, (b) atmospheric pressure, (c) temperature, (d) rainfall, and (e) wind speed, with wind direction represented by coloured arrows. (f) Total aerosol particle concentration, dN, determined using the OPC. (g) PM10 (for ρ = 1 and 2.65 g cm−3), PM2.5, and PM1 mass concentrations from the OPC data (hourly moving average), alongside PM10 concentrations from the Israeli Ministry of Environment (IME) station near the sampling site. (h) Particle size (Dp) distributions () obtained using the OPC. (i) Background-subtracted ice-nucleating particle concentrations (NINP) at −14, −16, −18, −20, and −22 °C during each sampling period.
INP concentrations at selected temperatures (−14, −16, −18, −20, and −22 °C) were calculated from the 3 h filter data in Fig. 1a and are illustrated in Fig. 2i, while the sampling times are shown as purple bars throughout the figure. The air mass category and ID developed by Gat et al. (2021) for the campaign are provided for each day at the top of the image based on wind directions and air mass back trajectories. HYSPLIT air mass back trajectories for 10:00 and 18:00 LT are provided in Fig. S17 in the Supplement and are in good agreement with those of Gat et al. (2021), who used a Lagrangian analysis tool, LAGRANTO 2.0 (Sprenger and Wernli, 2015), for analysis of the same time periods.
The campaign began with the tail end of a Saharan dust storm event from the southwest (SWD) (Fig. 2e) on 25 October, with the air mass also passing over the fertile land of the Nile Delta (Fig. S17 in the Supplement). This air mass yielded the highest aerosol concentrations throughout the campaign, with particle surface area concentration modes for particles of ∼ 0.2 and ∼ 4 µm diameter and some of the highest INP concentrations throughout the campaign. This was immediately followed by an intense rainstorm later that same night (Fig. 2d), which saw aerosol concentrations plummet for the following 2 d with the air masses coming from the northwest through central and eastern Europe and over the Mediterranean Sea. INP concentrations at the colder temperatures (−20 and −22 °C) dropped significantly on 26 October compared to the SWD event, while they remained somewhat comparable at warmer temperatures (−16 and −18 °C). Concentrations at all of these temperatures dropped further on 27 October during the same NW trajectory period, although there were multiple changes in wind direction throughout those sampling times as shown in Fig. 2e, which may have influenced those results. The 20–60 min impinger samples from 26 and 27 October exhibited the lowest INP concentrations in the impinger data (Fig. S13 in the Supplement), consistent with the data from the 3 h filter samples.
On 28–31 October, air masses coming from the east, carrying dust from Syria (the ED category) were seen. This saw an increase in particle concentrations and surface area concentrations for larger particle sizes, in addition to higher INP concentrations, similar to those in the SWD event. INP concentrations (at −18 to −22 °C) remained consistently high throughout this 4 d ED period. Interestingly, while the 72 h air masses back trajectories on 30 and 31 October came almost entirely over land from the east, those on 28 October largely came from Europe, passing over a portion of the Mediterranean Sea, and only spent a relatively short time over the land to the east of the sampling location. Impinger samples were collected for 20 min during the afternoons of 28 to 30 October, and these showed high INP concentrations (Fig. S13 in the Supplement), again consistent with the 3 h filter samples.
The afternoon of 29 October was of particular interest, with notably high INP concentrations at −14 to −16 °C, with the 20 min impinger sample from that time yielding the highest INP concentrations of the impinger dataset. Here, the air mass came from the north (see the HYSPLIT air mass back trajectory in Fig. 3), passing over the eastern side of the Black Sea and over the region known as the Fertile Crescent (the approximate location of the ancient Fertile Crescent is shown in Fig. 3), which spans the northern regions of Israel, Syria, and Iraq. The Fertile Crescent is the historical origin of agriculture and animal herding that started around 12 000 years ago (Salamini et al., 2002), though in modern times it has suffered from long-term drying and is increasingly prone to drought (Kelley et al., 2015; Zittis et al., 2022), but it still remains an active location for agriculture and vegetation (Zaitchik et al., 2007). Given this unique air mass trajectory amongst the rest of the dataset, the high INP concentrations at warmer temperatures, and the “hump” in the INP spectrum that may indicate biological INP content as mentioned earlier, these data are hence discussed in further detail later in the article.
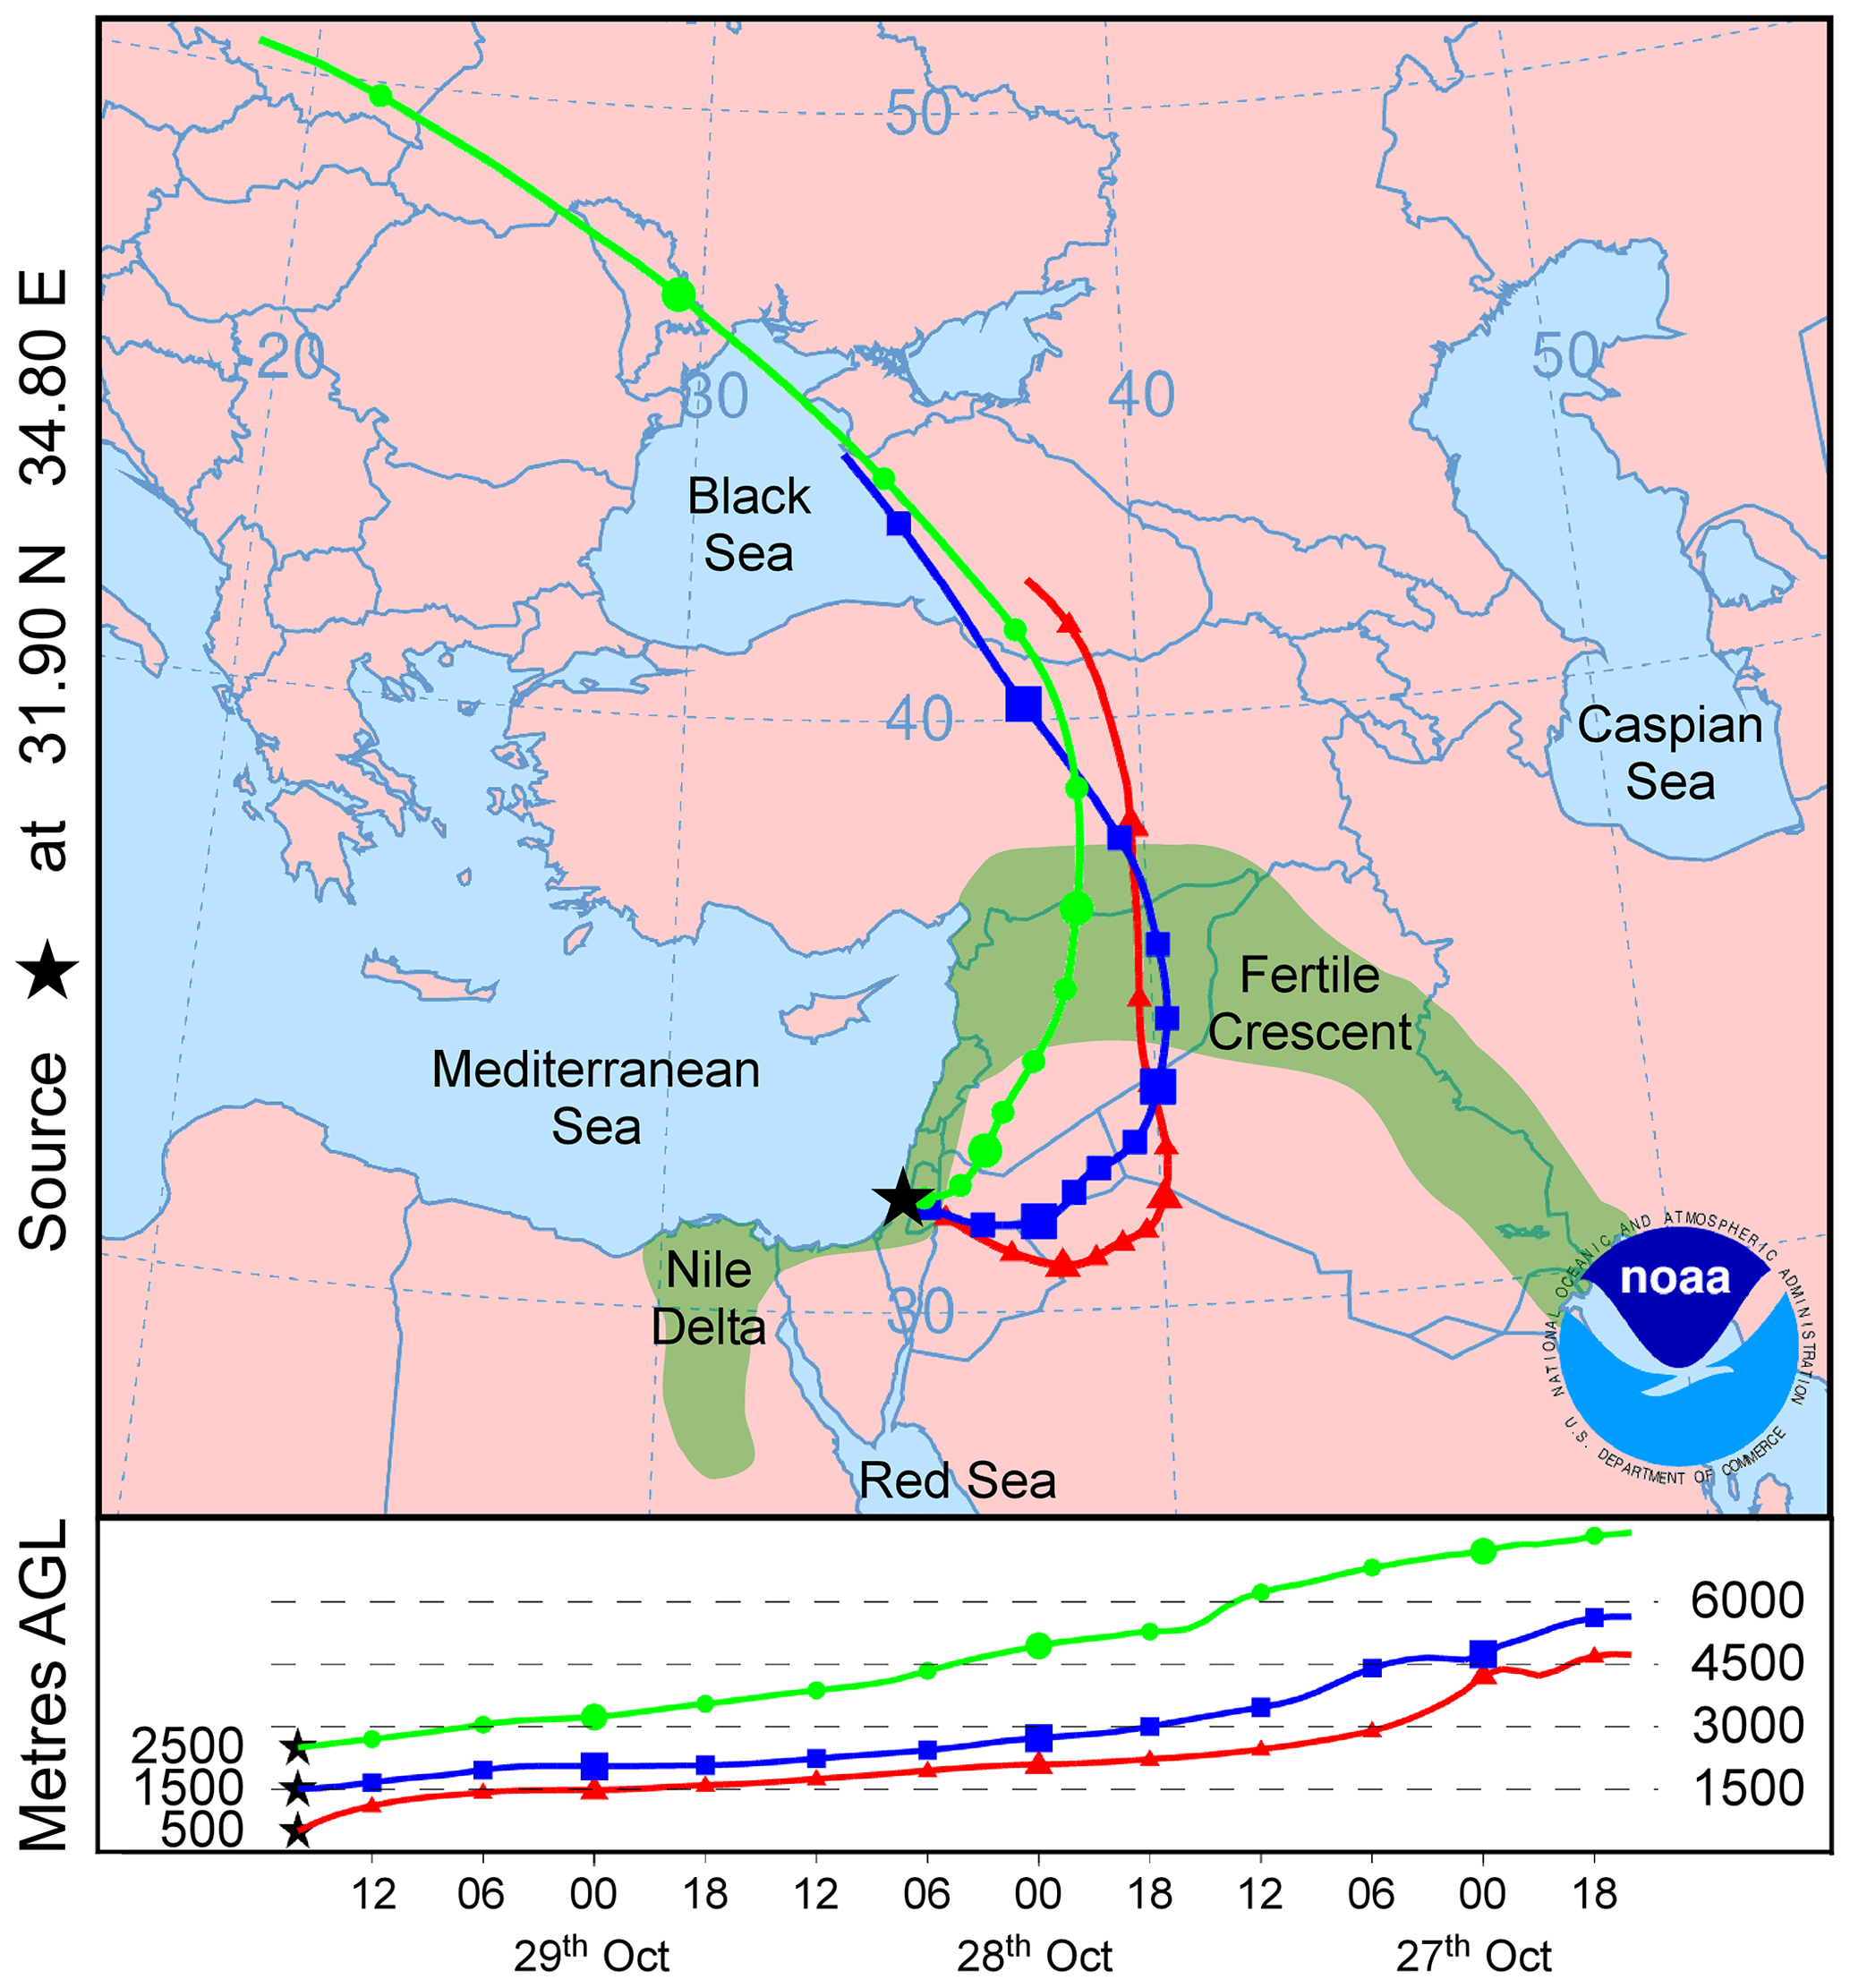
Figure 3Air mass back trajectory (72 h duration) for 29 October 2018 (ED2), obtained using NOAA's HYSPLIT tool, showing three arrival heights at the sampling site: 500 m (red), 1500 m (blue), and 2500 m (green) above ground level (a.g.l.). The approximate location of the ancient Fertile Crescent region is shown in green. The black star represents the sampling site.
Following the ED dust event, the remainder of the campaign from 1 to 4 November was characterised by easterly winds and air mass back trajectories that were similar to the preceding 2 d, but with lower aerosol particle concentrations. With this decrease in aerosol concentration came a steady decrease in INP concentrations at the colder temperatures, and a general trend of INP concentrations in the afternoons being higher than those in the morning. The 20 min impinger samples from the 2 and 3 November also showed decreasing activity following the ED event (see Fig. S13 in the Supplement).
3.4 Potential biological INP content
As discussed earlier, some INP concentrations in Fig. 1a showed a “hump” of higher activity in the spectra at warmer temperatures, which may be indicative of biological INP activity that could be associated with dust or soil particles (O'Sullivan et al., 2014; Conen et al., 2011; Schnell, 1981; Schnell and Vali, 1976). The most notable sample spectrum exhibiting this potential “biological hump” was from the afternoon of 29 October (Fig. 1a). That specific air mass had passed from eastern Europe and over the Fertile Crescent to the north of the sampling site (Fig. 3) during the easterly dust event (ED2). This was corroborated by a similar hump in the 20 min impinger data during that same time frame (see Fig. S18 in the Supplement).
By coincidence, the sampling on the afternoon of 29 October was performed simultaneously with two BGI PQ100 filter samplers: one set up for PM10 and one set up for PM1. The results for these can be seen in Fig. 1a, with a more direct comparison in Fig. S18 in the Supplement alongside the impinger data from the same time frame. The NINP of the PM1 aerosols was relatively high, though also notably lower than for PM10, suggesting that while much of the ice-nucleating activity was due to particles in the 1–10 µm size range, there was still a lot of activity caused by particles < 1 µm. The PM1 data also showed the same “biological” hump as in the PM10 data.
As a further means to test for biological ice-nucleating activity, we performed heat treatments (95 °C for 30 min) (Christner et al., 2008a; Daily et al., 2022) on nearly every sample collected and compared the ice-nucleating activities of the original samples to the heated samples in Fig. 4 for the 3 h filter samples. The heat test results for the 24 h filter samples and the impinger samples are provided in Figs. S19 and S20 in the Supplement, respectively.
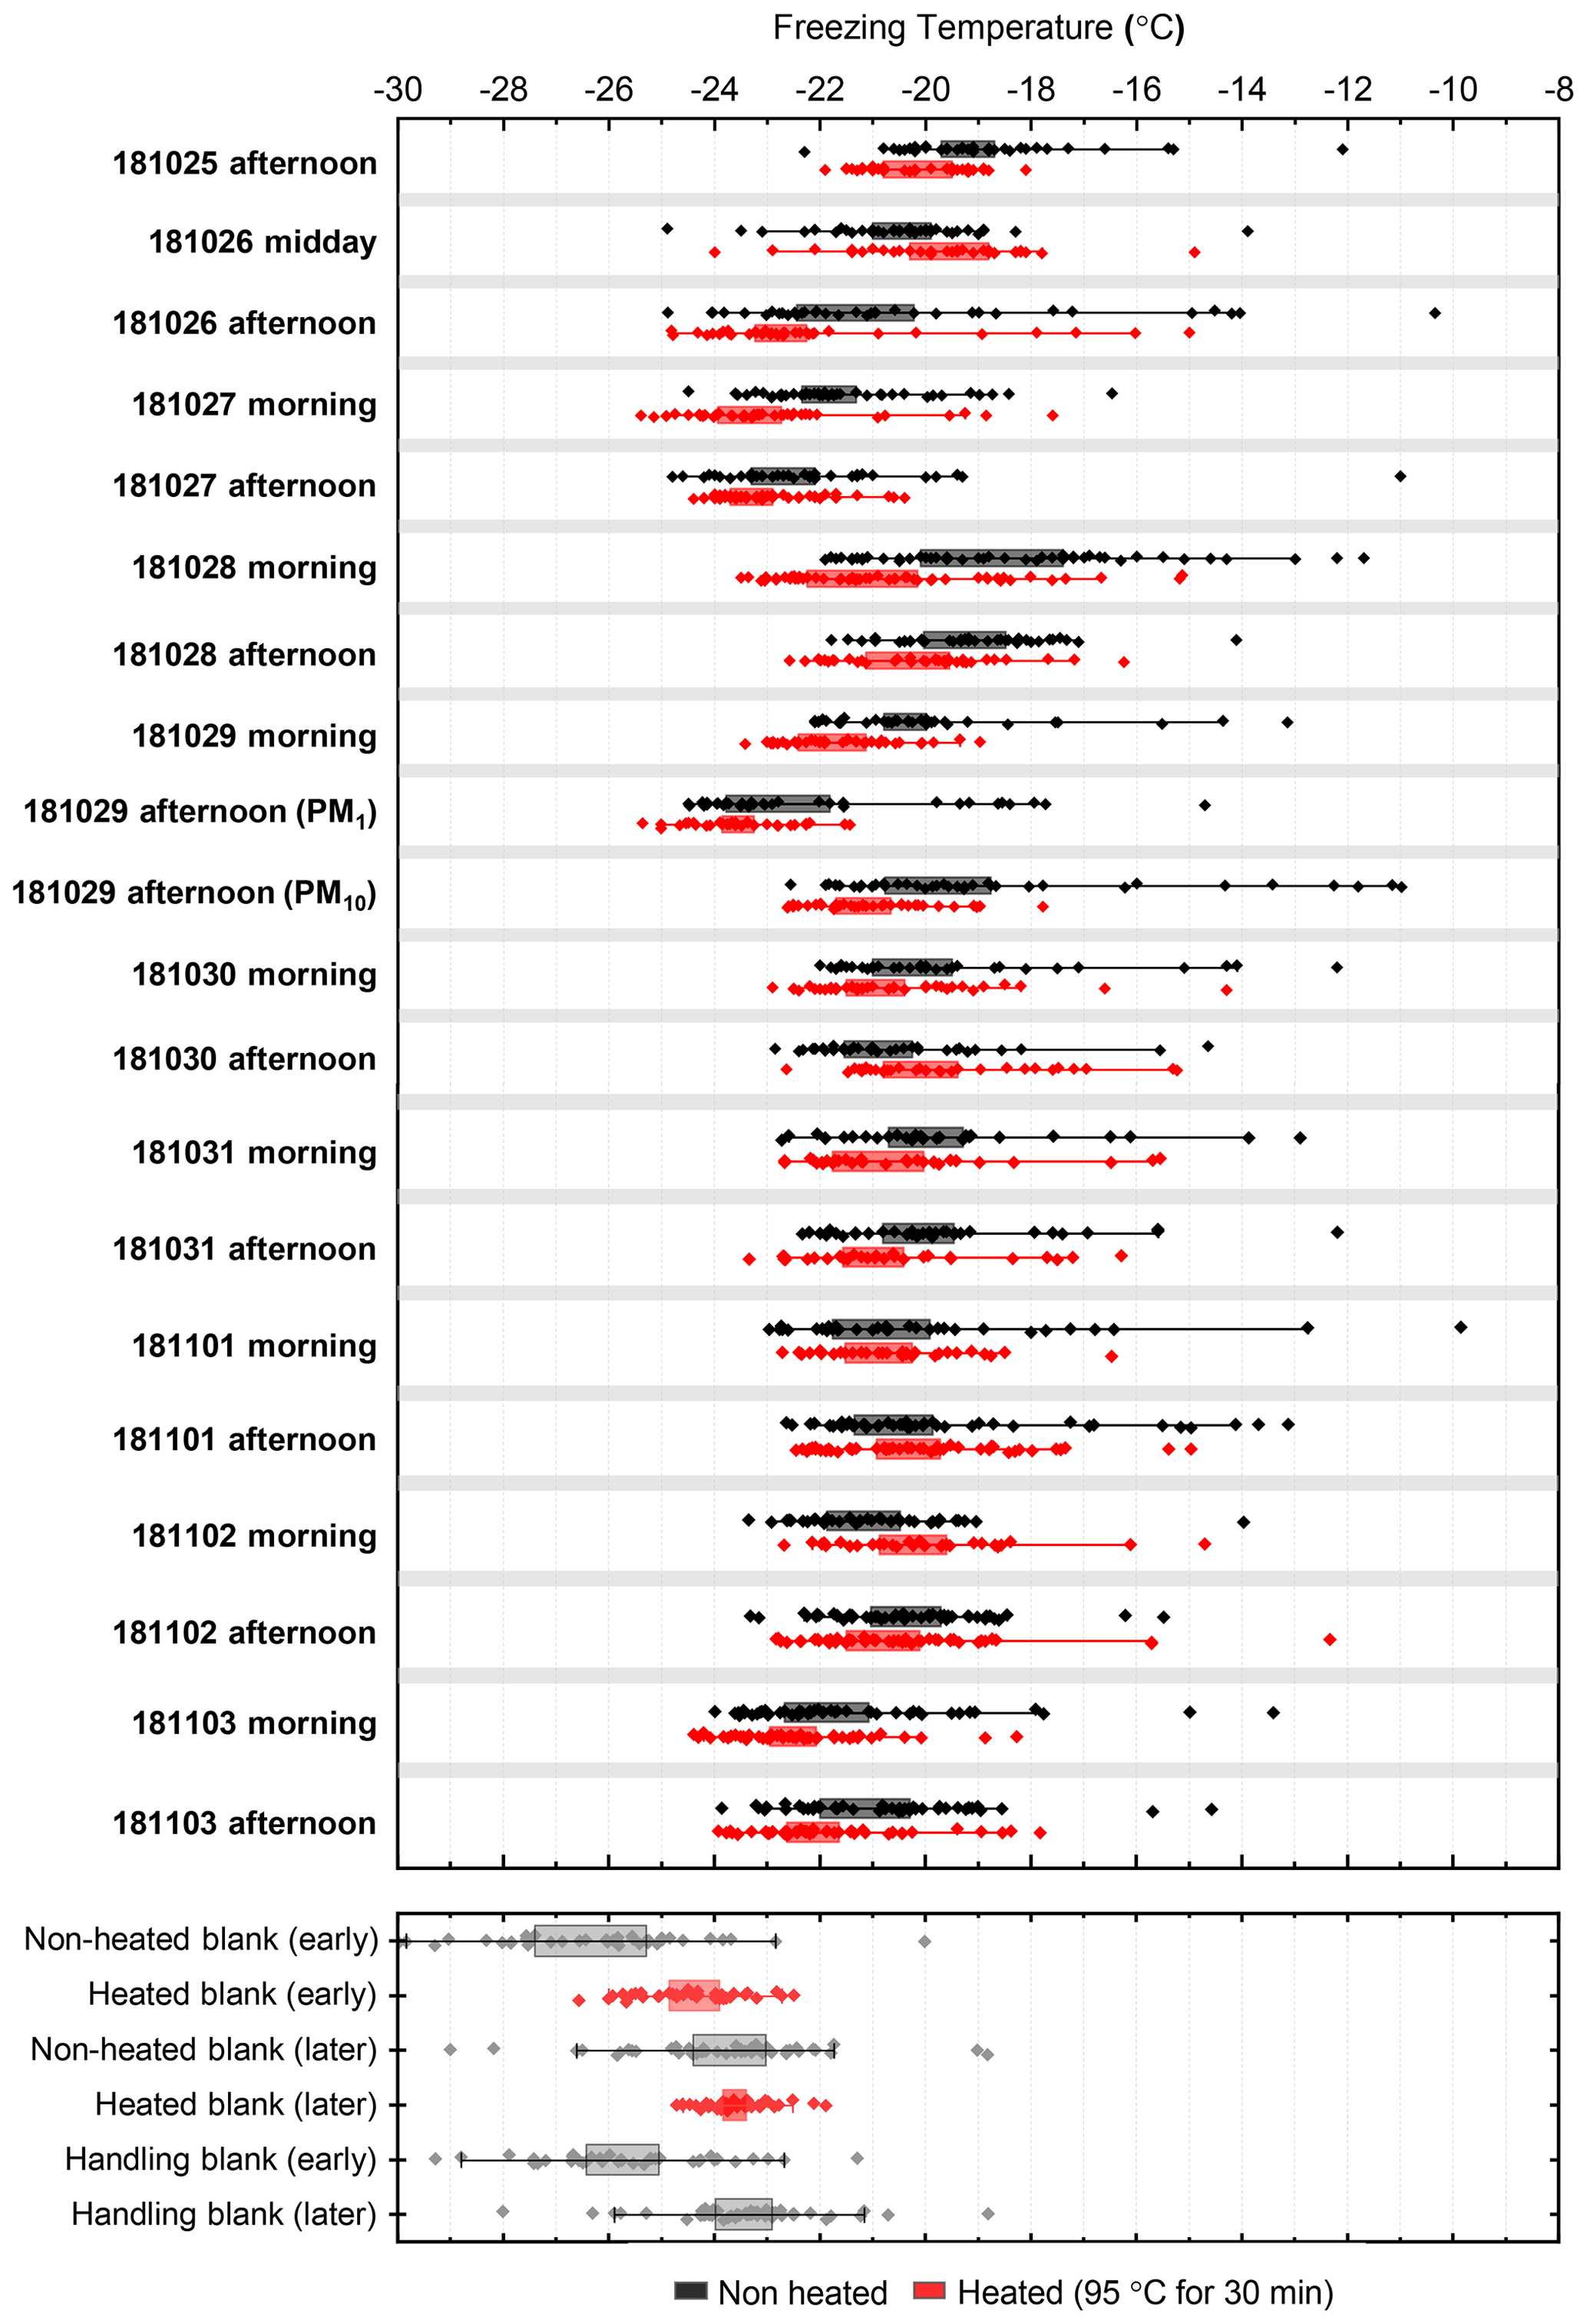
Figure 4Box-and-whisker plot showing the effect of heat treatment (95 °C for 30 min, as per Daily et al., 2022) on the ice-nucleating activity of aqueous particle suspensions obtained from 3 h filter samples. This heat treatment is used as an indicator for the potential presence of proteinaceous INPs should there be a notable loss of activity at warmer temperatures following the heat treatment. Boxes represent 1 standard deviation from the mean (1σ; 68 %), while whiskers represent 2 standard deviations (2σ; 95 %). Dates are given in the YYMMDD format.
Heat treatment of the sample from the afternoon of 29 October demonstrated a significant loss in activity at the warmer parts of the PM10 and PM1 curves (Fig. 4), i.e. a loss of the “hump” in each case (also see Fig. S18 in the Supplement). The heat treatment of an impinger sample also showed a flattening of the hump (see Fig. S18 in the Supplement), though not a similar dramatic loss in activity as for the filter samples. The heat treatment is not a definitive test for biological material, but since we expect the mineral ice-nucleating activity to be controlled by K-feldspar in this region (Boose et al., 2016), we believe it to be a reasonable indicator that the “humps” in the NINP data were due to biological INP activity given the caveats of the procedure described by Daily et al. (2022). Thus, it is possible that biological INPs may have been entrained into the air mass as it passed over the Fertile Crescent to the north of the sampling site (see Fig. 3). While speculative, this suggests that the Fertile Crescent could be a potential source of high-temperature, heat-labile INPs for the eastern Mediterranean and Middle Eastern regions.
While not as pronounced, the NINP data from the morning of 29 October also exhibited a notable hump that was lost following heat treatment, with the air mass for that sample having passed over a small region of the Fertile Crescent to the north of the sampling site. No other sampled air masses (for 500 m a.g.l.) passed over the same area throughout the campaign, making these measurements unique, but the hypotheses therefore speculative. However, Gong et al. (2019) noted a potential biological signal in their INP concentrations at temperatures warmer than −15 °C during their campaign in Cyprus and suggested it originated locally, but we note that a handful of their air mass back trajectories appeared to pass over the Fertile Crescent and the Nile Delta regions.
A handful of other NINP spectra potentially displayed smaller potential biological humps and were found to be sensitive to heat treatment (Fig. 4). The sample for the afternoon of 25 October also comprised a unique air mass for the campaign, originating from the west of Italy before travelling over the north of the Sahara and passing over the Nile Delta, the southeasternmost part of the Fertile Crescent, which may have contributed biological INPs to the sample. This would also agree with the findings of Beall et al. (2022) during the Red Sea leg of their cruise when they encountered air masses from the Nile Delta that showed heat-labile, likely biological, INP content. The sample from the afternoon of 26 October also demonstrated a small degree of heat sensitivity following the rain event that washed a lot of dust from the air, with the following air mass passing over central/eastern Europe and the Mediterranean Sea prior to reaching the sampling site.
Samples for 1 November (morning) and 3 November (afternoon), obtained during the easterly air mass event (E1–E3) may have shown a minor decrease in NINP following heat treatment in the 3 h filter and the impinger samples, and the air masses did not appreciably differ from those throughout the rest of the easterly event. We do note, however, that the Fertile Crescent extends to eastern Iraq and western Iran and so could potentially have had an influence on air masses encountered by the sampling site, although the contribution of biological INPs here was relatively minor, particularly compared to the results from the air masses that passed over the northern Fertile Crescent (ED2).
Israel has varying airborne microbiomes that depend on air mass, and Gat et al. (2017, 2021), Erkorkmaz et al. (2023), and Peng et al. (2021) have measured a variety of desert- and soil-associated bacteria and fungi in air masses that passed over the Nile Delta and the Arabian Peninsula, with some of the latter cases also containing agricultural soil bacteria. Samples from days with no dust events mostly contained bacteria associated with human activity. Interestingly, dust storms were found to lower the proportion of fungi in the airborne microbiome of the region (Peng et al., 2021). Further, biological components found in soil dust associated with wind events in the region have been found to exhibit reduced biological activity after sterilisation, which further supports the heat treatment results and the hypothesis presented here (Pardo et al., 2017).
Throughout the October–November 2018 measurement campaign, Gat et al. (2021) performed an in-depth analysis of the microbiome of the air masses via amplicon sequencing of the 16S rRNA gene and ribosomal internal transcribed spacer (ITS) region to study size-resolved bacteria and fungi, respectively. Their results showed that bioaerosol communities varied with air mass and that there was significant transport of bacteria as aggregates or attached to dust particles during the SWD and ED dust events (Erkorkmaz et al., 2023; Gat et al., 2021). Bacterial communities, particularly those of single cells smaller than 0.6 µm, were comprised of mixtures from local and transported sources. Further analysis of that data, presented here in Fig. 5, demonstrates the highest concentration of airborne fungal (ITS) gene copy numbers (GCNs) across the three particle size ranges (fine, intermediate, coarse) during the SWD event on 25 October, where the air mass had travelled over the Nile Delta, while the bacterial (16S) concentrations were the highest in both the coarse and intermediate modes during that event. This finding is supported by a recent study by Erkorkmaz et al. (2023), who confirmed that more bacteria are transported in the large size fraction in dust plumes across the eastern Mediterranean.
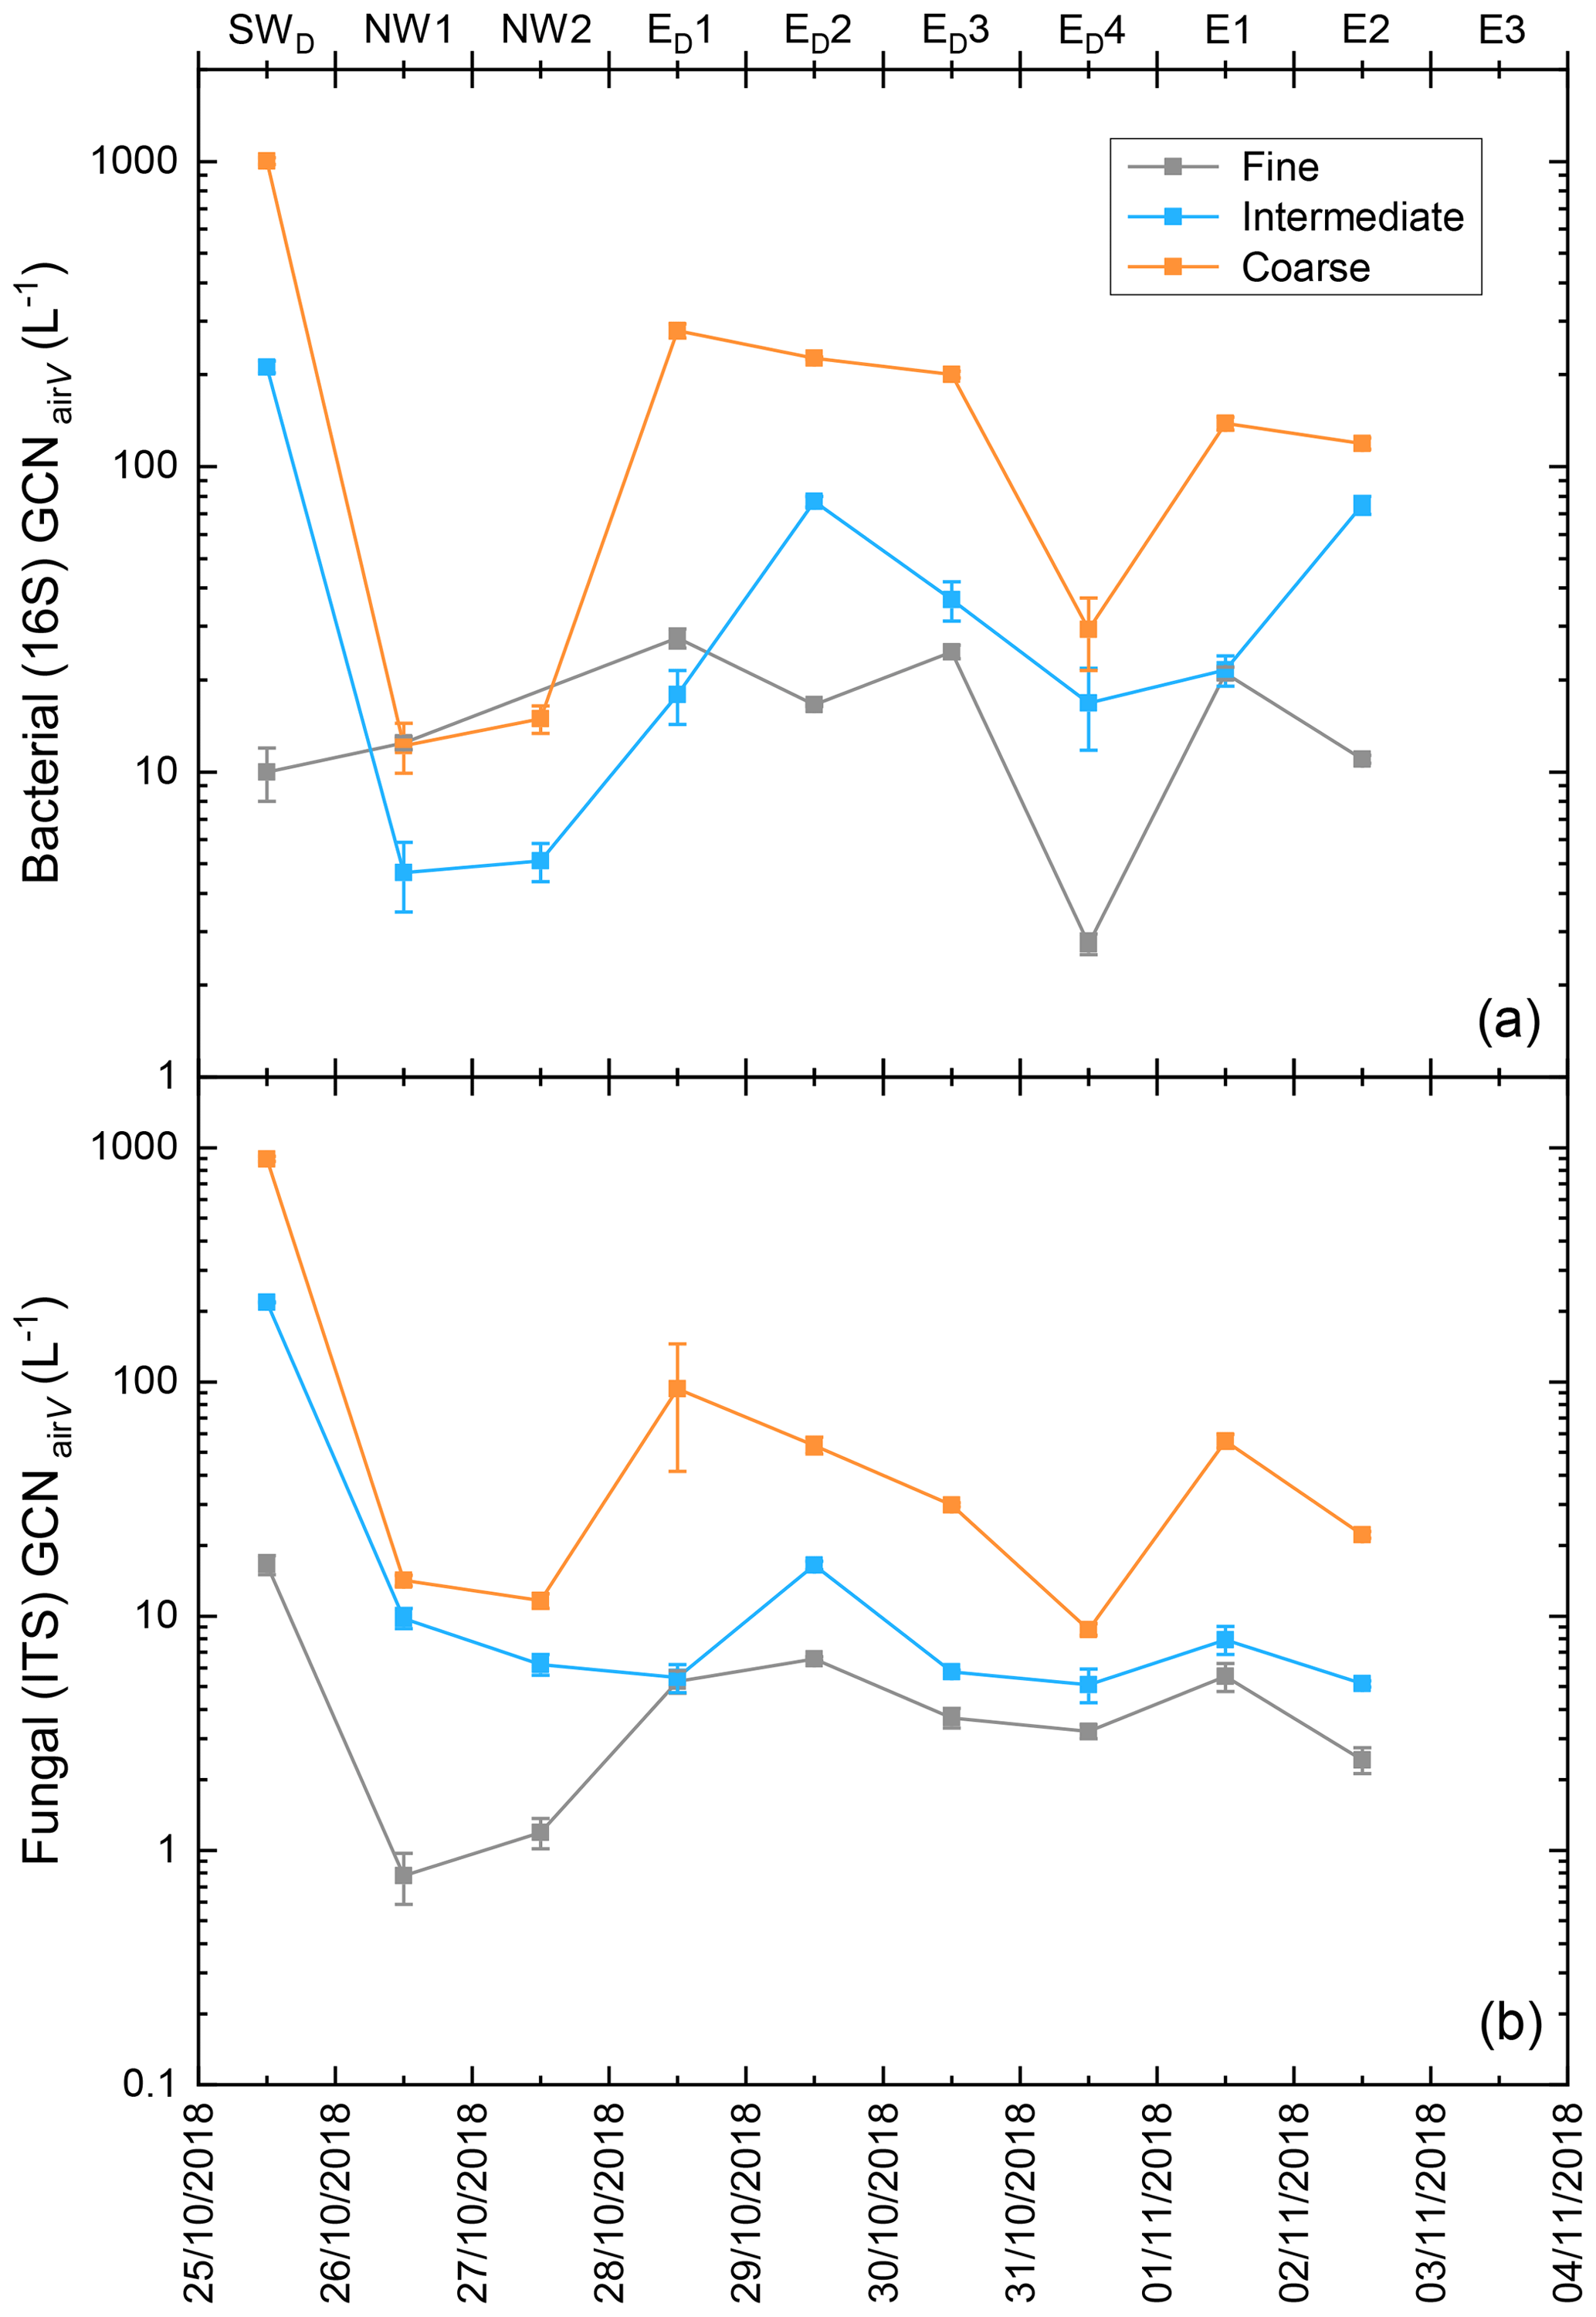
Figure 5Plots showing size-resolved biological aerosol particle concentrations, in terms of gene copy number (GCN) per litre of air, for (a) bacteria, analysed using 16S ribosomal RNA, and (b) fungi, using the ribosomal internal transcribed spacer (ITS) region. Particle size ranges were stratified into coarse (3–18 µm), intermediate (0.8–3 µm), and fine (< 1.3 µm).
The GCN data for bacteria and fungi during 29 October (ED2) appear unspectacular for the coarse mode of particles, but closer inspection reveals that the fine and intermediate fungal concentrations were higher than all other days except for 25 October (SWD). The bacterial concentrations in the intermediate size range were the second highest of the campaign during ED2, while the fine particle concentrations were relatively high. The biological content from the easterly (E) direction air masses (1 and 2 November) was also relatively high, particularly in the coarse mode.
While these values are for total populations rather than populations known to have ice-nucleating activity, together with the heat treatment data and the findings of Gat et al. (2021), these data further support the hypothesis that biological INPs may have been entrained in air masses that passed over the fertile soils, particularly the Nile Delta region and the northern Syria region. This remains speculative given the lack of data but suggests that these regions may warrant further exploration of their potential contributions to the regional ice-nucleating particle populations.
3.5 Ice-active site surface density, ns(T)
The ice-nucleating activity of the aerosol in the region throughout the campaign was quantified via calculation of the ice-active site density per surface area, ns(T) (cm−2), from the INP concentrations (L−1) and the surface area concentrations obtained from the combined OPC and SMPS (χ = 1.1 ± 0.1) data, using Eq. (5). The resultant spectra for ns(T) are shown in Fig. 6a, while Fig. 6b shows the same data separated into “dust events” and “clean days”. Figure 6c provides a comparison of these ns(T) values to the relevant literature, here with the campaign data separated into “dust events” (SWD and ED air masses) and “clean days” (NW and E air masses). Most of the data for the campaign lie on top of each other at the colder temperatures (< −18 °C), with some of the samples from the E air mass (clean days) being lower than the bulk of the data.
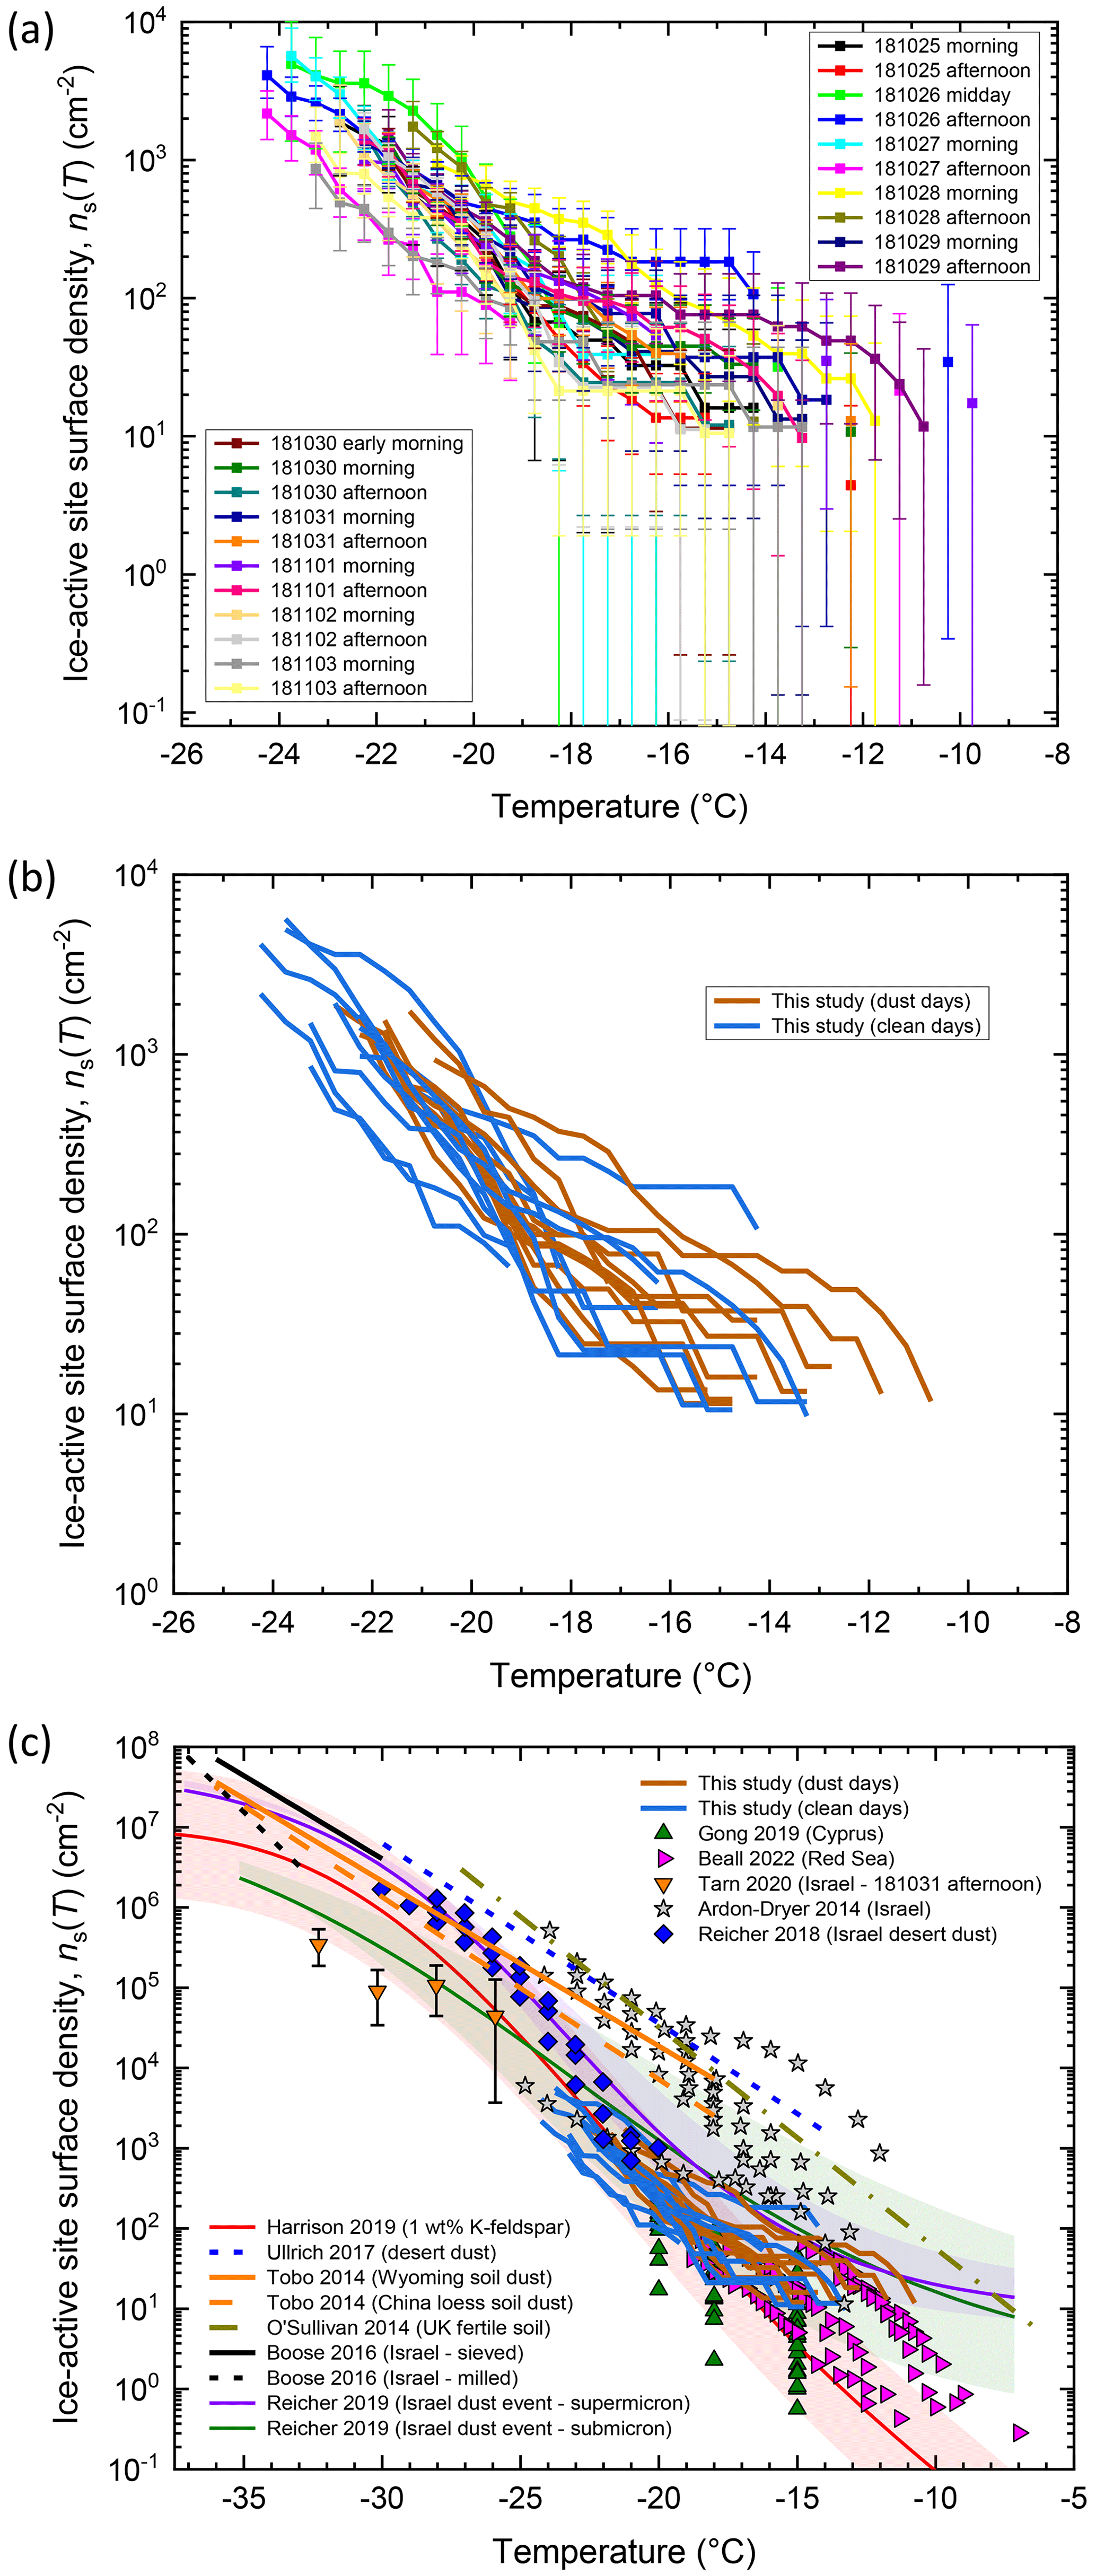
Figure 6Plots showing the ice-active site surface density, ns(T), for INPs in Israel. (a) Background-subtracted ns(T) spectra for 3 h filter samples. Dates are given in the YYMMDD format. (b) The 3 h filter sample data separated into dust events (brown) and clean days (blue). (c) Comparison of ns(T) values to relevant literature, including ns(T) data from Israel and the eastern Mediterranean region (Ardon-Dryer and Levin, 2014; Beall et al., 2022; Gong et al., 2019; Reicher et al., 2019, 2018; Tarn et al., 2020). Several parameterisations for mineral dust are provided, including those for surface samples from arid locations around the world (Ullrich et al., 2017), sieved and milled surface samples from Israel (Boose et al., 2016), supermicron and submicron particles in desert dust storms (Reicher et al., 2019), and the Harrison parameterisation for K-feldspar assuming K-feldspar comprised around 1 wt % of airborne mineral dust (Harrison et al., 2019). Parameterisations are provided for fertile soils (O'Sullivan et al., 2014) and agricultural soils (Tobo et al., 2014).
Our data were around 2 orders of magnitude smaller than the parameterisation of Ullrich et al. (2017) derived from soil samples and precipitated dust samples collected from a number of arid locations, including Israel and the Nile Delta. However, the bulk of the data below −18 °C match very well with the K-feldspar parameterisation developed by Harrison et al. (2019), here being scaled to 1 wt % (noting that Boose et al., 2016, also plotted here, found 1.7 ± 0.4 % wt % and 1.3 ± 0.4 % wt % K-feldspar in sieved and milled surface dust from Israel, respectively). The data at temperatures warmer than about −20 °C lie increasingly higher than Harrison et al. (2019) and within the lower uncertainties of the two parameterisations of Reicher et al. (2019) for supermicron and submicron dust during dust events. Some samples overlap even more with the Reicher et al. (2019) regimes, such as “181029 afternoon”, which likely had more influence from biological INPs. Sample “181026 afternoon” demonstrated a high ns(T) value since particle concentrations had dropped following a rain event and thereafter may have been influenced by bioaerosols in the air mass passing over Europe and the Mediterranean Sea.
Our data overlapped with some of the higher ns(T) data of Gong et al. (2019) from Cyprus, which followed the Harrison et al. (2019) K-feldspar into the warmer temperatures. However, the data of Beall et al. (2022) from the Red Sea matched ours very well. As for the NINP comparison, the Israel data of Ardon-Dryer and Levin (2014) were largely an order of magnitude or so higher in ns(T) than our observations, with only one of their clean day datasets being comparable though their data do compare well with the Ullrich et al. (2017) parameterisation for desert dust. The fertile soil parameterisation from O'Sullivan et al. (2014) and agricultural soil parameterisations from Tobo et al. (2014) are plotted and also sit much higher than our data, being somewhat more similar to the Ullrich et al. (2017) parameterisation.
Some of the collected data compared well at the colder temperatures with that of Reicher et al. (2018) for dust storms. The data shown from Tarn et al. (2020) represent a 3 h filter (“181031 afternoon”), as analysed using the LOC-NIPI microfluidic platform, and are complementary to the datasets obtained using the µL-NIPI for this campaign.
That the ns(T) values for the clean days and the dust event days largely collapsed on top of each other, particularly at temperatures < −18 °C, is not surprising given the atmosphere always contains dust particles, and so the term “clean” is relative only to the high loadings measured during elevated dust events. Likewise, the activities below −18 °C fall onto the Harrison et al. (2019) parameterisation for 1 wt % K-feldspar, consistent with the INP population being dominated by K-feldspar mineral dust, with samples exhibiting increased ns(T) at warmer temperatures potentially being biological, as supported by the heat test and DNA analyses described in the previous section.
However, the “cleanest” day was the 26 October following an intense rain event the previous night (see Fig. 2d) that resulted in low aerosol concentrations yet surprisingly high INP concentrations considering. Interestingly, the midday INP concentrations from a more westerly wind direction were notably higher than those from the afternoon more northwesterly direction (see Fig. 2e). The surprisingly high INP concentrations following the rain event resulted in high ns(T) activities given the low total aerosol concentrations, the reasons for which are unclear.
Overall, these results bring us to a similar conclusion as Gong et al. (2019) and Beall et al. (2022), that, while ns(T) parameterisations for mineral dust may be relevant for field samples below around −15 to −18 °C when the population is expected to be dominated by K-feldspar, they are not representative of regional INP activity at temperatures much warmer than −18 °C when the INP population may contain substantial biological content. Other methods of representing INPs at warmer temperatures may therefore be warranted to account for multiple temperature-dependent INP populations that vary with location. This could, for example, be achieved via the application of region-and/or season-specific ns(T) parameterisations, such as those of Reicher et al. (2019) for dust events in Israel that captured both the mineral and potential biological INP populations measured during the campaign described here. Alternatively, Gong et al. (2019) demonstrated the use of frequency distributions (or probability density functions, PDFs) to determine that their measured INP populations in the eastern Mediterranean were from long-range transport rather than local sources. These use a lognormal distribution to approximate the variability in INP concentration at each temperature and assume random dilution upon transport in the atmosphere; a skewed frequency distribution indicates an INP population from a local source, while a regular bell shape would represent long-range transport (Welti et al., 2018). This method was recently employed by Frostenberg et al. (2023) in the development of a new temperature-dependent INP parameterisation based on lognormally distributed INP concentration frequencies, without requiring aerosol information, that could be implemented into models using regional and seasonal INP frequency distributions.
The eastern Mediterranean is an interesting location for aerosol and INP analysis, encountering air masses from Europe, sea-spray aerosol from the Mediterranean Sea, and dust storms from the Sahara and Arabian deserts, with the local atmosphere always containing some degree of dust loading. Given such variation in sources and transport of INPs, it is important to try to understand their potential and comparative effects on the region. Here, we undertook an intensive 2-week INP sampling campaign in Israel to monitor concentrations and activity every morning and afternoon, with coincident measurements of local aerosol concentrations. Four main air masses were encountered during the campaign, each offering some insights into the INP populations in the region. A Saharan dust event from the south-west yielded high INP concentrations that notably featured a potential biological component, possibly as a result of passing over the fertile Nile Delta shortly prior to reaching the sampling site. Northwesterly winds that brought an air mass from central/eastern Europe and crossed a section of the Mediterranean Sea brought very low concentrations of aerosols and INPs, though this also followed a rain event that reduced the overall aerosol loadings in the region. Easterly winds brought air masses from Syria and the Arabian Desert with both high (dust events) and low aerosol loadings. The high loadings yielded high INP concentrations that tailed off as the dust loading of the air masses decreased over several days. Some of these samples from the Arabian Desert region may have had a slight biological INP component, but this was inconclusive.
The final and most unique air mass travelled from the north, in particular eastern Europe, before turning west towards the sampling site, notably passing over fertile soils located in the area known as the Fertile Crescent. The Fertile Crescent has undergone substantial changes in the last century that have resulted in considerable drying and droughts, particularly since the 1950s when irrigation of the marsh region diverted waters from the Tigris and Euphrates rivers (HISTORY, 2017; National Geographic, 2022). This was further exacerbated in Iraq in 1991 when the government built dams and dikes to drain the marshes. However, many dams were later broken following the regime change in 2003 that allowed waters to flood back into parts of the region (Reuters, 2016). While the region is far less fertile than it once was, it still comprises a vast region of lands and dried soils that contain bacteria and fungi, in addition to farmlands, wetlands, rivers, and marshes. It is possible that this change in land use can cause the soils to be more mobile and sensitive to winds. For example, the presence of dams, water transfer policies, and extensive droughts throughout the region have been linked to an increase in dust aerosol optical depth in the western and southern regions of Iran (Ghasem et al., 2012; Hamzeh et al., 2021), while Iraq saw an increased frequency of dust events from 1980–1993, a decreased frequency from 1993–2001, and an increase again after 2001 (Attiya and Jones, 2020).
The INP concentrations measured during the 2-week campaign in the eastern Mediterranean in 2018 were not only high, but heating analysis pointed towards a large biological component of INPs active at warmer temperatures in some samples. Given the broad territory that the Fertile Crescent covers, including Israel, Lebanon, Syria, and Iraq in the east, it is possible that some small amount of biological ice-nucleating activity encountered in some of the easterly air masses also originated from these fertile lands, while signals that passed over the Nile Delta and northern regions containing fertile soils exhibited a much stronger signal.
In all, INP activity in the region throughout the campaign was largely consistent with being controlled by ∼ 1 % K-feldspar mineral dust at temperatures below about −15 to −18 °C. However, the measurements associated with each of the four air masses suggested that the INP population in Israel can be influenced by biological INPs activated at warmer temperatures, whose origins are associated with fertile lands around the eastern Mediterranean and the Middle East, most notably the Fertile Crescent and including the Nile Delta. To our knowledge, this is the first time that the Fertile Crescent, apart from a discussion of the Nile Delta by Beall et al. (2022), has been discussed as a potential source of high-temperature biological INPs for the region around it, likely due to a lack of measurements associated with that particular location. While this hypothesis is very speculative given the limited number of relevant sampling events, the capacity for these fertile lands periodically influencing INP populations in the surrounding areas is compelling, particularly should the current long-term drying trends continue and so alter the INP populations. Thus, we believe that the Fertile Crescent regions warrant more dedicated analyses of their associated INP populations in order to understand whether they could have an influence on the vast surrounding regions and to what extent if that is the case.
Our results also bring us to similar conclusions to those of Gong et al. (2019) and Beall et al. (2022), in that ns(T) parameterisations for mineral dust are not necessarily appropriate for estimating INP activity in models when INP populations active at warmer temperatures may dominate the mineral population and skew ns(T) values based on particle surface area. Other methods of INP representation may be required or a database of regional and seasonal ns(T) or NINP parameterisations based on observations.
The datasets for this paper are publicly available in the University of Leeds data repository (https://doi.org/10.5518/1487, Tarn et al., 2024).
The supplement related to this article is available online at: https://doi.org/10.5194/ar-2-161-2024-supplement.
MDT, NR, YR, and BJM designed the study. MDT, YR, and BJM obtained funding for the study. MDT, NR, MA, SNFS, and ADH organised the logistics of the campaign and prepared and tested equipment for the study. MDT, BVW, MA, NR, and DG performed the experiments. MDT, BVW, MA, NR, DG, and ASM analysed the data from the study. YR and BJM supervised the study. MDT, NR, YR, and BJM wrote the paper, and all authors contributed to editing.
At least one of the (co-)authors is a member of the editorial board of Aerosol Research. The peer-review process was guided by an independent editor, and the authors also have no other competing interests to declare.
Publisher’s note: Copernicus Publications remains neutral with regard to jurisdictional claims made in the text, published maps, institutional affiliations, or any other geographical representation in this paper. While Copernicus Publications makes every effort to include appropriate place names, the final responsibility lies with the authors.
The authors thank Grace C. E. Porter for assistance with the INP background subtraction calculations. Burak Adnan Erkorkmaz is thanked for discussions. Martin I. Daily is thanked for the heat test plot template used in Fig. 4. The authors gratefully acknowledge the NOAA Air Resources Laboratory (ARL) for the provision of the HYSPLIT transport and dispersion model and READY website (https://www.ready.noaa.gov) used in this publication.
This research has been supported by Weizmann UK, the European Research Council, EU H2020 European Research Council (grant no. 648661 MarineIce), and the Engineering and Physical Sciences Research Council (grant no. EP/R513258/1).
This paper was edited by Naďa Zíková and reviewed by Jie Chen and three anonymous referees.
Adams, M. P., Tarn, M. D., Sanchez-Marroquin, A., Porter, G. C. E., O'Sullivan, D., Harrison, A. D., Cui, Z., Vergara-Temprado, J., Carotenuto, F., Holden, M. A., Daily, M. I., Whale, T. F., Sikora, S. N. F., Burke, I. T., Shim, J. U., McQuaid, J. B., and Murray, B. J.: A Major Combustion Aerosol Event Had a Negligible Impact on the Atmospheric Ice-Nucleating Particle Population, J. Geophys. Res.-Atmos., 125, e2020JD032938, https://doi.org/10.1029/2020JD032938, 2020.
Ardon-Dryer, K. and Levin, Z.: Ground-based measurements of immersion freezing in the eastern Mediterranean, Atmos. Chem. Phys., 14, 5217–5231, https://doi.org/10.5194/acp-14-5217-2014, 2014.
Athanasopoulou, E., Protonotariou, A., Papangelis, G., Tombrou, M., Mihalopoulos, N., and Gerasopoulos, E.: Long-range transport of Saharan dust and chemical transformations over the Eastern Mediterranean, Atmos. Environ., 140, 592–604, https://doi.org/10.1016/j.atmosenv.2016.06.041, 2016.
Atkinson, J. D., Murray, B. J., Woodhouse, M. T., Whale, T. F., Baustian, K. J., Carslaw, K. S., Dobbie, S., O'Sullivan, D., and Malkin, T. L.: The importance of feldspar for ice nucleation by mineral dust in mixed-phase clouds, Nature, 498, 355–358, https://doi.org/10.1038/nature12278, 2013.
Attiya, A. A. and Jones, B. G.: Climatology of Iraqi dust events during 1980–2015, SN Applied Sciences, 2, 845, https://doi.org/10.1007/s42452-020-2669-4, 2020.
Beall, C. M., Lucero, D., Hill, T. C., DeMott, P. J., Stokes, M. D., and Prather, K. A.: Best practices for precipitation sample storage for offline studies of ice nucleation in marine and coastal environments, Atmos. Meas. Tech., 13, 6473–6486, https://doi.org/10.5194/amt-13-6473-2020, 2020.
Beall, C. M., Hill, T. C. J., DeMott, P. J., Köneman, T., Pikridas, M., Drewnick, F., Harder, H., Pöhlker, C., Lelieveld, J., Weber, B., Iakovides, M., Prokeš, R., Sciare, J., Andreae, M. O., Stokes, M. D., and Prather, K. A.: Ice-nucleating particles near two major dust source regions, Atmos. Chem. Phys., 22, 12607–12627, https://doi.org/10.5194/acp-22-12607-2022, 2022.
Bertin Technologies: Coriolis µAir Sampler product information, Bertin Technologies, https://www.bertin-technologies.com/product/air-samplers/coriolis-micro-air-sampler, last access: 23 January 2024.
Boose, Y., Welti, A., Atkinson, J., Ramelli, F., Danielczok, A., Bingemer, H. G., Plötze, M., Sierau, B., Kanji, Z. A., and Lohmann, U.: Heterogeneous ice nucleation on dust particles sourced from nine deserts worldwide – Part 1: Immersion freezing, Atmos. Chem. Phys., 16, 15075–15095, https://doi.org/10.5194/acp-16-15075-2016, 2016.
Burton, N. C., Grinshpun, S. A., and Reponen, T.: Physical Collection Efficiency of Filter Materials for Bacteria and Viruses, Ann. Occup. Hyg., 51, 143–151, https://doi.org/10.1093/annhyg/mel073, 2006.
Carvalho, E., Sindt, C., Verdier, A., Galan, C., O'Donoghue, L., Parks, S., and Thibaudon, M.: Performance of the Coriolis air sampler, a high-volume aerosol-collection system for quantification of airborne spores and pollen grains, Aerobiologia, 24, 191–201, https://doi.org/10.1007/s10453-008-9098-y, 2008.
Ceppi, P., Brient, F., Zelinka, M. D., and Hartmann, D. L.: Cloud feedback mechanisms and their representation in global climate models, WIRES Climate Change, 8, e465, https://doi.org/10.1002/wcc.465, 2017.
Chen, J., Wu, Z., Gong, X., Qiu, Y., Chen, S., Zeng, L., and Hu, M.: Anthropogenic Dust as a Significant Source of Ice-Nucleating Particles in the Urban Environment, Earths Future, 12, e2023EF003738, https://doi.org/10.1029/2023EF003738, 2024.
Christner, B. C., Cai, R., Morris, C. E., McCarter, K. S., Foreman, C. M., Skidmore, M. L., Montross, S. N., and Sands, D. C.: Geographic, seasonal, and precipitation chemistry influence on the abundance and activity of biological ice nucleators in rain and snow, P. Natl. Acad. Sci. USA, 105, 18854–18859, https://doi.org/10.1073/pnas.0809816105, 2008a.
Christner, B. C., Morris, C. E., Foreman, C. M., Cai, R., and Sands, D. C.: Ubiquity of Biological Ice Nucleators in Snowfall, Science, 319, 1214–1214, https://doi.org/10.1126/science.1149757, 2008b.
Conen, F., Morris, C. E., Leifeld, J., Yakutin, M. V., and Alewell, C.: Biological residues define the ice nucleation properties of soil dust, Atmos. Chem. Phys., 11, 9643–9648, https://doi.org/10.5194/acp-11-9643-2011, 2011.
Daily, M. I., Tarn, M. D., Whale, T. F., and Murray, B. J.: An evaluation of the heat test for the ice-nucleating ability of minerals and biological material, Atmos. Meas. Tech., 15, 2635–2665, https://doi.org/10.5194/amt-15-2635-2022, 2022.
Dayan, U.: Climatology of Back Trajectories from Israel Based on Synoptic Analysis, J. Clim. Appl. Meteorol., 25, 591–595, https://doi.org/10.1175/1520-0450(1986)025<0591:COBTFI>2.0.CO;2, 1986.
Dayan, U., Heffter, J., Miller, J., and Gutman, G.: Dust Intrusion Events into the Mediterranean Basin, J. Appl. Meteorol., 30, 1185–1199, 1991.
DeMott, P. J., Prenni, A. J., Liu, X., Kreidenweis, S. M., Petters, M. D., Twohy, C. H., Richardson, M. S., Eidhammer, T., and Rogers, D. C.: Predicting global atmospheric ice nuclei distributions and their impacts on climate, P. Natl. Acad. Sci. USA, 107, 11217–11222, https://doi.org/10.1073/pnas.0910818107, 2010.
DeMott, P. J., Prenni, A. J., McMeeking, G. R., Sullivan, R. C., Petters, M. D., Tobo, Y., Niemand, M., Möhler, O., Snider, J. R., Wang, Z., and Kreidenweis, S. M.: Integrating laboratory and field data to quantify the immersion freezing ice nucleation activity of mineral dust particles, Atmos. Chem. Phys., 15, 393–409, https://doi.org/10.5194/acp-15-393-2015, 2015.
Draxler, R. R. and Hess, G. D.: An overview of the HYSPLIT_4 modelling system for trajectories, dispersion and deposition, Aust. Meteorol. Mag., 47, 295–308, 1998.
Els, N., Larose, C., Baumann-Stanzer, K., Tignat-Perrier, R., Keuschnig, C., Vogel, T. M., and Sattler, B.: Microbial composition in seasonal time series of free tropospheric air and precipitation reveals community separation, Aerobiologia, 35, 671–701, https://doi.org/10.1007/s10453-019-09606-x, 2019.
Erkorkmaz, B. A., Gat, D., and Rudich, Y.: Aerial transport of bacteria by dust plumes in the Eastern Mediterranean revealed by complementary rRNA/rRNA-gene sequencing, Commun. Earth Environ., 4, 24, https://doi.org/10.1038/s43247-023-00679-8, 2023.
Fleming, Z. L., Monks, P. S., and Manning, A. J.: Review: Untangling the influence of air-mass history in interpreting observed atmospheric composition, Atmos. Res., 104–105, 1–39, https://doi.org/10.1016/j.atmosres.2011.09.009, 2012.
Foner, H. A. and Ganor, E.: The chemical and mineralogical composition of some urban atmospheric aerosols in Israel, Atmos. Environ. B-Urb., 26, 125–133, https://doi.org/10.1016/0957-1272(92)90045-T, 1992.
Frostenberg, H. C., Welti, A., Luhr, M., Savre, J., Thomson, E. S., and Ickes, L.: The chance of freezing – a conceptional study to parameterize temperature-dependent freezing by including randomness of ice-nucleating particle concentrations, Atmos. Chem. Phys., 23, 10883–10900, https://doi.org/10.5194/acp-23-10883-2023, 2023.
Funatsu, B. M., Claud, C., and Chaboureau, J.-P.: Potential of Advanced Microwave Sounding Unit to identify precipitating systems and associated upper-level features in the Mediterranean region: Case studies, J. Geophys. Res.-Atmos., 112, D17113, https://doi.org/10.1029/2006JD008297, 2007.
Gagin, A.: The Ice Phase in Winter Continental Cumulus Clouds, J. Atmos. Sci., 32, 1604–1614, https://doi.org/10.1175/1520-0469(1975)032<1604:tipiwc>2.0.co;2, 1975.
Ganor, E.: Analysis of atmospheric dust in Israel, PhD Thesis, Hebrew University, Jerusalem, MMS ID 990017418520203701, https://huji.primo.exlibrisgroup.com/discovery/delivery/972HUJI_INST:HUJI_THESES/12276832330003701 (last access: 23 May 2024), 1975.
Ganor, E.: The composition of clay minerals transported to Israel as indicators of Saharan dust emission, Atmos. Environ. A-Gen., 25, 2657–2664, https://doi.org/10.1016/0960-1686(91)90195-D, 1991.
Ganor, E.: The frequency of Saharan dust episodes over Tel Aviv, Israel, Atmos. Environ., 28, 2867–2871, https://doi.org/10.1016/1352-2310(94)90087-6, 1994.
Ganor, E. and Mamane, Y.: Transport of Saharan dust across the eastern Mediterranean, Atmos. Environ., 16, 581–587, https://doi.org/10.1016/0004-6981(82)90167-6, 1982.
Ganor, E., Foner, H. A., Bingemer, H. G., Udisti, R., and Setter, I.: Biogenic sulphate generation in the Mediterranean Sea and its contribution to the sulphate anomaly in the aerosol over Israel and the Eastern Mediterranean, Atmos. Environ., 34, 3453–3462, https://doi.org/10.1016/S1352-2310(00)00077-7, 2000.
Ganor, E., Osetinsky, I., Stupp, A., and Alpert, P.: Increasing trend of African dust, over 49 years, in the eastern Mediterranean, J. Geophys. Res.-Atmos., 115, D07201, https://doi.org/10.1029/2009JD012500, 2010.
Garcia, E., Hill, T. C. J., Prenni, A. J., DeMott, P. J., Franc, G. D., and Kreidenweis, S. M.: Biogenic ice nuclei in boundary layer air over two U.S. High Plains agricultural regions, J. Geophys. Res.-Atmos., 117, D18209, https://doi.org/10.1029/2012jd018343, 2012.
Gat, D., Mazar, Y., Cytryn, E., and Rudich, Y.: Origin-dependent variations of atmospheric microbiome community in eastern Mediterranean dust storms, Environ. Sci. Technol., 51, 6709–6718, https://doi.org/10.1021/acs.est.7b00362, 2017.
Gat, D., Reicher, N., Schechter, S., Alayof, M., Tarn, M. D., Wyld, B. V., Zimmermann, R., and Rudich, Y.: Size-Resolved Community Structure of Bacteria and Fungi Transported by Dust in the Middle East, Front. Microbiol., 12, 744117, https://doi.org/10.3389/fmicb.2021.744117, 2021.
Ghasem, A., Shamsipour, A., Miri, M., and Safarrad, T.: Synoptic and remote sensing analysis of dust events in southwestern Iran, Nat. Hazards, 64, 1625–1638, https://doi.org/10.1007/s11069-012-0328-9, 2012.
Gobbi, G. P., Barnaba, F., and Ammannato, L.: The vertical distribution of aerosols, Saharan dust and cirrus clouds in Rome (Italy) in the year 2001, Atmos. Chem. Phys., 4, 351–359, https://doi.org/10.5194/acp-4-351-2004, 2004.
Gong, X., Wex, H., Müller, T., Wiedensohler, A., Höhler, K., Kandler, K., Ma, N., Dietel, B., Schiebel, T., Möhler, O., and Stratmann, F.: Characterization of aerosol properties at Cyprus, focusing on cloud condensation nuclei and ice-nucleating particles, Atmos. Chem. Phys., 19, 10883–10900, https://doi.org/10.5194/acp-19-10883-2019, 2019.
Hamzeh, N. H., Kaskaoutis, D. G., Rashki, A., and Mohammadpour, K.: Long-Term Variability of Dust Events in Southwestern Iran and Its Relationship with the Drought, Atmosphere, 12, 1350, https://doi.org/10.3390/atmos12101350, 2021.
Harrison, A. D., Whale, T. F., Carpenter, M. A., Holden, M. A., Neve, L., O'Sullivan, D., Vergara Temprado, J., and Murray, B. J.: Not all feldspars are equal: a survey of ice nucleating properties across the feldspar group of minerals, Atmos. Chem. Phys., 16, 10927–10940, https://doi.org/10.5194/acp-16-10927-2016, 2016.
Harrison, A. D., Lever, K., Sanchez-Marroquin, A., Holden, M. A., Whale, T. F., Tarn, M. D., McQuaid, J. B., and Murray, B. J.: The ice-nucleating ability of quartz immersed in water and its atmospheric importance compared to K-feldspar, Atmos. Chem. Phys., 19, 11343–11361, https://doi.org/10.5194/acp-19-11343-2019, 2019.
Harrison, A. D., O'Sullivan, D., Adams, M. P., Porter, G. C. E., Blades, E., Brathwaite, C., Chewitt-Lucas, R., Gaston, C., Hawker, R., Krüger, O. O., Neve, L., Pöhlker, M. L., Pöhlker, C., Pöschl, U., Sanchez-Marroquin, A., Sealy, A., Sealy, P., Tarn, M. D., Whitehall, S., McQuaid, J. B., Carslaw, K. S., Prospero, J. M., and Murray, B. J.: The ice-nucleating activity of African mineral dust in the Caribbean boundary layer, Atmos. Chem. Phys., 22, 9663–9680, https://doi.org/10.5194/acp-22-9663-2022, 2022.
Hawker, R. E., Miltenberger, A. K., Wilkinson, J. M., Hill, A. A., Shipway, B. J., Cui, Z., Cotton, R. J., Carslaw, K. S., Field, P. R., and Murray, B. J.: The temperature dependence of ice-nucleating particle concentrations affects the radiative properties of tropical convective cloud systems, Atmos. Chem. Phys., 21, 5439–5461, https://doi.org/10.5194/acp-21-5439-2021, 2021.
Herbert, R. J., Murray, B. J., Dobbie, S. J., and Koop, T.: Sensitivity of liquid clouds to homogenous freezing parameterizations, Geophys. Res. Lett., 42, 1599–1605, https://doi.org/10.1002/2014gl062729, 2015.
HISTORY: Fertile Crescent, A&E Television Networks, https://www.history.com/topics/pre-history/fertile-crescent (last access: September 2023), 2017.
Hoffmann, F., Raasch, S., and Noh, Y.: Entrainment of aerosols and their activation in a shallow cumulus cloud studied with a coupled LCM–LES approach, Atmos. Res., 156, 43–57, https://doi.org/10.1016/j.atmosres.2014.12.008, 2015.
Holden, M. A., Whale, T. F., Tarn, M. D., O'Sullivan, D., Walshaw, R. D., Murray, B. J., Meldrum, F. C., and Christenson, H. K.: High-speed imaging of ice nucleation in water proves the existence of active sites, Sci. Adv., 5, eaav4316, https://doi.org/10.1126/sciadv.aav4316, 2019.
Holden, M. A., Campbell, J. M., Meldrum, F. C., Murray, B. J., and Christenson, H. K.: Active sites for ice nucleation differ depending on nucleation mode, P. Natl. Acad. Sci. USA, 118, e2022859118, https://doi.org/10.1073/pnas.2022859118, 2021.
Hoose, C. and Möhler, O.: Heterogeneous ice nucleation on atmospheric aerosols: a review of results from laboratory experiments, Atmos. Chem. Phys., 12, 9817–9854, https://doi.org/10.5194/acp-12-9817-2012, 2012.
Huffman, J. A., Prenni, A. J., DeMott, P. J., Pöhlker, C., Mason, R. H., Robinson, N. H., Fröhlich-Nowoisky, J., Tobo, Y., Després, V. R., Garcia, E., Gochis, D. J., Harris, E., Müller-Germann, I., Ruzene, C., Schmer, B., Sinha, B., Day, D. A., Andreae, M. O., Jimenez, J. L., Gallagher, M., Kreidenweis, S. M., Bertram, A. K., and Pöschl, U.: High concentrations of biological aerosol particles and ice nuclei during and after rain, Atmos. Chem. Phys., 13, 6151–6164, https://doi.org/10.5194/acp-13-6151-2013, 2013.
Israelevich, P. L., Levin, Z., Joseph, J. H., and Ganor, E.: Desert aerosol transport in the Mediterranean region as inferred from the TOMS aerosol index, J. Geophys. Res.-Atmos., 107, 4572, https://doi.org/10.1029/2001JD002011, 2002.
Kahl, J. D. and Samson, P. J.: Uncertainty in Trajectory Calculations Due to Low Resolution Meteorological Data, J. Appl. Meteorol. Clim., 25, 1816–1831, https://doi.org/10.1175/1520-0450(1986)025<1816:UITCDT>2.0.CO;2, 1986.
Kanji, Z. A., Ladino, L. A., Wex, H., Boose, Y., Burkert-Kohn, M., Cziczo, D. J., and Krämer, M.: Overview of Ice Nucleating Particles, Meteorol. Mon., 58, 1.1–1.33, https://doi.org/10.1175/AMSMONOGRAPHS-D-16-0006.1, 2017.
Karaca, F., Anil, I., and Alagha, O.: Long-range potential source contributions of episodic aerosol events to PM10 profile of a megacity, Atmos. Environ., 43, 5713–5722, https://doi.org/10.1016/j.atmosenv.2009.08.005, 2009.
Kelley, C. P., Mohtadi, S., Cane, M. A., Seager, R., and Kushnir, Y.: Climate change in the Fertile Crescent and implications of the recent Syrian drought, P. Natl. Acad. Sci. USA, 112, 3241–3246, https://doi.org/10.1073/pnas.1421533112, 2015.
Kiselev, A., Bachmann, F., Pedevilla, P., Cox, S. J., Michaelides, A., Gerthsen, D., and Leisner, T.: Active sites in heterogeneous ice nucleation – the example of K-rich feldspars, Science, 355, 367–371, https://doi.org/10.1126/science.aai8034, 2017.
Knopf, D. A., Alpert, P. A., Zipori, A., Reicher, N., and Rudich, Y.: Stochastic nucleation processes and substrate abundance explain time-dependent freezing in supercooled droplets, NPJ Clim. Atmos. Sci., 3, 2, https://doi.org/10.1038/s41612-020-0106-4, 2020.
Krasnov, H., Katra, I., and Friger, M.: Increase in dust storm related PM10 concentrations: A time series analysis of 2001–2015, Environ. Pollut., 213, 36–42, https://doi.org/10.1016/j.envpol.2015.10.021, 2016.
Kubilay, N., Nickovic, S., Moulin, C., and Dulac, F.: An illustration of the transport and deposition of mineral dust onto the eastern Mediterranean, Atmos. Environ., 34, 1293–1303, https://doi.org/10.1016/S1352-2310(99)00179-X, 2000.
Levi, Y. and Rosenfeld, D.: Ice Nuclei, Rainwater Chemical Composition, and Static Cloud Seeding Effects in Israel, J. Appl. Meteorol., 35, 1494–1501, https://doi.org/10.1175/1520-0450(1996)035<1494:inrcca>2.0.co;2, 1996.
Levin, Z. and Lindberg, J. D.: Size distribution, chemical composition, and optical properties of urban and desert aerosols in Israel, J. Geophys. Res.-Oceans, 84, 6941–6950, https://doi.org/10.1029/JC084iC11p06941, 1979.
Levin, Z., Teller, A., Ganor, E., and Yin, Y.: On the interactions of mineral dust, sea-salt particles, and clouds: A measurement and modeling study from the Mediterranean Israeli Dust Experiment campaign, J. Geophys. Res.-Atmos., 110, D20202, https://doi.org/10.1029/2005jd005810, 2005.
Lindsley, W. G.: Filter Pore Size and Aerosol Sample Collection, in: NIOSH Manual of Analytical Methods (NMAM), 5th edn., Department of Health and Human Services, Centers for Disease Control and Prevention, National Institute for Occupational Safety and Health, https://www.cdc.gov/niosh/nmam/pdf/NMAM_5thEd_EBook-508-final.pdf (last access: 23 May 2024), 2016.
Lohmann, U. and Feichter, J.: Global indirect aerosol effects: a review, Atmos. Chem. Phys., 5, 715–737, https://doi.org/10.5194/acp-5-715-2005, 2005.
Mamane, Y., Ganor, E., and Donagi, A. E.: Aerosol composition of urban and desert origin in the Eastern Mediterranean. I, Water Air Soil Pollut., 14, 29–43, https://doi.org/10.1007/BF00291824, 1980.
Marinou, E., Tesche, M., Nenes, A., Ansmann, A., Schrod, J., Mamali, D., Tsekeri, A., Pikridas, M., Baars, H., Engelmann, R., Voudouri, K.-A., Solomos, S., Sciare, J., Groß, S., Ewald, F., and Amiridis, V.: Retrieval of ice-nucleating particle concentrations from lidar observations and comparison with UAV in situ measurements, Atmos. Chem. Phys., 19, 11315–11342, https://doi.org/10.5194/acp-19-11315-2019, 2019.
Marple, V. A., Rubow, K. L., and Behm, S. M.: A Microorifice Uniform Deposit Impactor (MOUDI): Description, Calibration, and Use, Aerosol Sci. Tech., 14, 434–446, https://doi.org/10.1080/02786829108959504, 1991.
Mason, R. H., Chou, C., McCluskey, C. S., Levin, E. J. T., Schiller, C. L., Hill, T. C. J., Huffman, J. A., DeMott, P. J., and Bertram, A. K.: The micro-orifice uniform deposit impactor–droplet freezing technique (MOUDI-DFT) for measuring concentrations of ice nucleating particles as a function of size: improvements and initial validation, Atmos. Meas. Tech., 8, 2449–2462, https://doi.org/10.5194/amt-8-2449-2015, 2015.
Möhler, O., Benz, S., Saathoff, H., Schnaiter, M., Wagner, R., Schneider, J., Walter, S., Ebert, V., and Wagner, S.: The effect of organic coating on the heterogeneous ice nucleation efficiency of mineral dust aerosols, Environ. Res. Lett., 3, 025007, https://doi.org/10.1088/1748-9326/3/2/025007, 2008.
Murray, B. J., O'Sullivan, D., Atkinson, J. D., and Webb, M. E.: Ice nucleation by particles immersed in supercooled cloud droplets, Chem. Soc. Rev., 41, 6519–6554, https://doi.org/10.1039/C2CS35200A, 2012.
Murray, B. J., Carslaw, K. S., and Field, P. R.: Opinion: Cloud-phase climate feedback and the importance of ice-nucleating particles, Atmos. Chem. Phys., 21, 665–679, https://doi.org/10.5194/acp-21-665-2021, 2021.
National Geographic: Fertile Crescent, National Geographic Society, https://education.nationalgeographic.org/resource/fertile-crescent/ (last access: September 2023), 2022.
Nissenbaum, D., Sarafian, R., Rudich, Y., and Raveh-Rubin, S.: Six types of dust events in Eastern Mediterranean identified using unsupervised machine-learning classification, Atmos. Environ., 309, 119902, https://doi.org/10.1016/j.atmosenv.2023.119902, 2023.
O'Sullivan, D., Murray, B. J., Malkin, T. L., Whale, T. F., Umo, N. S., Atkinson, J. D., Price, H. C., Baustian, K. J., Browse, J., and Webb, M. E.: Ice nucleation by fertile soil dusts: relative importance of mineral and biogenic components, Atmos. Chem. Phys., 14, 1853–1867, https://doi.org/10.5194/acp-14-1853-2014, 2014.
O'Sullivan, D., Adams, M. P., Tarn, M. D., Harrison, A. D., Vergara-Temprado, J., Porter, G. C. E., Holden, M. A., Sanchez-Marroquin, A., Carotenuto, F., Whale, T. F., McQuaid, J. B., Walshaw, R., Hedges, D. H. P., Burke, I. T., Cui, Z., and Murray, B. J.: Contributions of biogenic material to the atmospheric ice-nucleating particle population in North Western Europe, Sci. Rep., 8, 13821, https://doi.org/10.1038/s41598-018-31981-7, 2018.
Pardo, M., Katra, I., Schaeur, J. J., and Rudich, Y.: Mitochondria-mediated oxidative stress induced by desert dust in rat alveolar macrophages, GeoHealth, 1, 4–16, https://doi.org/10.1002/2016GH000017, 2017.
Peng, X., Gat, D., Paytan, A., and Rudich, Y.: The Response of Airborne Mycobiome to Dust Storms in the Eastern Mediterranean, J. Fungi, 7, 802, https://doi.org/10.3390/jof7100802, 2021.
Peters, T. M., Ott, D., and O'Shaughnessy, P. T.: Comparison of the Grimm 1.108 and 1.109 portable aerosol spectrometer to the TSI 3321 aerodynamic particle sizer for dry particles, Ann. Occup. Hyg., 50, 843–850, https://doi.org/10.1093/annhyg/mel067, 2006.
Petters, M. D. and Wright, T. P.: Revisiting ice nucleation from precipitation samples, Geophys. Res. Lett., 42, 8758–8766, https://doi.org/10.1002/2015GL065733, 2015.
Prodi, F., Santachiara, G., and Oliosi, F.: Characterization of aerosols in marine environments (Mediterranean, Red Sea, and Indian Ocean), J. Geophys. Res.-Oceans, 88, 10957–10968, https://doi.org/10.1029/JC088iC15p10957, 1983.
Reicher, N., Segev, L., and Rudich, Y.: The WeIzmann Supercooled Droplets Observation on a Microarray (WISDOM) and application for ambient dust, Atmos. Meas. Tech., 11, 233–248, https://doi.org/10.5194/amt-11-233-2018, 2018.
Reicher, N., Budke, C., Eickhoff, L., Raveh-Rubin, S., Kaplan-Ashiri, I., Koop, T., and Rudich, Y.: Size-dependent ice nucleation by airborne particles during dust events in the eastern Mediterranean, Atmos. Chem. Phys., 19, 11143–11158, https://doi.org/10.5194/acp-19-11143-2019, 2019.
Reuters: Iraq's marshes, once drained by Saddam, named world heritage site, Reuters, https://www.reuters.com/article/us-un-heritage-iraq-idUSKCN0ZX0SN (last access: October 2023), 2016.
Roesch, C., Roesch, M., Wolf, M. J., Zawadowicz, M. A., AlAloula, R., Awwad, Z., and Cziczo, D. J.: CCN and INP activity of middle eastern soil dust, Aeolian Res., 52, 100729, https://doi.org/10.1016/j.aeolia.2021.100729, 2021.
Rolph, G., Stein, A., and Stunder, B.: Real-time Environmental Applications and Display sYstem: READY, Environ. Model. Softw., 95, 210–228, https://doi.org/10.1016/j.envsoft.2017.06.025, 2017.
Rosenfeld, D. and Woodley, W. L.: Deep convective clouds with sustained supercooled liquid water down to −37.5 degrees C, Nature, 405, 440–442, https://doi.org/10.1038/35013030, 2000.
Salamini, F., Özkan, H., Brandolini, A., Schäfer-Pregl, R., and Martin, W.: Genetics and geography of wild cereal domestication in the near east, Nat. Rev. Genet., 3, 429–441, https://doi.org/10.1038/nrg817, 2002.
Sanchez-Marroquin, A., West, J. S., Burke, I. T., McQuaid, J. B., and Murray, B. J.: Mineral and biological ice-nucleating particles above the South East of the British Isles, Environmental Science: Atmospheres, 1, 176–191, https://doi.org/10.1039/D1EA00003A, 2021.
Šantl-Temkiv, T., Amato, P., Gosewinkel, U., Thyrhaug, R., Charton, A., Chicot, B., Finster, K., Bratbak, G., and Löndahl, J.: High-Flow-Rate Impinger for the Study of Concentration, Viability, Metabolic Activity, and Ice-Nucleation Activity of Airborne Bacteria, Environ. Sci. Technol., 51, 11224–11234, https://doi.org/10.1021/acs.est.7b01480, 2017.
Sari, D., Incecik, S., and Ozkurt, N.: Analysis of surface ozone episodes using WRF-HYSPLIT model at Biga Peninsula in the Marmara region of Turkey, Atmos. Pollut. Res., 11, 2361–2378, https://doi.org/10.1016/j.apr.2020.09.018, 2020.
Schnell, R. C.: Kaolin and a biogenic ice nucleant: Some nucleation and identification studies, in: Atmospheric Aerosols and Nuclei: Proceedings of the Ninth International Conference on Atmospheric Aerosols, Condensation, and Ice Nuclei, University College, Galway, Ireland, 21–27 September 1977, edited by: Roddy, A. F. and O'Connor, T. C., Galway University Press, Galway, Ireland, 353–356, 1981.
Schnell, R. C. and Vali, G.: Biogenic Ice Nuclei: Part I. Terrestrial and Marine Sources, J. Atmos. Sci., 33, 1554–1564, https://doi.org/10.1175/1520-0469(1976)033<1554:BINPIT>2.0.CO;2, 1976.
Schrod, J., Weber, D., Drücke, J., Keleshis, C., Pikridas, M., Ebert, M., Cvetković, B., Nickovic, S., Marinou, E., Baars, H., Ansmann, A., Vrekoussis, M., Mihalopoulos, N., Sciare, J., Curtius, J., and Bingemer, H. G.: Ice nucleating particles over the Eastern Mediterranean measured by unmanned aircraft systems, Atmos. Chem. Phys., 17, 4817–4835, https://doi.org/10.5194/acp-17-4817-2017, 2017.
Soo, J.-C., Monaghan, K., Lee, T., Kashon, M., and Harper, M.: Air sampling filtration media: Collection efficiency for respirable size-selective sampling, Aerosol Sci. Tech., 50, 76–87, https://doi.org/10.1080/02786826.2015.1128525, 2016.
Sprenger, M. and Wernli, H.: The LAGRANTO Lagrangian analysis tool – version 2.0, Geosci. Model Dev., 8, 2569–2586, https://doi.org/10.5194/gmd-8-2569-2015, 2015.
Stein, A. F., Draxler, R. R., Rolph, G. D., Stunder, B. J. B., Cohen, M. D., and Ngan, F.: NOAA's HYSPLIT Atmospheric Transport and Dispersion Modeling System, B. Am. Meteorol. Soc., 96, 2059–2077, https://doi.org/10.1175/bams-d-14-00110.1, 2016.
Storelvmo, T.: Aerosol Effects on Climate via Mixed-Phase and Ice Clouds, Annu. Rev. Earth Pl. Sc., 45, 199–222, https://doi.org/10.1146/annurev-earth-060115-012240, 2017.
Tarn, M. D., Sikora, S. N. F., Porter, G. C. E., Wyld, B. V., Alayof, M., Reicher, N., Harrison, A. D., Rudich, Y., Shim, J.-U., and Murray, B. J.: On-chip analysis of atmospheric ice-nucleating particles in continuous flow, Lab. Chip, 20, 2889–2910, https://doi.org/10.1039/D0LC00251H, 2020.
Tarn, M. D., Wyld, B. V., Reicher, N., Alayof, M., Gat, D., Sanchez-Marroquin, A., Sikora, S. N. F., Harrison, A. D., Rudich, Y., and Murray, B. J.: Atmospheric ice-nucleating particles in the eastern Mediterranean, University of Leeds [data set], https://doi.org/10.5518/1487, 2024.
Tobo, Y., DeMott, P. J., Hill, T. C. J., Prenni, A. J., Swoboda-Colberg, N. G., Franc, G. D., and Kreidenweis, S. M.: Organic matter matters for ice nuclei of agricultural soil origin, Atmos. Chem. Phys., 14, 8521–8531, https://doi.org/10.5194/acp-14-8521-2014, 2014.
Trueblood, J. V., Nicosia, A., Engel, A., Zäncker, B., Rinaldi, M., Freney, E., Thyssen, M., Obernosterer, I., Dinasquet, J., Belosi, F., Tovar-Sánchez, A., Rodriguez-Romero, A., Santachiara, G., Guieu, C., and Sellegri, K.: A two-component parameterization of marine ice-nucleating particles based on seawater biology and sea spray aerosol measurements in the Mediterranean Sea, Atmos. Chem. Phys., 21, 4659–4676, https://doi.org/10.5194/acp-21-4659-2021, 2021.
Ullrich, R., Hoose, C., Möhler, O., Niemand, M., Wagner, R., Höhler, K., Hiranuma, N., Saathoff, H., and Leisner, T.: A New Ice Nucleation Active Site Parameterization for Desert Dust and Soot, J. Atmos. Sci., 74, 699–717, https://doi.org/10.1175/JAS-D-16-0074.1, 2017.
Vali, G.: Quantitative Evaluation of Experimental Results on the Heterogeneous Freezing Nucleation of Supercooled Liquids, J. Atmos. Sci., 28, 402–409, https://doi.org/10.1175/1520-0469(1971)028<0402:QEOERA>2.0.CO;2, 1971.
Vali, G.: Freezing Rate Due to Heterogeneous Nucleation, J. Atmos. Sci., 51, 1843–1856, https://doi.org/10.1175/1520-0469(1994)051<1843:FRDTHN>2.0.CO;2, 1994.
Vali, G.: Repeatability and randomness in heterogeneous freezing nucleation, Atmos. Chem. Phys., 8, 5017–5031, https://doi.org/10.5194/acp-8-5017-2008, 2008.
Vali, G.: Revisiting the differential freezing nucleus spectra derived from drop-freezing experiments: methods of calculation, applications, and confidence limits, Atmos. Meas. Tech., 12, 1219–1231, https://doi.org/10.5194/amt-12-1219-2019, 2019.
Vergara-Temprado, J., Murray, B. J., Wilson, T. W., O'Sullivan, D., Browse, J., Pringle, K. J., Ardon-Dryer, K., Bertram, A. K., Burrows, S. M., Ceburnis, D., DeMott, P. J., Mason, R. H., O'Dowd, C. D., Rinaldi, M., and Carslaw, K. S.: Contribution of feldspar and marine organic aerosols to global ice nucleating particle concentrations, Atmos. Chem. Phys., 17, 3637–3658, https://doi.org/10.5194/acp-17-3637-2017, 2017.
Welti, A., Müller, K., Fleming, Z. L., and Stratmann, F.: Concentration and variability of ice nuclei in the subtropical maritime boundary layer, Atmos. Chem. Phys., 18, 5307–5320, https://doi.org/10.5194/acp-18-5307-2018, 2018.
Whale, T. F., Murray, B. J., O'Sullivan, D., Wilson, T. W., Umo, N. S., Baustian, K. J., Atkinson, J. D., Workneh, D. A., and Morris, G. J.: A technique for quantifying heterogeneous ice nucleation in microlitre supercooled water droplets, Atmos. Meas. Tech., 8, 2437–2447, https://doi.org/10.5194/amt-8-2437-2015, 2015.
Yaalon, D. H. and Ganor, E.: East Mediterranean trajectories of dust-carrying storms from the Sahara and Sinai, in: Saharan Dust: Mobilization, Transport, Deposition: Papers and Recommendations from a Workshop, Gothenburg, Sweden, 25–28 April 1977, edited by: Morales, C., John Wiley and Sons, New York, 187–193, 1979.
Zaitchik, B. F., Evans, J. P., Geerken, R. A., and Smith, R. B.: Climate and vegetation in the Middle East: Interannual variability and drought feedbacks, J. Climate, 20, 3924–3941, https://doi.org/10.1175/JCLI4223.1, 2007.
Zittis, G., Almazroui, M., Alpert, P., Ciais, P., Cramer, W., Dahdal, Y., Fnais, M., Francis, D., Hadjinicolaou, P., Howari, F., Jrrar, A., Kaskaoutis, D. G., Kulmala, M., Lazoglou, G., Mihalopoulos, N., Lin, X., Rudich, Y., Sciare, J., Stenchikov, G., Xoplaki, E., and Lelieveld, J.: Climate Change and Weather Extremes in the Eastern Mediterranean and Middle East, Rev. Geophys., 60, e2021RG000762, https://doi.org/10.1029/2021RG000762, 2022.