the Creative Commons Attribution 4.0 License.
the Creative Commons Attribution 4.0 License.
Validation of cantilever-enhanced photoacoustic particle-size-resolved light absorption measurement using nigrosin reference particles and Mie modelling
Juho Karhu
Tommi Mikkonen
Patrick Grahn
Aki Virkkula
Hilkka Timonen
Tuomas Hieta
Markku Vainio
Particle light absorption enhancement, also known as the lensing effect, is a complex phenomenon where particles undergo optical transformation as they age. This process is influenced by several factors, including particle size. To investigate the lensing effect, this study introduces and validates a novel method for size-resolved light absorption measurements using nigrosin particles as a model system. The method combines a three-wavelength cantilever-enhanced photoacoustic spectrometer (CEPAS) with a differential mobility analyser (DMA) to achieve particle-size-resolved measurements. Nigrosin, a well-characterised, spherically shaped, and water-soluble material, was selected to demonstrate the feasibility and precision of the approach. The system showed strong agreement (R2>0.94) with Mie-modelled absorption, confirming its reliability. While the broader motivation for this work lies in advancing techniques for studying ageing, coating, and absorption enhancement in black carbon and other atmospheric aerosols, the present study serves as a foundational step by validating the methodology in a controlled and simplified context. Future studies will expand the application of this method to complex systems, including coated and aggregated black carbon particles, to explore phenomena such as absorption enhancement.
- Article
(3815 KB) - Full-text XML
- BibTeX
- EndNote
Light-absorbing particles, such as black carbon (BC) and brown carbon (BrC), have an important role in the Earth's climate system. Unlike many other aerosol types that primarily scatter light, these particles absorb solar radiation, contributing to atmospheric warming (Bond et al., 2013). Additionally, they influence the optical properties of clouds, reduce surface albedo, and accelerate the melting of snow and ice (Lohmann et al., 2020; Qian et al., 2015). Given their relatively short atmospheric lifetimes compared to long-lived greenhouse gases like carbon dioxide, mitigating the emissions of light-absorbing particles presents a potential short-term strategy for addressing climate change (Xu and Ramanathan, 2017).
Despite their significance, aerosol particles remain a source of considerable uncertainty in climate-forcing estimates. Global climate models employed in the Sixth Assessment Report of the Intergovernmental Panel on Climate Change (IPCC) attribute a direct radiative forcing (DRF) of −0.22 W m−2 (−0.47 to 0.04; 5 %–95 % “very likely range”) to aerosol particles (Forster et al., 2023). In contrast, observational estimates have suggested that the corresponding DRF is approximately 0.75 W m−2 (e.g. Chung et al., 2012). These discrepancies between climate models and observations are believed to stem, in part, from the complex nature of particle ageing and the subsequent optical transformation, which are difficult to measure and model comprehensively across different regions and time periods (Li et al., 2024; Sipkens et al., 2023).
Black carbon particles emitted in combustion processes exhibit varying morphologies over time (Zhang et al., 2008). Initially, the freshly emitted particles, or spheres, form fractal-like chain agglomerates, whose optical characteristics can be derived mathematically from those of the individual spheres (Michelsen, 2017; Romshoo et al., 2021). As the agglomerates age, different materials – both gas- and particle-phased – merge onto them and transform them. The fractal-like form collapses, and the particles start to grow as a result of coating. Eventually, unless removed via deposition or washout, the particles reach a spherical state, where their light absorption has increased compared to that of the original agglomerate. In the literature, this process of transformation, and the consequent increase in light absorption, is referred to as the light absorption enhancement or lensing effect. Previous studies have shown that the light absorption enhancement factor, which scales the DRF, can vary between approximately 1 and 3.5, depending on several factors (Cappa et al., 2019; Wu et al., 2018).
The state of transformation and the subsequent thickness of the accumulated coating are significant factors influencing light absorption enhancement (Liu et al., 2015; Peng et al., 2016). However, properties such as particle morphology and mixing state, which relate to whether the particle “core” is fully encapsulated by the coating (internally mixed) or partly/completely separate (externally mixed), are also important (Liu et al., 2017). Recent theoretical studies suggest that, above all else, particle size may be a key factor to consider (Fierce et al., 2020; Matsui et al., 2018). The underlying reason for this is that the coating accumulation and particle mixing state depend on coagulation and condensation, which are both, in part, driven by particle size. For instance, it has been hypothesised that climate models' unrealistic approximation of the uniform distribution of coating material across differently sized particles is a source of discrepancy and that, in reality, the growth rate of a particle is nonlinear and dependent on, among other things, particle size (Fierce et al., 2020).
Particle light absorption can be measured using a variety of different methods and instruments. When aiming at particle-size-resolved light absorption measurement, key characteristics to consider are sensitivity and speed of the absorption measurement. Candidate techniques include filter photometers (e.g. Drinovec et al., 2015; Petzold et al., 2005) and photoacoustic spectrometers (Ajtai et al., 2010; Arnott et al., 1999; Lack et al., 2006), both of which are available in several different commercial instruments. Filter photometers are robust and widely used especially in air quality studies (e.g. Helin et al., 2018; Luoma et al., 2021). However, depositing particles on a filter may cause morphological changes in particles and thus alter their optical properties (Collaud Coen et al., 2010; Virkkula et al., 2007). Consequently, previous studies have suggested avoiding these instruments in studies of particle coating and absorption enhancement (Cappa et al., 2012; Lack et al., 2008, 2009). Photoacoustic spectrometers may not be as common as filter photometers, but they measure absorption directly in the aerosol phase without disturbing the sample (assuming no phase change when exposed to the laser). Photothermal interferometry, as well as a method known as extinction-minus-scattering (EMS), is also a technique that does not physically disturb the sample particles. In photothermal interferometry, the sample is illuminated with a light beam, and some of the light is absorbed by the gases and particles in the sample. Similar to the photoacoustic effect, this causes the sample to heat up and increase the temperature of the surrounding air. The increased temperature causes a small reduction in the air refractive index, which can be observed and measured (Kalbermatter et al., 2022; Moosmüller and Arnott, 1996; Sedlacek and Lee, 2007; Visser et al., 2020). In the method of EMS, the light absorption is derived by subtracting the measured scattering coefficient from the measured extinction coefficient. Traditionally, the measurements of these two coefficients have been performed using two separate instruments (e.g. an integrating nephelometer for aerosol scattering and a separate extinction monitor) (Singh et al., 2014). While the key benefit of the EMS is its traceability, it suffers from the occurrence of large subtractive error amplification, especially for scattering aerosols, and, as does the photothermal interferometry, from the relatively low sensitivity (Drinovec et al., 2022; Modini et al., 2021). Besides measurement sensitivity and speed, the ability to measure absorption in multiple different wavelengths is important as it enables the investigation of spectral dependency and thus aerosol composition. However, this feature is often readily available in many of the previously discussed instrument types.
Development in photoacoustic spectroscopy research has led to a detection technique, where the conventional microphone is replaced with a miniature silicon cantilever (Kauppinen et al., 2004). Unlike the stretching-based membrane microphone used in conventional instruments, the cantilever responds to the photoacoustic wave generated inside the sample cell by bending, which allows for a larger linear motion. Furthermore, the position of the cantilever is measured optically using an interferometer. These features allow for a higher measurement sensitivity than previously demonstrated photoacoustic spectrometers and filter photometers; for instance, a noise-equivalent detection limit (1σ) of 50 ppt (parts per trillion) in 1 s of integration time was achieved in NO2 detection using a visible light source (Peltola et al., 2015). With respect to aerosol studies, Karhu et al. (2021) demonstrated a noise-equivalent absorption coefficient (1σ) of 0.013 Mm−1 (= 1.3 × 10⁻¹⁰ cm−1) in 20 s of integration time for the measurement of atomised nigrosin particles.
This study introduces a method to measure size-resolved light absorption of particles. A key instrument in the developed method is a three-wavelength cantilever-enhanced photoacoustic spectrometer (CEPAS), which is coupled with a conventional differential mobility analyser (DMA) to enable particle-size-resolved measurement. With the developed and fully integrated DMA–CEPAS instrument, a laboratory experiment is conducted to explore the validity of the concept, where the size-resolved light absorption of atomised nigrosin reference particles is measured, and the results are compared to that of the Mie-modelled light absorption. Nigrosin is a well-characterised, water-soluble material that forms spherical particles when atomised. While the broader motivation for this work lies in advancing techniques for studying ageing, coating, and absorption enhancement in black carbon and other atmospheric aerosols, the present study serves as a foundational step by validating the methodology and the developed system in a controlled, simplified context. Future studies will expand the application of this method to complex systems, including coated and aggregated black carbon particles, to explore phenomena such as absorption enhancement.
2.1 Size-resolved light absorption measurement
2.1.1 Cantilever-enhanced photoacoustic spectrometer (CEPAS)
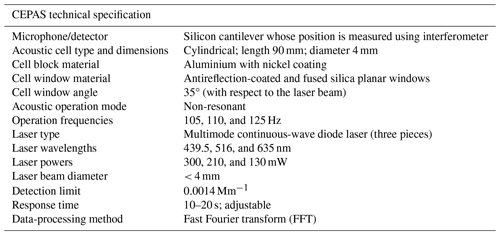
This study used CEPAS to measure particle light absorption. This instrumentation is based on instrumentation described in Karhu et al. (2021) and in Karhu et al. (2025), and a summary is provided here. The measurement setup, shown in Fig. 1, uses a photoacoustic cell from Gasera PA201 gas measurement system (Gasera Ltd., Finland), which has been adapted for aerosol measurements. This means that sampling losses in the sampling lines are minimised to the extent that is possible; used sample tubes and fittings are as large as possible with a minimum number of bends in them. The interaction volume of the photoacoustic cell is 4 mm in diameter and a 90 mm long and hollow cylinder through which a laser beam is shone. The measurement cell is closed during the measurement (no continuous flow through the cell during measurement), which increases the measurement time. In practice, obtaining a single measurement point takes approx. 10–20 s and involves several sequential steps, namely sample intake, a brief stabilisation period, recording of the photoacoustic signal, and flushing the sample from the cell. The time duration of these actions is adjustable. When the cell is closed, the sample flow (0.3 L min−1) bypasses the cell. When taking in a sample, the total sample flow flows through the cell. This is the main difference in comparison to the setup used in the parallel study by Karhu et al. (2025), where the sample is drawn to the cell using a secondary pump and a T-junction connected to the main sample flow. The laser source (RGB laser module by Opt Lasers, Tomorrow's System Sp. z o.o., Poland) uses three different wavelengths (measured at 439.5, 516, and 635 nm), and they are multiplexed at modulation frequencies of 105, 115, and 125 Hz. These frequencies were chosen to avoid spectral overlap with external acoustic noise and mechanical vibrations, such as those caused by nearby gas pumps. The different technical details of the CEPAS are summarised in Table 1.
Prior to the laboratory experiments conducted in this study, the CEPAS was initially calibrated using a known standard concentration of NO2. In practice, NO2 (concentration of 1.17 ppm) was diluted using mass flow controllers and compressed air, and four different measurement points were then recorded, each with a 10 min integration time. It was estimated that gas-phase calibration provided the most independent and reliable baseline when transitioning to particle-phase measurements. Furthermore, it mitigated uncertainties associated with particle-size-dependent deposition losses. In contrast, the NO2-based calibration suffers from drawbacks as well. For example, NO2 exhibits photodissociation below wavelengths of approximately 420 nm and has a relatively low-absorption cross section beyond 650 nm. Further details on the calibration of the CEPAS are also discussed extensively in another study by Karhu et al. (2025).
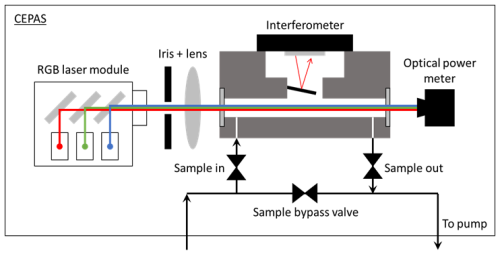
Figure 1A schematic of the CEPAS. The iris and the lens are used to shape the laser beam to fill the acoustic cell. Poorly shaped beams (e.g. the beam hits the cell walls) lead to increased noise. The acoustic signal is recorded with the interferometer.
2.1.2 CEPAS coupling with a differential mobility analyser (DMA)
To obtain particle size-resolved data, the CEPAS was coupled with a long-type DMA column (TSI Inc., USA). The general operating principles of a DMA are described in Hoppel (1978). The high-voltage and sheath airflow controls were replaced with aftermarket components for practical purposes, and the system (encompassing both the CEPAS and DMA) was operated using a custom LabVIEW program. For the sheath flow, a closed-loop arrangement and a manually adjustable blower were used. Temperature and relative humidity were also measured (SHT75; Sensirion AG, Switzerland) from the sheath flow. The aerosol flow was set by the CEPAS, and a model 3776 condensation particle counter (CPC; TSI Inc., USA) (lower particle detection size limit of 2.5 nm) sampled flow pumps. This arrangement and all the running parameters are described in more detail in Sect. 2.2.
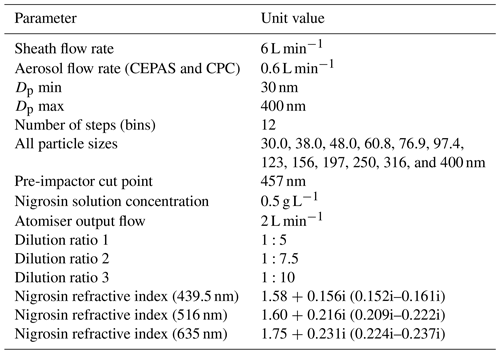
In the initialisation phase, the LabVIEW program takes in the physical dimensions of the DMA, aerosol, and sheath airflow rates and the desired range of the particle size distribution. It then proceeds to calculate the corresponding DMA voltages. A measurement scan (i.e. a complete size distribution measurement in which all the different particle sizes are measured one by one) begins with a background correction for the CEPAS; the DMA voltage is adjusted to zero, and the resulting CEPAS response is set as the zero background. Throughout the measurement process, the program iterates through DMA voltages incrementally, starting from the lowest and progressing to the highest. Upon completing the scan, the program conducts another zero-background check for the CEPAS. The DMA voltage stepping and the CEPAS sample exchange were configured to avoid measuring transient events in the DMA output. Each measurement step lasted 20 s, which included DMA voltage change, CEPAS cell flushing and stabilisation, and a 5 s measurement. The time delay for particles to travel from the DMA to CEPAS was approximately 8 s. For a full scan comprising 12 steps (i.e. 12 different particle sizes; see Table 2 for the exact particle sizes), the total measurement duration was 4 min and 40 s (12 measurements and two zero-background checks).
2.1.3 Data processing
For the size distribution measurement to represent true conditions, a data inversion needs to be conducted (Knutson and Whitby, 1975). This inversion accounts for deposition losses occurring in the sample lines, the particle charging efficiency, and the probability of multiply charged particles passing through the charge neutraliser in the DMA (Wiedensohler, 1988). In comparison to conventional particle number size distributions, the issue of multiply charged particles is more complex because light absorption is nonlinearly dependent on particle size. Therefore, each size bin and each charge multiple would require an individual correction. To minimise the effect of multiply charged particles, a pre-impactor with a cut point of 457 nm was used. This cut point was 57 nm greater than the upper limit of the measured particle size (see all running parameters in Table 2). A similar approach has been used by Bluvshtein et al. (2017).
Deposition losses in the CEPAS were estimated using both experimental and modelling approaches. A detailed explanation of these methods and results can be found in the study by Grahn and Kuula (2024), but a summary is provided here.
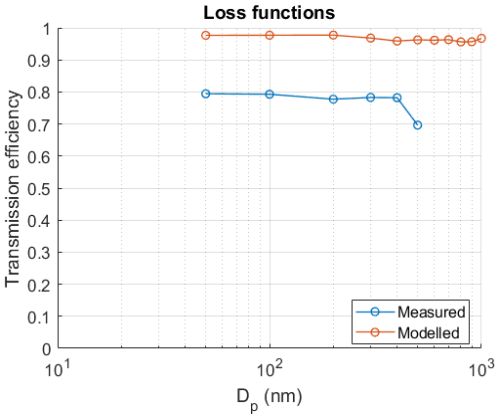
For the experimental approach, single-sized particles ranging from 50 to 500 nm were introduced either through the CEPAS sample lines or through a bypass line. The number concentrations measured in these two scenarios were then compared using a CPC. The results, shown in Fig. 2, indicated minimal to negligible losses for particles between 50 and 400 nm, with a slight increase in losses for sizes larger than 400 nm. However, a constant transmission efficiency of approximately 80 % was observed for particles between 50 and 400 nm. This offset was not reflected in the modelling results and is believed to be an artefact.
The root cause for this offset was estimated to be small flow channels and tube fitting sizes (inner diameter 2 mm), which resulted in a significant under-pressure within the system. When sampling through the CEPAS, the CPC indicated a pressure of approximately 0.50 atm compared to 0.90 atm during bypass measurements. The literature suggests that CPCs may undercount particles under low-pressure conditions (Bauer et al., 2023). Since the current photoacoustic cell is a commercial component originally designed and manufactured by Gasera Ltd. for trace-gas measurement, redesigning and optimising the flow channels for aerosol-phase measurements was beyond the scope and resources of this study. While the hypothesis of low pressure as the root cause of the transmission offset remains to be fully validated, the study's results are considered useful and reliable within its context. The sub-optimal flow channels will be addressed in future work.
In the modelling approach, the model was first validated using test cases from the literature. A detailed 3D model of the CEPAS cell and sampling lines was then created, and computational fluid dynamics were employed to simulate the losses. Only inertial-type losses were considered diffusion losses for particles larger than 50 nm and were deemed negligible. The particles were assumed to be spherical, although their morphology was not explicitly verified. The modelling results indicated no significant inertial losses for particles smaller than 1 µm at a flow rate of 0.3 L min−1, as seen in Fig. 2. In the inversion calculations, a loss function derived from the experimental studies was used with a constant offset compensated and to which a second-order polynomial fit was applied. Further discussion about the particle-size-dependency of the DMA–CEPAS is provided in the Sect. 3.
2.2 Laboratory validation
The evaluation of the DMA–CEPAS instrument was carried out by comparing its measured light absorption size distribution to the Mie-modelled light absorption size distribution derived from a concurrent CPC number size distribution measurement. An inversion was also applied to the CPC-derived measurement, with the exception that the particle loss function used in the CEPAS inversion was replaced with a CPC counting efficiency function. This counting efficiency function was 1 for the particle sizes measured in this study (30–400 nm; see Table 2). The Mie-based light absorption efficiencies (Qabs) for different wavelengths were calculated using a MATLAB program by Baldi (2024). Equation (1) was then used to calculate the reference absorption coefficients (babs).
where λ is the wavelength, Dp is the particle diameter, m is the complex refractive index, and n is the particle number concentration. The unit of babs is Mm−1.
In essence, to use Mie's theory, one must know the particle size and particle number concentration, as well as the refractive index of the particle material. The reference particles used in this study were water-soluble nigrosin (CAS no. 8005-03-6) for which refractive index has been previously defined by Drinovec et al. (2022). The exact refractive indices used in the Mie calculations in this study are shown in Table 2. Notably, Drinovec et al. provided values for wavelengths of 450, 532, and 633 nm, which differ slightly from the CEPAS laser wavelengths of 439.5, 516, and 635 nm. To account for this, a second-degree polynomial fit was applied to the original data, allowing the extrapolation and interpolation of the refractive indices for the CEPAS wavelengths. Additionally, as stated in the source material, an uncertainty of ±3 % was also added to the imaginary part of the refractive indices to account for potential inaccuracies in its definition. The imaginary part of the refractive index drives the attenuation of light within the particle and therefore essentially defines the particle's light absorption. Nigrosin is often used in light absorption instrument testing as there is literature available describing its optical properties and because it forms spherically shaped particles when aerosolised and dried (Drinovec et al., 2022; Lack et al., 2006). Particle sphericity is an assumption of Mie's theory.
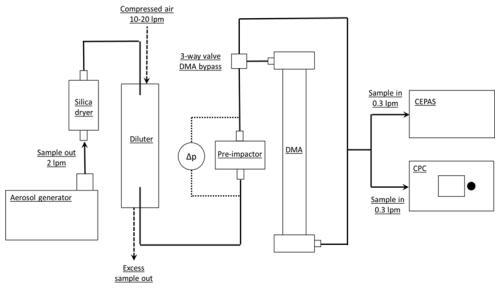
A schematic of the measurement setup is shown in Fig. 3. The reference aerosol generated with a model ATM 226 aerosol generator (Topas GmbH, Germany) was first dried with a silica gel dryer (relative humidity measured at the DMA was 10 %–30 % throughout the measurements) and subsequently diluted with varying ratios of 1:5, 1:7.5, and 1:10. The measurements were conducted separately with all the different dilution ratios. After dilution, the sample aerosol was fed through the pre-impactor and then to a three-way valve, which directed the sample either through or past the DMA. By checking the total output concentration and by comparing it to the inverted concentration, it was possible to ensure the validity of the inversion calculation. After the DMA, the sample was split symmetrically into CEPAS and CPC with flow rates of 0.3 L min−1.
3.1 Baseline validation
3.1.1 Light absorption size distribution profiles
Light absorption size distributions measured with the DMA–CEPAS and calculated using the Mie model are shown in Fig. 4. The three columns correspond to the three different dilution ratios of 1:5 (10 L min−1), 1:7.5 (15 L min−1), and 1:10 (20 L min−1). The flow rates noted in the parentheses correspond to the rate of dilution flow. Altogether, 16, 22, and 17 measurement scans (from 30 to 400 nm in 12 size bins) were recorded for the three different dilution ratio scenarios, respectively. The different line colours correspond to different CEPAS laser wavelengths, and the dashed black line corresponds to the Mie reference light absorption. The solid line indicates the measurement mean, and the shaded background area is the respective standard deviation. The standard deviation (statistical uncertainty) of the Mie absorption is derived from the CPC measurement. The Mie theory itself is deterministic.
Overall, the distributions across the different wavelengths and different dilution ratios exhibit fairly similar profiles. On average, the geometric mean diameters (GMDs) between the CEPAS and Mie-modelled distributions differ by 7.2 % (range of 3.7 %–12 %) and the geometric standard deviations (GSDs) differ by 2.8 % (range of 0.6 %–6.8 %). With respect to the maximum measured absorption levels, the blue wavelength shows on average 23 % higher maximum absorption levels, the green wavelength shows 39 % higher maximum absorption levels, and the red wavelength shows 9.0 % lower maximum absorption levels compared to the respective Mie-modelled values. The statistical uncertainty in the CEPAS is higher than the Mie-modelled one in all dilution scenarios and wavelengths as seen in the panel legends.
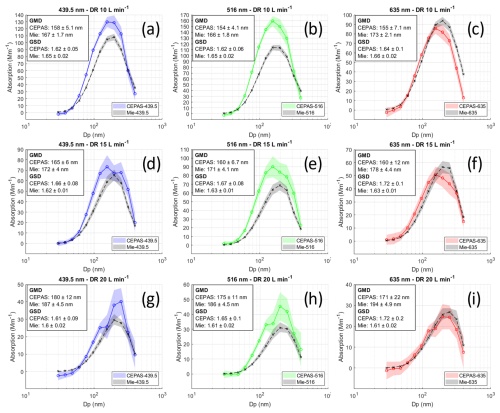
Figure 4Light absorption size distributions measured and modelled with 10, 15, and 20 L min−1 dilution flow rates. The line colours correspond to different wavelengths of the CEPAS, and the dashed black line is the Mie reference absorption. The solid line indicates the measurement mean, and the shaded background area is the respective standard deviation. The shaded black area of the Mie absorption is a sum of the standard deviation of the CPC measurement and the ±3 % uncertainty in the imaginary part of the refractive index. The abbreviation “DR” stands for “dilution ratio”.
3.1.2 Correlation
Scatter plots, where the data from the different dilution ratio scenarios have been combined, are shown for different wavelengths in Fig. 5. The solid black line shows a 1:1 relation, and the dashed black line shows the fit for an ordinary least squares regression. The error bars represent standard deviations. Overall, the CEPAS and Mie-modelled absorption show a strong correlation at all wavelengths as the coefficient of determination (R2) ranges from 0.94 to 0.97. The agreement between the two methods is best at the red wavelength as the normalised and ordinary root mean square errors (NRMSE and RMSE) are 27 % and 7.5 Mm−1, respectively. The respective values for the blue and green wavelength are 39 % and 12 Mm−1 and 62 % and 20 Mm−1, respectively.
3.2 Particle size dependency
Further analysis of the CEPAS particle size dependency was conducted. Figure 6 shows the relative difference between the CEPAS and Mie-modelled absorption as a function of particle size. The first three size bins (30, 38, and 48 nm) were omitted because these bins had very low values in all measurement scenarios. This caused the relative difference to exhibit outliers in comparison to the other size bins. The dashed black line, representing an ordinary least squares linear regression, shows a decreasing trend. This indicates that as the particle size decreases, the CEPAS-measured absorption increases more than the Mie-modelled absorption. Since CEPAS and CPC-derived Mie absorption measure the same-sized particles simultaneously, this size dependency is likely due to an incorrectly formulated loss function used in the inversion.
To address the size-dependent response, a correction procedure was applied to the original loss function. The linear regression shown in Fig. 6 (dashed black line) and in Eq. (2) was first used to calculate an intermediary variable yi for all particle size bins. The final correction factors Ci were then derived by dividing the array of intermediary variables with the first element of the array. This calculation is shown in Eq. (3).
Dp,i is the particle size of the ith bin in nanometres. The corrections factors Ci were multiplied with original loss function values to scale the slope of the regression function to zero. A slope of zero indicates that the relative difference between the CEPAS and Mie-modelled absorption has no particle size dependency. The corrected size-dependency scatter plot and the corrected loss function are shown in Fig. 7a and b, respectively.
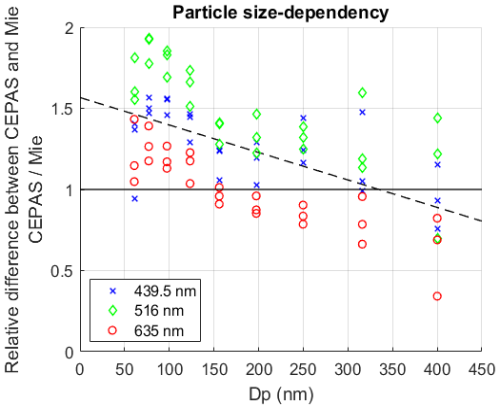
Figure 6Particle size dependency of the CEPAS is illustrated as a ratio of CEPAS absorption divided by Mie absorption. A value of 1 indicates exact equivalence. The first three size bins (30, 38, and 48 nm) were omitted due to being outliers. The dashed black line represents the ordinary least squares regression line.
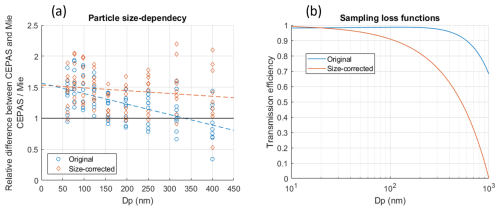
Figure 7Corrected scatter plot of the DMA–CEPAS size dependency and the corrected loss function used in the inversion.
Figure 8 shows the light absorption size distribution profiles calculated using the re-formulated loss function. In comparison to the baseline validation, the similarity of the GMD and GSD improved; on average, the GMDs differ now by 3.1 % (7.2 %) and the GSD by 2.7 % (2.8 %) (previous values in parentheses). The corresponding scatter plots with data combined from the different dilution scenarios are shown in Fig. 9. The R2 values indicate an increased correlation across all wavelengths; blue improved from 0.97 to 0.98, green from 0.96 to 0.98, and red from 0.94 to 0.97. However, the metrics for accuracy deteriorated for the blue and green wavelengths. The RMSE and NRMSE values increased from 12 to 20 Mm−1 and from 39 % to 60 % for the blue wavelength and from 20 to 30 Mm−1 and 62 % to 90 % for the green wavelength. Conversely, the red wavelength exhibited improved accuracy, with RMSE and NRMSE values decreasing from 7.5 to 5.8 Mm−1 and from 27 % to 21 %, respectively.
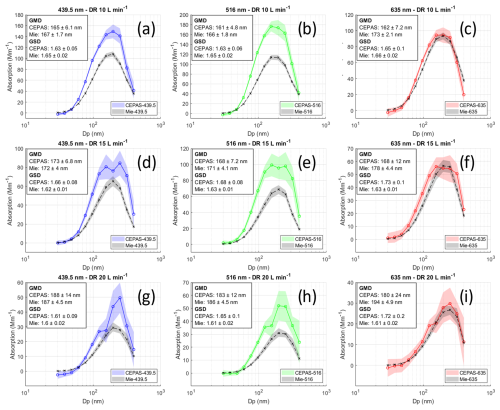
Figure 8Final particle-size-corrected and particle-size-calibrated light absorption size distributions measured with the DMA–CEPAS.
3.3 The novelty of DMA–CEPAS in relation to size-resolved light absorption measurement
Currently, the most technologically advanced and commercially available devices for measuring size-resolved light-absorbing particles include the single-particle soot photometer (SP2; Droplet Measurement Technologies LLC., USA) and the soot particle aerosol mass spectrometer (SP-AMS; Aerodyne Research Inc., USA). These instruments have proven vital for aerosol research, particularly in the study of carbonaceous particles (e.g. Chen et al., 2018; Liu et al., 2019; Schwarz et al., 2006). The SP2 measures the number and mass size distributions of refractory black carbon (i.e. vaporises only at very high temperatures) and its coating thickness using techniques based on light scattering and incandescence (Baumgardner et al., 2004; Stephens et al., 2003). The SP-AMS, on the other hand, measures the size-resolved chemical composition of particles using mass spectrometry and ion concentration quantification (Onasch et al., 2012). Despite the utility of the SP2 and SP-AMS, they do not explicitly measure particle light absorption, which is an essential aerosol parameter when considering the impact of light-absorbing particles on climate.
More conventional light absorption measurement instruments have been employed for size-resolved light absorption measurements in various ways. For example, a method involving sample collection using a multi-stage impactor followed by optical or chemical analysis (e.g. measurement of transmission or methanol/water extraction and spectrophotometer measurement) has been utilised in multiple studies (Feng et al., 2023; Gao et al., 2015; Horvath, 1995; Lei et al., 2018; Liu et al., 2013; Wu et al., 2020). Although this is a valid method, it suffers from poor temporal resolution (typically > 1 h) and does not produce real-time data. Moreover, depositing particles on a filter may cause morphological changes and thus alter their optical properties, as discussed in Sect. 1. A more autonomous method, similar to the DMA–CEPAS, is to couple a particle sizer such as a DMA or an aerodynamic aerosol classifier (AAC) with a filter photometer. This approach has been employed in several studies using various instrument configurations (Baxla et al., 2009; Ning et al., 2013; Stabile et al., 2012; Tunved et al., 2021; Zhao et al., 2019, 2022). The challenges associated with the filter photometers are mostly the same as those of the manual sample collection, namely the deposition of particles on a filter, as well as the temporal resolution arising from the sensitivity and speed of the measurement. Comparatively, similar studies in which a photoacoustic spectrometer has been used instead of a filter photometer are also available (Chakrabarty et al., 2007; Forestieri et al., 2018; Slowik et al., 2007a, b). The focus of these studies has been on the investigation of particle ageing, coating, and absorption enhancement in a laboratory setting. To the degree that can be interpreted from the experimental descriptions, the DMA (used in these cases) has not been integrated with the spectrometer with respect to instrument control and data processing. Although this deviates from the DMA–CEPAS design, the end result is practically the same. The EMS method discussed in Sect. 1 has also been used in particle-size-resolved absorption measurements (Khalizov et al., 2009). With respect to fully integrated devices, a photoacoustic instrument capable of indicative size-selectiveness was recently developed by Ajtai et al. (2023). The size selection is based on the measurement of phase shift between the modulation of the light and the resulting photoacoustic signal. The key benefit compared to other discussed systems is that the size selection is essentially performed within the domain of the photoacoustic instrument itself; it does not rely on “external” means of classifying particle sizes, and therefore, many of its design and operation characteristics remain fairly simple (e.g. no data inversion required). However, until further improvements are made, the size-resolving power of this method remains limited in comparison to traditional DMAs or AACs.
To date, there appears to be no established method for the measurement of particle-size-resolved light absorption. In comparison to the previous implementations, the main advantages of the DMA–CEPAS are its high level of instrument integration and sensitivity, as well as the aerosol-phased measurement. As noted in Sect. 1, Karhu et al. (2021) demonstrated the noise-equivalent absorption coefficient (1σ) of the CEPAS to be 0.013 Mm−1 (= 1.3 × 10⁻¹⁰ cm−1) in a 20 s integration time. Nevertheless, the DMA–CEPAS requires more development and testing. For example, its adaptation to field measurements may require re-configurations in system running parameters, although the standalone version of the CEPAS without the DMA has been used successfully in the field (Karhu et al., 2025). Additionally, re-visiting the instrument calibration using gas- and particle-phase references would be beneficial.
A method for the measurement of particle-size-resolved light absorption was developed. A key instrument used was a highly sensitive and fast three-wavelength cantilever-enhanced photoacoustic spectrometer (CEPAS) adopted for particle measurements, which was coupled with a conventional differential mobility analyser (DMA) to enable size-resolved measurement. The laboratory validation of the DMA–CEPAS system showed high comparability (R2>0.94) against the Mie-modelled reference light absorption of atomised nigrosin particles. An important aspect of the system configuration was found to be the particle loss function used in inversion calculation. Despite utilising both experimental and theoretical approaches, the initial estimation of the loss function differed slightly from what the comparison to the Mie reference absorption indicated. Furthermore, despite calibrating the CEPAS prior to the experiments, the measured absolute absorption levels for the blue and green wavelengths deviated from that of the Mie-predicted values. Therefore, re-calibration is necessary before deploying the system to outdoor measurements, for example.
To the authors' best knowledge, the introduced DMA–CEPAS is a unique system capable of measuring particle-size-resolved light absorption with moderately fast speed (< 5 min sample duration) in aerosol phase and in real-life absorption levels. This enables intriguing opportunities for future studies, such as those investigating particle ageing and the so-called lensing effect. The uncertainties related to these complex processes hinder the trustworthiness of climate change predictions, and therefore, systematic research in this area is warranted. While black carbon ageing, coating, and absorption enhancement are key applications motivating the broader development of this methodology, the present study only focused on nigrosine as a simplified test case for demonstrating the validity and feasibility of the approach. Possible future developments could include the integration of DMA–CEPAS with particle mass measurement using a centrifugal particle mass analyser. This would allow more detailed investigations of particle morphology, which is – besides particle size – an essential factor controlling particle light absorption and light absorption enhancement.
All data are available upon reasonable request.
JoK: conceptualisation, instrumentation and software, experiments, data analysis, writing (original draft), and funding acquisition. JuK, TM, and PG: instrumentation and software and writing (review and editing). AV and TH: writing (review and editing); HT and MV: writing (review and editing) and funding acquisition.
At least one of the (co-)authors is a member of the editorial board of Aerosol Research. Tuomas Hieta is employed by Gasera Ltd. The authors have no other competing interests to declare.
Publisher’s note: Copernicus Publications remains neutral with regard to jurisdictional claims made in the text, published maps, institutional affiliations, or any other geographical representation in this paper. While Copernicus Publications makes every effort to include appropriate place names, the final responsibility lies with the authors.
This research has been supported by the Research Council of Finland (grant no. 349544) and the Jane ja Aatos Erkon Säätiö grant (Compact and precise sensor for global black carbon monitoring).
This paper was edited by Jose Castillo and reviewed by two anonymous referees.
Ajtai, T., Filep, Á., Schnaiter, M., Linke, C., Vragel, M., Bozóki, Z. Á., Szabó, Gá., and Leisner, T.: A novel multii-wavelength photoacoustic spectrometer for the measurement of the UV-vis-NIR spectral absorption coefficient of atmospheric aerosols, J. Aerosol Sci., 41, 1020–1029, https://doi.org/10.1016/j.jaerosci.2010.07.008, 2010.
Ajtai, T., Hodovány, S., Schnaiter, M., Szabó, G., and Bozóki, Z.: Absorption based size characterisation of aerosol by using photoacoustic spectroscopy, Atmos. Environ., 304, 2–6, https://doi.org/10.1016/j.atmosenv.2023.119772, 2023.
Arnott, W. P., Moosmüller, H., Rogers, C. F., Jin, T., and Bruch, R.: Photoacoustic spectrometer for measuring light absorption by aerosol: Instrument description, Atmos. Environ., 33, 2845–2852, https://doi.org/10.1016/S1352-2310(98)00361-6, 1999.
Baldi, A.: Mie_Scattering_and_Absorption_Sphere, GitHub, https://github.com/andrea-baldi/Mie_Scattering_and_Absorption_Sphere/releases/tag/v1.0.2 (last access: 27 May 2024), 2024.
Bauer, P. S., Spät, D., Eisenhut, M., Gattringer, A., and Weinzierl, B.: Pressure-dependent performance of two CEN-specified condensation particle counters, Atmos. Meas. Tech., 16, 4445–4460, https://doi.org/10.5194/amt-16-4445-2023, 2023.
Baumgardner, D., Kok, G., and Raga, G.: Warming of the Arctic lower stratosphere by light absorbing particles, Geophys. Res. Lett., 31, 10–13, https://doi.org/10.1029/2003gl018883, 2004.
Baxla, S. P., Roy, A. A., Gupta, T., Tripathi, S. N., and Bandyopadhyaya, R.: Analysis of diurnal and seasonal variation of submicron outdoor aerosol mass and size distribution in a northern indian city and its correlation to black carbon, Aerosol Air Qual. Res., 9, 458–469, https://doi.org/10.4209/aaqr.2009.03.0017, 2009.
Bluvshtein, N., Flores, J. M., He, Q., Segre, E., Segev, L., Hong, N., Donohue, A., Hilfiker, J. N., and Rudich, Y.: Calibration of a multi-pass photoacoustic spectrometer cell using light-absorbing aerosols, Atmos. Meas. Tech., 10, 1203–1213, https://doi.org/10.5194/amt-10-1203-2017, 2017.
Bond, T. C., Doherty, S. J., Fahey, D. W., Forster, P. M., Berntsen, T., Deangelo, B. J., Flanner, M. G., Ghan, S., Kärcher, B., Koch, D., Kinne, S., Kondo, Y., Quinn, P. K., Sarofim, M. C., Schultz, M. G., Schulz, M., Venkataraman, C., Zhang, H., Zhang, S., Bellouin, N., Guttikunda, S. K., Hopke, P. K., Jacobson, M. Z., Kaiser, J. W., Klimont, Z., Lohmann, U., Schwarz, J. P., Shindell, D., Storelvmo, T., Warren, S. G., and Zender, C. S.: Bounding the role of black carbon in the climate system: A scientific assessment, J. Geophys. Res.-Atmos., 118, 5380–5552, https://doi.org/10.1002/jgrd.50171, 2013.
Cappa, C. D., Onasch, T. B., Massoli, P., Worsnop, D. R., Bates, T. S., Cross, E. S., Davidovits, P., Hakala, J., Hayden, K. L., Jobson, B. T., Kolesar, K. R., Lack, D. A., Lerner, B. M., Li, S. M., Mellon, D., Nuaaman, I., Olfert, J. S., Petäjä, T., Quinn, P. K., Song, C., Subramanian, R., Williams, E. J., and Zaveri, R. A.: Radiative absorption enhancements due to the mixing state of atmospheric black carbon, Science, 80, 1078–1081, https://doi.org/10.1126/science.1223447, 2012.
Cappa, C. D., Zhang, X., Russell, L. M., Collier, S., Lee, A. K. Y., Chen, C. L., Betha, R., Chen, S., Liu, J., Price, D. J., Sanchez, K. J., McMeeking, G. R., Williams, L. R., Onasch, T. B., Worsnop, D. R., Abbatt, J. P. D., and Zhang, Q.: Light Absorption by Ambient Black and Brown Carbon and its Dependence on Black Carbon Coating State for Two California, USA, Cities in Winter and Summer, J. Geophys. Res.-Atmos., 124, 1550–1577, https://doi.org/10.1029/2018JD029501, 2019.
Chakrabarty, R. K., Moosmüller, H., Arnott, W. P., Garro, M. A., Slowik, J. G., Cross, E. S., Han, J. H., Davidovits, P., Onasch, T. B., and Worsnop, D. R.: Light scattering and absorption by fractal-like carbonaceous chain aggregates: Comparison of theories and experiment, Appl. Opt., 46, 6990–7006, https://doi.org/10.1364/AO.46.006990, 2007.
Chen, Y., Ge, X., Chen, H., Xie, X., Chen, Y., Wang, J., Ye, Z., Bao, M., Zhang, Y., and Chen, M.: Seasonal light absorption properties of water-soluble brown carbon in atmospheric fine particles in Nanjing, China, Atmos. Environ., 187, 230–240, https://doi.org/10.1016/j.atmosenv.2018.06.002, 2018.
Chung, C. E., Ramanathan, V., and Decremer, D.: Observationally constrained estimates of carbonaceous aerosol radiative forcing, P. Natl. Acad. Sci. USA, 109, 11624–11629, https://doi.org/10.1073/pnas.1203707109, 2012.
Collaud Coen, M., Weingartner, E., Apituley, A., Ceburnis, D., Fierz-Schmidhauser, R., Flentje, H., Henzing, J. S., Jennings, S. G., Moerman, M., Petzold, A., Schmid, O., and Baltensperger, U.: Minimizing light absorption measurement artifacts of the Aethalometer: evaluation of five correction algorithms, Atmos. Meas. Tech., 3, 457–474, https://doi.org/10.5194/amt-3-457-2010, 2010.
Drinovec, L., Močnik, G., Zotter, P., Prévôt, A. S. H., Ruckstuhl, C., Coz, E., Rupakheti, M., Sciare, J., Müller, T., Wiedensohler, A., and Hansen, A. D. A.: The “dual-spot” Aethalometer: an improved measurement of aerosol black carbon with real-time loading compensation, Atmos. Meas. Tech., 8, 1965–1979, https://doi.org/10.5194/amt-8-1965-2015, 2015.
Drinovec, L., Jagodič, U., Pirker, L., Škarabot, M., Kurtjak, M., Vidović, K., Ferrero, L., Visser, B., Röhrbein, J., Weingartner, E., Kalbermatter, D. M., Vasilatou, K., Bühlmann, T., Pascale, C., Müller, T., Wiedensohler, A., and Močnik, G.: A dual-wavelength photothermal aerosol absorption monitor: design, calibration and performance, Atmos. Meas. Tech., 15, 3805–3825, https://doi.org/10.5194/amt-15-3805-2022, 2022.
Feng, W., Shao, Z., Wang, Q., and Xie, M.: Size-resolved light-absorbing organic carbon and organic molecular markers in Nanjing, east China: Seasonal variations and sources, Environ. Pollut., 332, 122006, https://doi.org/10.1016/j.envpol.2023.122006, 2023.
Fierce, L., Onasch, T. B., Cappa, C. D., Mazzoleni, C., China, S., Bhandari, J., Davidovits, P., Al Fischer, D., Helgestad, T., Lambe, A. T., Sedlacek, A. J., Smith, G. D., and Wolff, L.: Radiative absorption enhancements by black carbon controlled by particle-to-particle heterogeneity in composition, P. Natl. Acad. Sci. USA, 117, 5196–5203, https://doi.org/10.1073/pnas.1919723117, 2020.
Forestieri, S. D., Helgestad, T. M., Lambe, A. T., Renbaum-Wolff, L., Lack, D. A., Massoli, P., Cross, E. S., Dubey, M. K., Mazzoleni, C., Olfert, J. S., Sedlacek III, A. J., Freedman, A., Davidovits, P., Onasch, T. B., and Cappa, C. D.: Measurement and modeling of the multiwavelength optical properties of uncoated flame-generated soot, Atmos. Chem. Phys., 18, 12141–12159, https://doi.org/10.5194/acp-18-12141-2018, 2018.
Forster, P. M., Storelvmo, T., Armour, K., Collins, W., Dufresne, J.-L., Frame, D., Lunt, D. J., Mauritsen, T., Palmer, M. D., Watanabe, M., Wild, M., and Zhang, H.: The Earth's Energy Budget, Climate Feedbacks and Climate Sensitivity, in Climate Change 2021 – The Physical Science Basis, edited by: Masson-Delmotte, V., Zhai, P. M., Pirani, A., Connors, S. L., Pean, C., Berger, S., Caud, N., Chen, Y., Goldfarb, L., Gomis, M. I., Huang, M., Leitzell, K., Lonnoy, E., Matthews, J. B. R., Maycock, T. K., Waterfield, T., Yelekci, O., Yu, R., and Zhou, B., 923–1054 pp., Cambridge University Press, https://doi.org/10.1017/9781009157896.002, 2023.
Gao, Y., Lai, S., Lee, S. C., Yau, P. S., Huang, Y., Cheng, Y., Wang, T., Xu, Z., Yuan, C., and Zhang, Y.: Optical properties of size-resolved particles at a Hong Kong urban site during winter, Atmos. Res., 155, 1–12, https://doi.org/10.1016/j.atmosres.2014.10.020, 2015.
Grahn, P. and Kuula, J.: Finite Element Simulation of Aerosol Particle Trajectories in a Cantilever-Enhanced Photoacoustic Spectrometer for Characterization of Inertial Deposition Loss, Processes, 12, 2827, https://doi.org/10.3390/pr12122827, 2024.
Helin, A., Niemi, J. V., Virkkula, A., Pirjola, L., Teinilä, K., Backman, J., Aurela, M., Saarikoski, S., Rönkkö, T., Asmi, E., and Timonen, H.: Characteristics and source apportionment of black carbon in the Helsinki metropolitan area, Finland, Atmos. Environ., 190, 87–98, https://doi.org/10.1016/j.atmosenv.2018.07.022, 2018.
Hoppel, W. A.: Determination of the aerosol size distribution from the mobility distribution of the charged fraction of aerosols, J. Aerosol Sci., 9, 41–54, https://doi.org/10.1016/0021-8502(78)90062-9, 1978.
Horvath, H.: Size segregated light absorption coefficient of the atmospheric aerosol, Atmos. Environ., 29, 875–883, https://doi.org/10.1016/1352-2310(95)00025-T, 1995.
Kalbermatter, D. M., Močnik, G., Drinovec, L., Visser, B., Röhrbein, J., Oscity, M., Weingartner, E., Hyvärinen, A.-P., and Vasilatou, K.: Comparing black-carbon- and aerosol-absorption-measuring instruments – a new system using lab-generated soot coated with controlled amounts of secondary organic matter, Atmos. Meas. Tech., 15, 561–572, https://doi.org/10.5194/amt-15-561-2022, 2022.
Karhu, J., Kuula, J., Virkkula, A., Timonen, H., Vainio, M., and Hieta, T.: Cantilever-enhanced photoacoustic measurement of light-absorbing aerosols, Aerosol Sci. Technol., 56, 92–100, https://doi.org/10.1080/02786826.2021.1998338, 2021.
Karhu, J., Mikkonen, T., Kuula, J., Virkkula, A., Ikonen, E., Vainio, M., Timonen, H., and Hieta, T.: Field-deployable cantilever-enhanced photoacoustic instrument for aerosol light absorption measurement at three wavelengths, Aerosol Res., 1–18, https://doi.org/10.5194/ar-2024-25, 2025.
Kauppinen, J., Wilcken, K., Kauppinen, I., and Koskinen, V.: High sensitivity in gas analysis with photoacoustic detection, Microchem. J., 76, 151–159, https://doi.org/10.1016/j.microc.2003.11.007, 2004.
Khalizov, A. F., Xue, H., Wang, L., Zheng, J., and Zhang, R.: Enhanced Light Absorption and Scattering by Carbon Soot Aerosol Internally Mixed with Sulfuric Acid, J. Phys. Chem. A, 113, 1066–1074, https://doi.org/10.1021/jp807531n, 2009.
Knutson, E. O. and Whitby, K. T.: Aerosol classification by electric mobility: apparatus, theory, and applications, J. Aerosol Sci., 6, 443–451, https://doi.org/10.1016/0021-8502(75)90060-9, 1975.
Lack, D. A., Lovejoy, E. R., Baynard, T., Pettersson, A., and Ravishankara, A. R.: Aerosol Absorption Measurement using Photoacoustic Spectroscopy: Sensitivity, Calibration, and Uncertainty Developments, Aerosol Sci. Technol., 40, 697–708, https://doi.org/10.1080/02786820600803917, 2006.
Lack, D. A., Cappa, C. D., Covert, D. S., Baynard, T., Massoli, P., Sierau, B., Bates, T. S., Quinn, P. K., Lovejoy, E. R., and Ravishankara, A. R.: Bias in filter-based aerosol light absorption measurements due to organic aerosol loading: Evidence from ambient measurements, Aerosol Sci. Technol., 42, 1033–1041, https://doi.org/10.1080/02786820802389277, 2008.
Lack, D. A., Massoli, P., Lack, D. A., Massoli, P., Cappa, C. D., Cross, E. S., Ahern, A. T., Davidovits, P., Onasch, T. B., Davidovits, P., and Onasch, T. B.: Absorption enhancement of coated absorbing aerosols: Validation of the photo-acoustic technique for measuring the enhancement, Aerosol Sci. Technol., 43, 1006–1012, https://doi.org/10.1080/02786820903117932, 2009.
Lei, Y., Shen, Z., Zhang, T., Zhang, Q., Wang, Q., Sun, J., Gong, X., Cao, J., Xu, H., Liu, S., and Yang, L.: Optical source profiles of brown carbon in size-resolved particulate matter from typical domestic biofuel burning over Guanzhong Plain, China, Sci. Total Environ., 622–623, 244–251, https://doi.org/10.1016/j.scitotenv.2017.11.353, 2018.
Li, W., Riemer, N., Xu, L., Wang, Y., Adachi, K., Shi, Z., Zhang, D., Zheng, Z., and Laskin, A.: Microphysical properties of atmospheric soot and organic particles: measurements, modeling, and impacts, npj Clim. Atmos. Sci., 7, 1–14, https://doi.org/10.1038/s41612-024-00610-8, 2024.
Liu, D., Whitehead, J., Alfarra, M. R., Reyes-Villegas, E., Spracklen, D. V., Reddington, C. L., Kong, S., Williams, P. I., Ting, Y. C., Haslett, S., Taylor, J. W., Flynn, M. J., Morgan, W. T., McFiggans, G., Coe, H., and Allan, J. D.: Black-carbon absorption enhancement in the atmosphere determined by particle mixing state, Nat. Geosci., 10, 184–188, https://doi.org/10.1038/ngeo2901, 2017.
Liu, D., Joshi, R., Wang, J., Yu, C., Allan, J. D., Coe, H., Flynn, M. J., Xie, C., Lee, J., Squires, F., Kotthaus, S., Grimmond, S., Ge, X., Sun, Y., and Fu, P.: Contrasting physical properties of black carbon in urban Beijing between winter and summer, Atmos. Chem. Phys., 19, 6749–6769, https://doi.org/10.5194/acp-19-6749-2019, 2019.
Liu, J., Bergin, M., Guo, H., King, L., Kotra, N., Edgerton, E., and Weber, R. J.: Size-resolved measurements of brown carbon in water and methanol extracts and estimates of their contribution to ambient fine-particle light absorption, Atmos. Chem. Phys., 13, 12389–12404, https://doi.org/10.5194/acp-13-12389-2013, 2013.
Liu, S., Aiken, A. C., Gorkowski, K., Dubey, M. K., Cappa, C. D., Williams, L. R., Herndon, S. C., Massoli, P., Fortner, E. C., Chhabra, P. S., Brooks, W. A., Onasch, T. B., Jayne, J. T., Worsnop, D. R., China, S., Sharma, N., Mazzoleni, C., Xu, L., Ng, N. L., Liu, D., Allan, J. D., Lee, J. D., Fleming, Z. L., Mohr, C., Zotter, P., Szidat, S., and Prévôt, A. S. H.: Enhanced light absorption by mixed source black and brown carbon particles in UK winter, Nat. Commun., 6, 8435, https://doi.org/10.1038/ncomms9435, 2015.
Lohmann, U., Friebel, F., Kanji, Z. A., Mahrt, F., Mensah, A. A., and Neubauer, D.: Future warming exacerbated by aged-soot effect on cloud formation, Nat. Geosci., 13, 674–680, https://doi.org/10.1038/s41561-020-0631-0, 2020.
Luoma, K., Niemi, J. V., Aurela, M., Fung, P. L., Helin, A., Hussein, T., Kangas, L., Kousa, A., Rönkkö, T., Timonen, H., Virkkula, A., and Petäjä, T.: Spatiotemporal variation and trends in equivalent black carbon in the Helsinki metropolitan area in Finland, Atmos. Chem. Phys., 21, 1173–1189, https://doi.org/10.5194/acp-21-1173-2021, 2021.
Matsui, H., Hamilton, D. S., and Mahowald, N. M.: Black carbon radiative effects highly sensitive to emitted particle size when resolving mixing-state diversity, Nat. Commun., 9, 1–11, https://doi.org/10.1038/s41467-018-05635-1, 2018.
Michelsen, H. A.: Probing soot formation, chemical and physical evolution, and oxidation: A review of in situ diagnostic techniques and needs, Proceedings of the Combustion Institute, Vol. 36, 717–735, https://doi.org/10.1016/j.proci.2016.08.027, 2017.
Modini, R. L., Corbin, J. C., Brem, B. T., Irwin, M., Bertò, M., Pileci, R. E., Fetfatzis, P., Eleftheriadis, K., Henzing, B., Moerman, M. M., Liu, F., Müller, T., and Gysel-Beer, M.: Detailed characterization of the CAPS single-scattering albedo monitor (CAPS PMssa) as a field-deployable instrument for measuring aerosol light absorption with the extinction-minus-scattering method, Atmos. Meas. Tech., 14, 819–851, https://doi.org/10.5194/amt-14-819-2021, 2021.
Moosmüller, H. and Arnott, W. P.: Folded Jamin interferometer: a stable instrument for refractive-index measurements, Opt. Lett., 21, 438, https://doi.org/10.1364/OL.21.000438, 1996.
Ning, Z., Chan, K. L., Wong, K. C., Westerdahl, D., Močnik, G., Zhou, J. H., and Cheung, C. S.: Black carbon mass size distributions of diesel exhaust and urban aerosols measured using differential mobility analyzer in tandem with Aethalometer, Atmos. Environ., 80, 31–40, https://doi.org/10.1016/j.atmosenv.2013.07.037, 2013.
Onasch, T. B., Trimborn, A., Fortner, E. C., Jayne, J. T., Kok, G. L., Williams, L. R., Davidovits, P., and Worsnop, D. R.: Soot particle aerosol mass spectrometer: Development, validation, and initial application, Aerosol Sci. Technol., 46, 804–817, https://doi.org/10.1080/02786826.2012.663948, 2012.
Peltola, J., Hieta, T., and Vainio, M.: Parts-per-trillion-level detection of nitrogen dioxide by cantilever-enhanced photo-acoustic spectroscopy, Opt. Lett., 40, 2933, https://doi.org/10.1364/ol.40.002933, 2015.
Peng, J., Hu, M., Guo, S., Du, Z., Zheng, J., Shang, D., Zamora, M. L., Zeng, L., Shao, M., Wu, Y. S., Zheng, J., Wang, Y., Glen, C. R., Collins, D. R., Molina, M. J., and Zhang, R.: Markedly enhanced absorption and direct radiative forcing of black carbon under polluted urban environments, P. Natl. Acad. Sci. USA, 113, 4266–4271, https://doi.org/10.1073/pnas.1602310113, 2016.
Petzold, A., Schloesser, H., Sheridan, P. J., Arnott, W. P., Ogren, J. A., and Virkkula, A.: Evaluation of multiangle absorption photometry for measuring aerosol light absorption, Aerosol Sci. Technol., 39, 40–51, https://doi.org/10.1080/027868290901945, 2005.
Qian, Y., Yasunari, T. J., Doherty, S. J., Flanner, M. G., Lau, W. K. M., Ming, J., Wang, H., Wang, M., Warren, S. G., and Zhang, R.: Light-absorbing particles in snow and ice: Measurement and modeling of climatic and hydrological impact, Adv. Atmos. Sci., 32, 64–91, https://doi.org/10.1007/s00376-014-0010-0, 2015.
Romshoo, B., Müller, T., Pfeifer, S., Saturno, J., Nowak, A., Ciupek, K., Quincey, P., and Wiedensohler, A.: Optical properties of coated black carbon aggregates: numerical simulations, radiative forcing estimates, and size-resolved parameterization scheme, Atmos. Chem. Phys., 21, 12989–13010, https://doi.org/10.5194/acp-21-12989-2021, 2021.
Schwarz, J. P., Gao, R. S., Fahey, D. W., Thomson, D. S., Watts, L. A., Wilson, J. C., Reeves, J. M., Darbeheshti, M., Baumgardner, D. G., Kok, G. L., Chung, S. H., Schulz, M., Hendricks, J., Lauer, A., Kärcher, B., Slowik, J. G., Rosenlof, K. H., Thompson, T. L., Langford, A. O., Loewenstein, M., and Aikin, K. C.: Single-particle measurements of midlatitude black carbon and light-scattering aerosols from the boundary layer to the lower stratosphere, J. Geophys. Res.-Atmos., 111, 1–15, https://doi.org/10.1029/2006JD007076, 2006.
Sedlacek, A. and Lee, J.: Photothermal interferometric aerosol absorption spectrometry, Aerosol Sci. Technol., 41, 1089–1101, https://doi.org/10.1080/02786820701697812, 2007.
Singh, S., Fiddler, M. N., Smith, D., and Bililign, S.: Error analysis and uncertainty in the determination of aerosol optical properties using cavity ring-down spectroscopy, integrating nephelometry, and the extinction-minus-scattering method, Aerosol Sci. Technol., 48, 1345–1359, https://doi.org/10.1080/02786826.2014.984062, 2014.
Sipkens, T. A., Boies, A., Corbin, J. C., Chakrabarty, R. K., Olfert, J., and Rogak, S. N.: Overview of methods to characterize the mass, size, and morphology of soot, J. Aerosol Sci., 173, 106211, https://doi.org/10.1016/j.jaerosci.2023.106211, 2023.
Slowik, J. G., Cross, E. S., Han, J. H., Davidovits, P., Onasch, T. B., Jayne, J. T., Williams, L. R., Canagaratna, M. R., Worsnop, D. R., Chakrabarty, R. K., Moosmüller, H., Arnott, W. P., Schwarz, J. P., Gao, R. S., Fahey, D. W., Kok, G. L., and Petzold, A.: An Inter-Comparison of Instruments Measuring Black Carbon Content of Soot Particles, Aerosol Sci. Technol., 41, 295–314, https://doi.org/10.1080/02786820701197078, 2007a.
Slowik, J. G., Cross, E. S., Han, J. H., Kolucki, J., Davidovits, P., Williams, L. R., Onasch, T. B., Jayne, J. T., Kolb, C. E., and Worsnop, D. R.: Measurements of morphology changes of fractal soot particles using coating and denuding experiments: Implications for optical absorption and atmospheric lifetime, Aerosol Sci. Technol., 41, 734–750, https://doi.org/10.1080/02786820701432632, 2007b.
Stabile, L., Fuoco, F. C., and Buonanno, G.: Characteristics of particles and black carbon emitted by combustion of incenses, candles and anti-mosquito products, Build. Environ., 56, 184–191, https://doi.org/10.1016/j.buildenv.2012.03.005, 2012.
Stephens, M., Turner, N., and Sandberg, J.: Particle identification by laser-induced incandescence in a solid-state laser cavity, Appl. Opt., 42, 3726, https://doi.org/10.1364/ao.42.003726, 2003.
Tunved, P., Cremer, R. S., Zieger, P., and Ström, J.: Using correlations between observed equivalent black carbon and aerosol size distribution to derive size resolved BC mass concentration: a method applied on long-term observations performed at Zeppelin station, Ny-Ålesund, Svalbard, Tellus B, 73, 1–17, https://doi.org/10.1080/16000889.2021.1933775, 2021.
Virkkula, A., Mäkelä, T., Hillamo, R., Yli-Tuomi, T., Hirsikko, A., Hämeri, K., and Koponen, I. K.: A simple procedure for correcting loading effects of aethalometer data, J. Air Waste Manag. Assoc., 57, 1214–1222, https://doi.org/10.3155/1047-3289.57.10.1214, 2007.
Visser, B., Röhrbein, J., Steigmeier, P., Drinovec, L., Močnik, G., and Weingartner, E.: A single-beam photothermal interferometer for in situ measurements of aerosol light absorption, Atmos. Meas. Tech., 13, 7097–7111, https://doi.org/10.5194/amt-13-7097-2020, 2020.
Wiedensohler, A.: An approximation of the bipolar charge distribution for particles in the submicron size range, J. Aerosol Sci., 19, 387–389, https://doi.org/10.1016/0021-8502(88)90278-9, 1988.
Wu, C., Wang, G., Li, J., Li, J., Cao, C., Ge, S., Xie, Y., Chen, J., Li, X., Xue, G., Wang, X., Zhao, Z., and Cao, F.: The characteristics of atmospheric brown carbon in Xi'an, inland China: sources, size distributions and optical properties, Atmos. Chem. Phys., 20, 2017–2030, https://doi.org/10.5194/acp-20-2017-2020, 2020.
Wu, Y., Cheng, T., Liu, D., Allan, J. D., Zheng, L., and Chen, H.: Light Absorption Enhancement of Black Carbon Aerosol Constrained by Particle Morphology, Environ. Sci. Technol., 52, 6912–6919, https://doi.org/10.1021/acs.est.8b00636, 2018.
Xu, Y. and Ramanathan, V.: Well below 2 °C: Mitigation strategies for avoiding dangerous to catastrophic climate changes, P. Natl. Acad. Sci. USA, 114, 10315–10323, https://doi.org/10.1073/pnas.1618481114, 2017.
Zhang, R., Khalizov, A. F., Pagels, J., Zhang, D., Xue, H., and McMurry, P. H.: Variability in morphology, hygroscopicity, and optical properties of soot aerosols during atmospheric processing, P. Natl. Acad. Sci. USA, 105, 10291–10296, https://doi.org/10.1073/pnas.0804860105, 2008.
Zhao, G., Tao, J., Kuang, Y., Shen, C., Yu, Y., and Zhao, C.: Role of black carbon mass size distribution in the direct aerosol radiative forcing, Atmos. Chem. Phys., 19, 13175–13188, https://doi.org/10.5194/acp-19-13175-2019, 2019.
Zhao, W., Zhao, G., Li, Y., Guo, S., Ma, N., Tang, L., Zhang, Z., and Zhao, C.: New method to determine black carbon mass size distribution, Atmos. Meas. Tech., 15, 6807–6817, https://doi.org/10.5194/amt-15-6807-2022, 2022.


