the Creative Commons Attribution 4.0 License.
the Creative Commons Attribution 4.0 License.
 | 28 Feb 2025
Field-deployable cantilever-enhanced photoacoustic instrument for aerosol light absorption measurement at three wavelengths
Juho Karhu
Tommi Mikkonen
Joel Kuula
Aki Virkkula
Erkki Ikonen
Markku Vainio
Hilkka Timonen
Tuomas Hieta
We demonstrate a measurement of aerosol absorption at three wavelengths for particles below 1 µm in diameter using a highly sensitive photoacoustic spectrometer. The acoustic signal is detected with a cantilever microphone, which allows for sensitive detection without the need to apply acoustic resonance to enhance the signal. The lack of resonator makes the instrument compact and well suited for field measurements. A field instrument employing the method was developed and deployed for black carbon monitoring at an air quality measurement station. The method shows excellent sensitivity for in situ aerosol absorption measurement, with detection limits of 0.016, 0.025 and 0.041 Mm−1, for simultaneous measurements at the wavelengths of 445, 520 and 638 nm, respectively, using a 1 h averaging time. The black carbon concentration measured with the new instrument is compared against filter-based photometers operating at the site, showing high correlation.
- Article
(2857 KB) - Full-text XML
- BibTeX
- EndNote


Black carbon (BC) refers to aerosols composed mainly of elemental carbon, which strongly absorbs light throughout the electromagnetic spectrum. It is generated and released into the atmosphere in incomplete combustion processes. Contrary to most aerosols, which typically have a cooling effect on climate through scattering of sunlight, BC has a warming impact due to high absorption (Bond et al., 2013). As aerosols generally have shorter atmospheric lifetimes, typically days or weeks, compared to many greenhouse gases, controlling BC release into the atmosphere presents a compelling possibility to combat warming of the climate at relatively short timescales (Xu and Ramanathan, 2017). In addition to climate effects, increased BC concentration has a negative health impact, particularly on the respiratory system. It has been suggested that BC concentration may be an especially good indicator for degraded air quality (Achilleos et al., 2017).
There has recently been increasing interest in improving the quality and coverage of atmospheric BC measurements. There are ongoing efforts by international organizations to establish initiatives to reduce BC emissions, but these are complicated by the lack of standardization of BC measurement methods (Lack et al., 2014; Timonen et al., 2019). Currently, the most common methods for real-time monitoring of BC are filter-based photometers, where the air sample is continuously drawn through a porous filter and the optical transmission through the filter is monitored over time. As the strongly absorbing BC particles are accumulating on the filter, the decrease in transmission can be related to the BC concentration in the sample flow. These methods are widely used for BC monitoring, but they have major issues arising from the optical properties of the filter material affecting the measurement results (Virkkula et al., 2007). These effects are countered with various correction schemes, but there is significant uncertainty related to the different correction methods and the parameters used in the corrections (Luoma et al., 2021; Savadkoohi et al., 2024).
Methods based on photoacoustic and photothermal effects offer compelling alternatives for BC monitoring, as the absorption measurement is performed directly in the aerosol phase (Moosmüller et al., 1997). These methods are based on the heat released into the surrounding gas, after the BC particles absorb radiation. In photothermal interferometry, the temperature change is recorded as a change in the refractive index (Drinovec et al., 2022), while in photoacoustic spectroscopy, a microphone records the pressure increase resulting from the temperature rise (Petzold and Niessner, 1995). Typically, these methods require bulky instruments to reach high sensitivity: for photothermal interferometry, mechanical stability of the instrument must be especially good for the sensitive interferometric measurement, and photoacoustic instruments typically make use of an acoustic resonance to reach sufficient sensitivity, but acoustic frequencies require relatively long resonators. The bulky size and the use of a resonance, which can be sensitive to environmental conditions, are challenges for the development of sensitive field-deployable photoacoustic instruments. However, there have been several field measurement demonstrations, reaching typically single-digit Mm−1 sensitivity (Arnott et al., 2003; Lack et al., 2012; Linke et al., 2016). A recent article reported a four-wavelength photoacoustic instrument operated at a remote monitoring station, reaching a detection limit of approximately 0.1 Mm−1, with an averaging time of half an hour (Schnaiter et al., 2023).
We previously demonstrated the application of cantilever-enhanced photoacoustic spectroscopy (CEPAS) for aerosol measurements (Karhu et al., 2021). CEPAS does not make use of acoustic resonances. Instead, high sensitivity is reached using an optically read cantilever microphone to record the acoustic signal (Kauppinen et al., 2004). The lack of a resonator allows for a compact measurement setup and makes the system particularly suitable for multiwavelength operation: lasers operating at different wavelengths can be multiplexed to different modulation frequencies freely within the bandwidth of the cantilever microphone. Different wavelength channels can then be measured simultaneously by calculating the Fourier transform of the microphone signal to retrieve its acoustic spectrum. In photoacoustic instruments employing a resonator, the different channels must be recorded sequentially or fitted within the frequency span of the resonance peak, which may be limited and sensitive to environmental conditions.
Our previous CEPAS demonstration operated within laboratory conditions using a single wavelength at 532 nm, reaching a noise level of 0.013 Mm−1 with a 20 s measurement time (Karhu et al., 2021). Here we have extended the measurement to three wavelengths over the visible range, packed the measurement setup into a portable instrument suitable for on-site field measurements outside the laboratory and show its applicability for the first time in field conditions. In the article, we describe the new instrument and evaluate its noise level and stability. We show its capability to monitor absorption at three wavelengths with high sensitivity when operated at an air quality measurement station in Helsinki, Finland. Furthermore, we demonstrate that the BC concentration measured with the instruments compares well against two reference BC instruments operating at the station. We also show that the new instrument can be simultaneously applied for sensitive detection of NO2.
The cantilever-enhanced photoacoustic detector for single-wavelength operation has been described previously in Karhu et al. (2021). The new field-deployable setup with three wavelength channels and revised sampling system is presented in Fig. 1. The photoacoustic cell is based on the cell from a PA201 gas analyzer (Gasera). It is 10 cm long and 4 mm in diameter. The cell is made of aluminum and coated with nickel. The cell is originally intended for trace gas measurements, so the original valves, which were tested to have relatively high particle losses due to small-diameter lines and sharp turns, are replaced with solenoid valves designed for high flow rates (LHD, The Lee Company). The end windows are fused silica planar windows with a coating that is antireflective over the visible wavelengths, as well as hydrophobic and oleophobic (hydrophobic windows, Edmund Optics). The light source is an RGB laser module (Micro RGB module, OptLasers), where the output consists of three superimposed beams from multimode diode lasers emitting at 638, 520 and 445 nm. Going forward, we will refer to the signals measured with the different lasers as the red (638 nm), green (520 nm) and blue (445 nm) channels. The maximum total optical power from the laser module is 6 W, but the total power used in the experiments was kept substantially lower for better stability and easier thermal management. Each laser diode is connected to a common baseplate, which is cooled with a thermoelectric cooler. The beam is directed through an iris and focused on the middle of the photoacoustic cell. The photoacoustic signal is recorded with an optically read cantilever microphone located in the middle of the cell. Changes in the optical powers are monitored after the cell with a silicon photodiode. The beam after the cell is sampled with a fused silica plate and then further attenuated with a neutral density filter before reaching the photodiode. The photodiode was only used to track changes in the optical power, and the initial power at each wavelength was measured with a thermal power meter (PM160T, Thorlabs) during calibration. The initial powers, as measured after the photoacoustic cell, were 129, 211 and 301 mW for the red, green and blue channels, respectively.
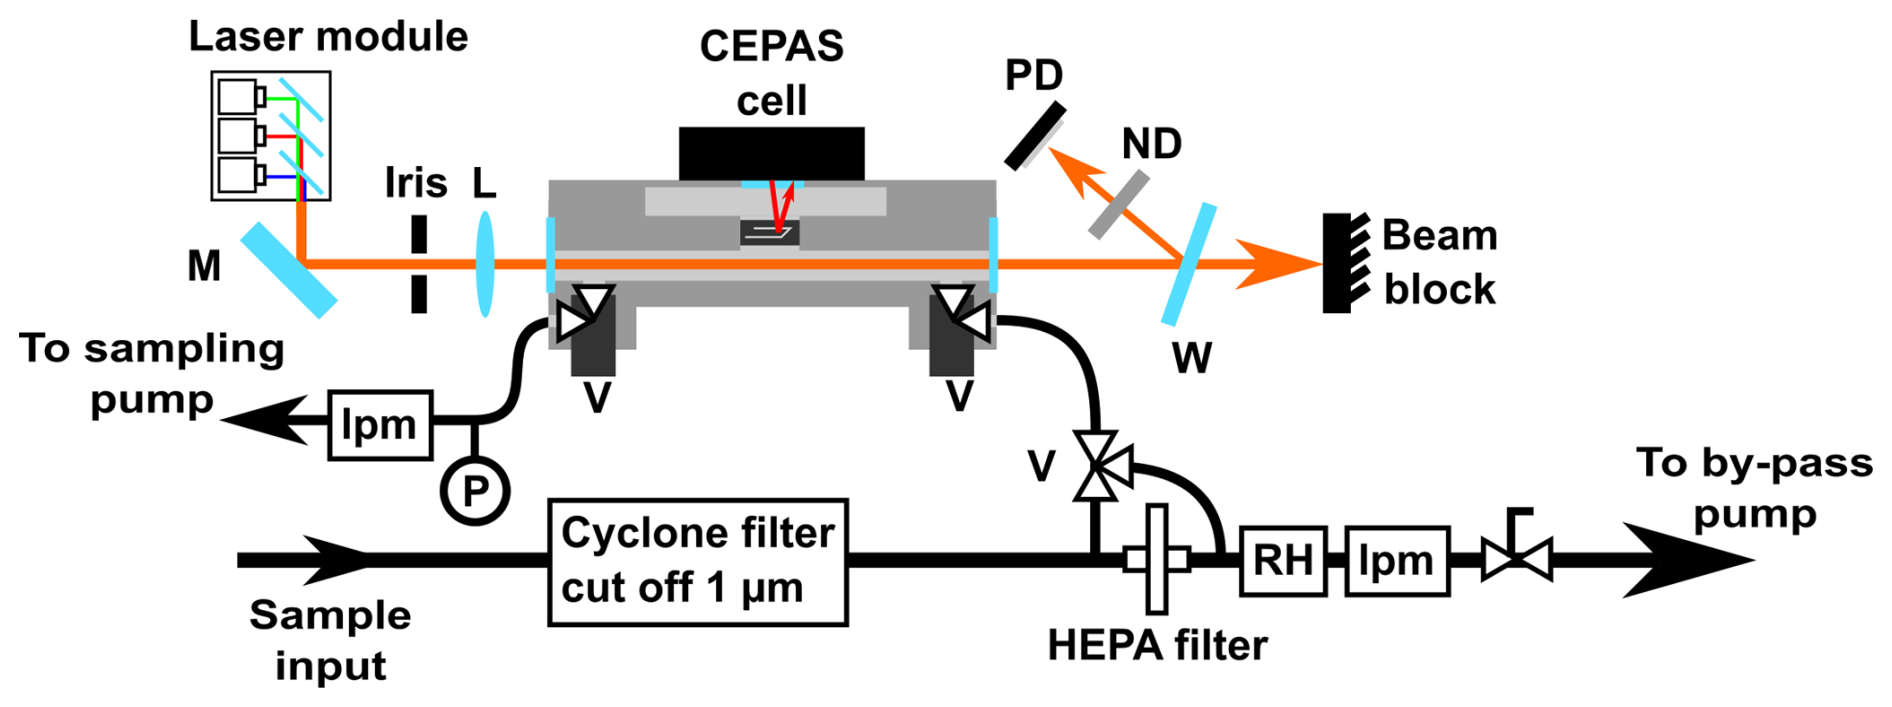
Figure 1Schematic diagram of the three-wavelength CEPAS instrument. The superimposed beams from the laser module are directed through the CEPAS cell with a mirror (M) and a lens (L). After the cell, the optical power is monitored by sampling the beam with a wedged optical window (W) and attenuating the sampled beam with a neutral density filter (ND) before it is incident on a silicon photodiode (PD). There is a constant bypass flow through the instrument, from which the sample is drawn to the CEPAS cell either before (sample measurement) or after (background measurement) a high-efficiency particulate air (HEPA) filter. The gas flow is controlled with solenoid valves (V). Flow sensors (lpm) monitor the bypass and sampling flow rates, and the humidity of the bypass flow is also measured (RH). The sample pressure (P) is recorded from the sampling line after the CEPAS cell.
The power of each laser diode can be modulated individually with an analog signal fed to the laser driver. We used square waves with frequencies of 60, 70 and 80 Hz for the modulation of red, green and blue channels, respectively. The duty cycle of the modulation was 50 % for all the channels. The bandwidth of the cantilever microphone used here was up to approximately 700 Hz. The modulation frequencies were chosen from a range where the microphone noise spectrum was free of any obvious noise peaks arising from external noise sources. The channels were measured simultaneously by taking a 1.5 s block of the microphone signal and calculating its Fourier transform. The height of the peak in the spectrum at each modulation frequency was taken as the signal for that channel. The optical power of the individual channels was monitored the same way but using the photodiode signal.
The CEPAS device was calibrated using known absorption cross section of NO2 at each wavelength. The calibration procedure is described in more detail in Appendix A. It should be noted that, while NO2 calibration is widely used in photoacoustic black carbon measurements, it has several limitations. For example, the low absorption cross section at longer wavelengths affects calibration of the red channel specifically, and uncertainty in laser wavelengths causes uncertainty in converting the NO2 absorption cross section to absorption value for each channel. Calibration based on dye particles (Foster et al., 2019) or a simultaneous extinction measurement could help improve accuracy of the results (Arnott et al., 2000).
The CEPAS cell must be closed during the measurement, so the sampling is done in a sample-and-hold configuration. The sample is periodically drawn into the CEPAS cell from a bypass flow with a flow rate 2 L min−1, as monitored with a flow meter (D6F, Omron). During the sample exchange, the flow through the CEPAS cell is approximately 0.5 L min−1, which was also monitored with a second flow meter (D6F, Omron). Each sample is measured for 15 s. The total measurement cycle, including the sample exchange, takes approximately 20 s. The humidity of the bypass flow is measured with a humidity sensor (ChipCap 2, Amphenol Telaire). The final measurement pressure inside the CEPAS cell is close to atmospheric pressure, and it is recorded with a pressure sensor, just before closing the cell valves. The CEPAS cell temperature is slightly elevated with resistive heating to 45 °C. This is mostly to decrease relative humidity inside the cell to ensure no water condensation can take place, although in these experiments all the samples have low humidity to begin with. The microphone signal and pressure reading are digitized by electronics included in the original PA201 gas analyzer and read to a PC via USB. All other sensors are digitized with a data acquisition card (USB-6351, NI), which is also used to generate control signals for the laser and the gas exchange system. Control and data processing on the PC is done via a custom LabVIEW program.
The input of the bypass flow has a cyclone filter with a cutoff diameter of 1 µm for particles. After five measurement cycles, two particle-free samples are taken from the same bypass line, but after a HEPA filter, to record any changes in the background level. It should be noted that the background level includes any gaseous absorption in addition to the absorption signal arising from windows or light hitting the walls of the CEPAS cell. The background signal is linearly interpolated between the background measurements and subtracted from the normal signal measurements.
The device and accompanying electronics are packed into a field prototype consisting of two rack enclosures. The box for the electronics is 1 rack unit (1U) high, and the other one containing the optical setup is 2U high. The stability of the device was tested with an overnight measurement of laboratory air, which was filtered through a HEPA filter. The instrument was moved to the air quality monitoring station SMEAR III in Helsinki (Järvi et al., 2009). The station is classified as an urban background station, and typical BC concentrations are relatively low, with the average BC concentration over the measurement period of approximately 200 ng m−3. The station is located at a university campus and surrounded by sparse buildings and low vegetation, with the closest major road at a distance of approximately 100 m. The sample flow drawn from the outdoor air is dried with Nafion tubing. The BC concentrations measured with CEPAS are compared against two filter-based photometers operating at the station: an Aethalometer AE33 (Aerosol Magee Scientific) and a multiangle absorption photometer (MAAP, Thermo Scientific).
3.1 Laboratory evaluation of noise and stability
The stability and sensitivity of the instrument were tested with an overnight measurement of laboratory air filtered through an external HEPA filter as a blank sample. Figure 2 shows the Allan deviation (Werle et al., 1993) calculated from the long measurement of filtered air for each wavelength. The first 2 h after the instrument was turned on were not included in the stability analysis due to the instrument warming up. The total measurement time after the warmup was 14 h. When the data were averaged over each sample exchange cycle of 20 s, the standard deviations over the whole dataset were 0.28, 0.18 and 0.19 Mm−1 for the red, green and blue channels, respectively. The time step between measurement cycles is 26 s on average, which is slightly longer than the time it takes to complete one cycle, because the background measurements are not included in the data. Each channel also showed a small negative offset (−0.12, −0.13 and −0.19 Mm−1 for the red, green and blue channels, respectively), which is most likely related to a small pressure difference between the sample and background measurement cycles, as they are sampled from different points in the bypass flow and from different sides of the HEPA filter. Overall, the Allan deviation shows good stability for the blank measurement, with all channels close to white noise averaging behavior. The noise level is higher compared to our previous laboratory demonstration (Karhu et al., 2021), by approximately 1 order of magnitude. This is largely due to lower laser power in the portable instrument, which accounts for approximately a factor of 5, but isolation of mechanical noise from the microphone is also slightly worse compared to the laboratory setup. The short-term noise is 0.58, 0.40 and 0.42 Mm−1 for the red, green and blue channels, respectively. Each point in the raw data corresponds to the signals calculated from a single 1.5 s time block used in the Fourier transforms, but the average time step for the raw data used to calculate the Allan deviation is 3.8 s. This includes all the dead time originating from sample exchange and background measurements, as well as signal processing between each measurement step. With 1 h averaging time, the Allan deviation is below 0.05 Mm−1 for all channels.
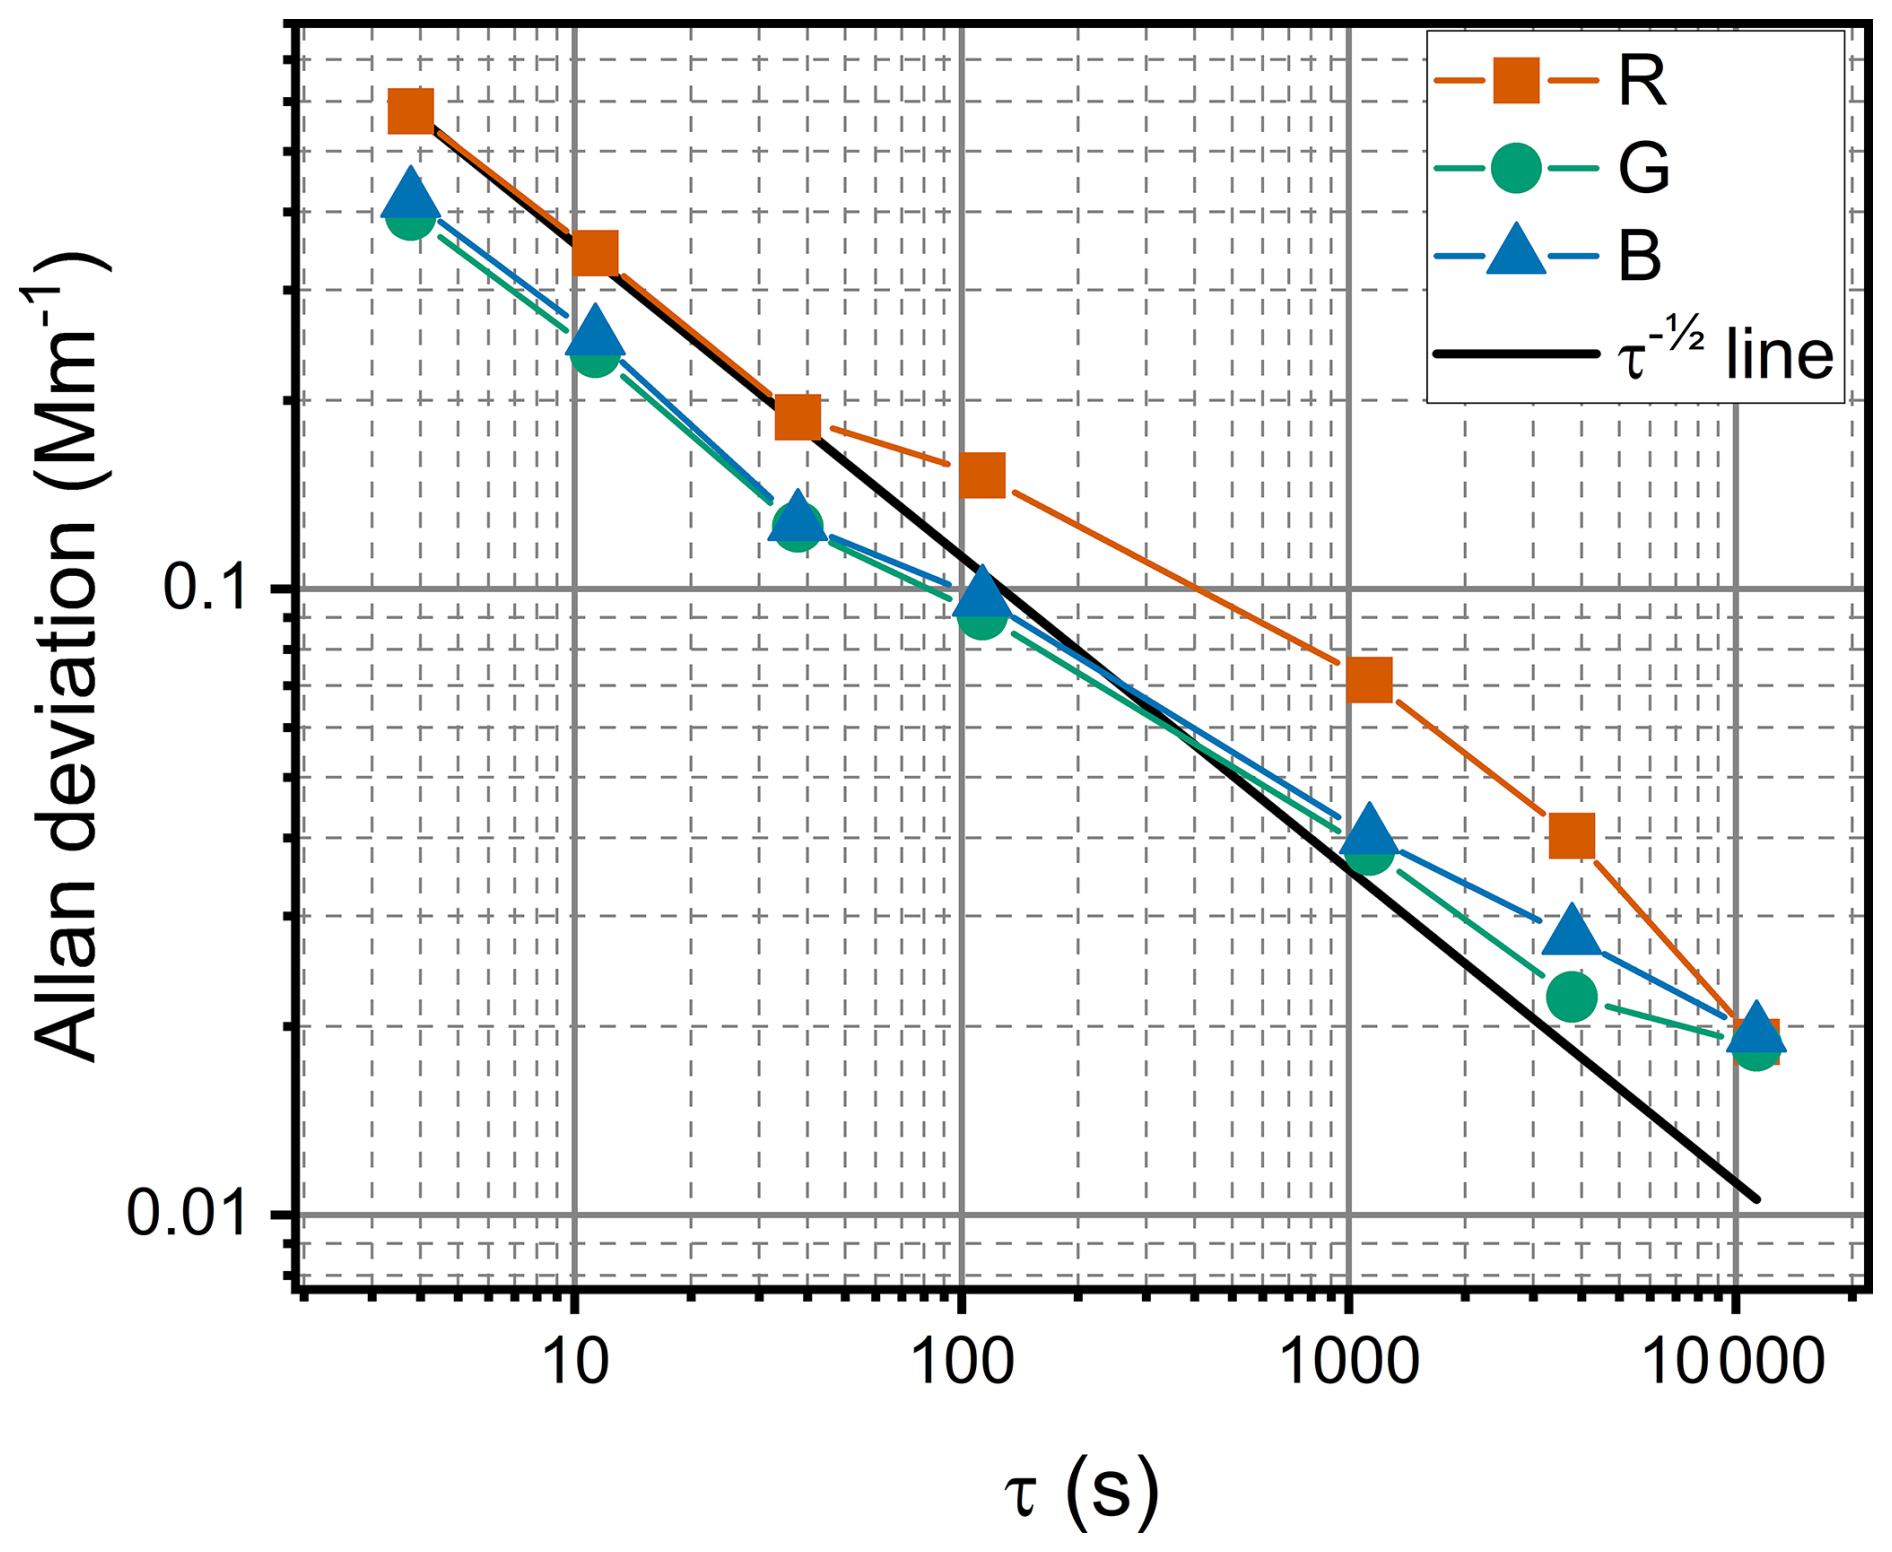
Figure 2Allan deviation of the CEPAS absorption measurement for each channel. The figure also shows a line corresponding to white noise averaging (black line), where the Allan deviation decreases as a function of the square root of the averaging time. The modulated optical average powers were 129, 211 and 301 mW for the red, green and blue channels, respectively.
3.2 Field measurement of ambient BC
Figure 3 shows the CEPAS measurement from the SMEAR III station, presented as BC concentration. The absorption values were converted to mass concentration by dividing with mass absorption cross section, using values of 6.6, 8.1 and 9.5 m2 g−1 for the red, green and blue channels, respectively. The value for the red channel is the same as that used with the MAAP at the wavelength of 637 nm, and the other two are scaled from it by assuming an absorption Ångström exponent (AAE) of 1. The CEPAS measurement was also corrected for particle losses. The particle transmission from the input of the field prototype to the output of the CEPAS cell was measured to be approximately a constant 0.7 for particles up to 500 nm (details are described in Appendix B), and the BC concentration measured with CEPAS at the air quality station was corrected by dividing the results with this transmission. The concentrations are shown as 1 h averages. The results show excellent agreement with concentrations measured with two filter-based photometers (MAAP, Thermo Scientific, and AE33, Aerosol Magee Scientific) that were operating on the station during the measurement period. Overall, the reference instruments show slightly larger concentrations compared to CEPAS, which is a typical result when comparing filter-based photometers and photoacoustic instruments (Arnott et al., 2003; Davies et al., 2019; Schnaiter et al., 2023; Zhao et al., 2020). The deviation is usually accounted for by uncertainty in the filter corrections, such as the multiple scattering correction. The two reference instruments can be seen to deviate from each other as well, but it should be noted that the values used here are direct readings from the instruments, without using any site-specific corrections, and they are used here more to illustrate the excellent correlation rather than accuracy. On several occasions, the blue and green CEPAS channels deviated from the red channel and the other instruments for short periods, appearing as sharp peaks in the data. These are mostly related to fast changes in the NO2 concentration, which the background subtraction was not fast enough to compensate for, since the background is only updated approximately every 2 min. We did not observe major variations in the ratio between the three channels throughout the measurement, suggesting no significant changes in the absorption Ångström exponent over the measurement period (see Appendix C for details).
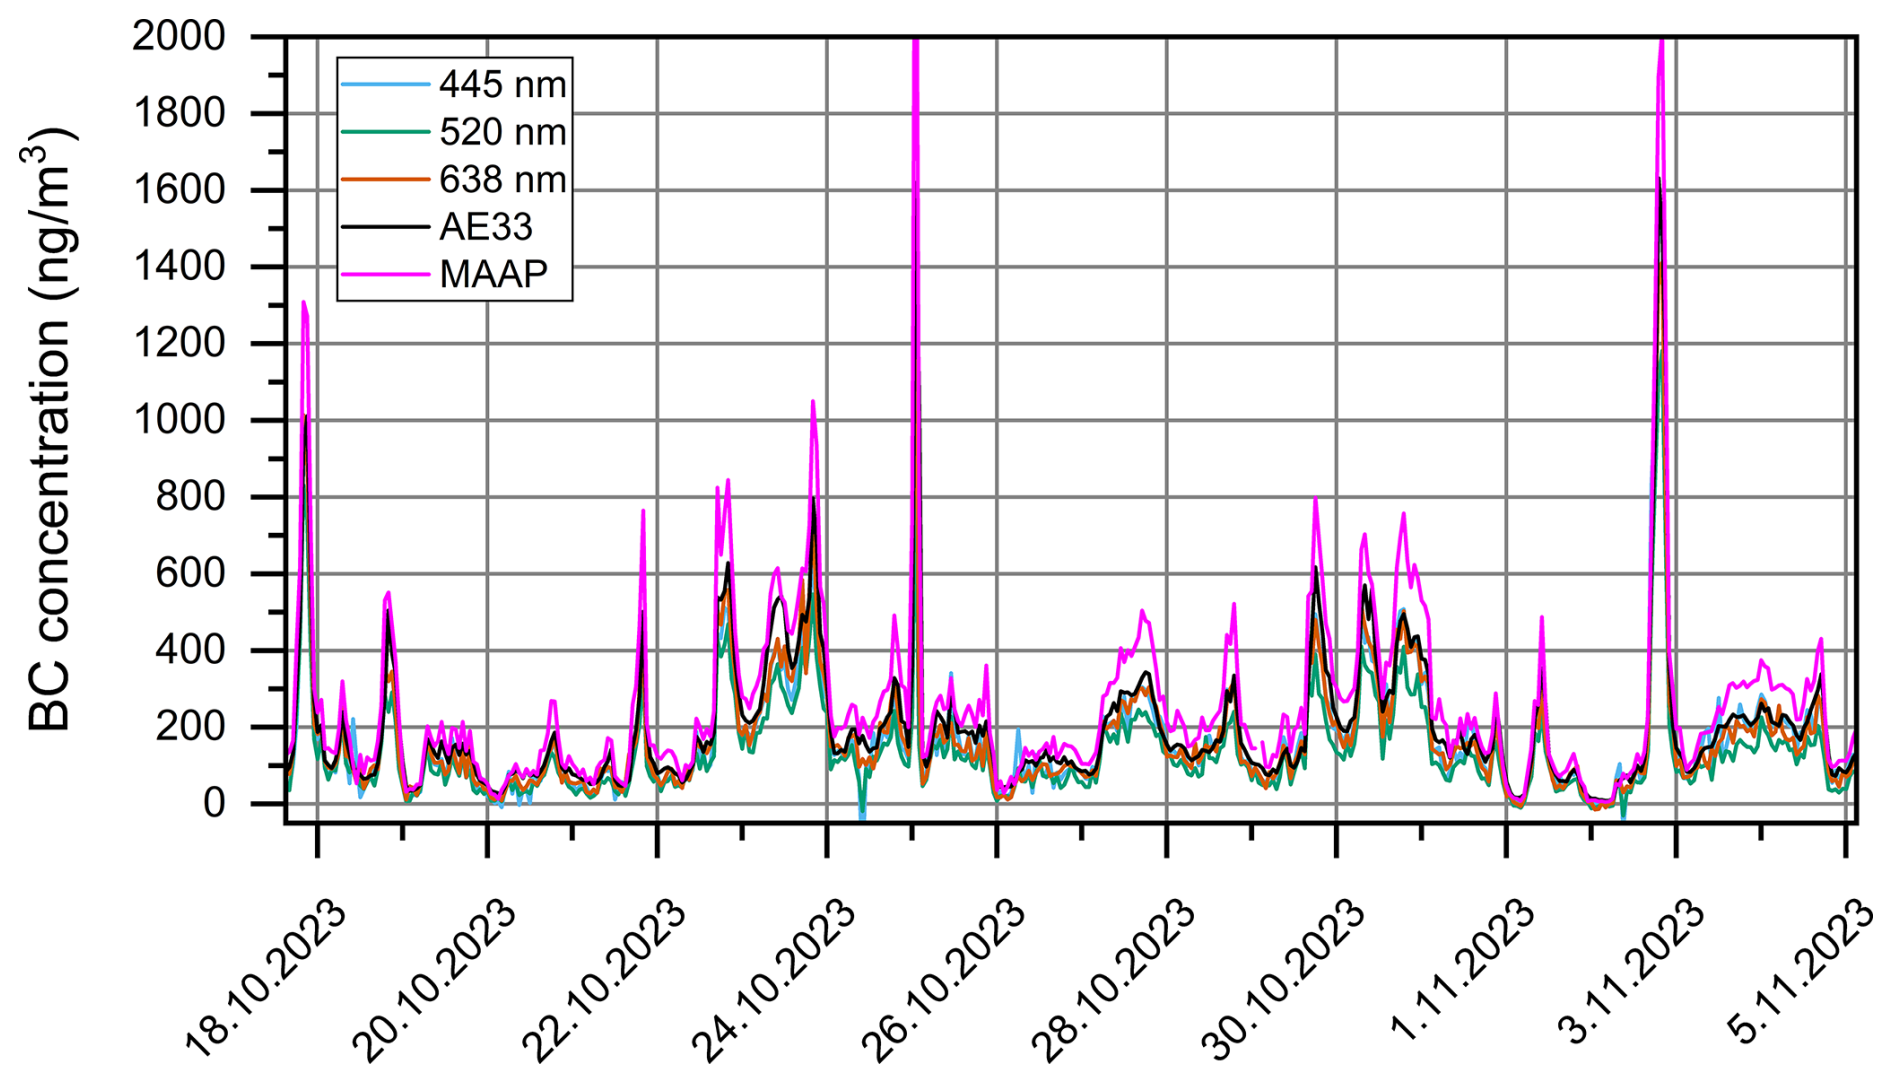
Figure 3Time trace of BC measurements at the SMEAR III station for each wavelength channel of the CEPAS instrument. The figure also shows BC concentration from two filter-based photometers (AE33 and MAAP) for comparison. The concentration for AE33 is taken from the BC6 channel, measured at 880 nm. All traces are 1 h averages.
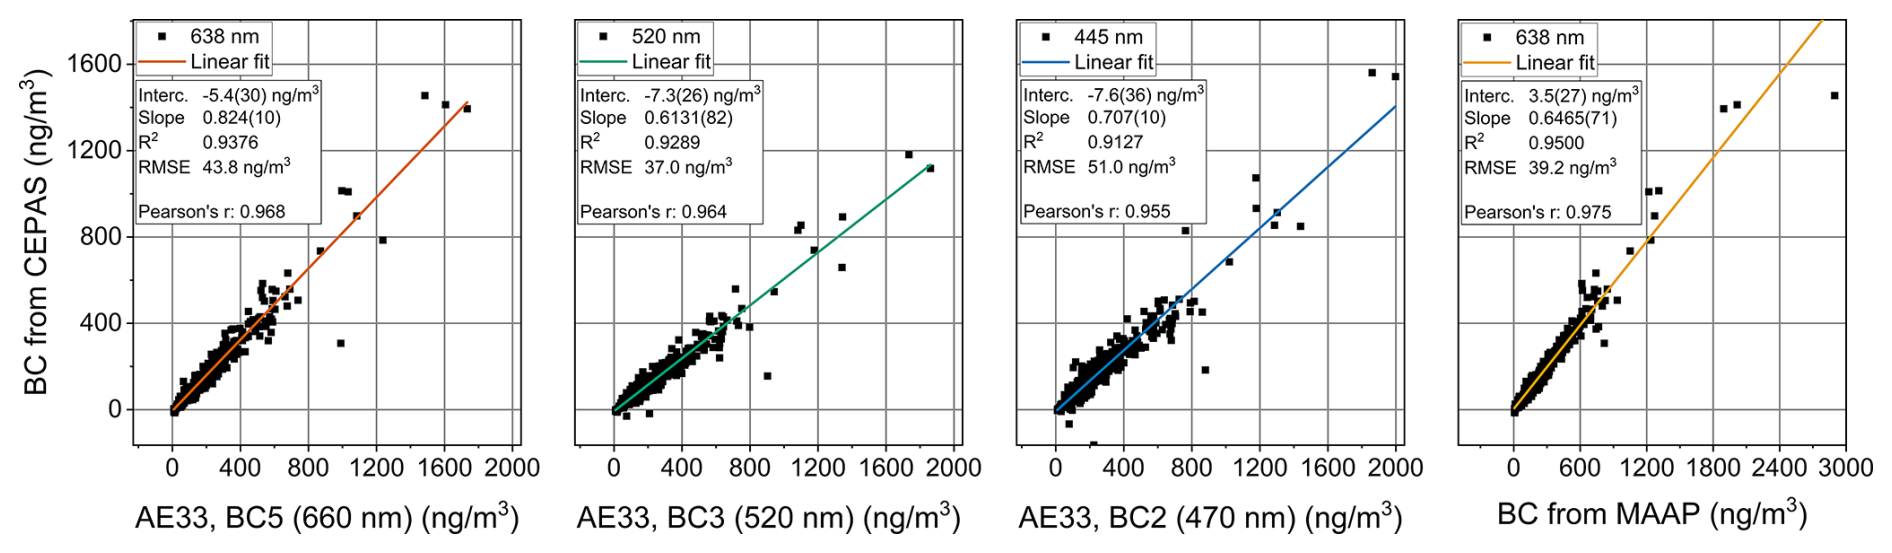
Figure 4BC concentration measured with the three CEPAS channels as a function of the concentration measured with the AE33 and MAAP filter-based photometers. The text box shows the fit parameters, with the statistical uncertainty (1σ) of the least significant digits in parentheses, as well as the coefficient of determination (R2), root-mean-square error (RMSE) of the fit, and Pearson's correlation coefficient between the datasets (Pearson's r).
Figure 4 shows the linear regressions of the 1 h averaged BC concentration measured with CEPAS against the concentration measured with the AE33 and MAAP. For this comparison, we have used the AE33 channels with wavelengths closest to each CEPAS channel. The plot for the red channel shows one clear outlier below the linear fit, with a concentration of approximately 1000 ng m−3 according to the AE33. This corresponded to the decreasing edge of the sharp peak on 25 October, which is apparent in Fig. 3. The two other channels show a few more outliers related to the NO2 interference as described above. All the outliers are included in the fits and in the statistics shown in Fig. 4. Pearson's correlation coefficients between the concentrations measured with the CEPAS and AE33 were 0.968, 0.964 and 0.955 for the CEPAS red, green and blue channels, respectively. The correlation coefficient between the concentration measured with the MAAP and with the CEPAS red channel was 0.975, showing slightly better correlation compared to the AE33 comparison. For comparison, the correlation coefficient between AE33 and MAAP data shown in Fig. 3 was 0.974. The root-mean-square errors of the fits against the AE33 data are 43.8, 37.0 and 51.0 ng m−3 for red, green and blue channels, respectively. The root-mean-square error of the fit against the MAAP measurement is 39.2 ng m−3. The difference in the slopes of the fits from the different channels suggest that there is some disagreement in the wavelength dependence of absorption between the instruments, although at least part of this could be attributed to uncertainty in the NO2 calibration of the CEPAS.
Figure 5 shows a closeup of a small part of the time trace to illustrate the agreement at both low and high concentrations. A shorter averaging period of 5 min is used here. The period from 2 November 00:00 to 06:00 LT (UTC+2) shows a BC concentration close to zero, and this could be used as a more realistic estimate for the detection limit. The average concentration over this period given by AE33 is 11 ng m−3, and the concentrations given by the CEPAS are −6.3, −5.8 and 0.0 ng m−3 according to the red, green and blue channels, respectively. The standard deviations of absorption measured with CEPAS over this period are 0.14, 0.11 and 0.11 Mm−1 for the red, green and blue channels, respectively, using 5 min averaging. With the longer 1 h averaging shown in Fig. 3, the standard deviations over the same time frame are 0.041, 0.025 and 0.016 Mm−1, which match well with the Allan deviations from Fig. 2, although it should be noted that with 1 h averaging the interval only contains six measurement points for each channel. Some of the occasional sharp outliers in Fig. 5 are due to the NO2 interference as described above, particularly when the green and blue channels can be seen to deviate from the red channel, but some of the peaks are likely erroneous readings from the microphone. These outliers were included in all the statistics described above.
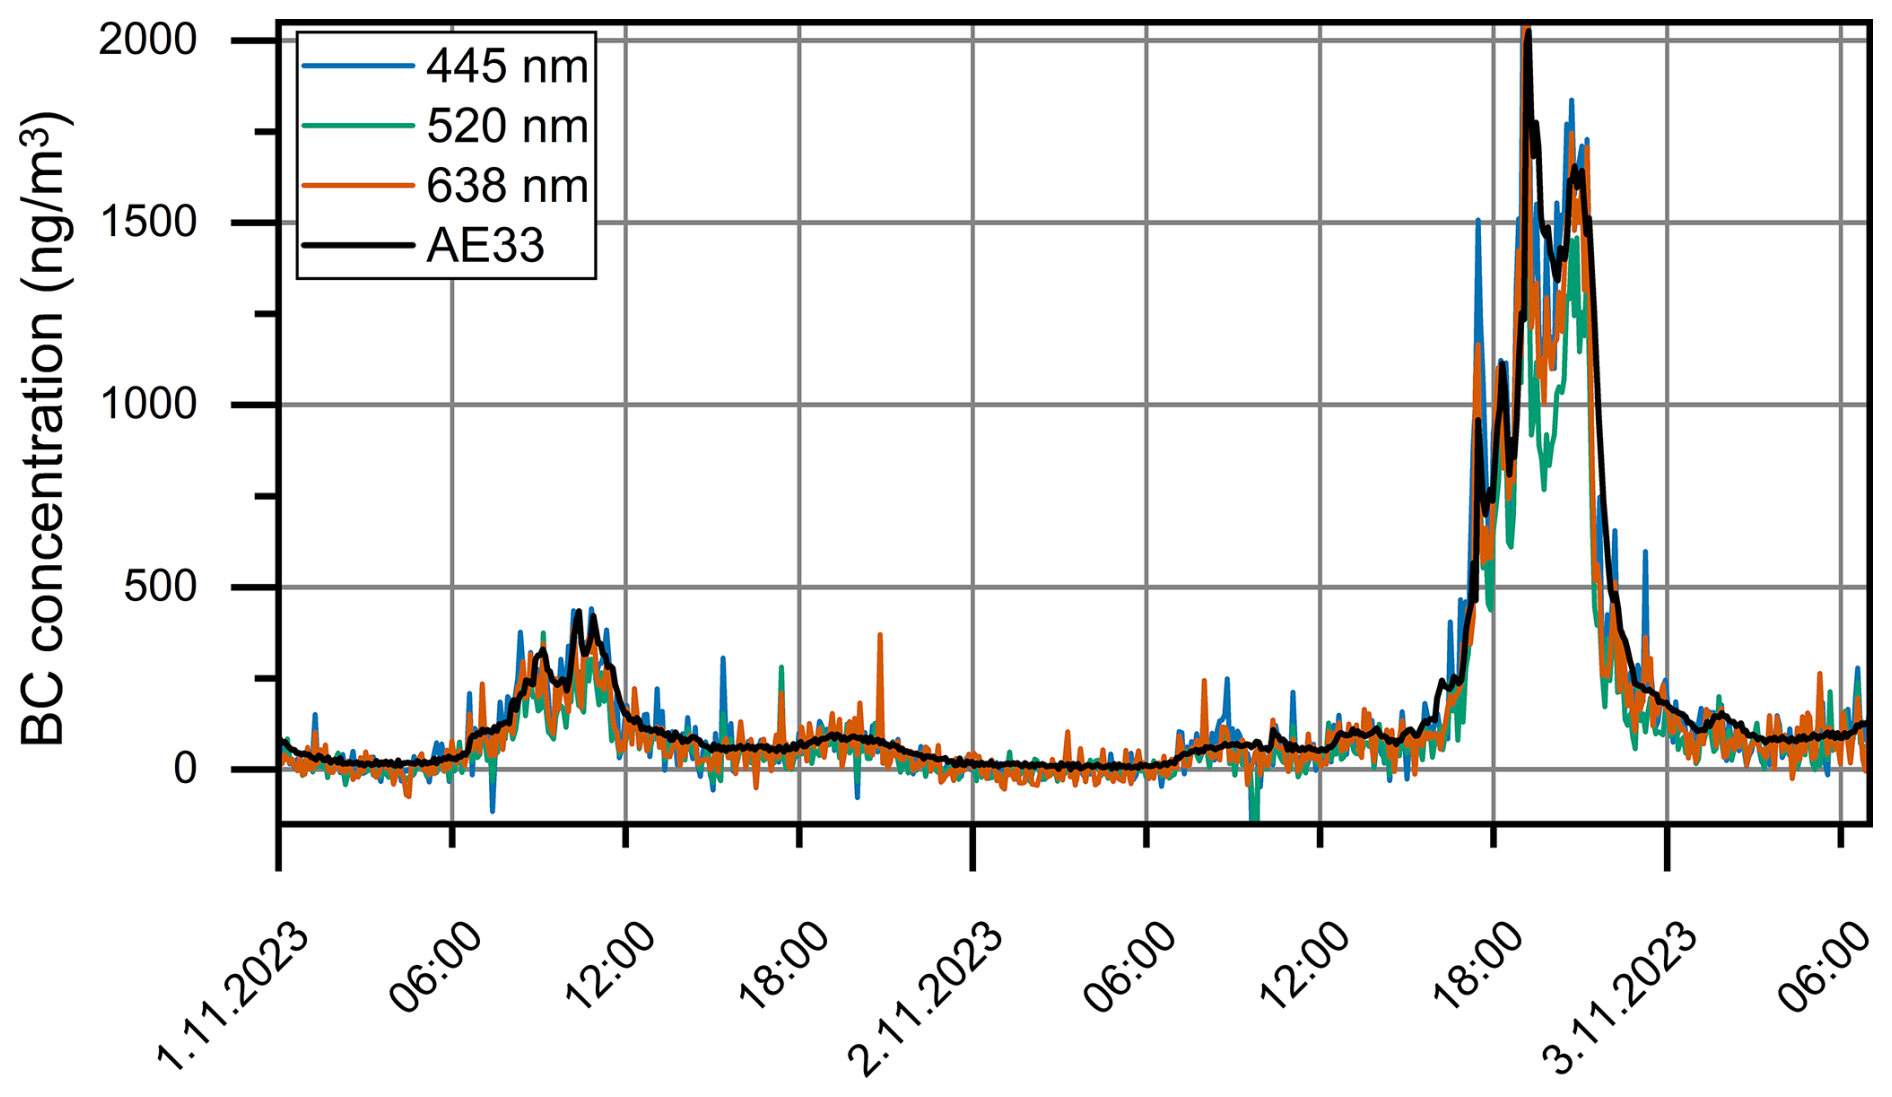
Figure 5Part of the time trace of the SMEAR III measurement with the three CEPAS channels and with the AE33 for comparison. All traces are 5 min averages.
3.3 Simultaneous NO2 concentration estimate
The background signal, which is measured after the sample flow passes through a particle filter, consists of an instrumental background, which is influenced by factors such as residual absorption by the cell windows and a gaseous absorption background due to absorption signal from atmospheric gases. The main contributor to the gaseous absorption component at the wavelengths used for the measurements is NO2. The instrumental background can change over time due to effects such as drifting of the laser alignment or accumulating of absorbing particles on the cell windows. The average drift of the instrumental background per day over the measurement period was measured to be approximately 6.5, 10 and 7.7 Mm−1 for red, green and blue channels, respectively, and it was observed to be mostly correlated between the channels. Since the NO2 absorption affects the background signals of the measurement, we can also estimate changes in the NO2 concentration during the BC measurement. At typical atmospheric concentrations, NO2 absorption at the red channel is almost negligible compared to the other two channels (Vandaele et al., 1998), so relative changes in the background signal of the three wavelengths can be used to estimate changes in the NO2 absorption. For example, for the blue channel we can write
The background signals for the red and blue channels (SR and SB, respectively) are both influenced by effects such as particles accumulating on the windows, but only SB has a significant contribution from NO2 absorption. If we approximate that the changes other than the NO2 absorption in both backgrounds are proportional to each other, we can scale the background signal of the red channel with a factor and subtract it from the other two. This effectively attempts to account for changes in the instrumental background of the blue channel, according to how the red channel background has changed. The remaining background after the red channel subtraction () is assumed to be due to NO2. This can be converted to NO2 concentration according to the NO2 calibration. A similar equation applies for the green channel but with its own factor .
The assumption that the background signals, excluding the NO2 contribution, are proportional to each other appears to hold well for several hours, but at longer timescales they start to drift apart from each other. For proper NO2 measurements, a secondary background measurement with an NO2-free sample should be performed approximately daily to adjust the scaling of the red channel subtraction. This could be achieved, for example, with bottled air or ambient air with a suitable adsorbent to remove NO2. However, here we adjusted the scaling factor afterwards, by occasionally matching the concentration reading against a reference NOx instrument operating at the station, choosing points when NO2 concentration was low and stable. The time between these points was typically 1 or 2 d. The scaling factor was adjusted at these anchor points so that the concentration given by CEPAS and the reference instrument were equal, and was then linearly interpolated between these points. Figure 6 illustrates that the changes in the NO2 concentration outside these anchor points are reproduced well with this method. In the figure, the NO2 concentration measured with CEPAS is the average of the calculations from the blue and green channels.
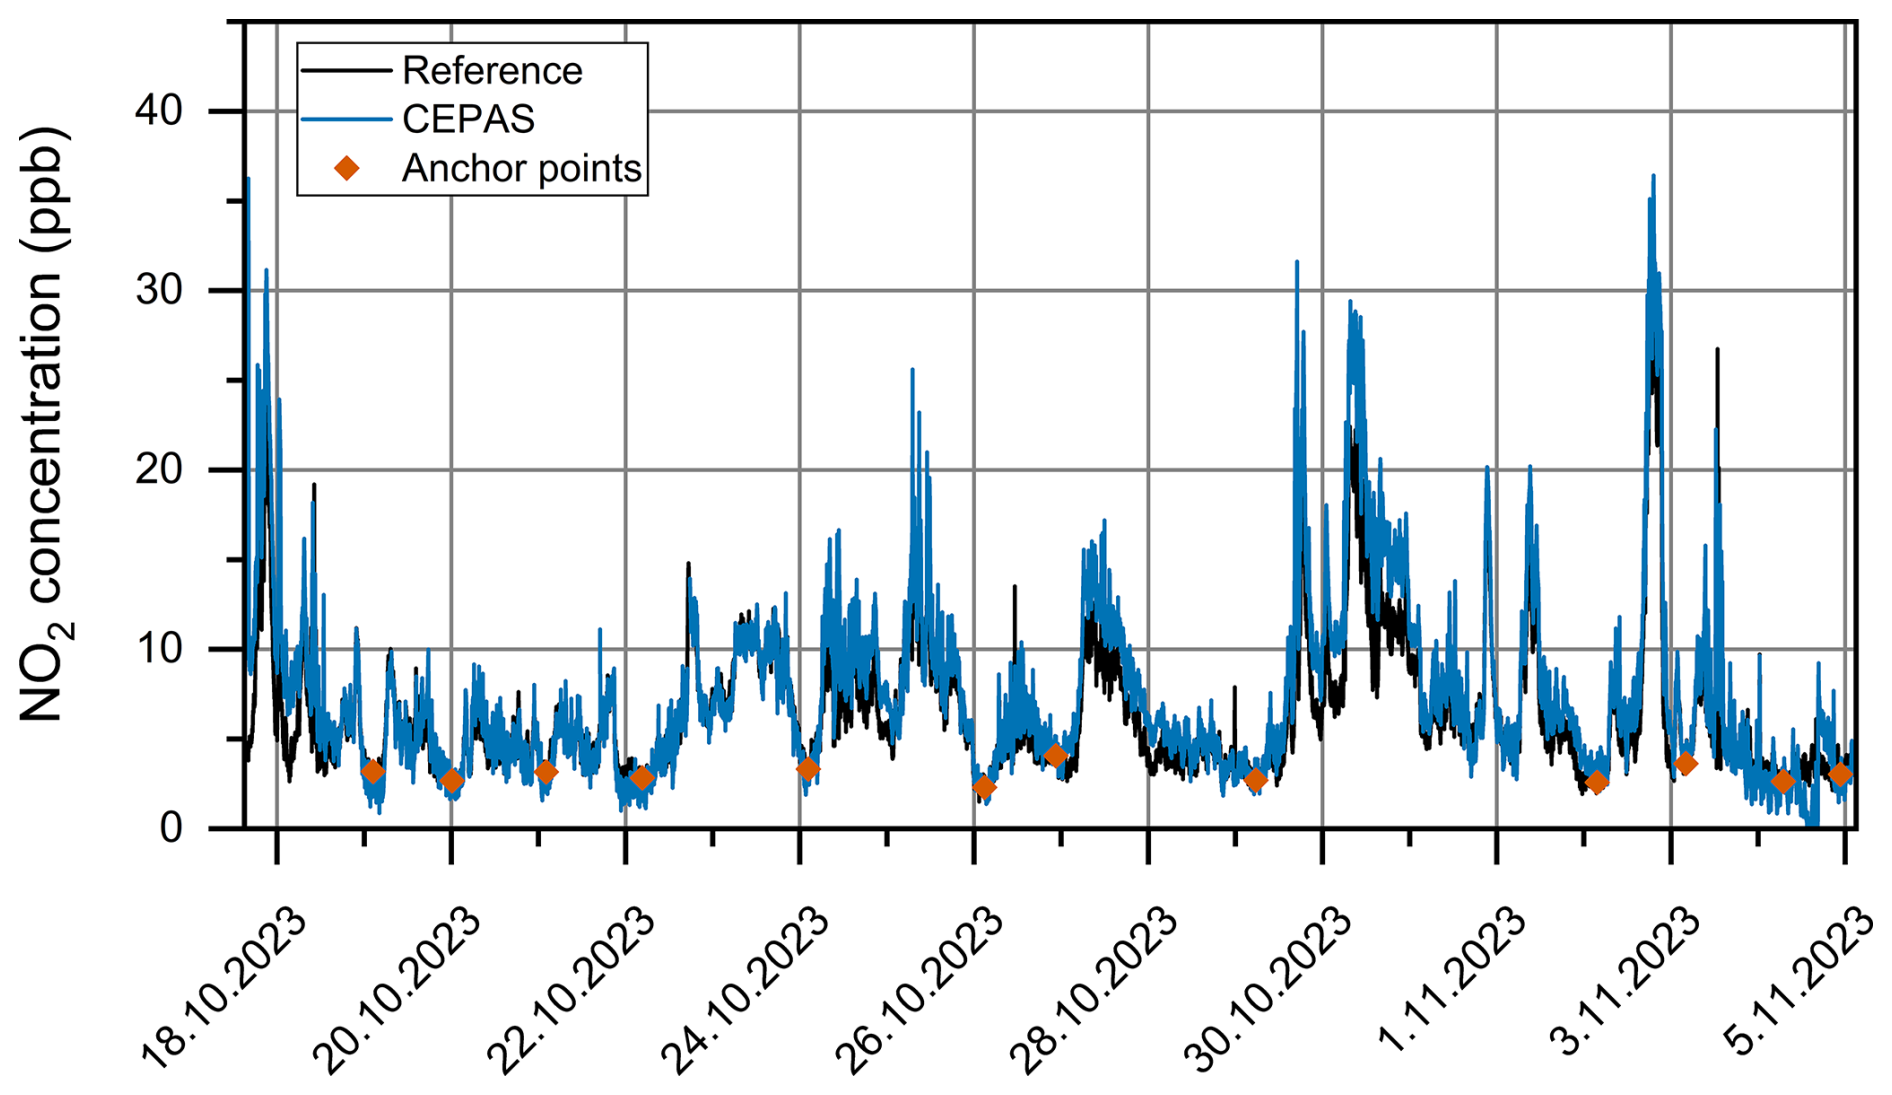
Figure 6NO2 concentration calculated from the CEPAS background signals. The NO2 concentration measured with a chemiluminescence instrument is shown for reference. To account for background drifting, the NO2 concentration measured with the two instruments was matched at the marked anchor points. Averaging time for both data is 5 min.
Our results demonstrate that CEPAS is well suited for multiwavelength measurement of aerosol absorption and performs well as a field instrument. Due to the high sensitivity of the CEPAS, we could reach detection limits of 0.016, 0.025 and 0.041 Mm−1 for absorption at wavelengths of 445, 520 and 638 nm, respectively, at 1 h averaging time, without using an acoustic resonator. The high sensitivity also allowed for simultaneous measurement of NO2 trace concentration at the parts per billion (ppb) level. The performance of the CEPAS shows particular promise towards applications where measurements of low concentrations are desired, such as clean environments and size-resolved measurements of BC, as demonstrated in a parallel study (Kuula et al., 2025).
The detection limits demonstrated here are somewhat degraded compared to our earlier laboratory demonstration (Karhu et al., 2021), mainly due to lower optical power used per laser channel. The total power of approximately 0.65 W is at a level similar to the previous demonstration, but it is now divided between the three channels. The laser power per channel was kept at a lower level mostly for easier thermal management of the enclosed portable system. The new laser is also a compact and inexpensive multimode laser module with a significantly worse beam quality compared to the single-mode laser used in the previous laboratory demonstration. The light from the beam edges coming in contact with the cell walls increases the background level, which means that the laser instability will start limiting the measurement noise at lower power. There is potential for further improvement in the detection limit by increasing the laser power, but it may require improving the thermal management of the instrument to ensure stable laser operation or changing to a more costly single-mode laser module to reduce the background level. Improving the mechanical noise isolation can also be expected to improve the sensitivity by up to a factor of 2.
Although the repeated background measurements compensate for the NO2 interference adequately, a fast change in the NO2 concentration can still occasionally produce erroneous signals between two background measurements. A potential further complication is that for several BC sources, traffic for example, NO2 concentration is likely to change simultaneously with BC, although this did not appear to be a noticeable problem in our measurement set. A straightforward improvement would be to simply measure the particle-free background more frequently. The limiting case would be to alternate between consecutive signal and background measurements, which would effectively double the response time of the instrument. Alternatively, NO2 could be removed from the sample flow using a suitable absorbent (Arnott et al., 2003). Another solution could be to use a differential measurement, where the particle sample is introduced on one side of the cantilever and a filtered, particle-free sample on the other, while both sides are illuminated with the lasers. If the absorption due to any gas species is equal on both sides, it cancels out at the microphone. Such methods have been demonstrated in gas sensing with a cantilever microphone, although in those reports the microphone is essentially used as a wavelength-specific power detector (Uotila, 2007). The issue with a direct gas measurement is that gas can flow pass the micrometer-scale gap around the cantilever, so the gas concentration will slowly equalize between the two sides of the cantilever. However, the method might be suitable for measurement of particles which are less likely to pass through the gap during a measurement, although the differential measurement would come at a significant cost of system complexity.
We have also shown that the setup can be packed into a portable instrument, and it performs well in field measurements at an air quality station. The detection limit estimated from the field measurement dataset matches well with the results from the laboratory noise test. The instrument size is already portable, at 3 rack units, and the method is well suited for further miniaturization. For example, we are using a rather bulky data acquisition card for data recording and computer control, which could be replaced with a more compact alternative. A significant advantage of the method is that, since no acoustic resonances are needed to amplify the signal, the size of the photoacoustic cell can be kept compact. The size and portability of available instruments are important factors in expanding the coverage of BC measurements in the future.
The CEPAS response must be calibrated using a sample with known absorption in the photoacoustic cell. Here, we have used NO2 gas for the calibration, which is a common option for measurements at visible wavelengths. However, it should be noted that there are several drawbacks with this calibration method. The NO2 absorption cross section is very wavelength dependent, and there are some disagreements between spectra reported in the literature. We have used a spectrum from Vandaele et al. (1998), accessed through “The MPI-Mainz UV/VIS Spectral Atlas of Gaseous Molecules of Atmospheric Interest” (Keller-Rudek et al., 2013). This spectrum is, for example, a basis for the Jet Propulsion Laboratory (JPL)-recommended reference spectrum (Burkholder et al., 2019). Another issue is the relative signal levels at 445 and 638 nm: the absorption cross section at 638 nm is significantly smaller, making it difficult to calibrate all the channels at the same time. Calibrating one laser channel at a time, on the other hand, results in the temperature of the laser module drifting significantly from the typical operational temperature, also leading to drifting of the laser power and wavelength.
Here, we perform the calibration for each channel at the same time, but instead of calculating individual fits for each channel, we scale the CEPAS response to one single fit. A similar method was used, for example, in Schnaiter et al. (2023). The photoacoustic signal at each wavelength channel is a function of the optical power at that wavelength, as well as the modulation frequency used for the channel. The optical power at each wavelength was measured after the photoacoustic cell with a thermal power meter (PM160T, Thorlabs), by switching each laser on one at a time. The frequency response was measured by turning only the blue laser on and recording the photoacoustic background signal resulting from the residual window absorption at each modulation frequency. The CEPAS signal from each channel and for each calibration step was normalized by the optical power and the microphone frequency response. Figure A1 shows the normalized CEPAS signal plotted as a function of the absorption calculated from the NO2 concentration and absorption cross section. Four known concentrations of NO2 were diluted from a gas cylinder with 1.17 ppm of NO2 in an N2 balance. The diluting gas was compressed air. The concentration levels were converted to absorption at each wavelength using the absorption cross section from the literature (Vandaele et al., 1998). The laser wavelengths were measured with an optical spectrum analyzer (AQ6315E, Ando). Figure A1 shows that the scaled CEPAS data follow a linear fit. To get a conversion factor for each channel, the slope from the linear fit was again scaled with the optical power and frequency response. These factors were then used to convert the CEPAS signals to absorption in the BC measurements.
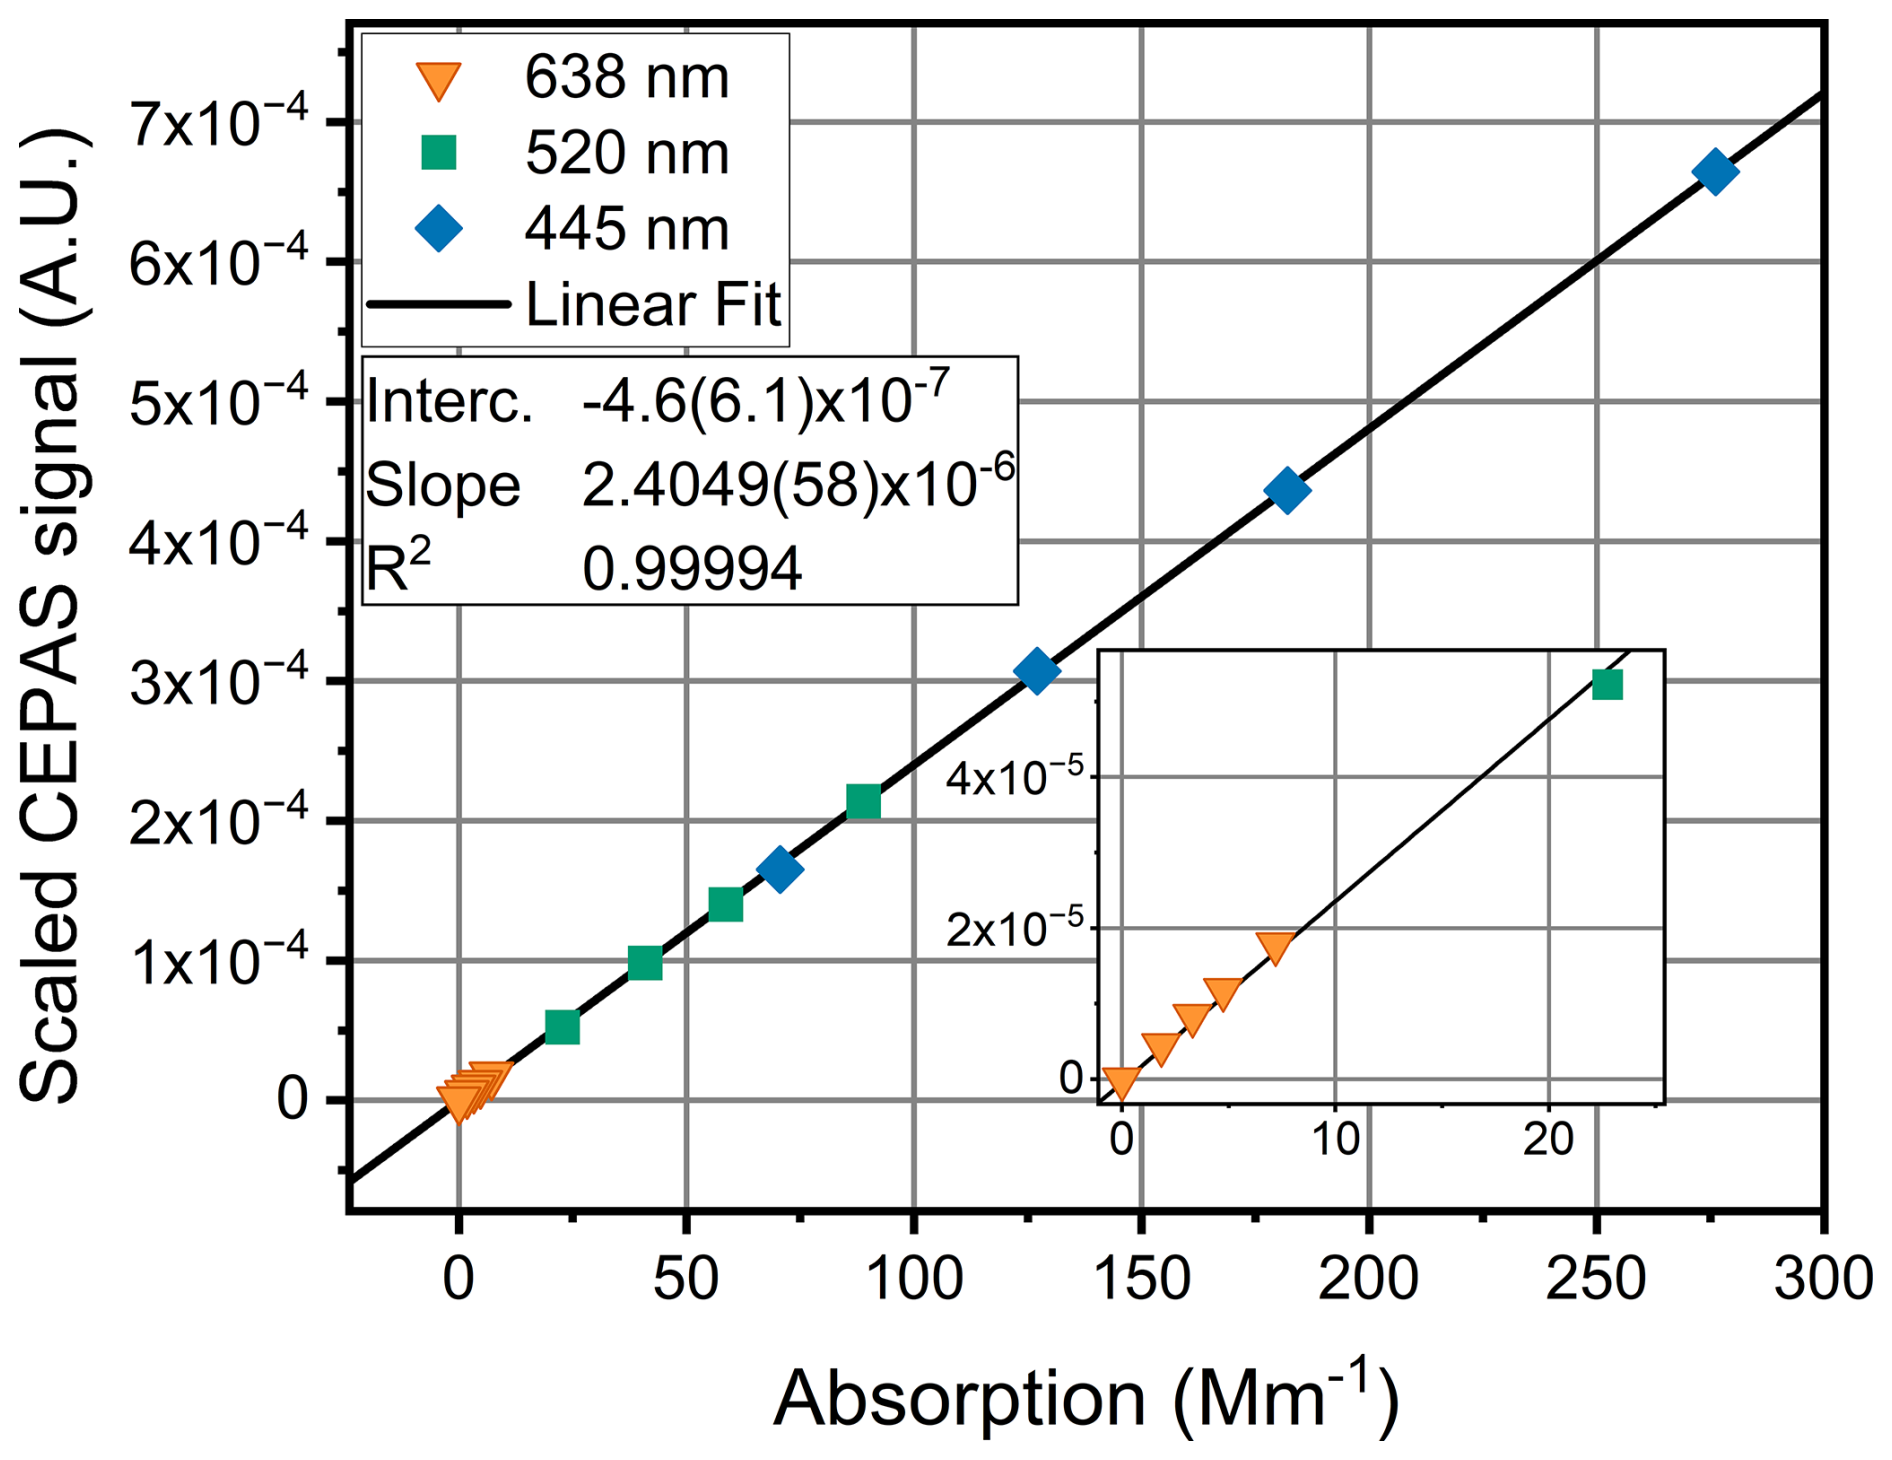
Figure A1CEPAS signal, scaled by optical power and frequency response at each channel, as a function of the NO2 absorption. The scaling allows for applying all the calibration data measured at the different wavelengths to the same calibration fit. The NO2 absorption is calculated for the different wavelengths from the literature NO2 absorption cross section, at each NO2 concentration steps. Values scaled from the red, green and blue channels are shown with different colored symbols.
To estimate the uncertainty of the absorption measured with CEPAS, we consider contributions from the NO2 concentration and absorption cross section used for the calibration and from the power measurement used to scale the CEPAS signals from the different channels. The uncertainty of the power meter is given as 5 %. The NO2 concentration was varied with a mass flow controller (FC-785C, Aera), and we estimate the uncertainty of the dilution system to be 5 % based on the accuracy of the mass flow controller. Since the NO2 absorption cross section here is based on the literature values, we estimate its uncertainty by comparing several spectra (Davidson, et al., 1988; Vandaele et al., 1998, 2002; Voigt, et al., 2002), available from the MPI-Mainz UV–VIS spectral atlas (Keller-Rudek, et al., 2013). The standard deviation of the cross section at the laser wavelengths from the four different spectra gives relative uncertainties of 9.8 %, 1.6 % and 4.0 % for the red, green and blue channels, respectively. The NO2 absorption is further influenced by any wavelength changes of the three lasers. Based on wavelength measurements performed in laboratory conditions on different days, we estimate that the wavelength of the lasers may vary within a range of approximately 1 nm. Allowing each laser wavelength to vary by 0.5 nm in either direction imparts a relative uncertainty of 2.9 %, 3.5 % and 4.8 % for the red, green and blue channels, respectively. The red channel has the largest uncertainty for the absorption cross section, dominated by the differences between different sources. If we use 10 % uncertainty for the absorption cross section, combining the other sources addressed above, we get a total uncertainty of 12 % for the absorption measured with CEPAS.
A scanning mobility particle sizer system was used to estimate the particle losses of the CEPAS measurement. Particles were generated with an atomizer from an NH4NO3 water solution and size selected with a differential mobility analyzer (DMA). From the DMA output, the flow was directed to the CEPAS instrument, inside of which the flow was divided into the 2 L min−1 bypass flow and the sample flow going to the photoacoustic cell. In the typical measurements, the sample flow through the cell during the sample exchange was approximately 0.5 L min−1, but in the loss measurement, we used a condensation particle counter (CPC) to draw a 0.3 L min−1 sample flow through the cell. The particle concentration measured by the CPC was then compared to a separate measurement performed directly from the DMA output to estimate the particle transmission through the photoacoustic cell. The DMA sheath flow was 3.5 L min−1. The DMA was tuned to five different particle sizes, ranging from 100 to 700 nm. No inversion was calculated for this estimate. Figure B1 shows the measured transmission as a function of particle diameter. The figure shows that the losses are approximately constant, with a transmission of approximately 0.7, until 400 nm, after which the losses start to increase for the larger particles. Since we did not have a measured particle size distribution specifically for BC in the concentration measurement of the main paper, we have used this transmission of 0.7 to correct the measured BC concentrations, as BC particles are typically smaller than 500 nm in size. The result can be thought of as the higher limit for the particle losses, because the particle concentration is measured at the output of the CEPAS cell, so it includes possible losses at the outlet coupling from the cell, which would not affect the measured CEPAS signal.
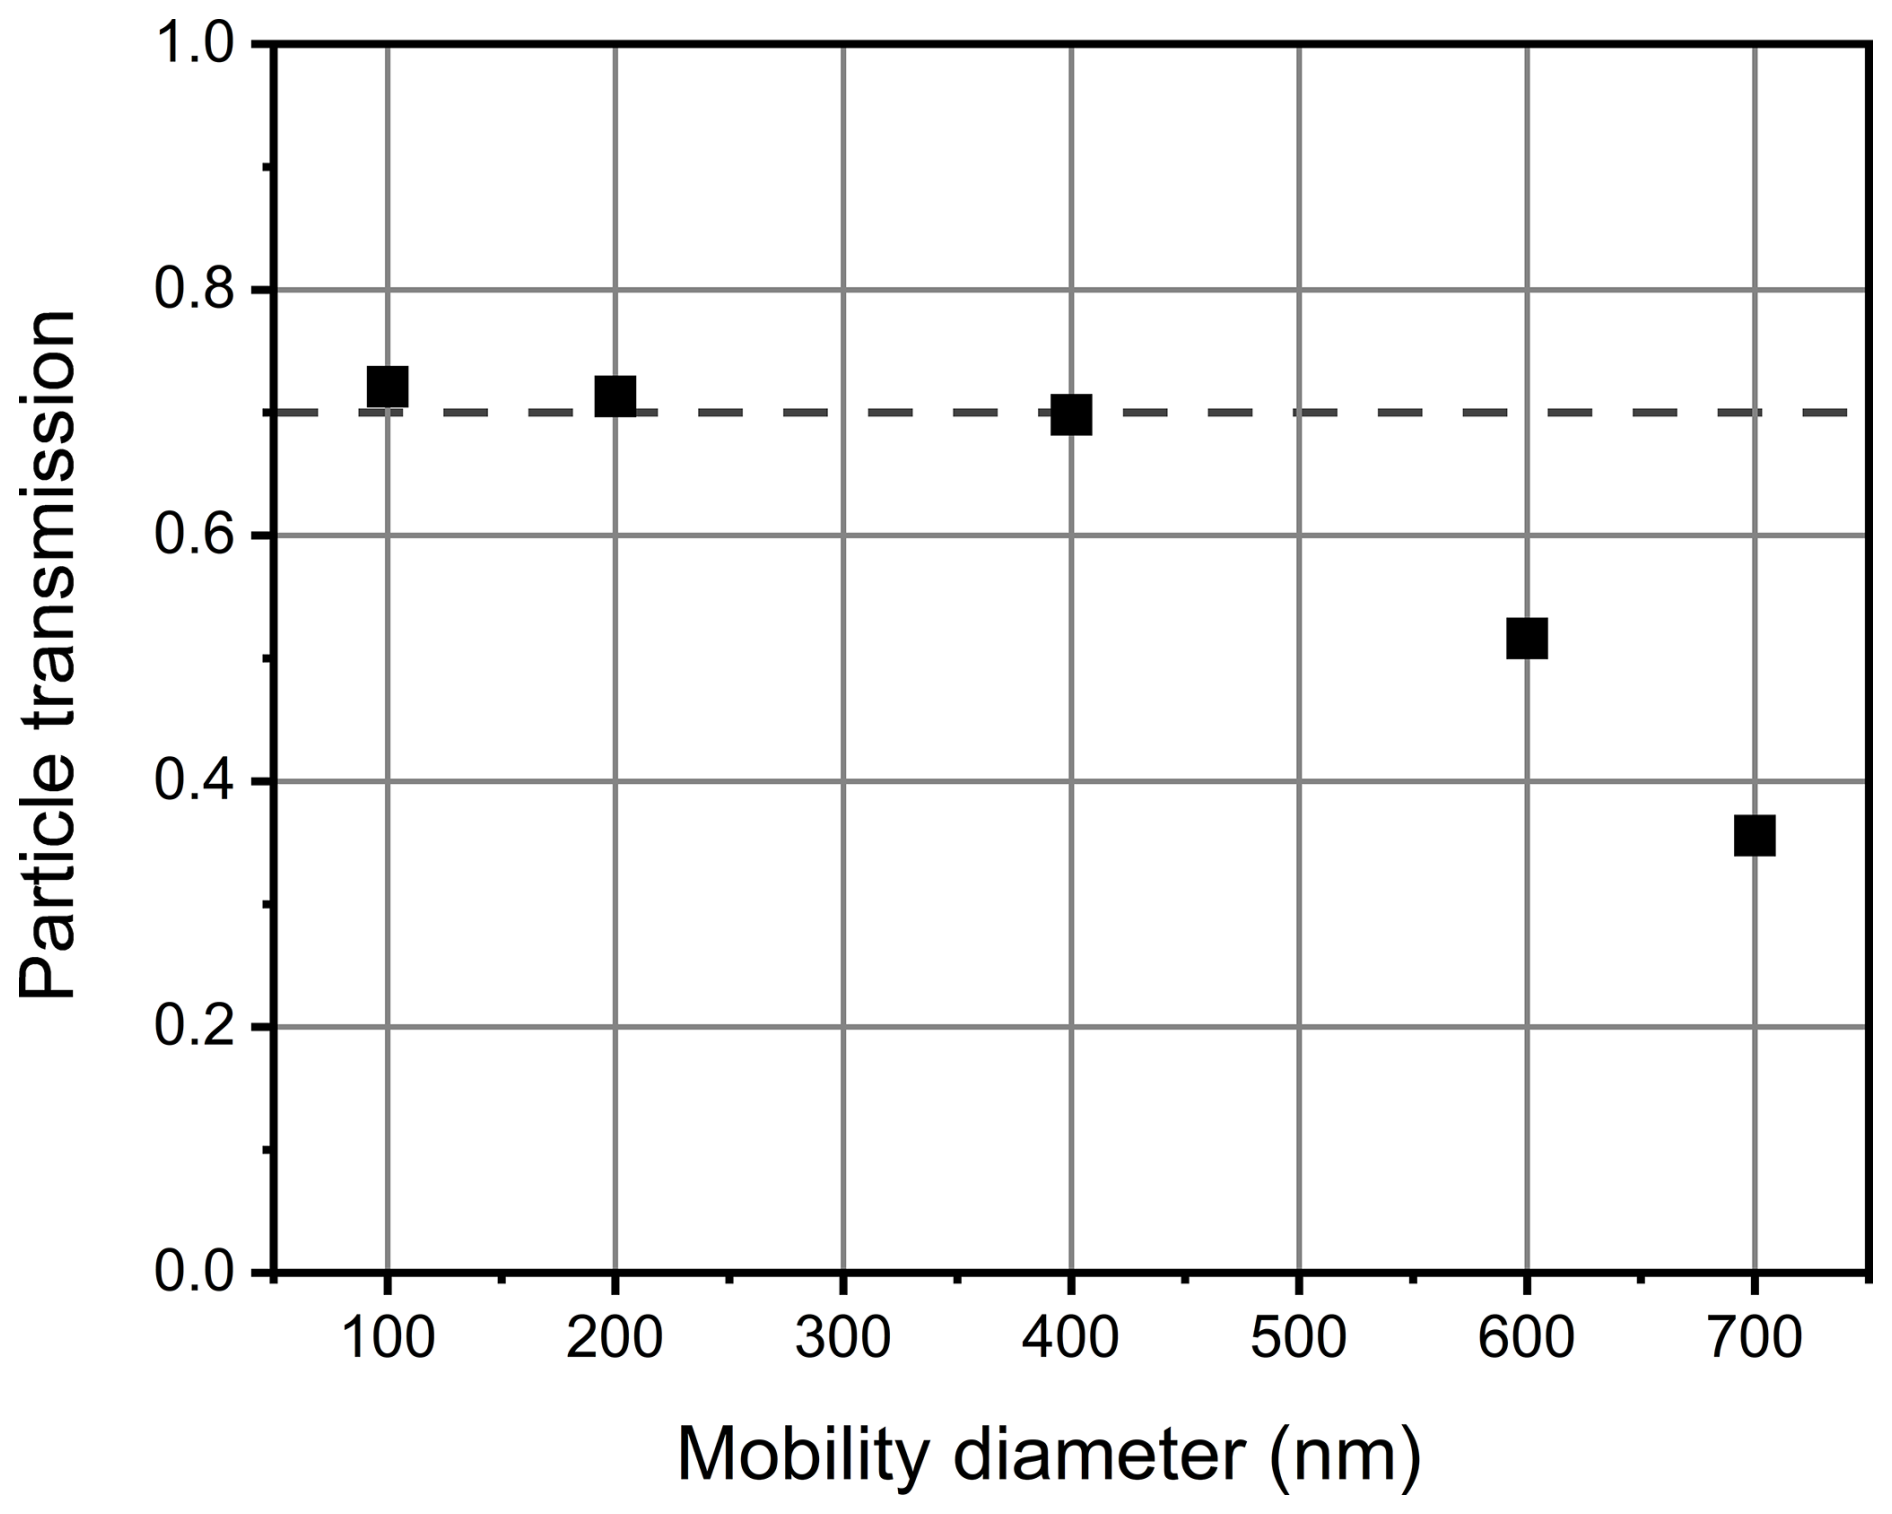
Figure B1Particle transmission measured with the scanning mobility particle sizer (SMPS) from the input of the CEPAS instrument to the output of the CEPAS cell. The figure shows that the transmission is nearly constant at approximately 0.7 (dashed line) below diameters of 400 nm but starts to decrease for larger particles.
The absorption Ångström exponent (AAE) values calculated from the CEPAS red and blue channels, as well as from AE33 channels with the nearest matching wavelengths (BC5 at 660 nm and BC2 at 470 nm), are shown as a time trace in Fig. C1. The data points are 1 h averages. Figure C1 also shows the correlation between the AAE measured by the two methods. The concentrations from the AE33 were converted to absorption by multiplying with the mass absorption coefficient from the instrument manual (10.35 m2 g−1 for BC5 and 14.54 m2 g−1 for BC2). When the BC concentration approaches zero, the AAE from the CEPAS becomes exceedingly noisy, so we have left out the CEPAS data for points where the BC concentration is below 100 ng m−3, as measured by the CEPAS red channel. There are no significant changes observed in the AAE over the measurement period, so no clear correlation is observed either. The average AAE from CEPAS is 0.96, with a standard deviation of 0.46, and the mean from the AE33 is 1.46, with a standard deviation of 0.12.
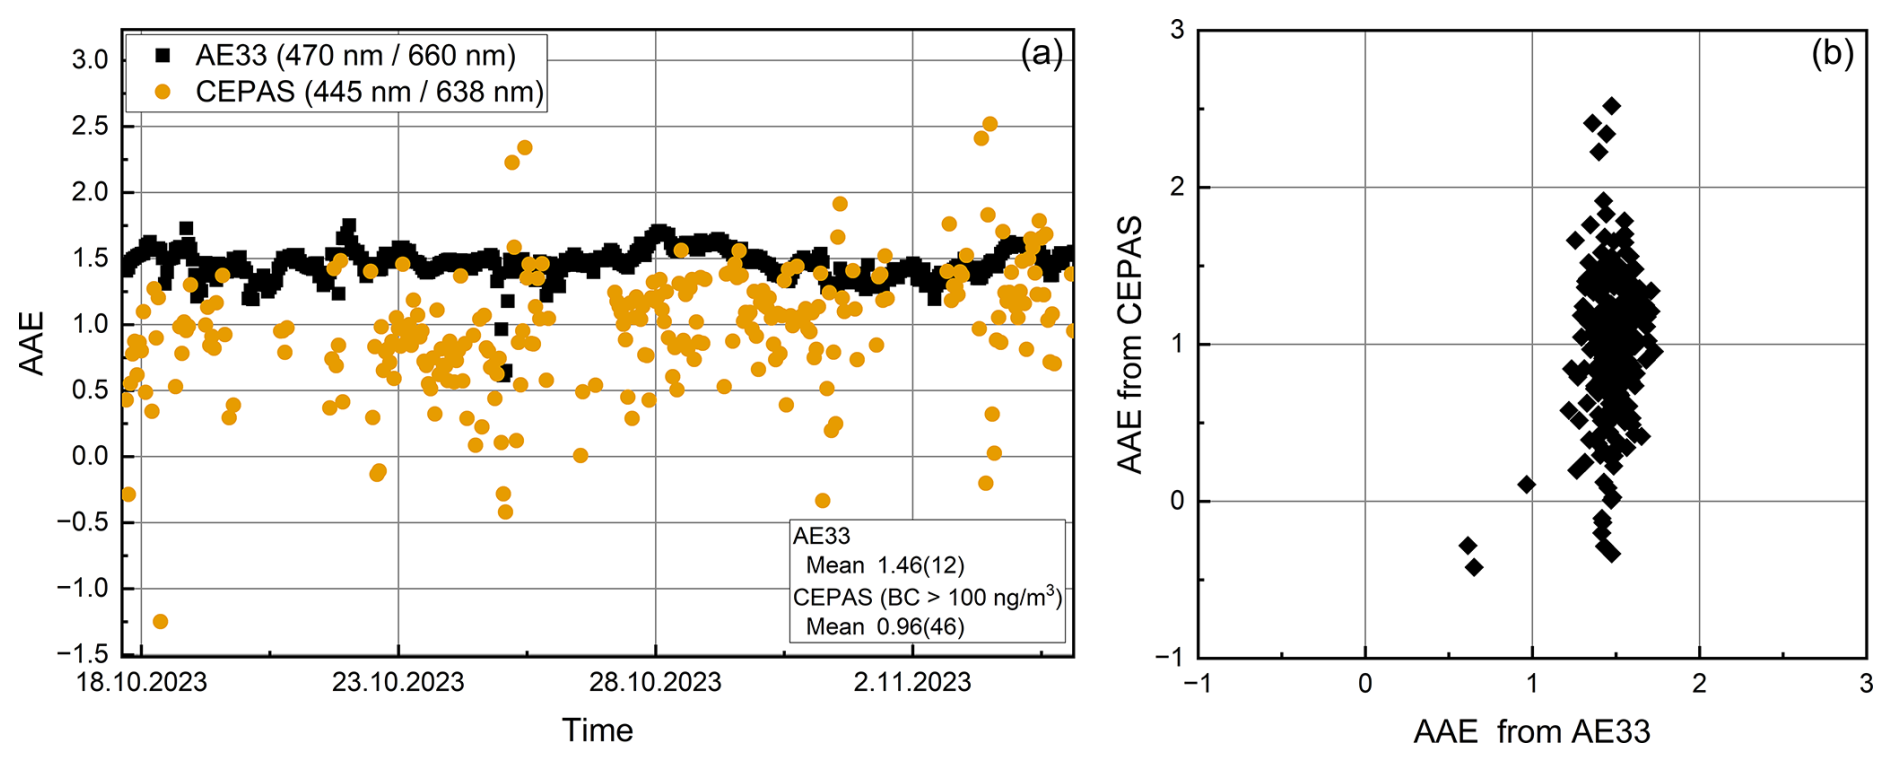
Figure C1The AAE measured by the AE33 and CEPAS over time (a) and the correlation between the AAE measured by the two methods (b). Each data point is a 1 h average. For clarity, the farthest outlier has been left outside the axis limits on the correlation plot but is shown in the time trace.
The BC concentration data from the MAAP and the NO2 reference instrument data are available through the SmartSMEAR (Junninen et al., 2009) web interface available at https://smear.avaa.csc.fi/ (SmartSMEAR, 2024). Other underlying data are available at https://doi.org/10.5281/zenodo.14496882 (Karhu et al., 2024).
JKa, TM, MV and TH developed and built the photoacoustic instrument; all co-authors planned the measurements; JKa, TM and JKu performed the measurements; JKa and TM analyzed the data; JKa prepared the manuscript draft; all co-authors reviewed and edited the manuscript.
At least one of the (co-)authors is a member of the editorial board of Aerosol Research. The peer-review process was guided by an independent editor, and the authors also have no other competing interests to declare.
Publisher's note: Copernicus Publications remains neutral with regard to jurisdictional claims made in the text, published maps, institutional affiliations, or any other geographical representation in this paper. While Copernicus Publications makes every effort to include appropriate place names, the final responsibility lies with the authors.
This research has been supported by the Research Council of Finland (grant nos. 341271, 342579, 349544, 361835, and 346529), the Jane ja Aatos Erkon Säätiö (Compact and precise sensor for global BC monitoring), and Business Finland (grant no. 6868/31/2022).
This paper was edited by Daniele Contini and reviewed by two anonymous referees.
Achilleos, S., Kioumourtzoglou, M. A., Wu, C. Da, Schwartz, J. D., Koutrakis, P., and Papatheodorou, S. I.: Acute effects of fine particulate matter constituents on mortality: A systematic review and meta-regression analysis, Environ. Int., 109, 89–100, https://doi.org/10.1016/j.envint.2017.09.010, 2017.
Arnott, W. P., Moosmüller, H., and Walker, J. W.: Nitrogen dioxide and kerosene-flame soot calibration of photoacoustic instruments for measurement of light absorption by aerosols, Rev. Sci. Instrum., 71, 4545–4552, https://doi.org/10.1063/1.1322585, 2000.
Arnott, W. P., Moosmüller, H., Sheridan, P. J., Ogren, J. A., Raspet, R., Slaton, W. V., Hand, J. L., Kreidenweis, S. M., and Collett, J. L.: Photoacoustic and filter-based ambient aerosol light absorption measurements: Instrument comparisons and the role of relative humidity, J. Geophys. Res.-Atmos., 108, AAC 15-1–AAC 15-11, https://doi.org/10.1029/2002jd002165, 2003.
Bond, T. C., Doherty, S. J., Fahey, D. W., Forster, P. M., Berntsen, T., Deangelo, B. J., Flanner, M. G., Ghan, S., Kärcher, B., Koch, D., Kinne, S., Kondo, Y., Quinn, P. K., Sarofim, M. C., Schultz, M. G., Schulz, M., Venkataraman, C., Zhang, H., Zhang, S., Bellouin, N., Guttikunda, S. K., Hopke, P. K., Jacobson, M. Z., Kaiser, J. W., Klimont, Z., Lohmann, U., Schwarz, J. P., Shindell, D., Storelvmo, T., Warren, S. G., and Zender, C. S.: Bounding the role of black carbon in the climate system: A scientific assessment, J. Geophys. Res.-Atmos., 118, 5380–5552, https://doi.org/10.1002/jgrd.50171, 2013.
Burkholder, J. B., Sander, S. P., Abbatt, J., Barker, J. R., Cappa, C., Crounse, J. D., Dibble, T. S., Huie, R. E., Kolb, C. E., Kurylo, M. J., Orkin, V. L., Percival, C. J., Wilmouth, D. M., and Wine, P. H.: Chemical kinetics and photochemical data for use in atmospheric studies, Number 19, technical report, Jet Propulsion Laboratory, Pasadena, http://jpldataeval.jpl.nasa.gov/ (last access: 14 June 2024), 2019.
Davidson, J. A., Cantrell, C. A., McDaniel, A. H., Shetter, R. E., Madronich, S., and Calvert, J. G.: Visible-ultraviolet absorption cross sections for NO2 as a function of temperature, J. Geophys. Res. 93, 7105–7112, https://doi.org/10.1029/JD093iD06p07105, 1988.
Davies, N. W., Fox, C., Szpek, K., Cotterell, M. I., Taylor, J. W., Allan, J. D., Williams, P. I., Trembath, J., Haywood, J. M., and Langridge, J. M.: Evaluating biases in filter-based aerosol absorption measurements using photoacoustic spectroscopy, Atmos. Meas. Tech., 12, 3417–3434, https://doi.org/10.5194/amt-12-3417-2019, 2019.
Drinovec, L., Jagodič, U., Pirker, L., Škarabot, M., Kurtjak, M., Vidović, K., Ferrero, L., Visser, B., Röhrbein, J., Weingartner, E., Kalbermatter, D. M., Vasilatou, K., Bühlmann, T., Pascale, C., Müller, T., Wiedensohler, A., and Močnik, G.: A dual-wavelength photothermal aerosol absorption monitor: design, calibration and performance, Atmos. Meas. Tech., 15, 3805–3825, https://doi.org/10.5194/amt-15-3805-2022, 2022.
Foster, K., Pokhrel, R., Burkhart, M., and Murphy, S.: A novel approach to calibrating a photoacoustic absorption spectrometer using polydisperse absorbing aerosol, Atmos. Meas. Tech., 12, 3351–3363, https://doi.org/10.5194/amt-12-3351-2019, 2019.
Järvi, L., Hannuniemi, H., Hussein, T., Junninen, H., Aalto, P. P., Hillamo, R., Mäkelä, T., Keronen, P., Siivola, E., Vesala, T., and Kulmala, M.: The urban measurement station SMEAR III: Continuous monitoring of air pollution and surface-atmosphere interactions in Helsinki, Finland, Boreal Environ. Res., 14, 86–109, 2009.
Junninen, H., Lauri, A., Keronen, P., Aalto, P., Hiltunen, V., Hari, P., and Kulmala, M.: Smart-SMEAR: online data exploration and visualization tool for SMEAR stations, Boreal Environ. Res. 14, 447–457, 2009.
Karhu, J., Kuula, J., Virkkula, A., Timonen, H., Vainio, M., and Hieta, T.: Cantilever-enhanced photoacoustic measurement of light-absorbing aerosols, Aerosol Sci. Tech., 56, 92–100, https://doi.org/10.1080/02786826.2021.1998338, 2021.
Karhu, J., Mikkonen, T., Kuula, J., Virkkula, A., Ikonen, E., Vainio, M., Timonen, H., and Hieta, T.: Dataset for Field-deployable cantilever-enhanced photoacoustic instrument for aerosol light absorption measurement at three wavelengths, Zenodo [data set], https://doi.org/10.5281/zenodo.14496882, 2024.
Kauppinen, J., Wilcken, K., Kauppinen, I., and Koskinen, V.: High sensitivity in gas analysis with photoacoustic detection, Microchem. J., 76, 151–159, https://doi.org/10.1016/j.microc.2003.11.007, 2004.
Keller-Rudek, H., Moortgat, G. K., Sander, R., and Sörensen, R.: The MPI-Mainz UV/VIS Spectral Atlas of Gaseous Molecules of Atmospheric Interest, Earth Syst. Sci. Data, 5, 365–373, https://doi.org/10.5194/essd-5-365-2013, 2013.
Kuula, J., Karhu, J., Mikkonen, T., Grahn, P., Virkkula, A., Timonen, H., Hieta, T., and Vainio, M.: Validation of cantilever-enhanced photoacoustic particle-size-resolved light absorption measurement using nigrosin reference particles and Mie modelling, Aerosol Research, 3, 1–13, https://doi.org/10.5194/ar-3-1-2025, 2025.
Lack, D. A., Richardson, M. S., Law, D., Langridge, J. M., Cappa, C. D., McLaughlin, R. J., and Murphy, D. M.: Aircraft instrument for comprehensive characterization of aerosol optical properties, part 2: Black and brown carbon absorption and absorption enhancement measured with photo acoustic spectroscopy, Aerosol Sci. Tech., 46, 555–568, https://doi.org/10.1080/02786826.2011.645955, 2012.
Lack, D. A., Moosmüller, H., McMeeking, G. R., Chakrabarty, R. K., and Baumgardner, D.: Characterizing elemental, equivalent black, and refractory black carbon aerosol particles: A review of techniques, their limitations and uncertainties, Anal. Bioanal. Chem., 406, 99–122, https://doi.org/10.1007/s00216-013-7402-3, 2014.
Linke, C., Ibrahim, I., Schleicher, N., Hitzenberger, R., Andreae, M. O., Leisner, T., and Schnaiter, M.: A novel single-cavity three-wavelength photoacoustic spectrometer for atmospheric aerosol research, Atmos. Meas. Tech., 9, 5331–5346, https://doi.org/10.5194/amt-9-5331-2016, 2016.
Luoma, K., Virkkula, A., Aalto, P., Lehtipalo, K., Petäjä, T., and Kulmala, M.: Effects of different correction algorithms on absorption coefficient – a comparison of three optical absorption photometers at a boreal forest site, Atmos. Meas. Tech., 14, 6419–6441, https://doi.org/10.5194/amt-14-6419-2021, 2021.
Moosmüller, H., Arnott, W. P., and Rogers, C. F.: Methods for real-time, in situ measurement of aerosol light absorption, J. Air Waste Manage. Assoc., 47, 157–166, https://doi.org/10.1080/10473289.1997.10464430, 1997.
Petzold, A. and Niessner, R.: Novel design of a resonant photoacoustic spectrophone for elemental carbon mass monitoring, Appl. Phys. Lett., 66, 1285–1287, https://doi.org/10.1063/1.113271, 1995.
Savadkoohi, M., Pandolfi, M., Favez, O., Putaud, J. P., Eleftheriadis, K., Fiebig, M., Hopke, P. K., Laj, P., Wiedensohler, A., Alados-Arboledas, L., Bastian, S., Chazeau, B., María, Á. C., Colombi, C., Costabile, F., Green, D. C., Hueglin, C., Liakakou, E., Luoma, K., Listrani, S., Mihalopoulos, N., Marchand, N., Močnik, G., Niemi, J. V., Ondráček, J., Petit, J. E., Rattigan, O. V., Reche, C., Timonen, H., Titos, G., Tremper, A. H., Vratolis, S., Vodička, P., Funes, E. Y., Zíková, N., Harrison, R. M., Petäjä, T., Alastuey, A., and Querol, X.: Recommendations for reporting equivalent black carbon (eBC) mass concentrations based on long-term pan-European in-situ observations, Environ. Int., 185, 108553, https://doi.org/10.1016/j.envint.2024.108553, 2024.
Schnaiter, F. M., Linke, C., Asmi, E., Servomaa, H., Hyvärinen, A.-P., Ohata, S., Kondo, Y., and Järvinen, E.: The four-wavelength Photoacoustic Aerosol Absorption Spectrometer (PAAS-4λ), Atmos. Meas. Tech., 16, 2753–2769, https://doi.org/10.5194/amt-16-2753-2023, 2023.
SmartSMEAR: SMEAR III Helsinki Kumpula, Fairdata AVAA [data set], https://smear.avaa.csc.fi/, last access: 27 May 2024.
Timonen, H., Karjalainen, P., Aalto, P., Saarikoski, S., Mylläri, F., Karvosenoja, N., Jalava, P., Asmi, E., Aakko-Saksa, P., Saukkonen, N., Laine, T., Saarnio, K., Niemelä, N., Enroth, J., Väkevä, M., Oyola, P., Pagels, J., Ntziachristos, L., Cordero, R., Kuittinen, N., Niemi, J. V., and Rönkkö, T.: Adaptation of Black Carbon Footprint Concept Would Accelerate Mitigation of Global Warming, Environ. Sci. Technol., 53, 12153–12155, https://doi.org/10.1021/acs.est.9b05586, 2019.
Uotila, J.: Comparison of infrared sources for a differential photoacoustic gas detection system, Infrared Phys. Technol., 51, 122–130, https://doi.org/10.1016/j.infrared.2007.05.001, 2007.
Vandaele, A. C., Hermans, C., Simon, P. C., Carleer, M., Colin, R., Fally, S., Mérienne, M. F., Jenouvrier, A., and Coquart, B.: Measurements of the NO2 absorption cross-section from 42 000 cm−1 to 10 000 cm−1 (238–1000 nm) at 220 K and 294 K, J. Quant. Spectrosc. Radiat. Transf., 59, 171–184, https://doi.org/10.1016/S0022-4073(97)00168-4, 1998.
Vandaele, A. C., Hermans, C., Fally, S., Carleer, M., Colin, R., Mérienne, M.-F., and Jenouvrier, A.: High-resolution Fourier transform measurement of the NO2 visible and near-infrared absorption cross-section: Temperature and pressure effects, J. Geophys. Res., 107, ACH 3-1–ACH 3-12, https://doi.org/10.1029/2001JD000971, 2002.
Virkkula, A., Mäkelä, T., Hillamo, R., Yli-Tuomi, T., Hirsikko, A., Hämeri, K., and Koponen, I. K.: A simple procedure for correcting loading effects of aethalometer data, J. Air Waste Manage. Assoc., 57, 1214–1222, https://doi.org/10.3155/1047-3289.57.10.1214, 2007.
Voigt, S., Orphal, J., and Burrows, J. P.: The temperature and pressure dependence of the absorption cross-sections of NO2 in the 250–800 nm region measured by Fourier-transform spectroscopy, J. Photochem. Photobiol. A-Chem., 149, 1–7, https://doi.org/10.1016/S1010-6030(01)00650-5, 2002.
Werle, P., Mücke, R., and Slemr, F.: The limits of signal averaging in atmospheric trace-gas monitoring by tunable diode-laser absorption spectroscopy (TDLAS), Appl. Phys. B, 57, 131–139, https://doi.org/10.1007/BF00425997, 1993.
Xu, Y. and Ramanathan, V.: Well below 2 °C: Mitigation strategies for avoiding dangerous to catastrophic climate changes, P. Natl. Acad. Sci. USA, 114, 10315–10323, https://doi.org/10.1073/pnas.1618481114, 2017.
Zhao, G., Yu, Y., Tian, P., Li, J., Guo, S., and Zhao, C.: Evaluation and correction of the ambient particle spectral light absorption measured using a filter-based aethalometer, Aerosol Air Qual. Res., 20, 1833–1841, https://doi.org/10.4209/aaqr.2019.10.0500, 2020.