the Creative Commons Attribution 4.0 License.
the Creative Commons Attribution 4.0 License.
 | 02 Jul 2025
Spark ablation metal nanoparticles and coating on TiO2 in the aerosol phase
Benjamin Gfeller
Mariia Becker
Adrian D. Aebi
Nicolas Bukowiecki
Marcus Wyss
Markus Kalberer
Generation and characterisation of metal nanoparticles (NPs) in the aerosol phase have gained attention in recent years due to their significant potential in applications as diverse as catalysis, electronics or energy storage. Despite the high interest in NPs, it remains challenging to obtain detailed quantitative information with conventional aerosol analysis instruments on size, number concentration, coagulation behaviour and morphologies, which are key to understand their properties. In this study we generated NPs from four metals – Au, Pt, Cu and Ni – via spark ablation in the aerosol phase, which allows the production of NPs as small as 1 nm in high quantities and purity. Particles were characterised with transmission electron microscopy (TEM), scanning transmission electron microscopy (STEM) and energy-dispersive X-ray spectroscopy (EDX) as well as online aerosol particle size distribution measurement techniques. Particle size modes for the four metals ranged between 3 and 5 nm right after generation. Differences in number and size of particles generated can be rationalised with thermodynamic properties of the metals such as melting point combined with their oxidative properties. The four metal NPs were also coagulated with larger TiO2 NPs of about 120 nm size, and the metal surface coverage of the TiO2 particles was characterised with electron microscopy and EDX. This detailed characterisation of NPs mixtures will be essential for a fundamental understanding of spark-ablation-generated particles and their applications for material sciences.
- Article
(14466 KB) - Full-text XML
- BibTeX
- EndNote


Nanoparticles (NPs) have long been discovered to have unique physical and chemical properties such as their changed hardness, elastic modulus and adhesion force (Guo et al., 2013; Khan et al., 2019), as well as electronic, optical and catalytic properties (Baig et al., 2021; Cuenya, 2010; Jennings and Strouse, 2007; Terna et al., 2021) compared to bulk material. Understanding the working principles on the nano-scale is crucial for new and emerging applications in energy harvesting (Ulmer et al., 2019), medicine (Murthy, 2007), electronics (He et al., 2020) etc. to be improved.
There is a wide range of generation methods for metal NPs ranging from chemical methods such as chemical reduction (Gudikandula and Charya Maringanti, 2016) and sol–gel methods (Lu and Jagannathan, 2002) to physical methods like laser or spark ablation (Nagarajan, 2008; Schwyn et al., 1988; Ullmann et al., 2002). Chemical approaches which usually produce NPs in batch processes are well established, often yielding reproducible output within narrow particle size distributions (Daruich De Souza et al., 2019; Jamkhande et al., 2019; Zhang et al., 2010). However, the purity of the generated particles can be compromised due to solvent residues, or the toxicity of reagents can pose challenges (Jamkhande et al., 2019; Zhang et al., 2010). In comparison, in physical generation methods, particles are often generated in an inert gas, allowing for a continuous particle production, usually yielding particles in high purity due to the absence of liquid precursors and solvent (Kumari et al., 2023).
Spark discharge generation (SDG) is a physical generation method that produces a high quantity and purity of NPs. During particle generation in SDG, electrode material is evaporated in the vicinity of an electrical spark initiated via the break-down of a high-voltage difference applied to the electrodes.
The discharge occurs on timescales of microseconds at temperatures of around 20 000 K (Reinmann and Akram, 1997). At these temperatures, electrode material is evaporated and immediately mixed with a carrier gas. Therein, the electrode vapour expands rapidly and cools down with quenching rates of 107 K s−1, resulting in the homogeneous nucleation of the evaporated electrode material to NPs with sizes well below 10 nm (Pfeiffer et al., 2015). This method is highly versatile as every conductive and solid pure element or alloy can be used for particle generation (Schwyn et al., 1988). Compared to laser ablation, no high-energy lasers are needed for SDG particle generation, making it technically a more straightforward process (Tabrizi et al., 2009). The generation of metal NPs via SDG has gained increasing attention in recent years (Hallberg et al., 2018; Petallidou et al., 2023; Snellman et al., 2024) due to the potential applications of NPs, e.g. in catalysis (Weber et al., 1999), nanoprinting (Jung et al., 2021) and drug delivery (Murthy, 2007). However, characterisation of the produced particles in the gas phase, e.g. their quantification, is challenging (Kangasluoma et al., 2020). Given the high diffusion coefficients of sub-10 nm particles (Hinds, 1999), sampling must occur rapidly after particle generation to minimise losses due to diffusion to walls of the experimental setup or coagulation with other particles. Currently available techniques to determine aerosol NP number size distributions mainly use size classification via mobility analysis using differential mobility analysers (DMAs) and detection via condensation particle counters (CPCs) or electrometers (Chen et al., 1998). Electrical mobility methods suffer from low charging efficiencies of particles in the low nanometre size range (Fuchs, 1963), resulting in low detection efficiencies. Although CPCs can detect particles to sizes down to about 2 nm (Brilke et al., 2020), detection is challenging because particles need to get activated in a supersaturated vapour (usually butanol or water) before detection of the activated particle by light scattering and due to diffusional losses of the smallest particles. Furthermore, these methods do not allow the assessment of particle morphologies. High-resolution imaging techniques are required for morphological analysis of particles as small as 1 nm, and electron microscopy is an alternative method to determine particle number and size distributions down to this size range (Fissan et al., 2014; Karlsson et al., 2006).
After generation, NPs can be further manipulated in a number of ways, e.g. by depositing small NPs on the surface of larger (substrate) particles in the gas phase, resulting in particles with complex chemical or physical properties (Pfeiffer et al., 2015; Snellman et al., 2024). Metal NPs can be used to coat semiconducting particles such as TiO2, MgO or CuO2 (Gao et al., 2015; Hejral et al., 2013; Lopez, 2004; Molina and Hammer, 2005). Resulting structures were predicted theoretically (e.g. Molina and Hammer, 2005) and were shown empirically to have increased catalytic activities for reactions such as methanation (Gao et al., 2015) or CO oxidation (Lopez, 2004). Different methods are available to assess the efficiency of such coating processes. Microscopic imaging can visualise coating structures and assess them qualitatively in high resolution (Harra et al., 2015; Pfeiffer et al., 2015). Furthermore, measurements of the aerosol number size distributions of the two composites individually (i.e. substrate NPs and coating NPs) and during the coating via mobility sizing and counting are often conducted to quantify the coating (Backman et al., 2004; Lähde et al., 2008).
As mentioned above, particles generated via SDG are often in the size range of only a few nanometres, which is challenging for most conventional aerosol particle analysis techniques, such as scanning mobility particle sizing (SMPS) instruments. Electron microscopy analyses, e.g. high-resolution transmission electron microscopy (TEM), suffer from other sampling and analysis artefacts to determine total concentrations and size distributions of particles in the aerosol phase. By combining electron microscopy with aerosol techniques (i.e. SMPS), we investigate the size distribution of four SDG-generated metal NP species (Au, Pt, Cu and Ni) and develop a robust method to determine their size distribution in the aerosol phase and the size range of primary particle for all four metals, which range from < 1 nm to about 5 nm using particle circularity as a key metric.
A second aspect of this study addresses the coagulation behaviour of the four metal NPs with larger (∼ 120 nm) TiO2 NPs, which is also challenging to characterise and to quantify. Electron microscopy allows for counting of metal NPs coating the larger TiO2 particles, but such conventional methods often suffer from poor counting statistics and therefore major uncertainties. We address the difficulty in estimating NP coating processes and present a method to estimate average coating efficiencies by quantifying the number concentrations of metal NPs which did not coagulate with TiO2 particles and compare these numbers with NPs in TEM analyses when no TiO2 particles are present. We illustrate that electron microscopy is well suited to characterise quantitatively coating processes of metal NPs on larger TiO2 particles. Such thorough characterisations are important for a fundamental understanding of spark-ablation-generated NPs and their chemical and physical properties.
Figure 1 shows a general overview of the experimental setup used to generate metal and TiO2 particles and collect them for characterisation.
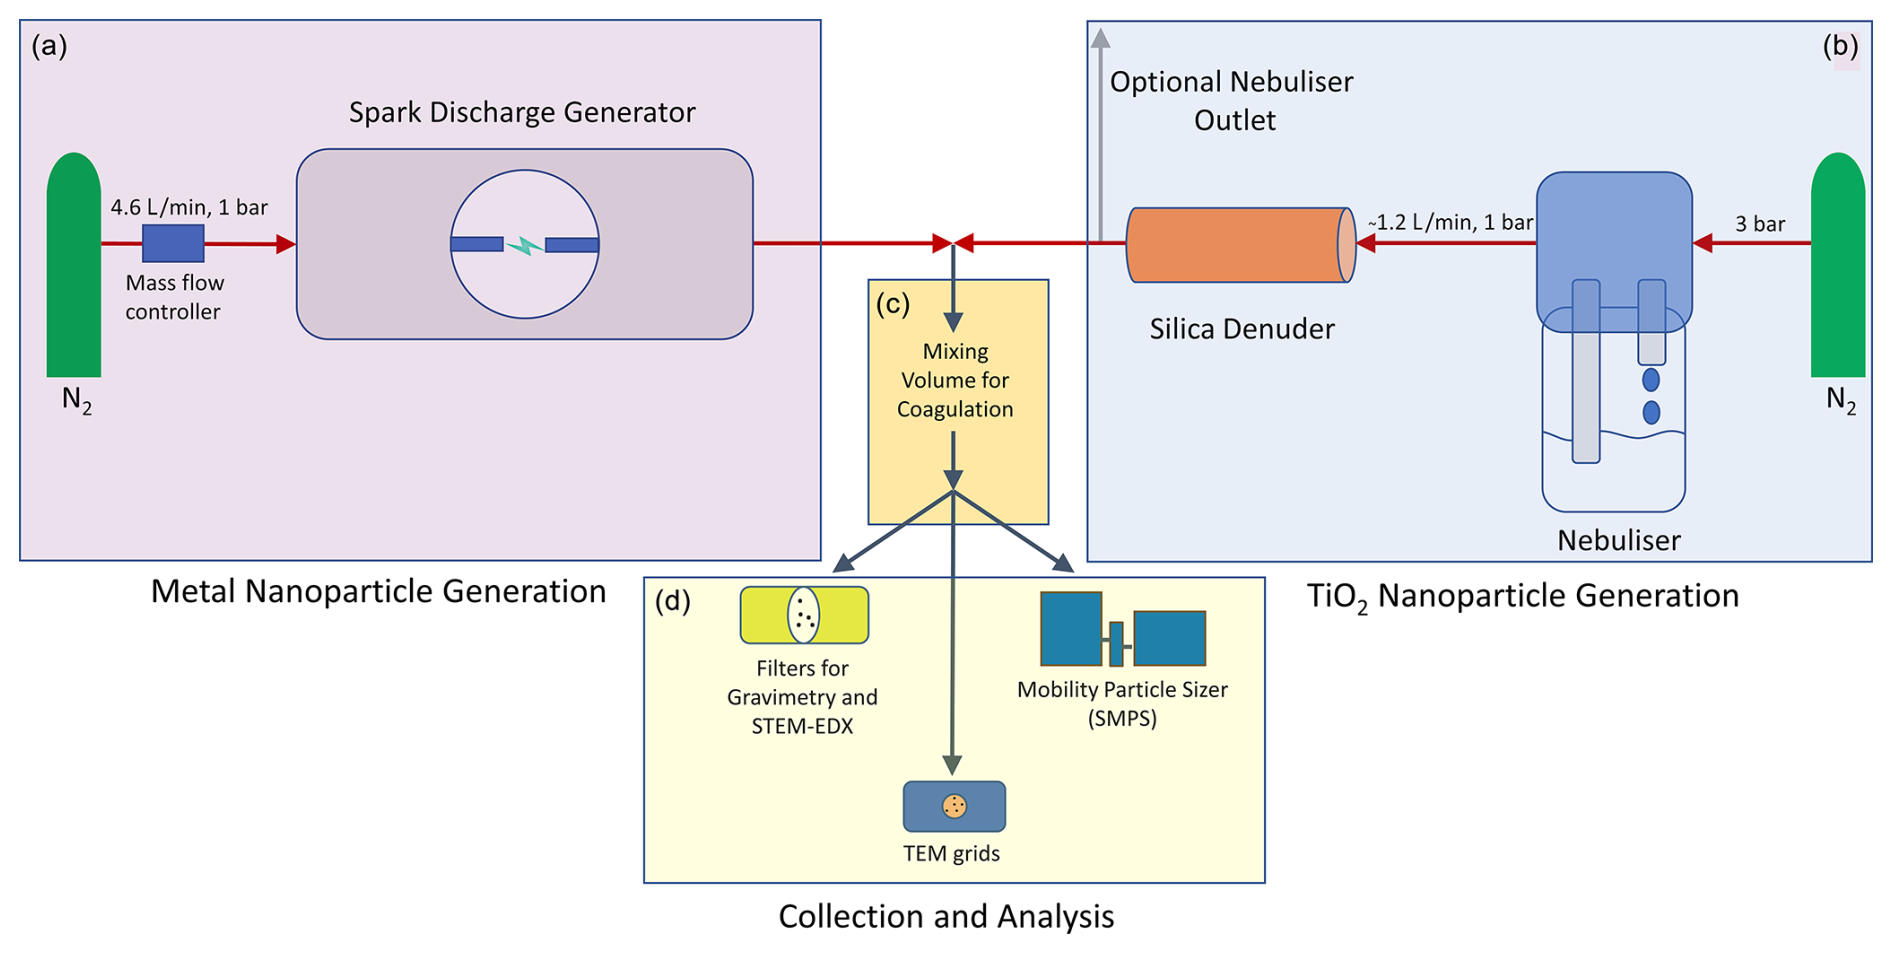
Figure 1Schematic of the setup used to generate (a, b), process (c) and analyse (d) metal NPs. The spark-generated particles (a) are either mixed with nebulised TiO2 substrate NPs (b) or, after passing a variable volume for coagulation (c), directly analysed with transmission electron microscopy (TEM), scanning transmission electron microscopy (STEM) and STEM in combination with energy-dispersive X-ray spectroscopy (STEM–EDX) and by scanning mobility particle sizing (SMPS) (d).
2.1 Particle generation and mixing
Metal NPs were generated with a spark discharge generator (SDG) (VSParticle, Model G1, Delft, the Netherlands) (Fig. 1a). In a SDG, the breakdown of a high voltage applied to two electrodes causes a discharge spark. The high temperatures of the spark (up to 20 000 K) evaporate electrode material, which is quickly quenched in a continuous carrier gas flow, causing the evaporated material to condense into particles consisting of the electrode material.
To ensure comparability, the discharge voltage of the instrument was set to 1 kV with a current of 5 mA in all experiments. Au, Pt, Cu and Ni nanoparticles were generated with the SDG using electrodes of the respective metal with a purity of 99.99 % and a diameter of 3 mm. The SDG was run in crossflow mode, where the quenching gas N2 (99.999 % purity) entered the spark chamber perpendicular to the electrodes at the position of the spark. If not specified otherwise, the N2 flow rate was set to 5.8 L min−1. To decrease instabilities in the particle generation, the system ran for 30 min before further particle processing and collection. This equilibration process was monitored using a scanning mobility particle sizer (SMPS, DMA model 3085, CPC model 3776, TSI, Shoreview, MN, USA).
In addition to metal nanoparticles, TiO2 aerosol particles were generated, using a home-built nebuliser (Fig. 1b) containing a 1 wt % suspension of TiO2 particles with a rutile and anatase mixture and a BET-determined particle size < 100 nm (99.5 % purity; Sigma Aldrich, Burlington, MA, USA). The nebuliser inlet is pressurised with N2 (99.999 %) at 3 bar. Milli-Q® (resistance > 18 MΩ) water was used for the preparation of the suspension to minimise impurities. Before use, the TiO2 suspension was sonicated for 10 min and stirred continuously during operation to minimise coagulation within the suspension. The nebulised aerosol with a flow rate of 1.2 ± 0.1 L min−1 passed through a cylinder filled with amorphous silica to reduce the relative humidity to < 2 %. Analogously to the SDG, the particle output of the nebuliser was left to equilibrate for 30 min before the analysis. Whenever the nebuliser was in use, to maintain a constant total flow of 5.8 L min−1, the flow through the SDG was reduced to 4.6 L min−1.
After exiting the SDG or the nebuliser, the aerosol particles entered a variable mixing volume (Fig. 1c) with total coagulation times of 1.3, 2.2 or 26.0 s (i.e. time between exiting the spark generator (and optional mixing with the TiO2 NPs) and particle deposition), respectively, to allow for mono- or bi-modal coagulation (coating). For mono-modal coagulation of metal NPs, the nebuliser was switched off. For bi-modal coagulation, the flow through the spark generator was reduced to 4.6 L min−1 to maintain constant coagulation times. Due to this slight change in the SDG flow rate, changes in particle characteristics cannot be excluded, but such changes should be minimal, as described in Tabrizi et al. (2009). If not mentioned otherwise, conductive Tygon tubing (TSI, Shoreview, MN, USA) was used throughout the setup.
2.2 Particle collection
Aerosol particles were collected on TEM grids, on filters or on TiO2 substrate films. For TEM, scanning transmission electron microscopy (STEM) and STEM with energy-dispersive X-ray spectroscopy (EDX) particles were collected in a diffusional collection chamber on TEM grids (Quantifoil® R 1.2/1.3 on Cu or Au 200-mesh grids + 2 nm C, Großlöbichau, Germany) for 2 h for each configuration. Teflon filters (2 µm pore size, 47 mm diameter, Pall Corporation, Port Washington, NY, USA) were installed after the coagulation volumes to collect the aerosol particles for gravimetric analyses for 6 h for all metals. Aerosol particle size distribution measurements confirmed quantitative collection of the metal and TiO2 NPs.
Alternatively, a film of TiO2 substrate (TiO2 electrodes opaque, Solaronix, Aubonne, Switzerland) was used and exposed to a metal aerosol flow for 6 h (Au and Pt) and 12 h (Cu, Ni).
2.3 Particle analysis
Several measurement techniques were used to characterise metal and TiO2 NPs (Fig. 1d). Particles were analysed with TEM as well as STEM and STEM–EDX (JEM-F200 cFEG, Jeol, Tokyo, Japan). For STEM, high-angle annular dark-field (HAADF) and annular bright-field (ABF) detectors were used. Au, Pt, Cu and Ni particles were measured separately or coated on TiO2, in TEM mode. The coated aerosol particles were further analysed in STEM mode and STEM–EDX. The image analysis tool ImageJ (Fiji, v.1.54.f) was used for quantification and characterisation of the particles. After differentiation of the particles and the background grid via manual adjustment of the colour threshold of the images, quantitative (2D projected area and number of particles within 1 µm2 of the grid) and qualitative information (morphology) were determined.
Gravimetric measurements of particles collected on Teflon filters were conducted using a high-precision balance (Model XPR2, Mettler Toledo, Columbus, OH, USA).
For lamella analyses, which provide a cross-sectional cut through nano-structured samples, protective coating layers are often applied to minimise charging effects. For the STEM–EDX analysis of metal NP-coated TiO2 films, lamellas were prepared using a FEI Helios NanoLab 650 DualBeam (FEI, Hillsboro, OR, USA), and a protective layer of Au or C was deposited with a sputter coater before the lamella preparation. Since the TiO2 film surface is rough, a layer of about 100 nm thickness was deposited. Au or C was used to prevent the transitions in the EDX from overlapping with the material of the NPs. A Pt or C layer was then deposited onto this protective layer using first electron-induced deposition (5 keV, 3.2 nA) of approximately 200 nm and afterwards ion-induced deposition (30 keV, 83 pA) of approximately 800 nm in a small defined rectangular area for lamellae preparations. Sample cutting and polishing were carried out with the focused ion beam at a beam energy of 30 kV and beam currents ranging from 240 pA down to 83 pA. The sample thickness was < 75 nm. The imaging of TEM lamellas was carried out with a JEOL JEM-F200 instrument operated in STEM mode at a beam energy of 200 kV.
A scanning mobility particle sizer (SMPS, TSI, Shoreview, MN, USA) consisting of a soft X-ray neutraliser (Model 3087), electrostatic classifier (Model 3080), DMA (Model 3085) and CPC (Model 3776) was used to monitor particle size distributions. The instrument was operated with a 1.5 L min−1 sample flow and a 15 L min−1 sheath air flow and a scanning range of 1.5 to 64 nm with a theoretical 50 % detection efficiency diameter (D50) of 2.5 nm of the CPC.
3.1 Metal nanoparticles
3.1.1 Particle morphologies
Au, Pt, Cu and Ni metal NPs were generated with the SDG and collected for 2 h, approximately 1.3 s after exiting the spark generator, by diffusion onto TEM grids. They were then analysed via TEM for their morphology. Figure 2 shows TEM micrographs of all four metals, with particle sizes ranging between < 2 and > 50 nm for all metals. The significant differences in number concentrations and morphologies are summarised in Table 1. Smaller particles are overrepresented in the micrographs of Fig. 2 due to the deposition via diffusion.
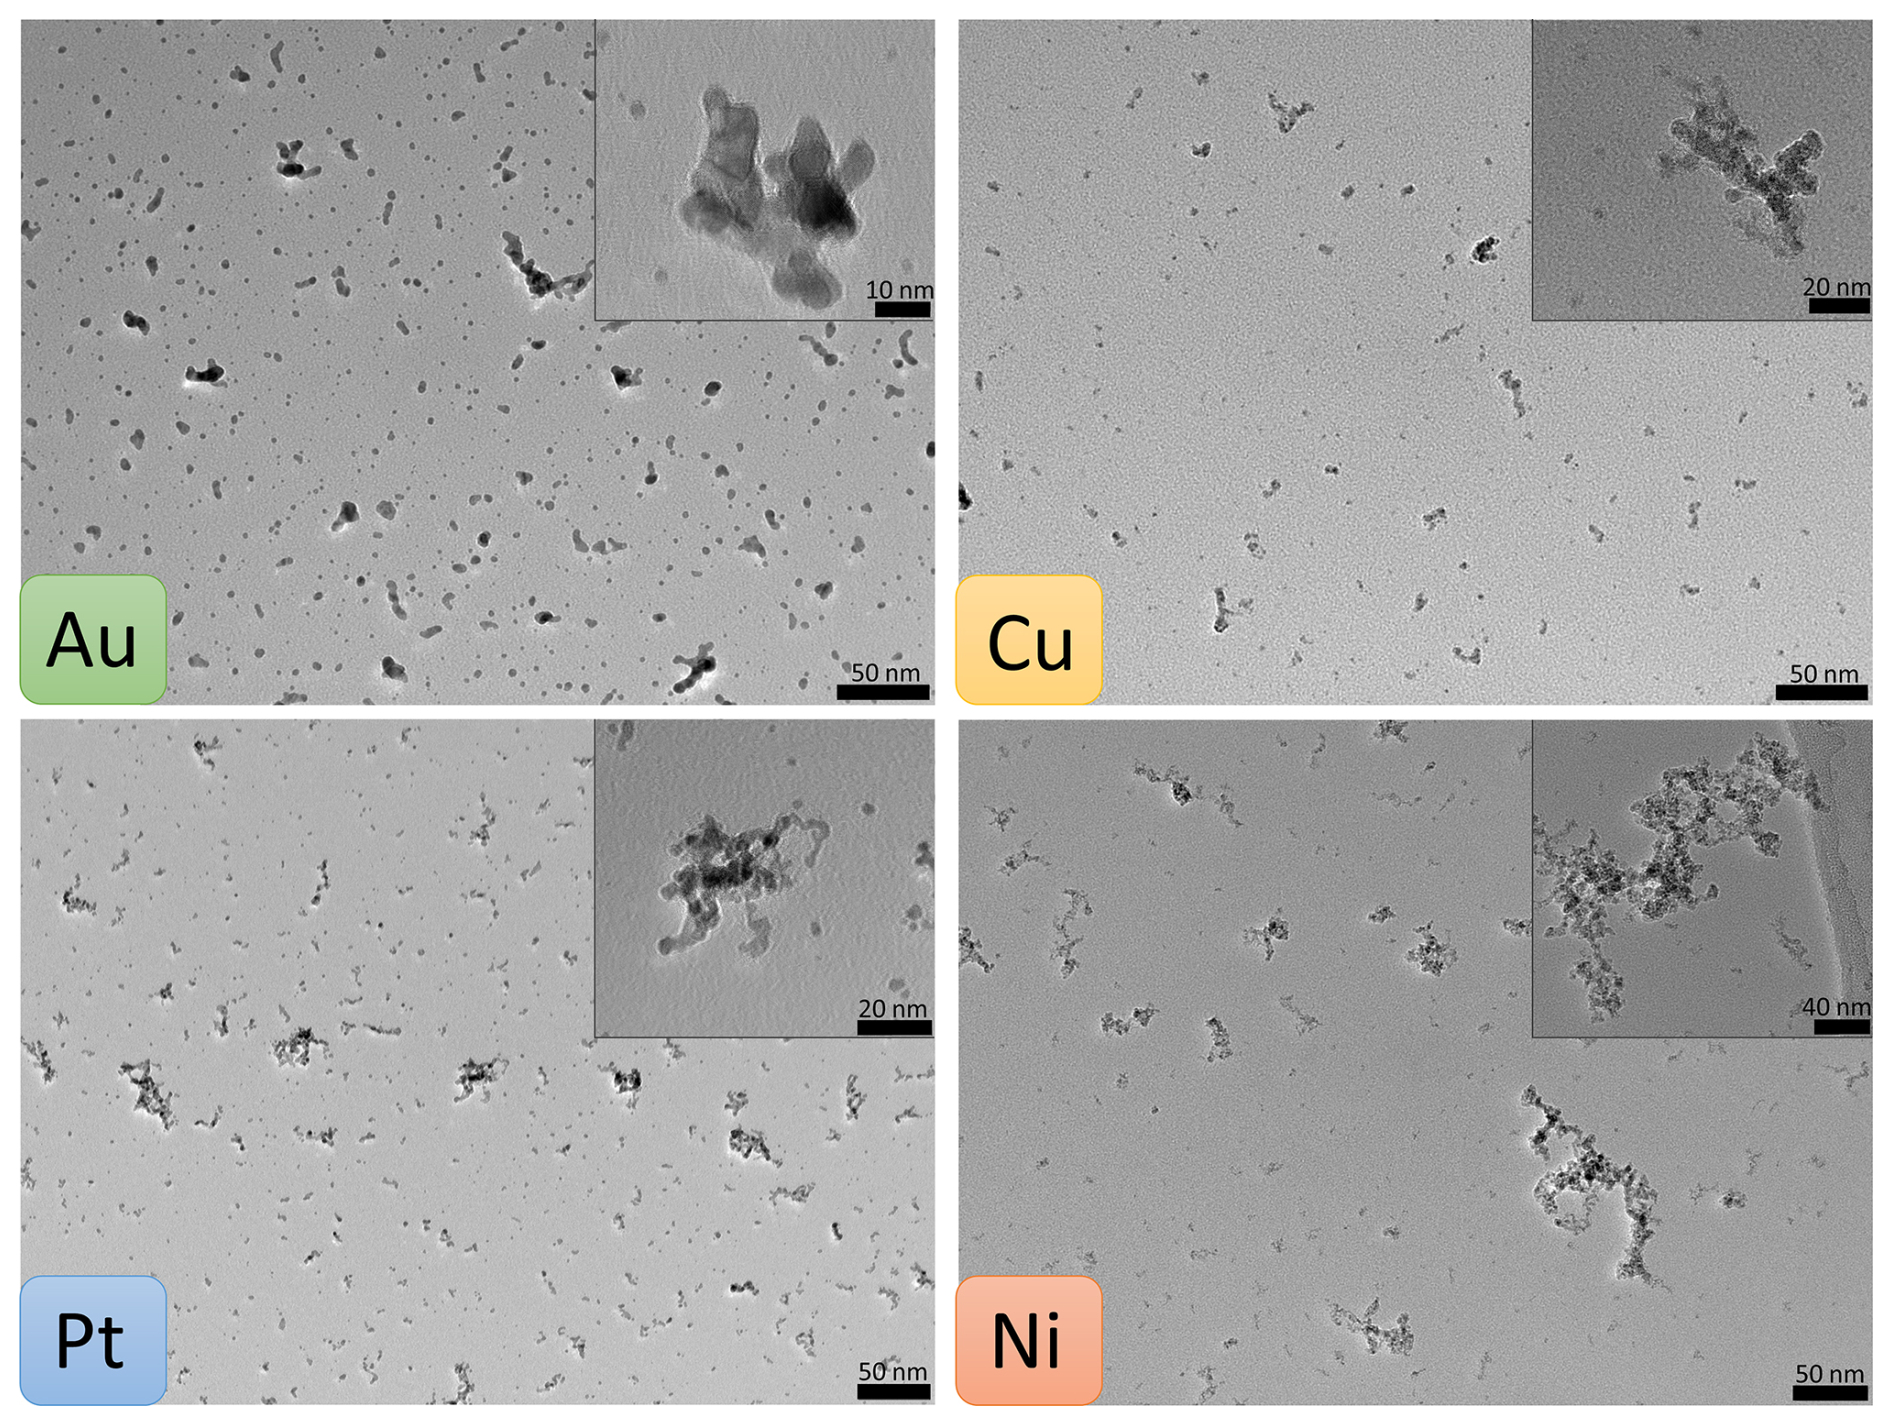
Figure 2TEM micrographs of spark-generated Au, Cu, Pt and Ni NPs. The aerosol particles were collected via diffusion 1.3 s after generation for a collection time of 2 h. Morphologies range from mostly spherical (Au) to increasingly fractal-like (Pt, Cu, Ni) particles.
Table 1Parameters to quantify particle morphologies for NPs generated via spark ablation collected after 1.3 s coagulation time and data on melting point depletion of NPs. Errors in circularity and fractal dimensions indicate standard deviations of all analysed particles, and error estimates of the maximum diameter of spherical particles (i.e. the projected area equivalent diameters) are detailed in Appendix A.
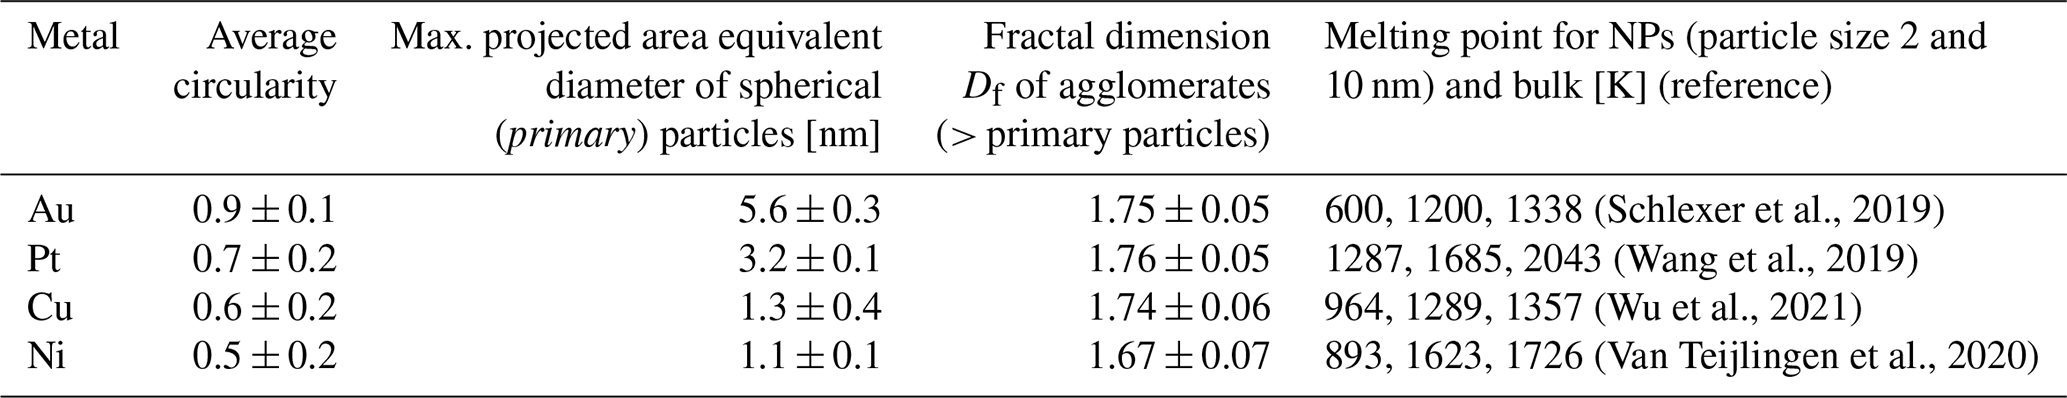
The particle morphology was assessed by calculating their circularity using Eq. (1), with values between 0 and 1. A circularity value of 1 corresponds to fully spherical particles, and increasingly smaller values indicate more and more elongated shapes. Au particles are most spherical with an average circularity of about 0.9 (Table 1), whereas Cu and Ni have average circularity values around 0.55.
Au formed fully spherical (i.e. coalesced) particles up to almost 6 nm, whereas for Pt, Cu and Ni this threshold was at 3.2, 1.3 and 1.1 nm, respectively. Fully coalesced particles were defined as primary particles by Tabrizi et al. (2009). The maximal size of primary particles was determined from particle circularities plotted against the projected area equivalent diameter for each metal (Fig. A1). The data were fitted with a logistic function, and a decrease of the fit of 10 % with increasing size relative to the starting value was defined as the maximal primary particle diameter; 10 % was chosen to ensure persisting sphericity. For larger particles, aggregates (i.e. partially coalesced primary particles) and agglomerates (i.e. loosely combined particle assemblies) were observed abundantly. Thus, the sphericity is an effective parameter to quantify primary particle upper size limits.
Reasons for particle morphologies to differ between the four metals are manifold. Particle growth is strongly dependent on material, size and temperature. Initial coalescence occurs within the spark generator under rapid cooling of the supersaturated vapour. However, coalescence and aggregation can continue well below the bulk melting points of the individual metals (Lehtinen and Zachariah, 2002). Significantly lower melting points for particles in the low-nanometre size range compared to bulk values have been estimated (see Table 1) because of the increased surface-to-volume ratio associated with large internal stress (Buffat and Borel, 1976; Castro et al., 1990). As we generate particles as small as 1 nm, this melting point depression likely has a notable effect on the particle morphologies observed here, resulting in a more pronounced coalescence and therefore a relatively late onset of agglomeration. Temperatures in Table 1 were obtained from the literature using a thermodynamic liquid nucleation and growth model or molecular dynamics simulations. According to these models, Au NPs experience the lowest melting points (600 K for 2 nm particles; Table 1), which could explain the large diameter of primary Au particles of up to about 5.6 nm, whereas Pt exhibits the highest melting points, which might explain the lower primary particle size observed here. It is further reported that for Au particles, liquid-like behaviour, i.e. having a high mobility surface layer, occurs down to room temperature (Arcidiacono et al., 2004; Kofman et al., 1994). Multiple studies describe Au particles smaller than approximately 3 nm as being liquid-like at room temperature (Castro et al., 1990; Feng et al., 2016; Pfeiffer et al., 2015).
For Cu and Ni particles a substantial melting point depression is estimated as well, but their primary particles are smaller than for Au and Pt. These elements are more prone to surface oxidation than Au and Pt (Barr, 1978; Payne et al., 2009), which results in higher melting points than estimated for the pure metals, preventing further coalescence/aggregation (Gao and Gu, 2015; Olszok et al., 2023; Weber and Friedlander, 1997). The present oxygen impurities prevent the movement of the grain boundaries by pinning them (i.e. the thermal energy needed to increase the typically single crystal primary particles in size is higher and thus prevents further growth) (Seipenbusch et al., 2003). Even though we use high-purity (99.99 %) electrodes, oxygen impurities in the carrier gas in the low parts-per-million range used in our study lead to the formation of oxide layers for Cu and Ni (Hallberg et al., 2018; Olszok et al., 2024).
Other publications presented similar findings (Grammatikopoulos et al., 2014; José-Yacamán et al., 2005) as shown here, and Feng et al. (2016) developed a model to describe the evolution of the primary particle size and concentration.
Further particle growth via agglomeration can be described quantitatively via the fractal dimension Df of the particles (Table 1) (Eggersdorfer and Pratsinis, 2012; Olszok et al., 2021). Df values between 1.67 ± 0.07 and 1.76 ± 0.05 were determined for the four metals from TEM micrographs using box counting analysis (Pashminehazar et al., 2019). These values are in good agreement with the literature for diffusion-limited cluster–cluster aggregation of 1.77 ± 0.03 (Eggersdorfer and Pratsinis, 2012). This matches the findings of a previous study (Olszok et al., 2021) stating that spark-generated aerosol particles are formed via diffusion-limited cluster–cluster aggregation. Agglomerate morphologies align with NP structures found in previous publications (Debecker et al., 2024; Tabrizi et al., 2010).
3.1.2 Particle losses within the spark generator
Particle losses inside the spark generator were estimated for all four metals by comparing the mass of metal NPs collected on a filter for 6 h immediately after the SDG with the mass that was ablated from both electrodes during the collection (Table 2). The electrode mass loss is lowest for Cu with 17 µmol and goes up to 82.5 µmol for Ni. The particle mass collected on filters ranges between 5 µmol (Au and Cu) and 37 µmol (Ni). Particle losses within the spark generator are substantial and range between 54 % (Ni) and 91 % (Au). The majority of the losses can be attributed to losses immediately after NP generation mainly due to diffusion in the turbulent flow regime of the spark chamber. Additionally, the high electric and magnetic fields present in the plasma of the spark result in charging of larger particles and thus electrostatic losses (Meuller et al., 2012; Schmidt-Ott, 2019; Tabrizi et al., 2009). Furthermore, collection efficiencies on the filters are close to 100 % (Hinds, 1999) and increase slightly as the loading on the filter increases. This leads to a slight underestimation of the particle mass.
Table 2Mass of ablated electrode material for each metal with data on boiling and melting points as well as thermal conductivities obtained from Tritt (2005). Mean and standard deviation of triplicate measurements are given.
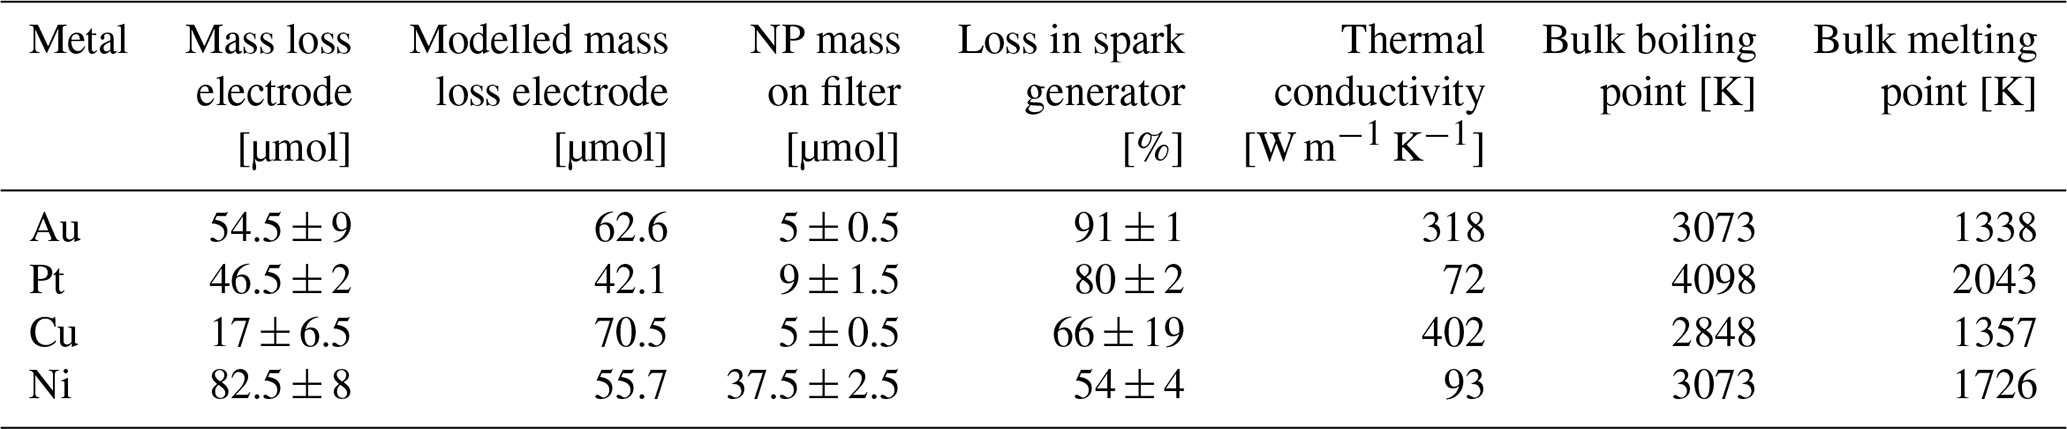
The total amount of ablated material strongly depends, among other factors described further below, on the thermal properties of the metals. Lower thermal conductivities lead to a less effective cooling of the electrode material and hence more evaporation (Tabrizi et al., 2009; Tritt, 2005). Furthermore, lower boiling points also lead to more evaporation. Hence, the highest ablated electrode mass of Ni could be explained by the low thermal conductivity combined with a low boiling point. This large ablated mass of Ni explains the large number of agglomerates > 20 nm seen in Fig. 2. Au and Pt mass loss is similar because Au has a lower boiling point but a higher thermal conductivity than Pt. Cu has a similarly low boiling point to Au but exhibits significantly less mass loss. This highlights again the strong influence of the thermal conductivity (which is almost 30 % higher for Cu compared to Au) on the mass production, as is also shown in Loizidis et al. (2024).
The higher relative losses of Au, Pt and partially also Cu in the SDG could be explained by a lower vapour density in the electrode gap (i.e. less electrode mass loss compared to Ni) and thus slightly slower particle growth rates, which lead to more diffusional losses. Ni vapour, however, is denser, particle growth is quicker and thus the diffusional losses are smaller. There are multiple studies investigating mass ablation rates (Domaschke et al., 2018; Schmidt-Ott, 2019; Tabrizi et al., 2009), most referring to the energy balance equation by Jones (1950). The equation was implemented for all four metals (Table 2) using a factor of 0.0005 as the fraction of the spark energy, which is transferred to the hot spot (i.e. the location where the spark hits the electrode; Schmidt-Ott, 2019); this factor is similar to what was determined by Pfeiffer et al. (2014). For Au, Pt and Ni measured and modelled electrode mass losses agree well within a factor of 2, and for Cu the two values are within a factor of about 4.
Furthermore, oxidation of the aerosol particles during generation as well as on the filter leads to an increase in total particle mass on the filter. This effect is most pronounced for the non-noble metals Cu and Ni but could also occur to some degree for Pt. Thus, the mass losses within the spark generator are likely underestimated.
3.1.3 Aerosol particle size distributions
Figure 3 shows particle size distributions determined from TEM micrographs for all four metals with modes ranging from 2 nm (Pt and Cu) to about 3–4 nm (Au and Ni) for the shortest coagulation time of 1.3 s and increasing modes for the two longer coagulation times. Particle sizes (i.e. the projected area equivalent diameters) are log-normally distributed as expected given the single source of the particles (Hinds, 1999). Total number concentrations for the shortest coagulation time are largest for Au and Pt and more than 60 % lower for Cu and Ni.
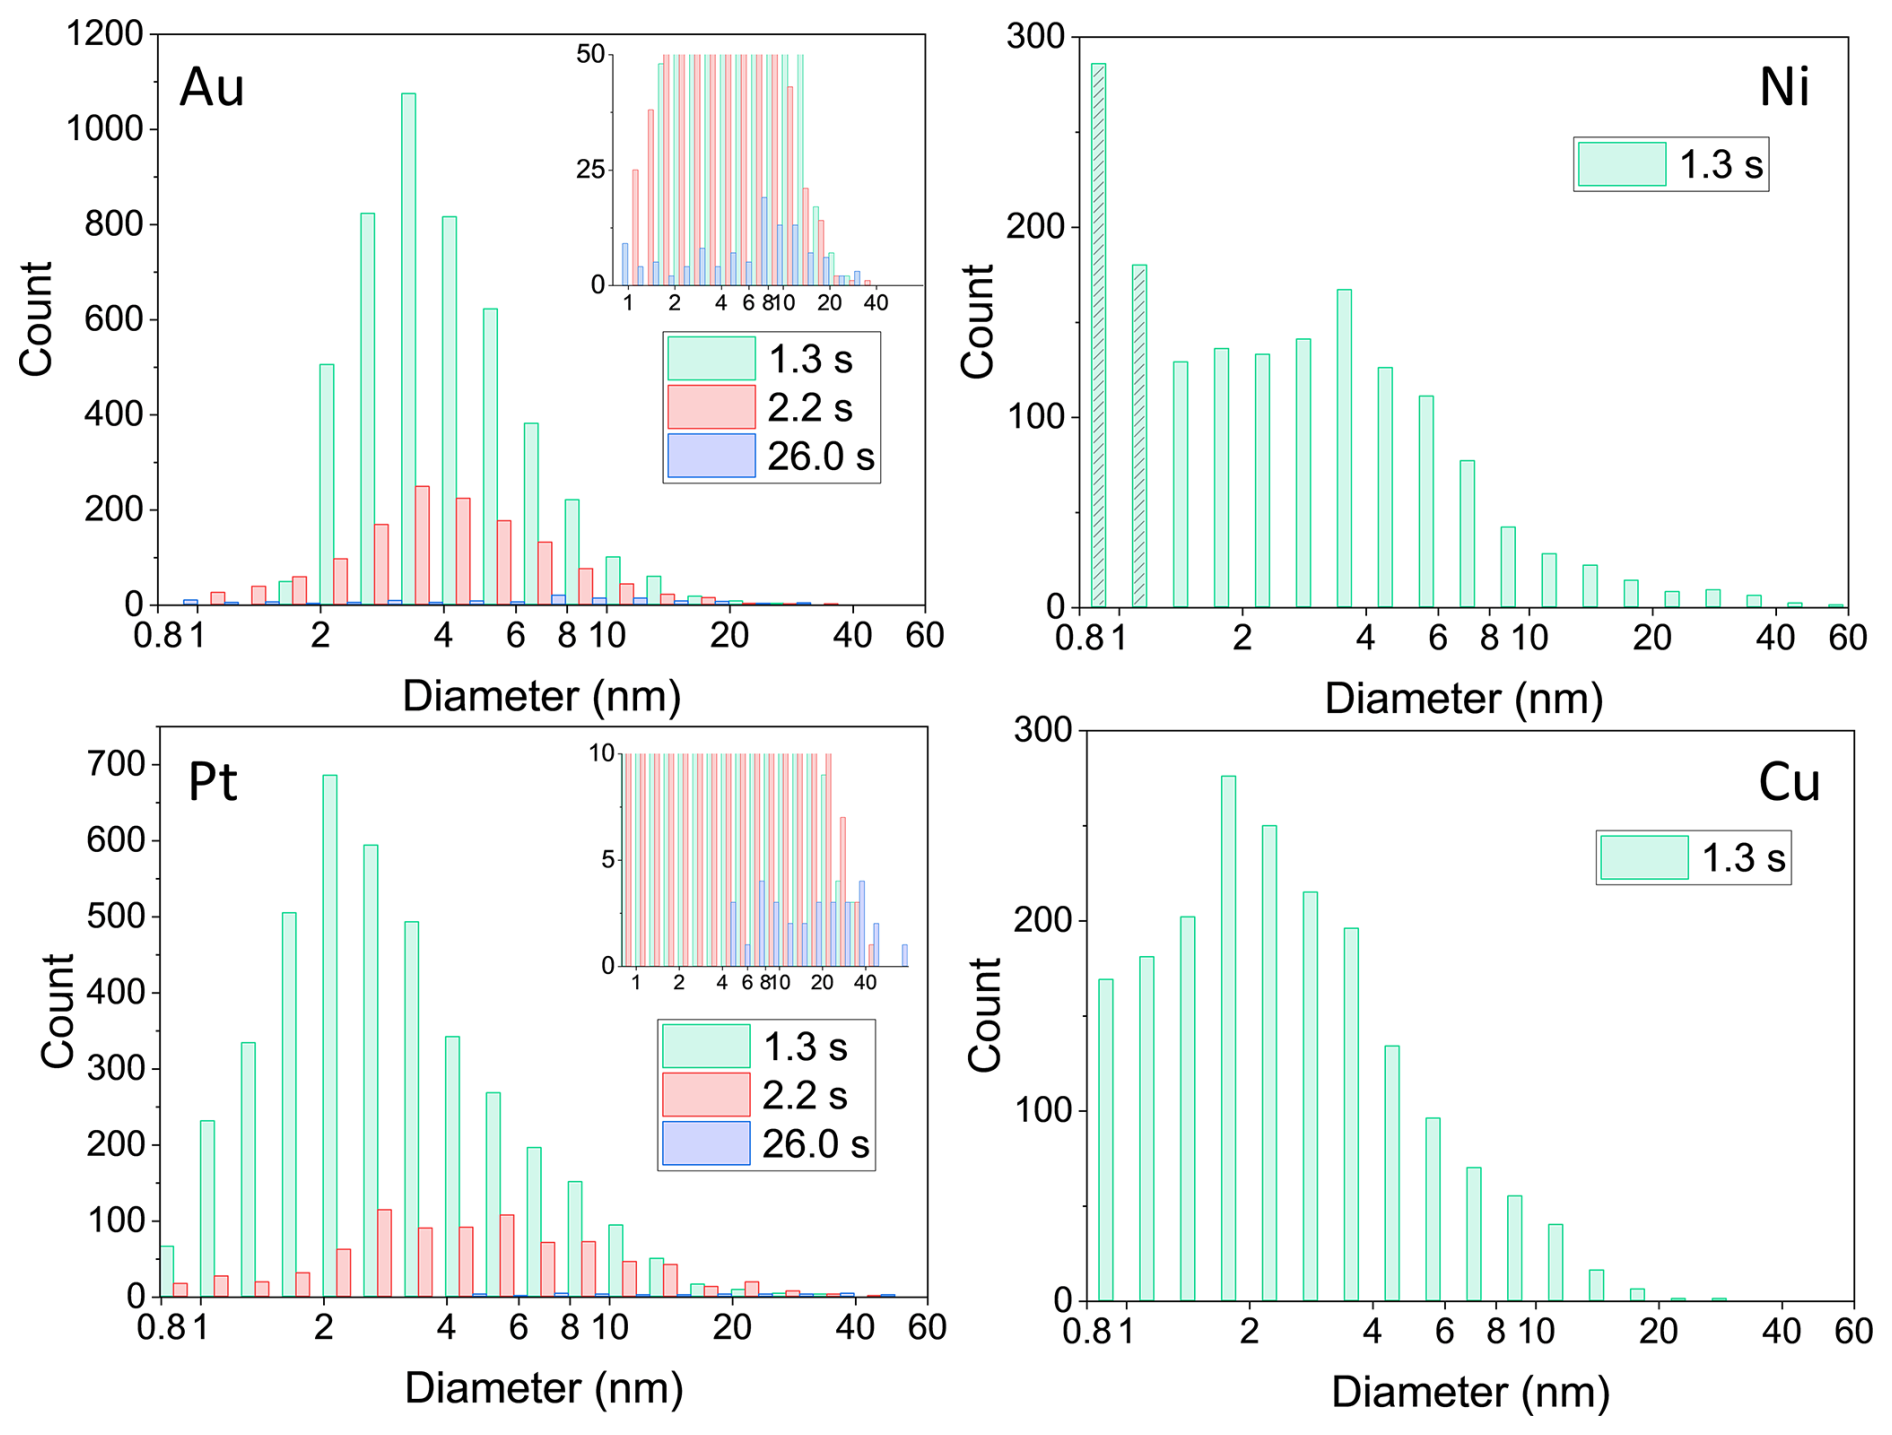
Figure 3Metal NP number size (i.e. the projected area equivalent diameters) distributions determined from TEM micrographs with ImageJ within 1 µm2 of a TEM grid for up to three coagulation times: 1.3, 2.2 and 26.0 s for Au and Pt and 1.3 s coagulation time for Ni and Cu. After a coagulation time of 1.3 s, particle modes range from 2 nm (Pt and Cu) to approximately 3–4 nm for Au and Ni. Particle concentrations are significantly higher (> 250 %) for Au and Pt compared to Cu and Ni. The shaded bins for Ni indicate an overestimation of the smallest particles. Insets for Au and Pt show the strongly decreased size distributions after a particle coagulation time of 26.0 s.
For the longer coagulation times (2.2 and 26.0 s), fewer particle numbers are observed due to increased coagulation (resulting in to a shift of the mode to larger diameters) and diffusional losses to the tube walls (Appendix C). For Ni and Cu, size distributions for the longer coagulation times could not be determined due to the overall smaller particle concentrations resulting in poor counting statistics. Difficulties in particle detection in TEM for Cu and Ni also arise due to the lower resolution of the NPs during imaging for these two elements, which depends, for example, on the atomic number (∝Z2) and the thickness of particles. Thus, given the lower atomic numbers of Cu and Ni (Z 29 and 28, respectively) and the smaller primary particles, Cu and Ni particles suffer from a lower resolution compared to Au and Pt (Z 79 and 78, respectively) particles. Although enhanced contrast can be achieved via image manipulation in ImageJ, the detection of particles with a diameter of a few nanometres is still challenging. The shaded bins in the case of Ni indicate the overestimation of the smallest particles due to the lower signal-to-noise ratio during particle detection with ImageJ.
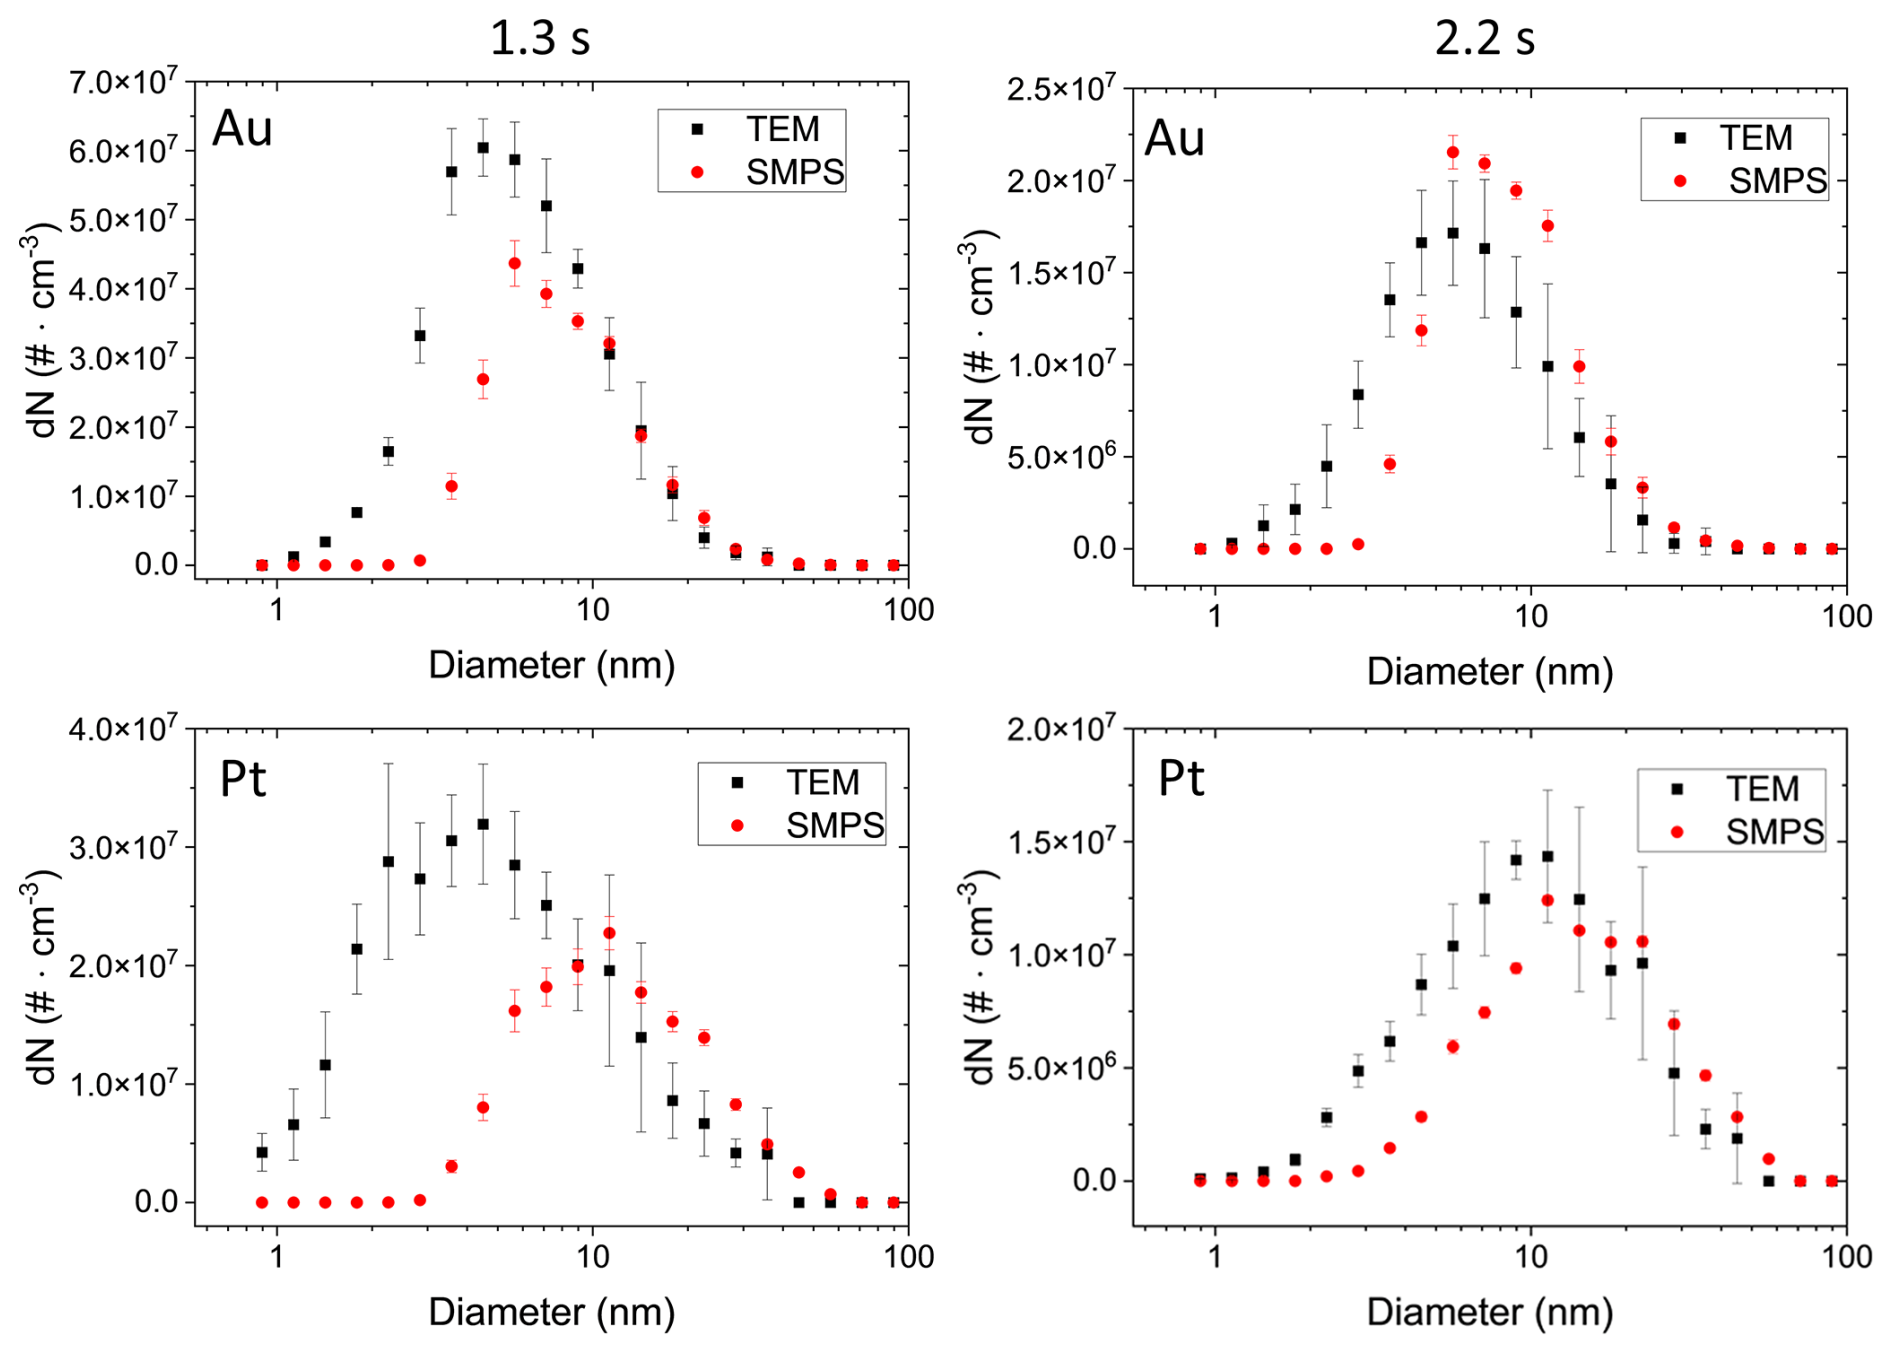
Figure 4Aerosol number size distributions estimated from TEM micrographs of Au and Pt NPs. The NPs were collected via diffusion for 2 h for coagulation times of 1.3 and 2.2 s and subsequently used to calculate the aerosol distributions (in black). In red, as a comparison, simultaneously measured SMPS distributions are plotted. Errors in the calculation consist of the propagate statistical error from triplicate measurements. SMPS error bars consist of the standard deviation of the scans taken for a 1 h average.
Particles are deposited on TEM grids due to diffusion in a laminar flow regime. This results in an overestimation of the smaller particles compared to the larger particles, and therefore the size distribution displayed in Fig. 3 is skewed towards smaller particle sizes compared to the size distribution present in the aerosol phase. This collection artefact can be corrected for, assuming that Brownian diffusion was the dominant particle collection process on the TEM grids. Thus, in determining the diffusion “losses” (i.e. diffusion onto the grid) per size bin knowing the dimension of the collection chamber, the flow rate and the diffusion coefficient of the particles, the particles number size distributions in the aerosol flow after a coagulation time of 1.3 and 2.2 s, respectively, could be calculated for Au and Pt (Fig. 4, black data). As expected, modes of the calculated size distributions in Fig. 4 are shifted by approximately 1–2 nm to larger sizes compared to the histograms in Fig. 3.
Figure 4 also displays the aerosol particle size distribution measured with an SMPS (red data). For particle sizes > 10 nm, the concentrations calculated from TEM analysis and measured by SMPS align well for all four examples shown in Fig. 4. For particles smaller than 10 nm, differences in the two size distributions become more pronounced the smaller the particle diameters are, due to the limited counting efficiency of the SMPS (DMA Model 3085, CPC Model 3776, TSI) at particle diameters below 5 nm. This leads to an underestimation of particles in this size range using the SMPS data. The TEM-derived size distributions of Au and Pt for a coagulation time of 1.3 s indicate that nearly 50 % and 60 %, respectively, of all particles have a diameter < 5 nm. A comparison of coagulation times 1.3 and 2.2 s shows the growth of the mode of the size distribution for Au and Pt particles as is expected for longer coagulation times due to Brownian diffusion. Hence, for a coagulation time of 2.2 s, the SMPS distribution aligns more closely with the calculated TEM distribution (Fig. 4).
Although TEM-derived particle sizes and SMPS measurements agree well for > 10 nm particles, larger particles are affected by sampling uncertainties and thus larger errors in Fig. 4: due to the smaller number concentrations of particles > 10 nm, counting uncertainties increase for these sizes. Where several hundred or thousands of < 10 nm particles diffuse onto the grid per µm2 within the sampling time of 2 h, larger particles are only collected at significantly lower numbers on the grid (Fig. 3). Moreover, smaller particles can more easily be assumed to be spherical, whereas particles > 10 nm are mostly agglomerates. This results in an underestimation of the larger particles due to lower diffusion constants of non-spherical particles compared to spherical ones (Moskal and Payatakes, 2006; Wang et al., 2017). Furthermore, uncertainties in particle diameters increase for larger, fractal-like particles because the assumption of circular shapes becomes less accurate.
For Ni and Cu, challenges in particle detection with ImageJ (see discussion above) prohibited a detailed analysis. However, the results of the analysis for a coagulation time of 1.3 s can be found in Fig. A3 in Appendix A.
3.2 Metal nanoparticle coating on TiO2 nanoparticles
3.2.1 Morphology of metal nanoparticle coating
All four metal NPs, generated as described above, were mixed and coagulated with nebulised TiO2 substrate particles (mode 120 nm, concentration about 8 × 10⁶ particles cm−3) for 26 s and analysed with TEM, STEM and EDX. TEM micrographs (Fig. 5) show significant differences in the coating with Au, Pt and Ni metal particles. Au and Pt exhibit a high density of “island-like” coating, i.e. the presence of individual metal NPs on the TiO2 surface, which are visible clearly at the edges of the TiO2 substrate particle. Further towards the centre of the TiO2 particles, the metal NPs are less visible due to the thick layer of TiO2 particle, which leads to a decrease in contrast for the metal particles.
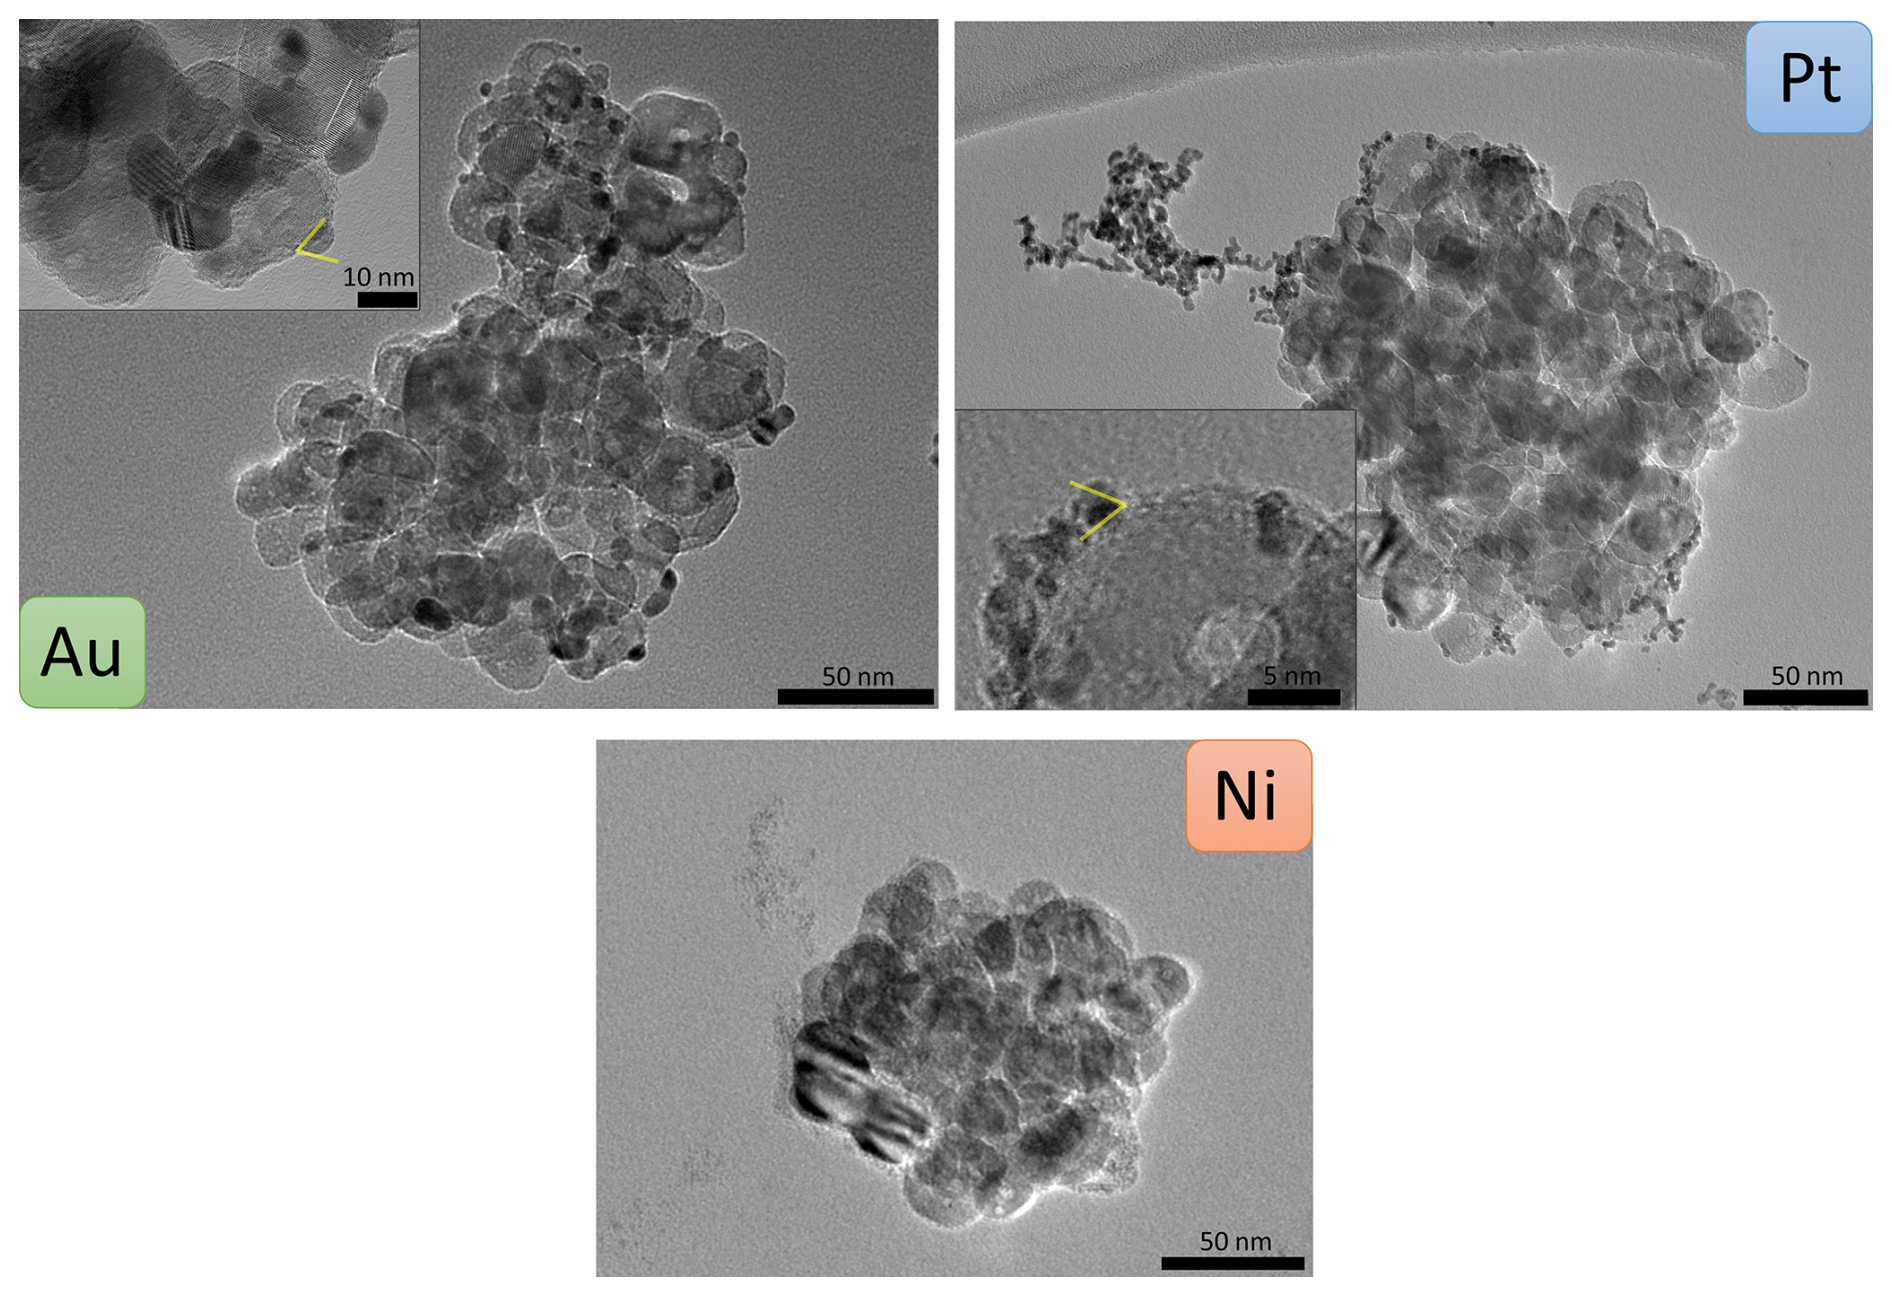
Figure 5TEM micrographs of TiO2 substrate particles coated with Au, Pt or Ni NPs. Au and Pt NPs correspond to the small darker structures mainly visible at the edges of the substrate. Ni NP coating appears brighter than the substrate and is only visible on the left edge of the substrate particle. Insets for Au and Pt provide details on individual primary particles and small agglomerates as well as indicated contact angles.
For Au, the coating consists predominantly of primary particles, and for Pt, a mix is observed between primary particles and agglomerates with sizes up to well above 50 nm. For Ni and Cu, no clear qualitative assessment of the coating was possible because these two metals produce significantly smaller primary particles in the spark generator (Table 1) and exhibit lower contrasts in TEM. While for Ni fractal-like particles are faintly visible at the edge of the TiO2 substrate particle, no coating was detectable for Cu (Fig. B1). Thus, all further results and discussion on Cu can be found in Appendix B.
The coating behaviour depends on various factors such as the thermodynamic properties of the two involved particle types and the size and number concentration of the coating particles. Surface wetting, i.e. the tendency of a liquid or liquid-like particle to spread and adhere to a substrate particle (TiO2), is a key concept to describe the coating (Huhtamäki et al., 2018). Wetting depends on the particle size and the surface free energies of the involved species (Huhtamäki et al., 2018), i.e. metals and TiO2 in our study. Metal particles of a few nanometres in size can be considered liquid or liquid-like as discussed previously. When such particles coagulate with TiO2, they can rearrange depending on the relative surface free energies of metal and TiO2. If the metal has a lower surface free energy than the substrate species, surface wetting occurs, which can lead to the formation of a smooth coating layer (Pfeiffer et al., 2015). Values for the surface free energies vary strongly in the literature and depend on the techniques used to determine them, the crystal structures, and the temperature and pressure of the measurement. TiO2 has a surface free energy ranging between 0.6 and 1.3 J m−2 (Labat et al., 2008). Values for Au, Pt, Cu and Ni range between 1.4 and 1.9 J m−2 (Kinloch, 1987; Tyson and Miller, 1977). Both Au and Pt primary particles experience a slight wetting on the TiO2 surface as can be seen in the insets of Fig. 5. A contact angle (Young angle) of 67 ± 4° for Au and of 60 ± 4° for Pt was measured, i.e. well below 90°, which was expected given that TiO2 has a similar surface free energy as the metal NPs. Therefore, partial wetting rather than a smooth coverage is expected. The contact angle measurements are depicted in greater detail in Appendix A (Fig. A2). Ni and Cu likely exhibit the same behaviour due to the similar surface free energies; however, this could not be confirmed from our TEM analyses as discussed above.
3.2.2 Size and concentration of metal nanoparticle coating
STEM micrographs and EDX spectra were recorded for Au, Pt and Ni NPs on TiO2 particles to assess the number size distributions of the metal NPs that coagulated with TiO2 (Fig. 6). EDX provides spectral maps which show the spatial distribution of the elements present in the sample and thus allows one to distinguish between TiO2 substrate and metal coating also in the centre of a TiO2 particle. The EDX signal was integrated over 1 h in order to achieve the highest possible resolution without disintegrating the particle due to exposure to the high-energy electron beam. Figure 6 depicts the EDX recordings of the coating for Au, Pt and Ni (green) on TiO2 particles (blue). In STEM micrographs (Fig. 6) the spatial distribution of metal NPs on TiO2 particles is also clearly visible, particularly for Au and Pt due to the dependence of the contrast in STEM analyses on the atomic number of the analysed elements.
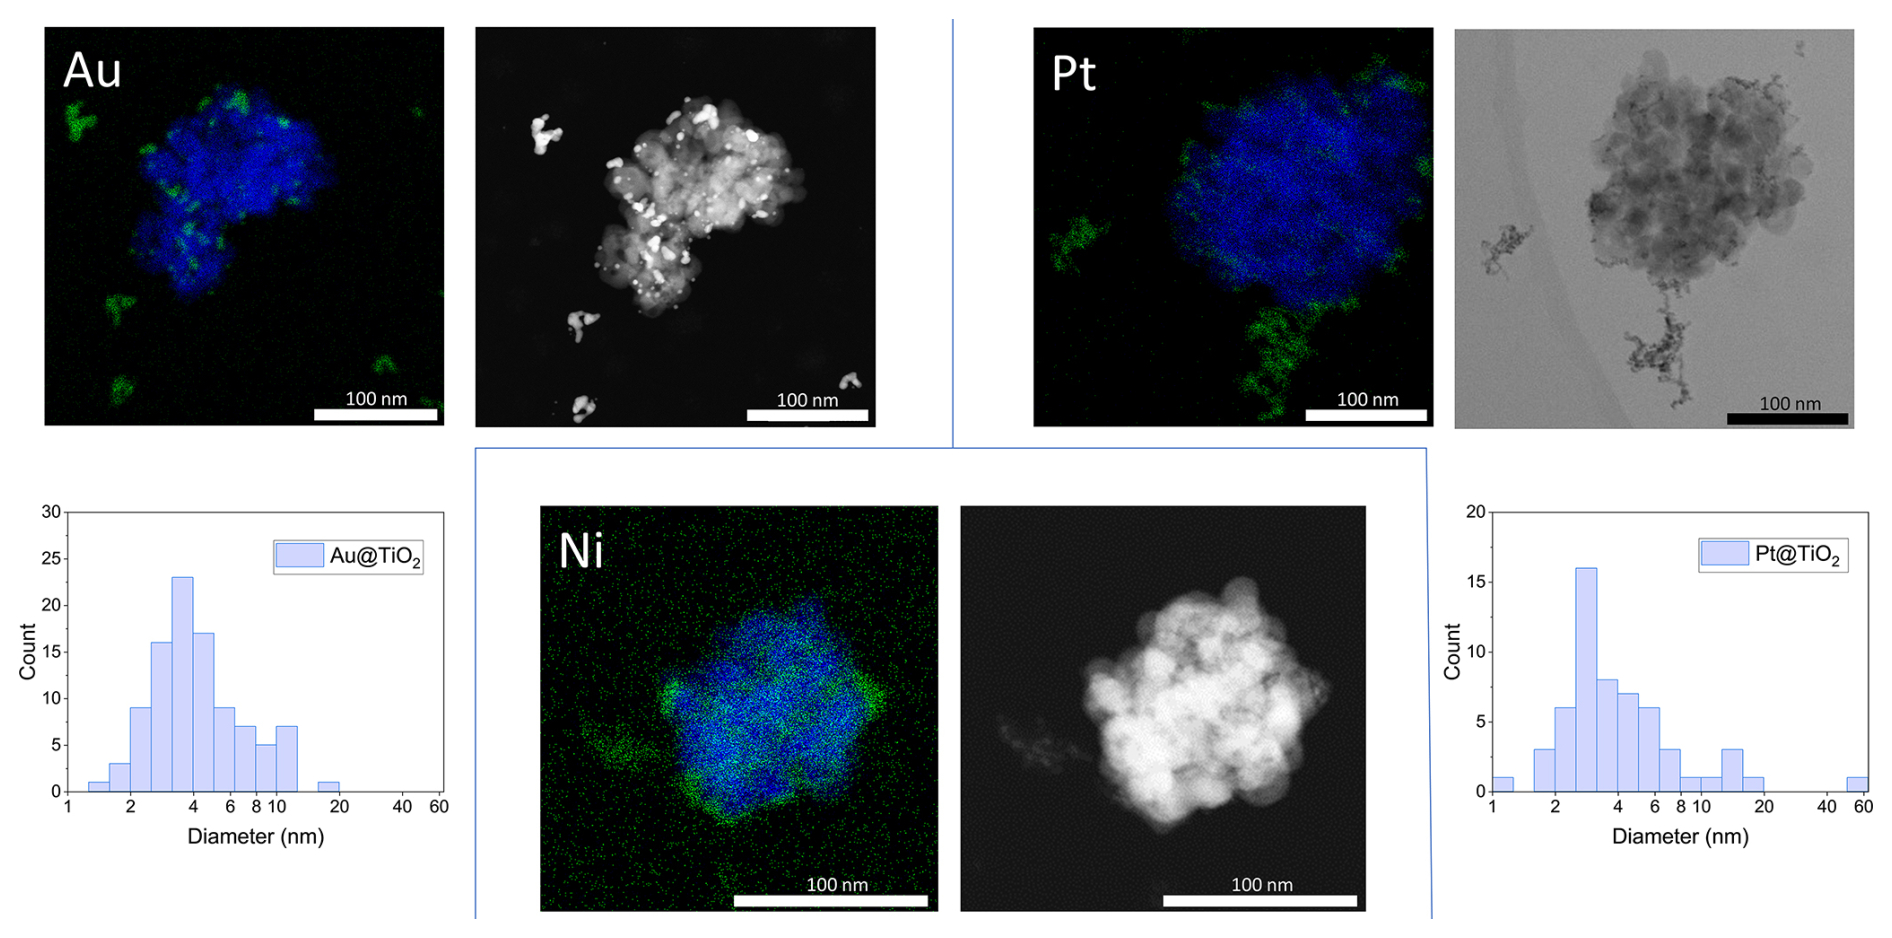
Figure 6STEM–EDX spectral mappings (TiO2: blue, coating metals: green) and STEM micrographs (black and white) of TiO2 substrate particles coated with Au, Pt or Ni. For Au and Pt, additional histograms of the number size distributions of the coating particles (i.e. “Metal@TiO2”) are displayed.
Au and Pt coating particles are log-normally distributed on the substrate with a mode of approximately 3.5 nm for both metals (see histograms in Fig. 6). This is slightly lower than the mode of the aerosol particle distributions of around 5 nm (Au) and 4 nm (Pt) determined in Fig. 4. These discrepancies can be explained by the particle size dependence of the Brownian coagulation, where the large TiO2 particles scavenge smaller metal particles with a higher efficiency than larger metal particles similar to the particle distributions on the TEM grids (Figs. 2 and 3), which over-represent concentrations of smaller NPs.
The Ni NPs coating on TiO2 could only be characterised qualitatively with EDX. Figure 6 shows > 10 nm Ni agglomerates attached to the TiO2 surface, similar to the coating of Pt. Ni particles < 10 nm are likely also present, but visualisation proved to be challenging given the smaller size of the primary particles compared to Au and Pt (Table 1).
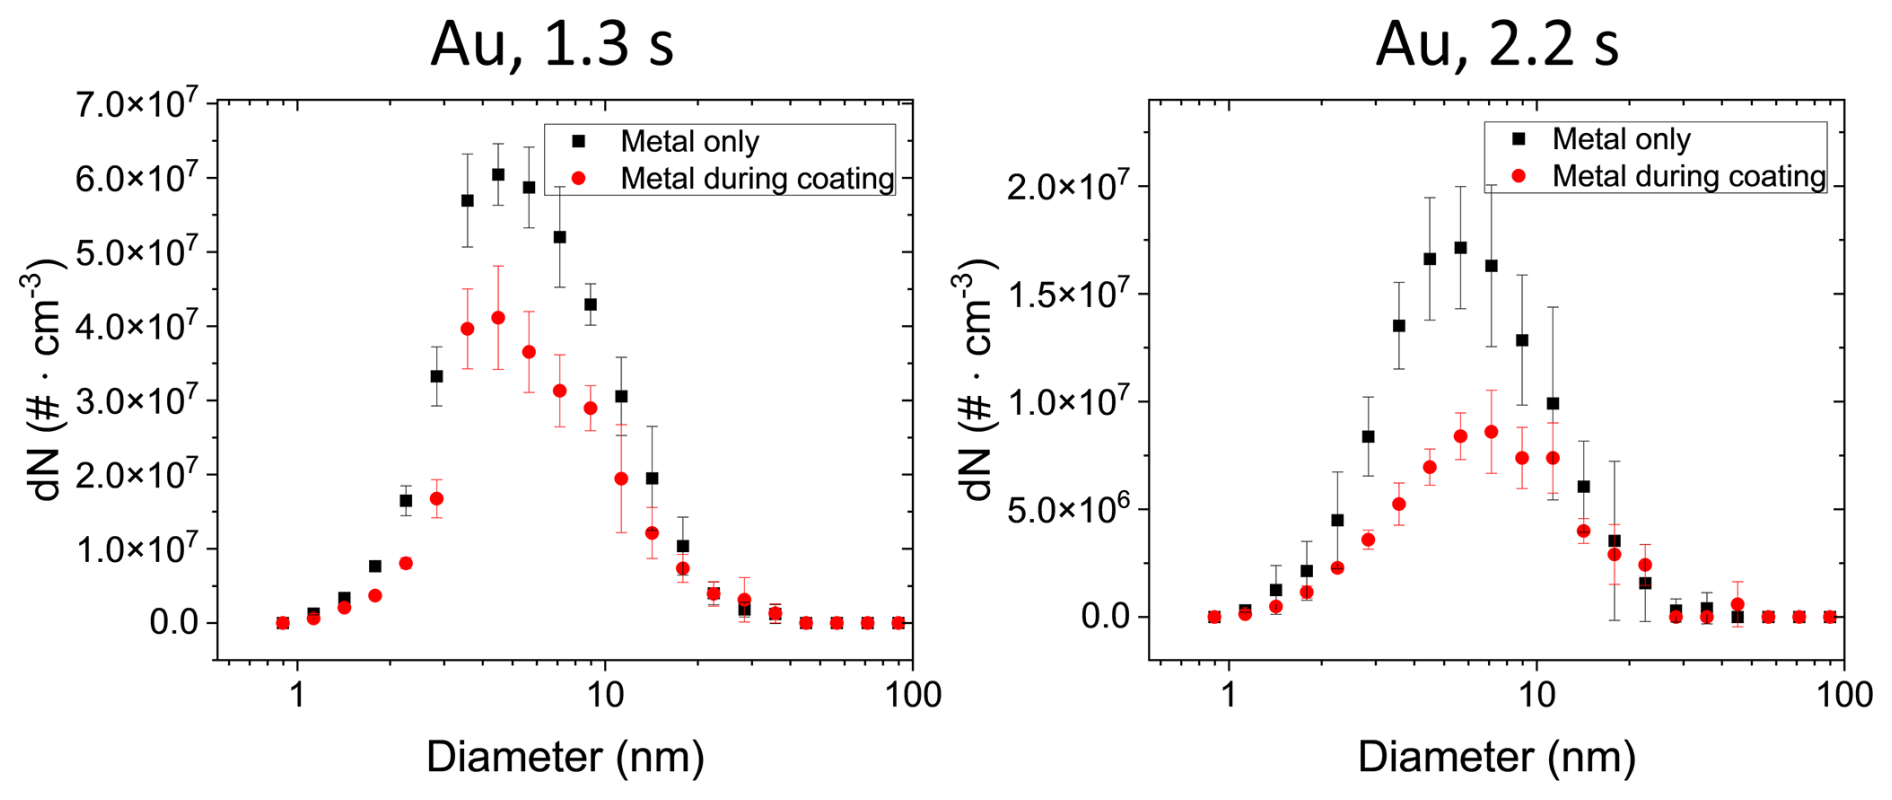
Figure 7Aerosol number size distributions estimated from TEM micrographs of uncoated Au NPs for mono-modal coagulation or bi-modal coagulation with TiO2 NPs. For both coagulation times of 1.3 and 2.2 s, the metal distributions during the coating (red, “Metal during coating”) were significantly lower than during experiments when TiO2 was absent (black, “Metal only”). This decrease in particle concentration is directly related to the TiO2 particle coating with Au NPs. Error bars are shown for the propagated statistical error from triplicate measurements.
The particle size distribution of metal NPs coated on TiO2 was also assessed via TEM image analysis using the same approach as discussed for Fig. 4: the Au particle size distribution was calculated by counting the number and size of Au NPs on the TEM grids that did not coagulate with TiO2 particles when Au and TiO2 were mixed for 1.3 and 2.2 s. This was compared to the size distributions when no TiO2 particles were present in the setup (Fig. 4). The Au number concentration during coating (red data points in Fig. 7) is significantly lower than in the case when no TiO2 particles are present (black data points in Fig. 7). A reduction in the individual Au NPs (i.e. not attached to TiO2 particles) of nearly 50 % was determined (4.0 × 10⁸ particles cm−3 compared to 2.6 × 10⁸ particles cm−3 for 1.3 s coagulation time). This reduced concentration of individual Au NPs can be attributed to their coagulation (i.e. coating) with TiO2 and serves as a lower boundary for the coating efficiency of > 1 × 10⁸ particles cm−3, i.e. about 20 Au NPs per TiO2 substrate particle assuming 8 × 10⁶ TiO2 particles cm−3.
This is only a conservative estimate of the coating, because in the absence of TiO2 particles (black data, Fig. 7) Au–Au NP coagulation is more effective, lowering the total particle concentration, compared to conditions when TiO2 particles are present, where Au NP coagulation with TiO2 is a competing process to the Au–Au coagulation. Therefore, higher number concentrations of primary Au NPs are coagulating with TiO2 than estimated from the difference in the two number size distributions shown in Fig. 7. This underestimation of Au NPs coagulating with TiO2 is confirmed qualitatively by the larger (i.e. > 20) number of Au NPs counted on TiO2 particles with STEM/EDX analysis (Fig. 6, histogram Au@TiO2), where about 80–100 Au NPs per TiO2 particle were counted. Equivalent analyses were conducted for Pt, Ni and Cu. Due to increased uncertainties in particle detection and conversion to aerosol distributions, no clear decrease in metal NP number size distributions during coating can be determined for these three metals (Fig. A4).
To explore whether a denser coating of metal NPs on TiO2 particles could be achieved, we deposited NPs on TiO2 films via diffusion. The films were exposed for 6 h (Au and Pt) or 12 h (Ni) to a metal NP flow. Lamellas, i.e. thin cross sections of metal-coated TiO2 films, were then cut. The longer collection time for Ni was needed to improve the signal intensity in EDX due to smaller primary particles and lower aerosol particle concentration of Ni compared to Au and Pt. Cross-sections of the coated TiO2 substrate layers were measured with STEM and EDX as depicted in Fig. 8. For Pt and Ni, individual particles are visible (i.e. island-like coating; green in Fig. 8), which is in agreement with the observation of individual TiO2 coating particles shown in Figs. 5 and 6. Au particles appear to aggregate the most, and thus a continuous layer forms on the TiO2 surface (blue in Fig. 8) when exposed for 6 h. As discussed above, this can be explained by the absence of an oxide layer, which allows for partial coalescence and necking even at room temperature and thus facilitates the formation of a continuous layer. Pt and Ni show similar coating behaviours for particles > 10 nm. In contrast to Au, Pt and Ni both exhibit strong agglomerate formation with particles up to several hundreds of nanometres in size, and even at long exposure times of 6 h (Pt) or 12 h (Ni), no continuous metal layer forms on the TiO2 particle layer.
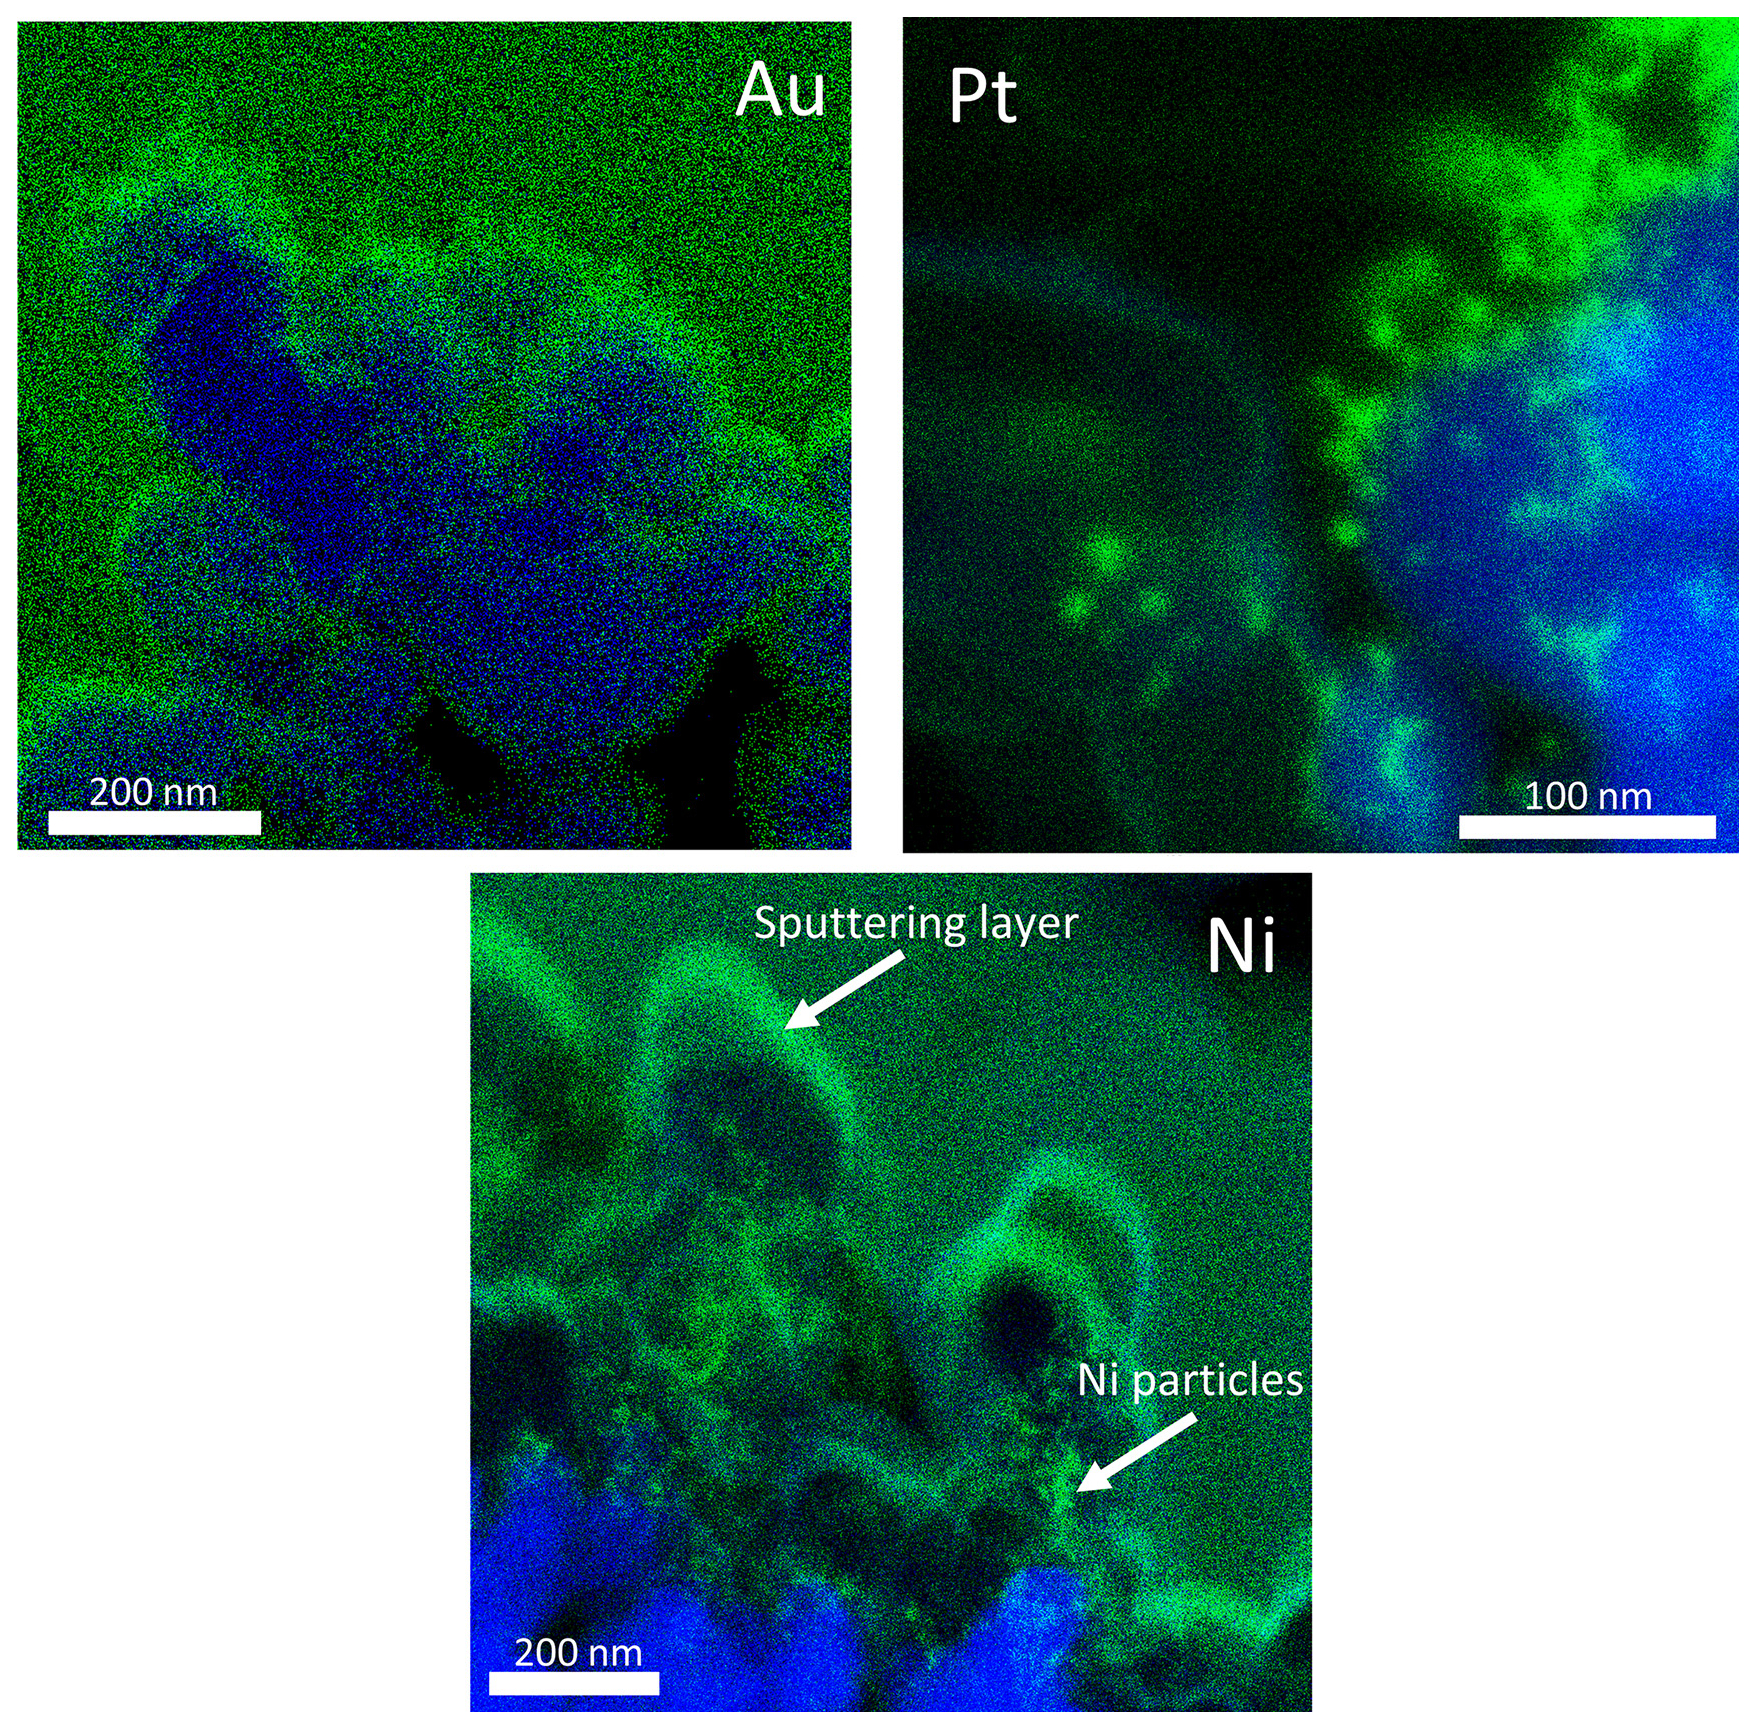
Figure 8EDX spectral mappings of the cross-section of TiO2 substrate films (in blue) coated with Au, Pt or Ni NPs (in green). The TiO2 films were exposed for 6 h (Au and Pt) or for 12 h (Ni) to a metal NP stream. White arrows in the Ni coating cross-section were added to distinguish between Ni NPs and the sputtering layer (see experiment section).
The smooth green-coloured area in the EDX mapping of Ni in Fig. 8 is due to the Au sputtering layer on the TiO2 film (see experiment section) and not due to Ni NPs. Only the faint-green fractal structures in the lower half of Fig. 8 correspond to Ni NPs, loosely attached to blue TiO2 particles (see arrows in Fig. 8). In addition to the EDX recordings presented here, STEM micrographs can be found in Fig. A5.
In this study we investigated spark-discharge-generated metal NPs and their coating behaviour on TiO2 substrate NPs in the aerosol phase. NPs of four metals (Au, Pt, Cu, Ni) were characterised for size and morphology. Using TEM measurements, aerosol particle number size distributions of particles as small as 1 nm with modes of the size distribution of 3–5 nm were determined, which poses a significant challenge for commonly used aerosol particle size measurement techniques. Differences in particle size and number distributions for the four metals could be correlated with their thermodynamic properties such as melting point combined with their oxidative properties.
Coating of the four metal NPs on TiO2 substrate NPs via coagulation was characterised with TEM, STEM and EDX. Au and Pt particles attached to TiO2 particles partially wetted the TiO2 substrate. Up to about 100 Au NPs coated a single TiO2 particle. For Au, a continuous coating layer could be achieved by increasing the deposition time to several hours. A detailed characterisation of metal NPs and their coagulation and coating behaviour with TiO2 particles as provided here will be important to assess chemical or electronic properties of coated TiO2 particles in future studies.
Additional and complementary graphs supporting the paper are presented here.
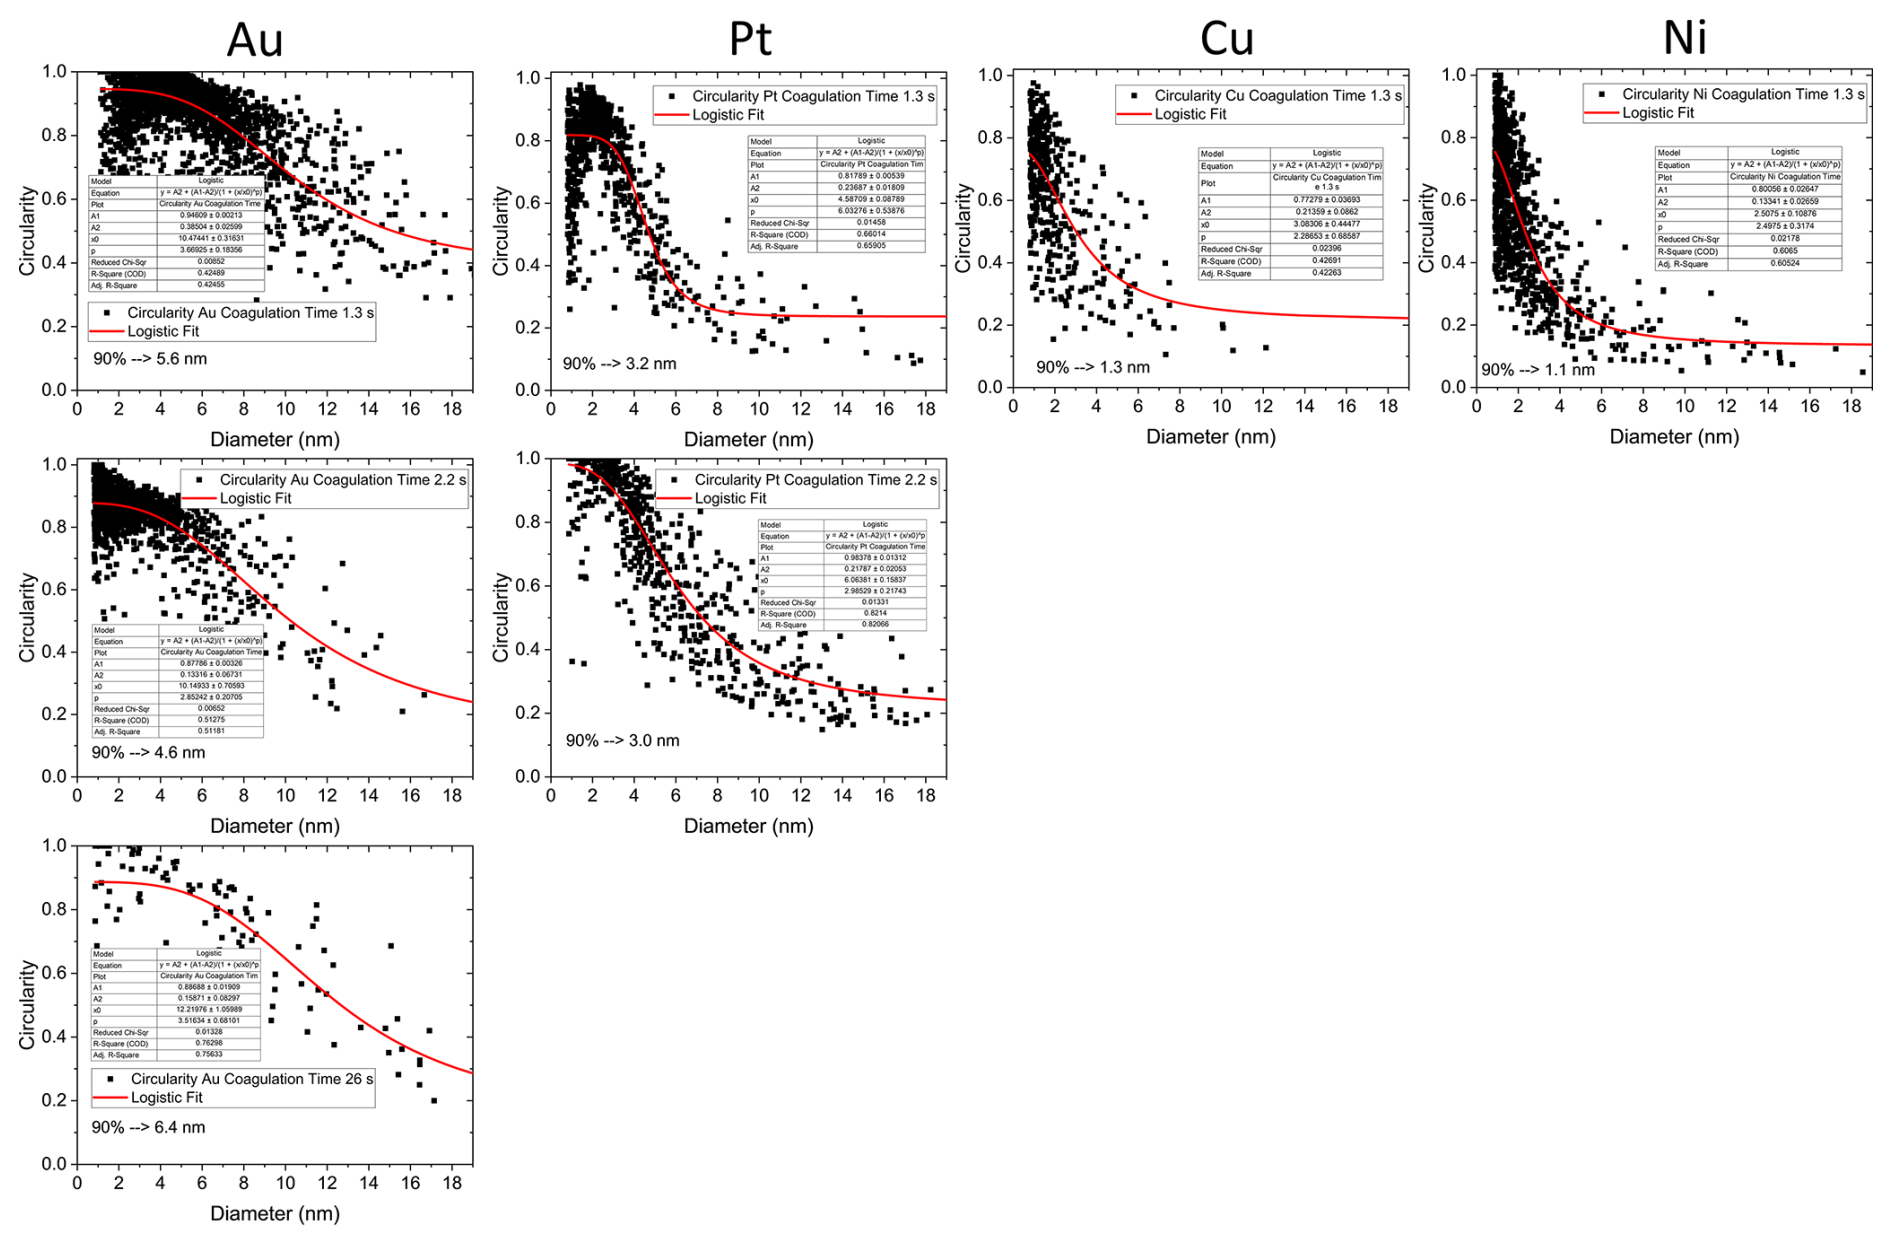
Figure A1Particle circularities plotted for the metals Au, Pt, Cu and Ni against the projected area equivalent diameter after 1.3 s coagulation time and after 2.2 and 26.0 s for experiments where particle numbers were sufficiently large. The data were fitted with a logistic function to determine a maximal primary particle size for each metal. While Au particles remain spherical up to a size of more than 5 nm, Pt, Cu and Ni begin to form agglomerates below 3.5 nm. Errors given in Table 1 are derived from the errors of the fit parameters shown in this figure.
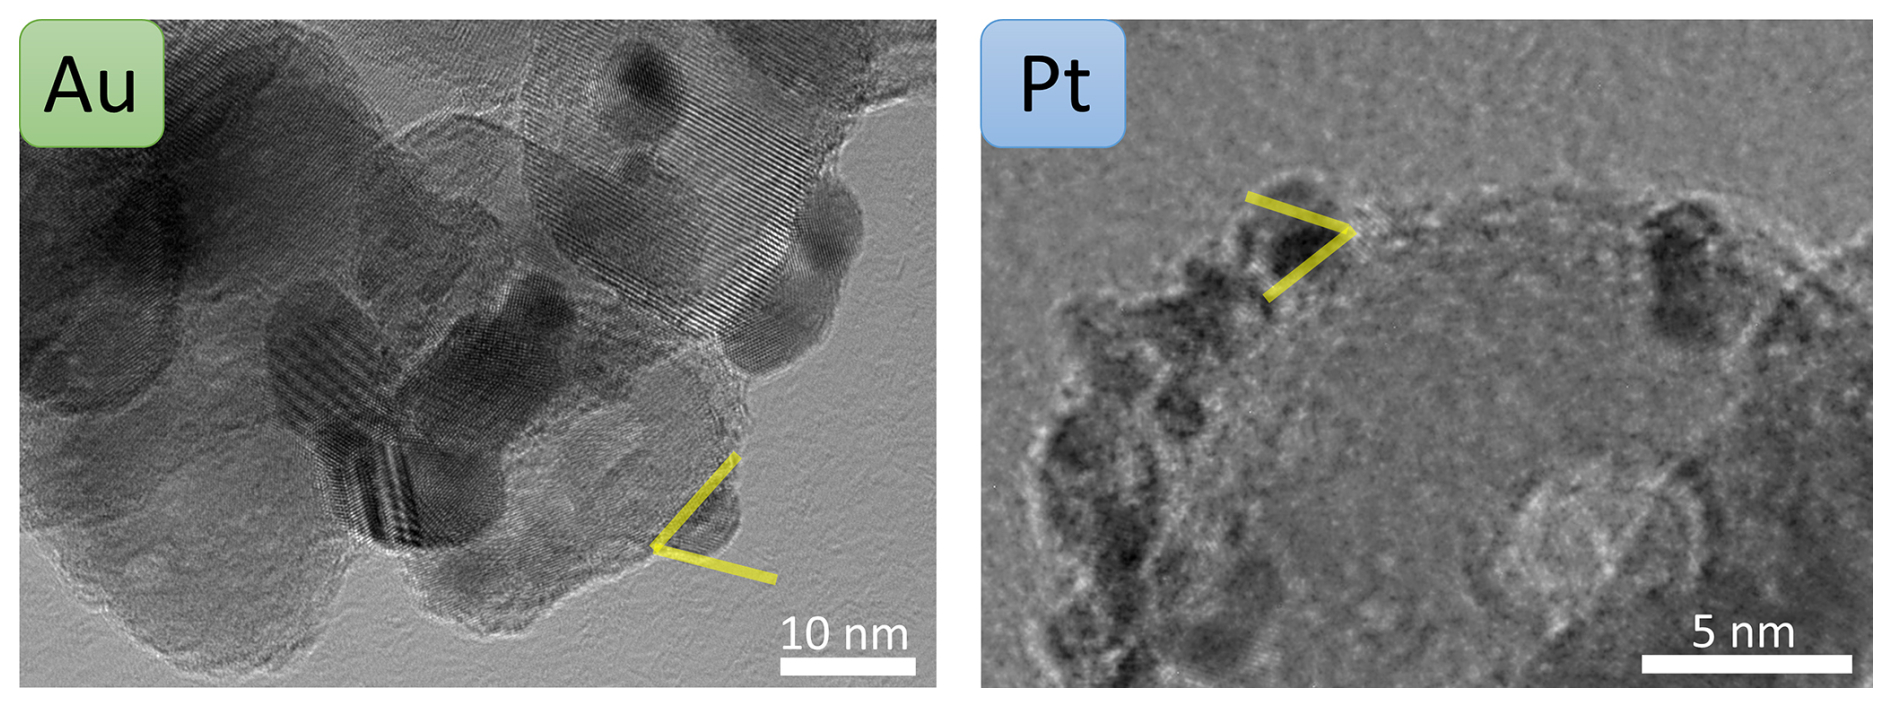
Figure A2Contact angle measurements for Au and Pt coated on TiO2 complementary to Fig. 5. Contact angles of 67 ± 4 and 60 ± 4° were determined for Au and Pt, respectively.
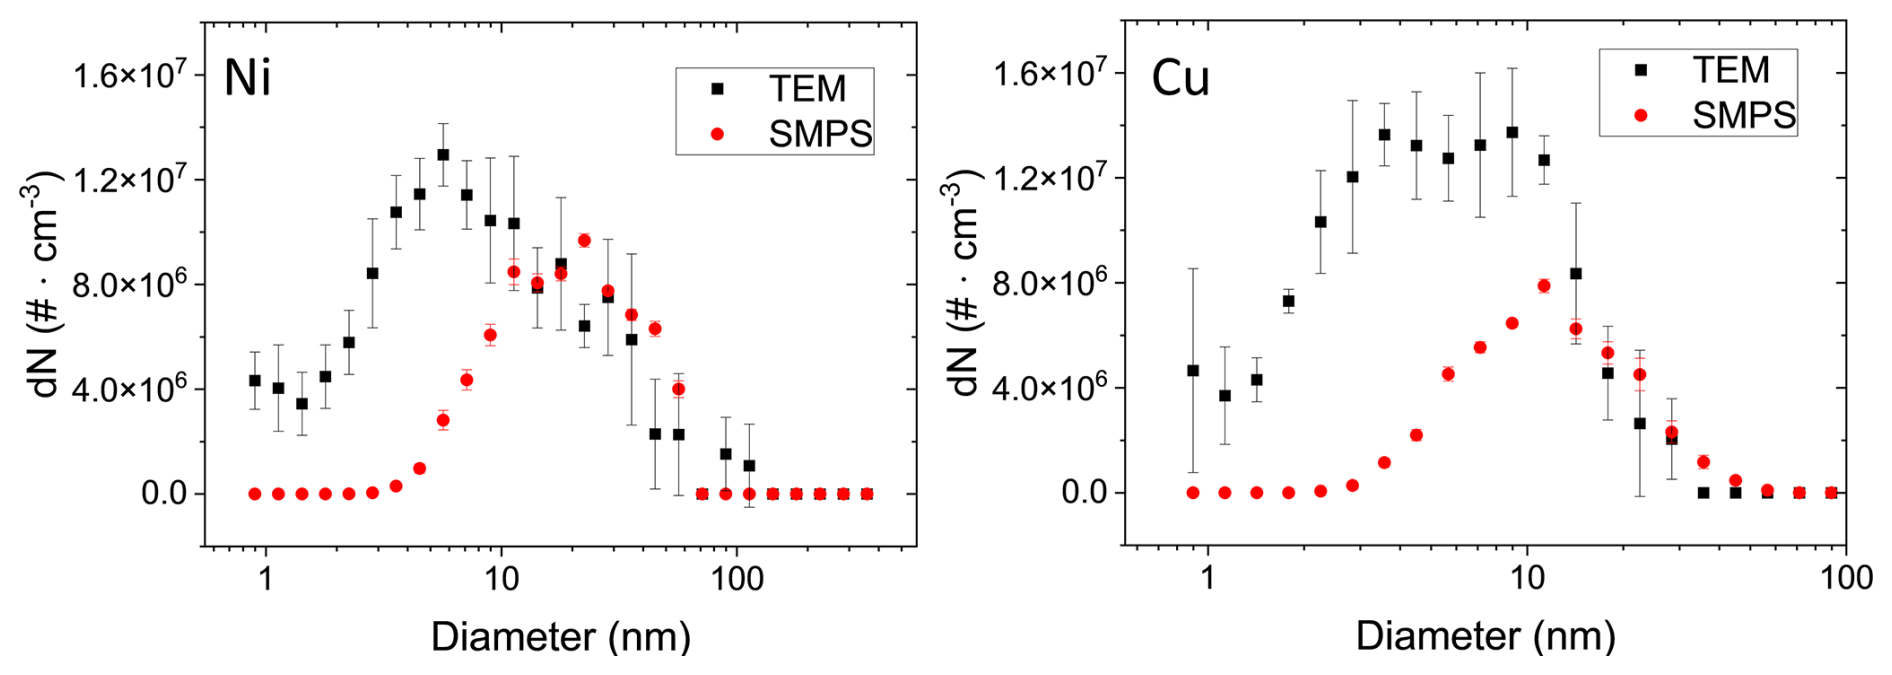
Figure A3Aerosol particle number size distributions calculated from TEM micrographs of Ni and Cu NPs. The NPs were collected via diffusion for 2 h for a coagulation time of 1.3 s, and the corresponding aerosol particle distributions were calculated as described for Fig. 4. In red, as a comparison, simultaneously measured SMPS particle size distributions are plotted. The calculated distribution matches the measured distribution well for particles > 10 nm. For < 10 nm particles, the calculated distributions deviate from the SMPS values, which can be partially attributed to the limit of detection of the SMPS instrument.
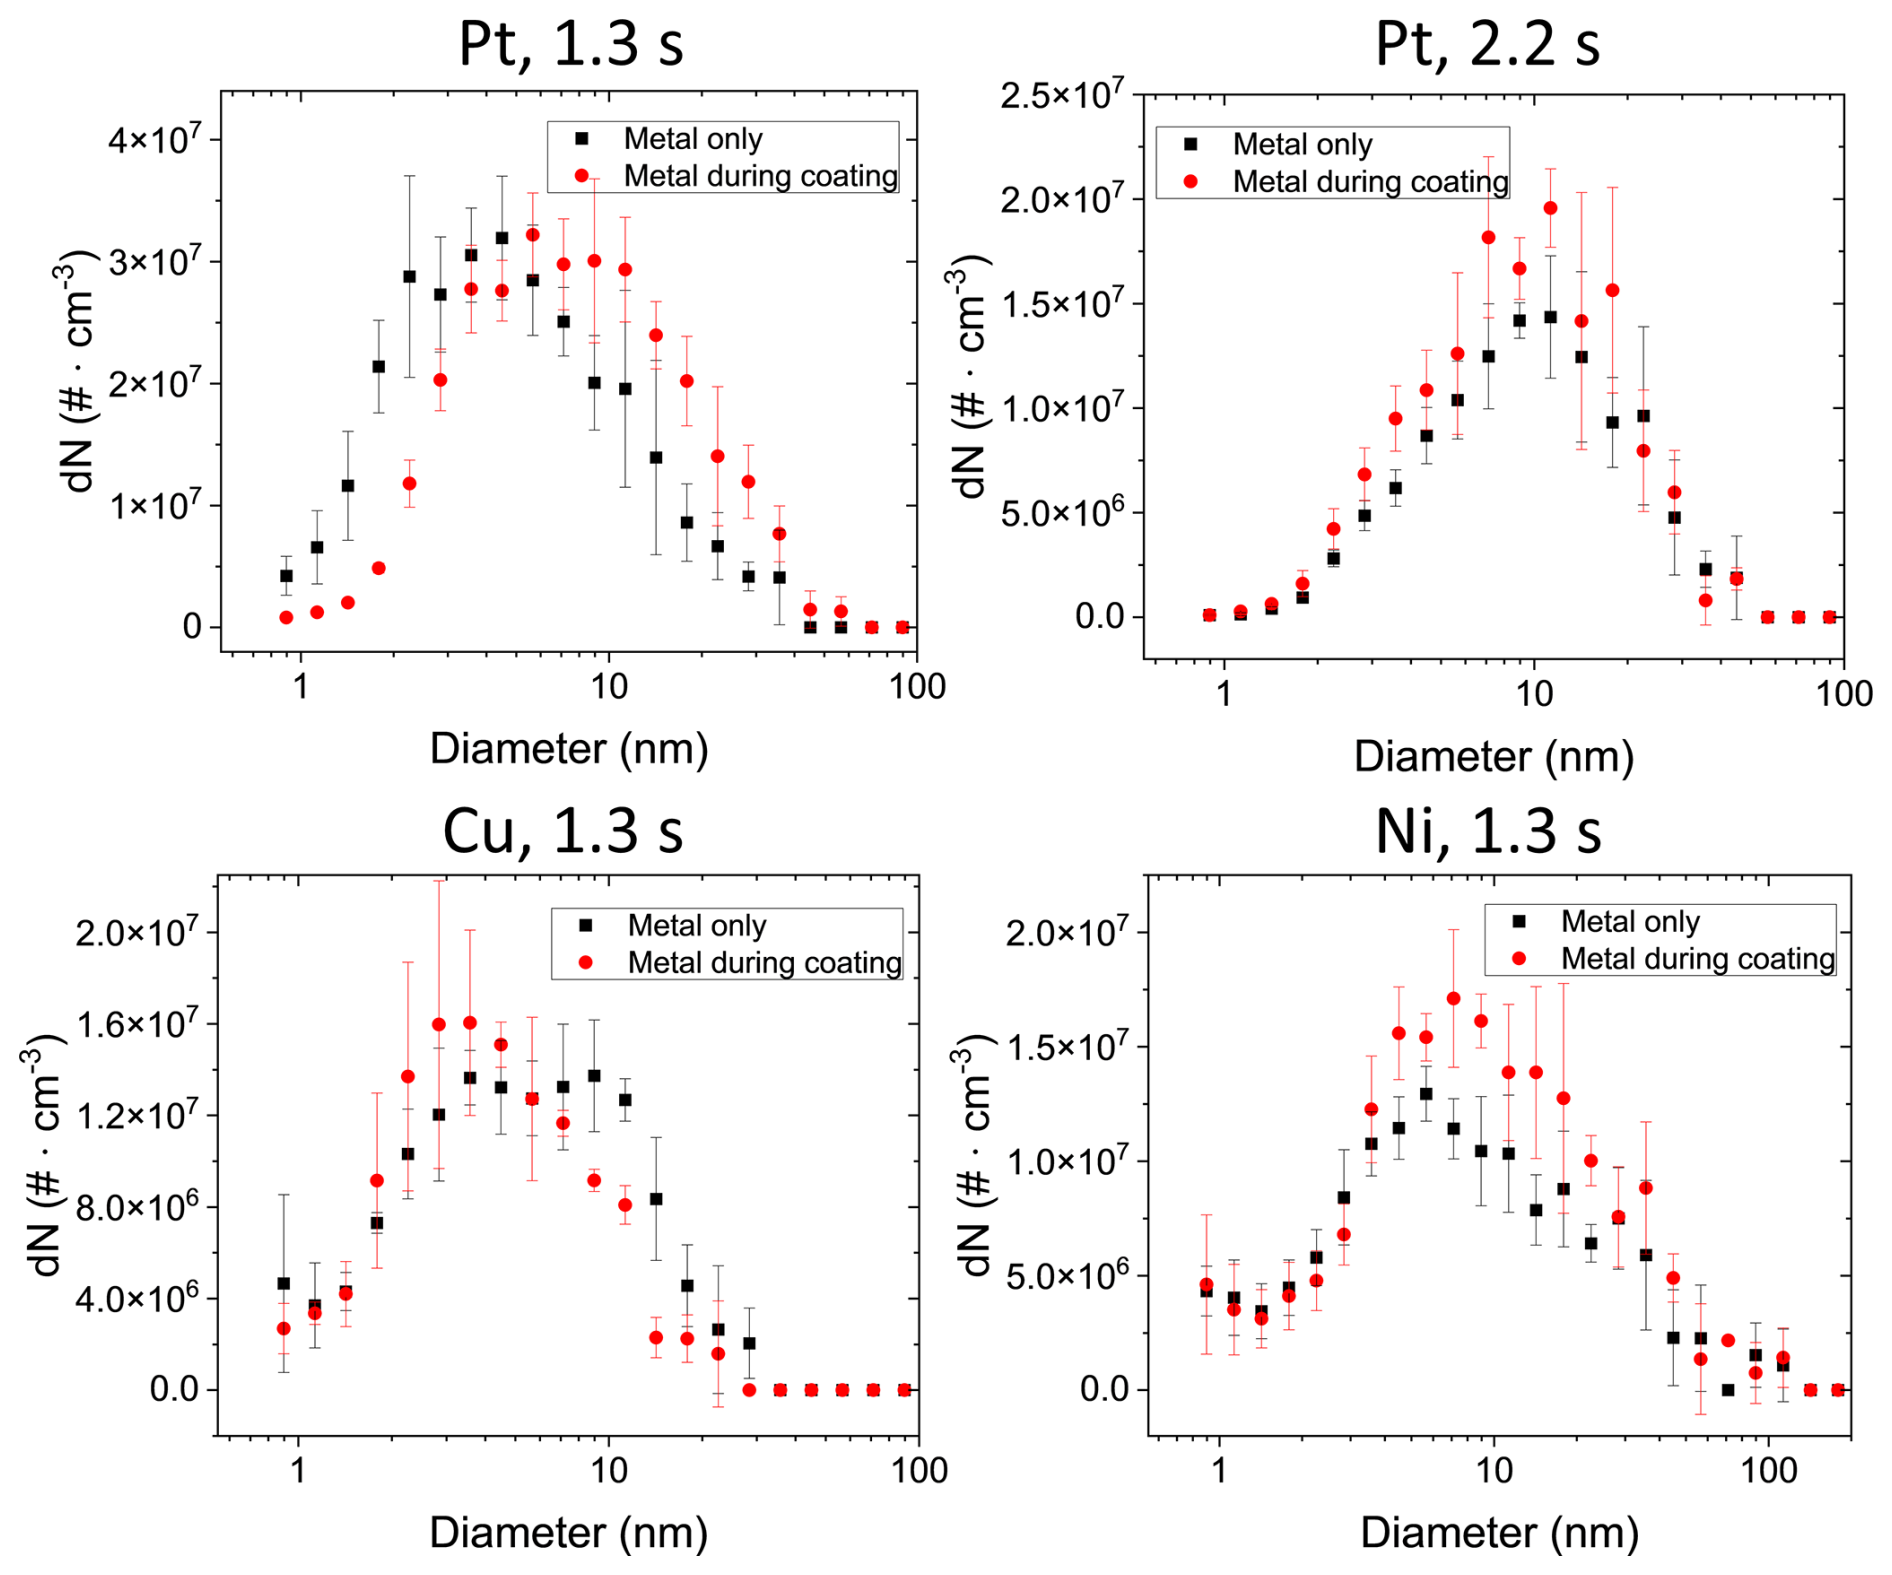
Figure A4Aerosol number size distributions estimated from TEM micrographs of uncoated Pt, Cu and Ni NPs for mono-modal (in black, “Metal only”) or bi-modal coagulation with TiO2 NPs (“Metal during coating”, in red). No clear difference in particle number concentration and size is visible between the two size distributions for the three metals. Errors in the calculation consist of the propagated statistical error from triplicate measurements.
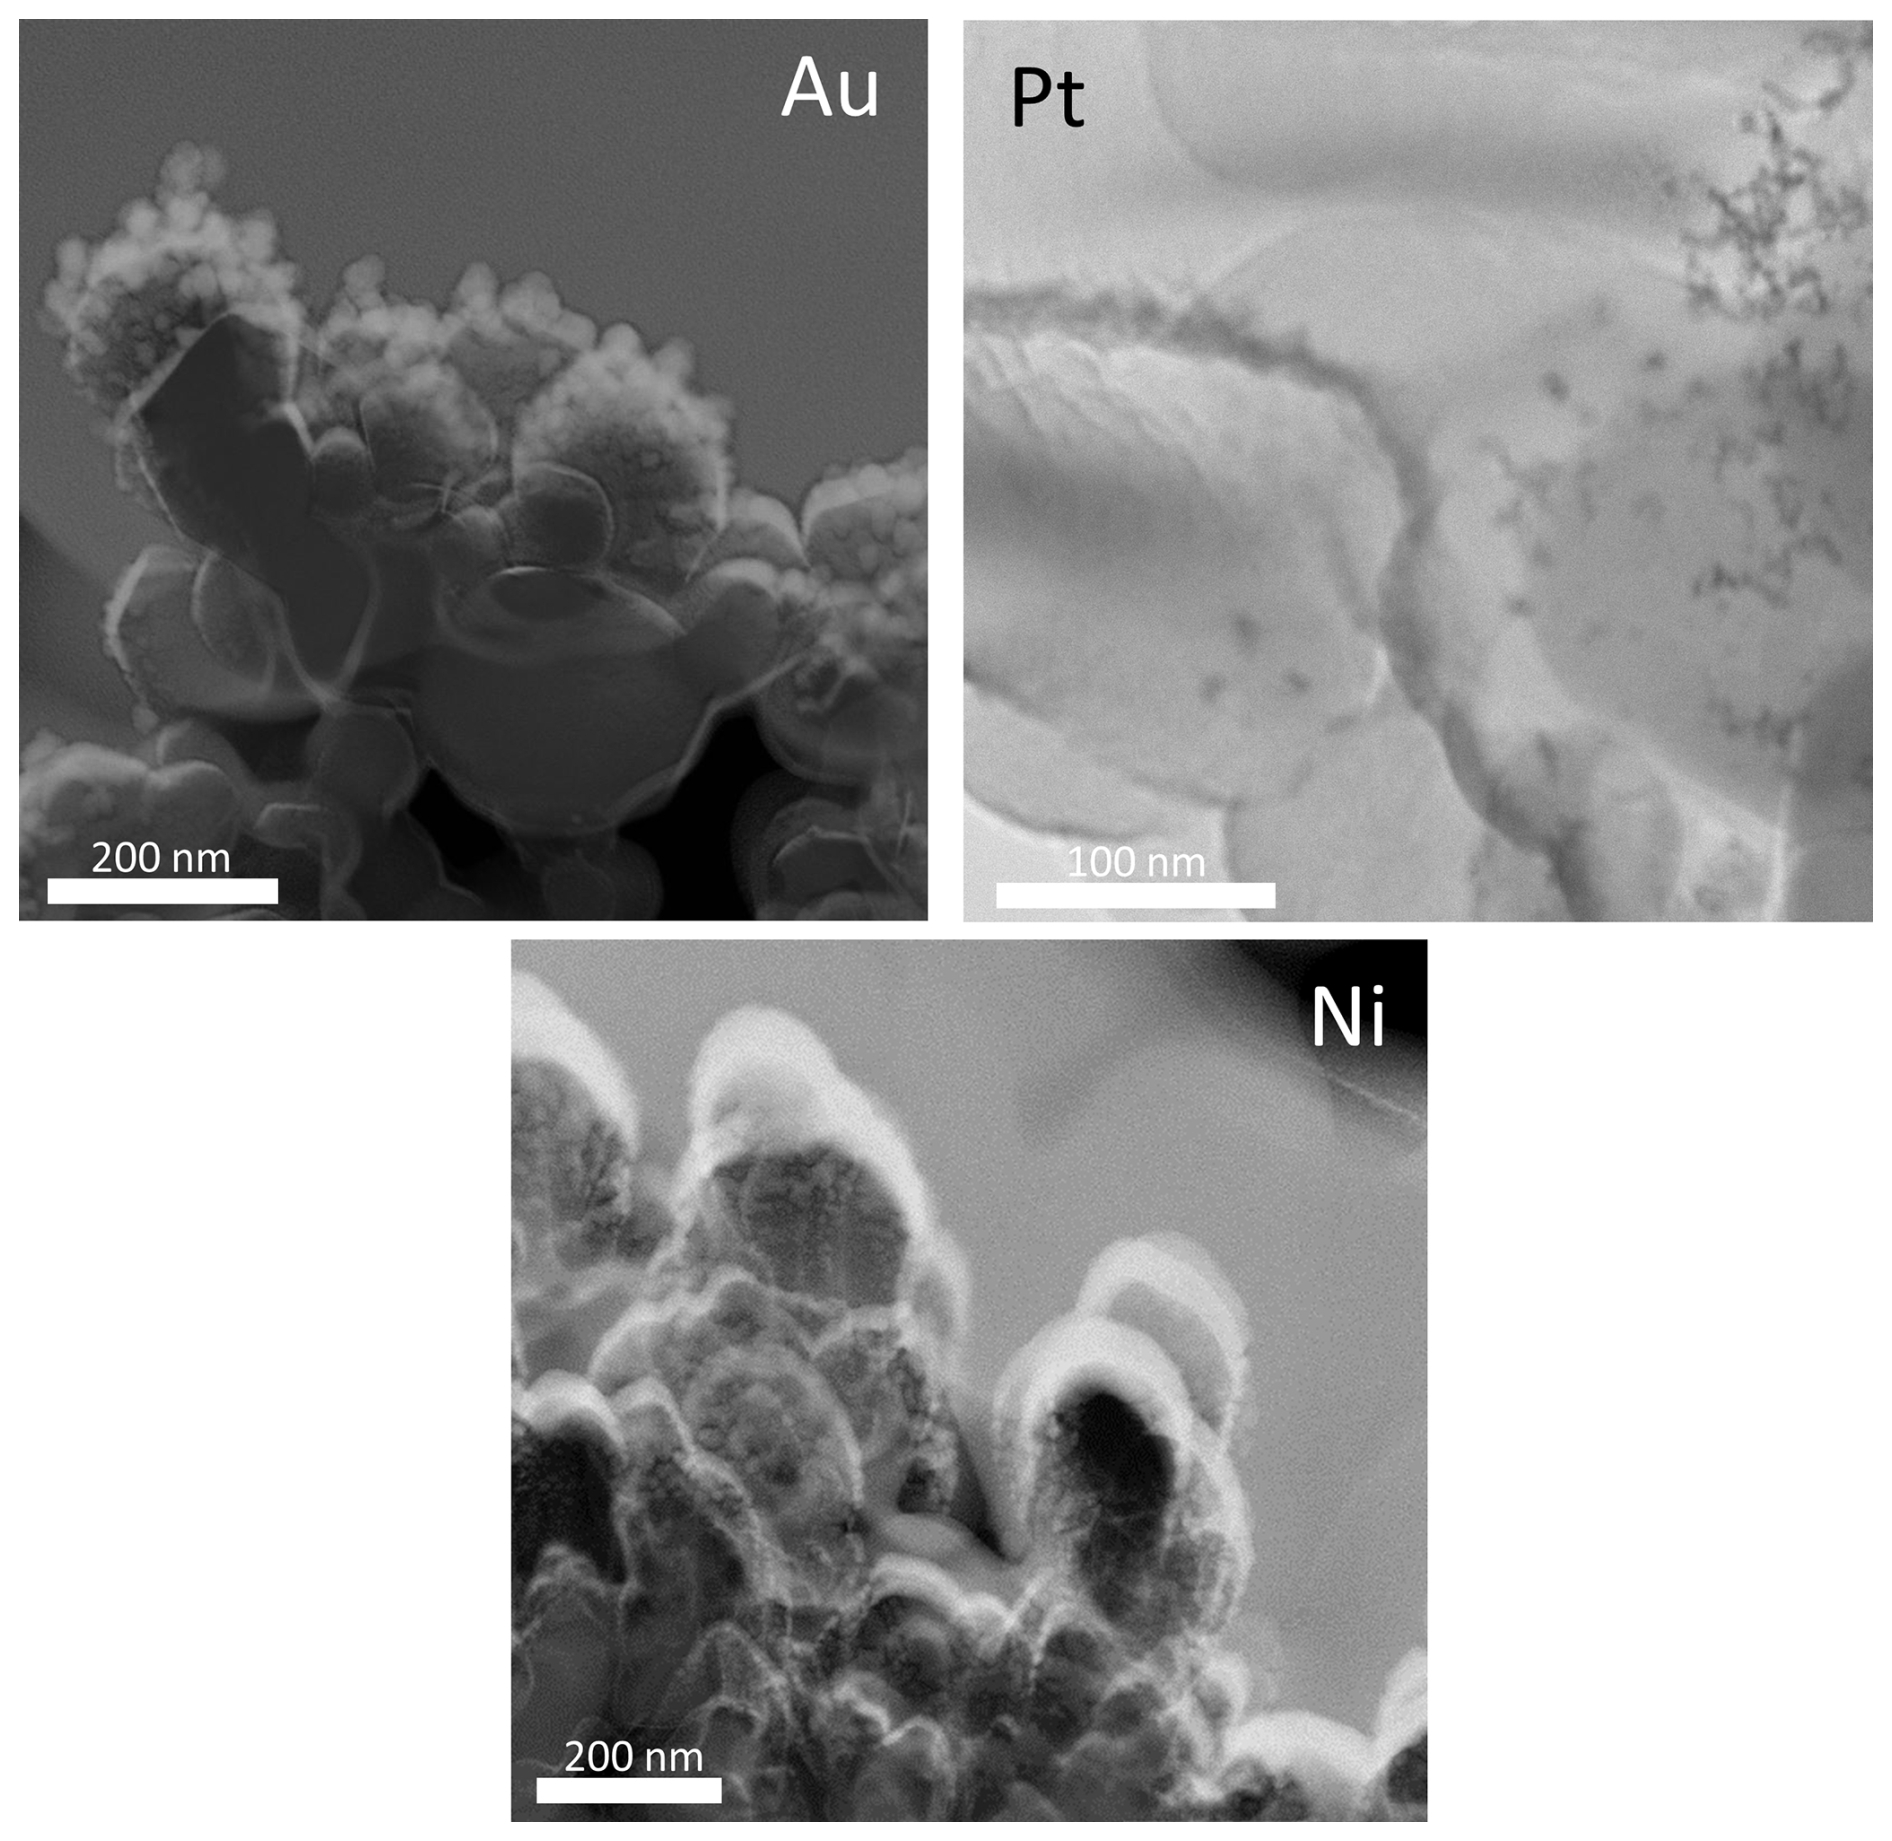
Figure A5STEM micrographs of lamellae of coated TiO2 films for Au, Pt and Ni. While coating particles are clearly visible for Au (bright dots) and Pt (dark dots), Ni particles are only visible in EDX mappings (see Fig. 8, main text). The bright caps in the Ni micrograph originate from a strong background signal due to sputtering with Au. For details, see the experiment section of the paper.
Given the low number concentrations and small sizes of Cu aerosol particles (see Fig. A3, Fig. 3 and Table 1), the detection of Cu coating on TiO2 particles was not possible (see Fig. B1 below).
Likely, Cu particles present are below the limit of resolution for TEM, STEM and EDX and are thus not visible in Fig. B1a–c. The larger background signal of Cu in EDX and STEM (Fig. B1d, e) is due to Cu-containing components inside the microscope, causing higher background levels compared to the other three metals. Therefore, it was not possible to analyse Cu NP coatings. However, given the slightly lower surface free energy of Cu (Kinloch, 1987) compared to TiO2 (Labat et al., 2008), we estimate island-like coatings of predominantly primary particles.
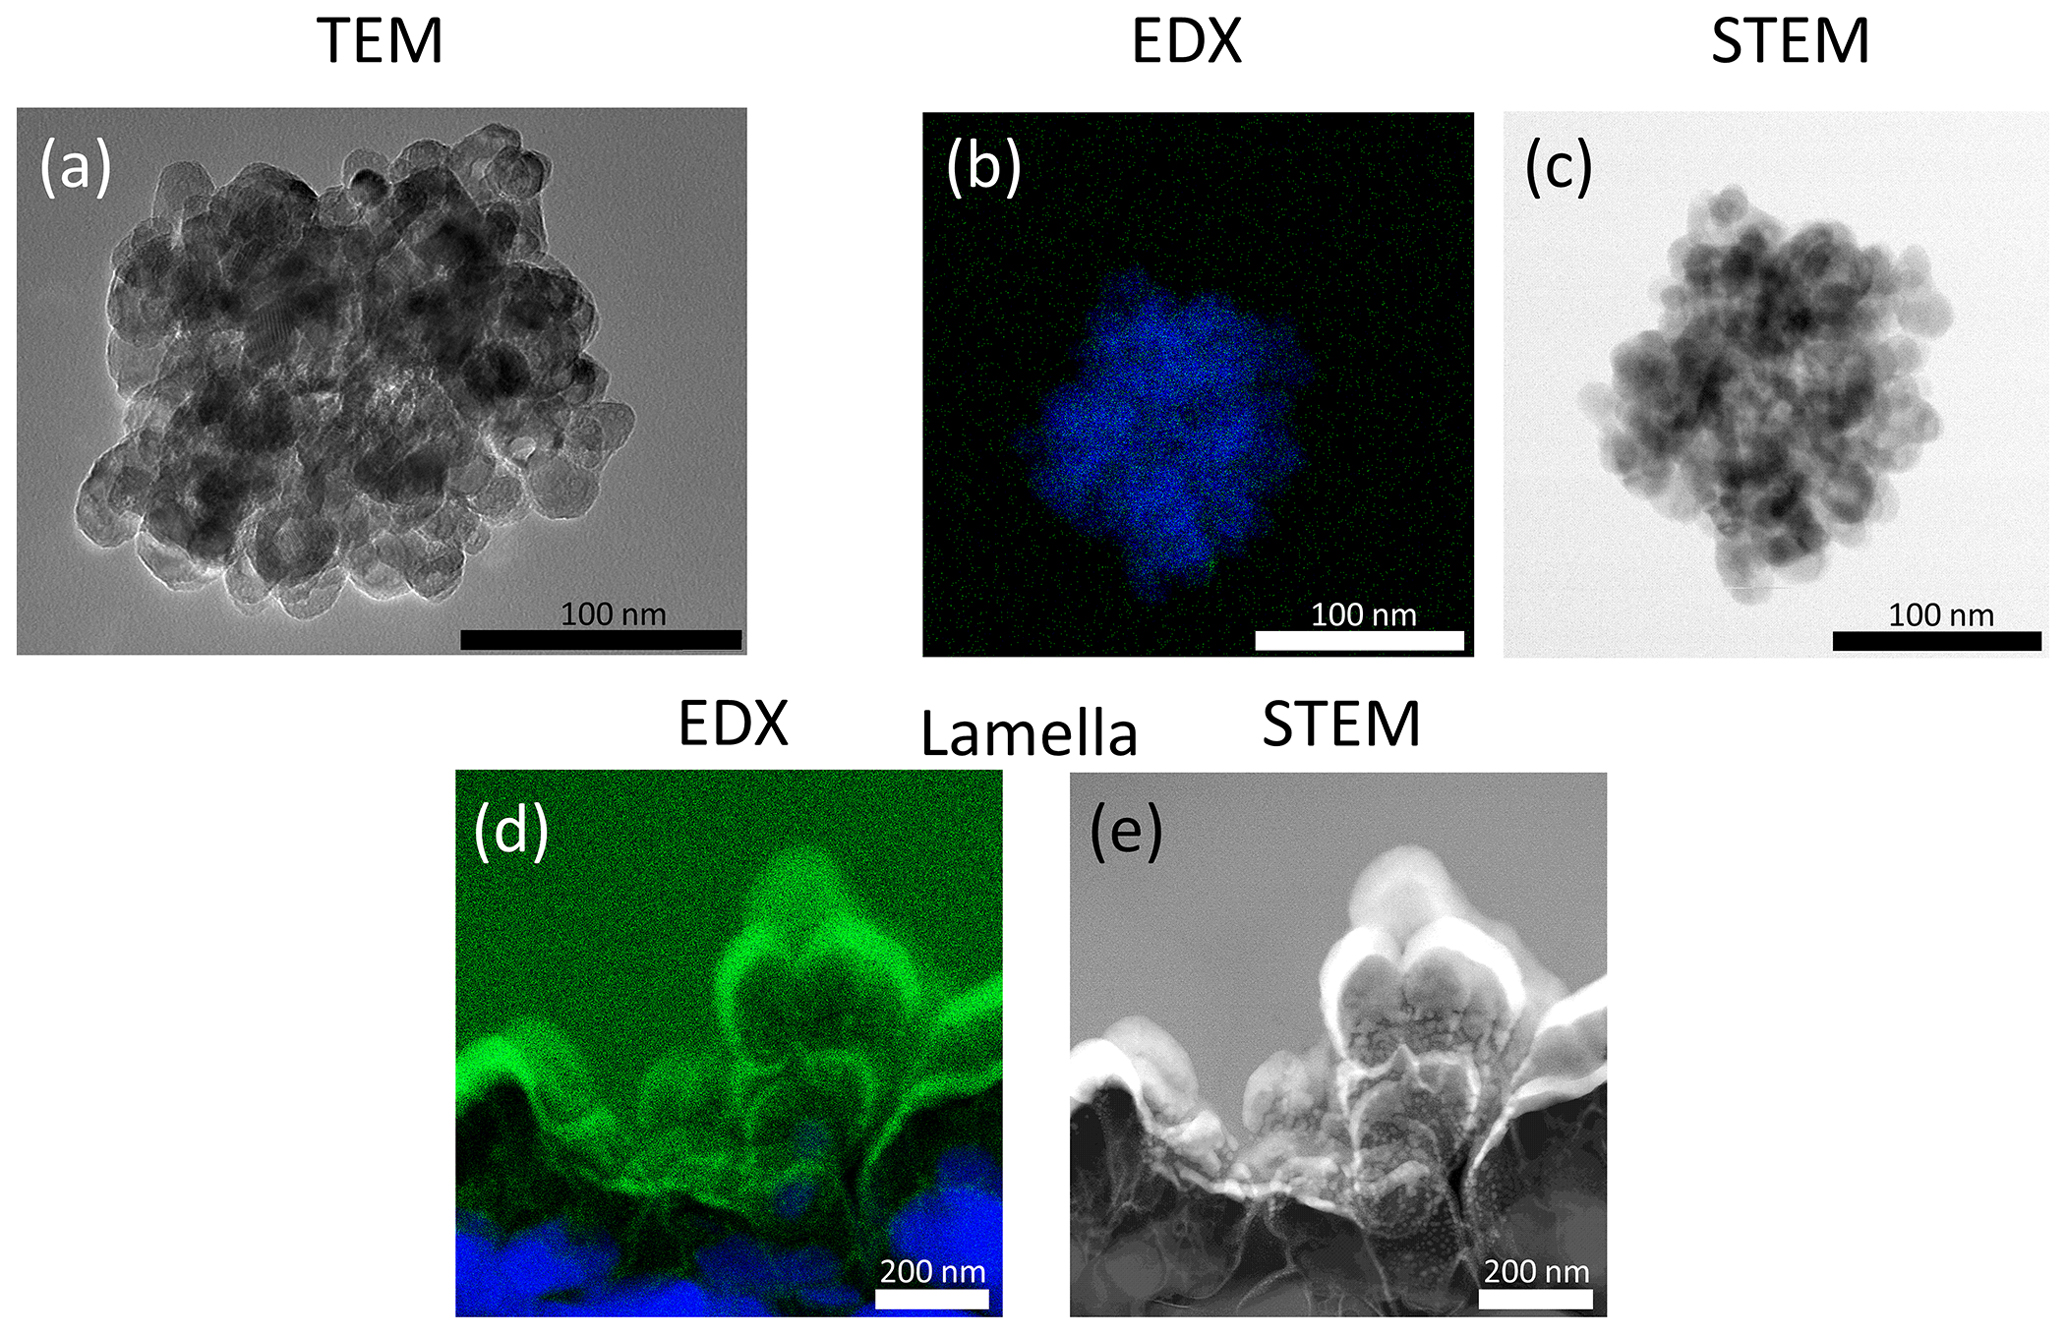
Figure B1Attempt of electron microscopic imaging of Cu NP coating on TiO2 particles (a–c) as well as of the deposition of Cu NPs on a TiO2 film for 12 h and subsequent lamella extraction (d, e). While in TEM (a) no coating is visible, a very weak signal of Cu in EDX ((b), in green) likely indicates that coating particles are present on the surface of the TiO2 particle. However, Cu NPs cannot be resolved in STEM (c). EDX of the lamella (d) shows a strong Cu signal (in green) which originates mainly from Cu components in the instrument and not from Cu NPs. Thus the coating behaviour of Cu on TiO2 particles cannot be assessed reliably with the techniques used here.
Complementary to the experimental approaches detailed above, a numerical coagulation model from Zhang et al. (2020) was adapted and implemented to determine the decrease of Au NPs due to coagulation with TiO2 particles and diffusion to tubing walls, respectively.
Input for the model was the aerosol size distribution at the point where the Au NPs are mixed with the TiO2 substrate particles (8 × 106 cm−3, mode at 120 nm). The Au NP input distribution was determined via TEM analyses and a subsequent calculation of the corresponding aerosol concentration (see main text, Fig. 4). The TiO2 distribution was measured with an SMPS.
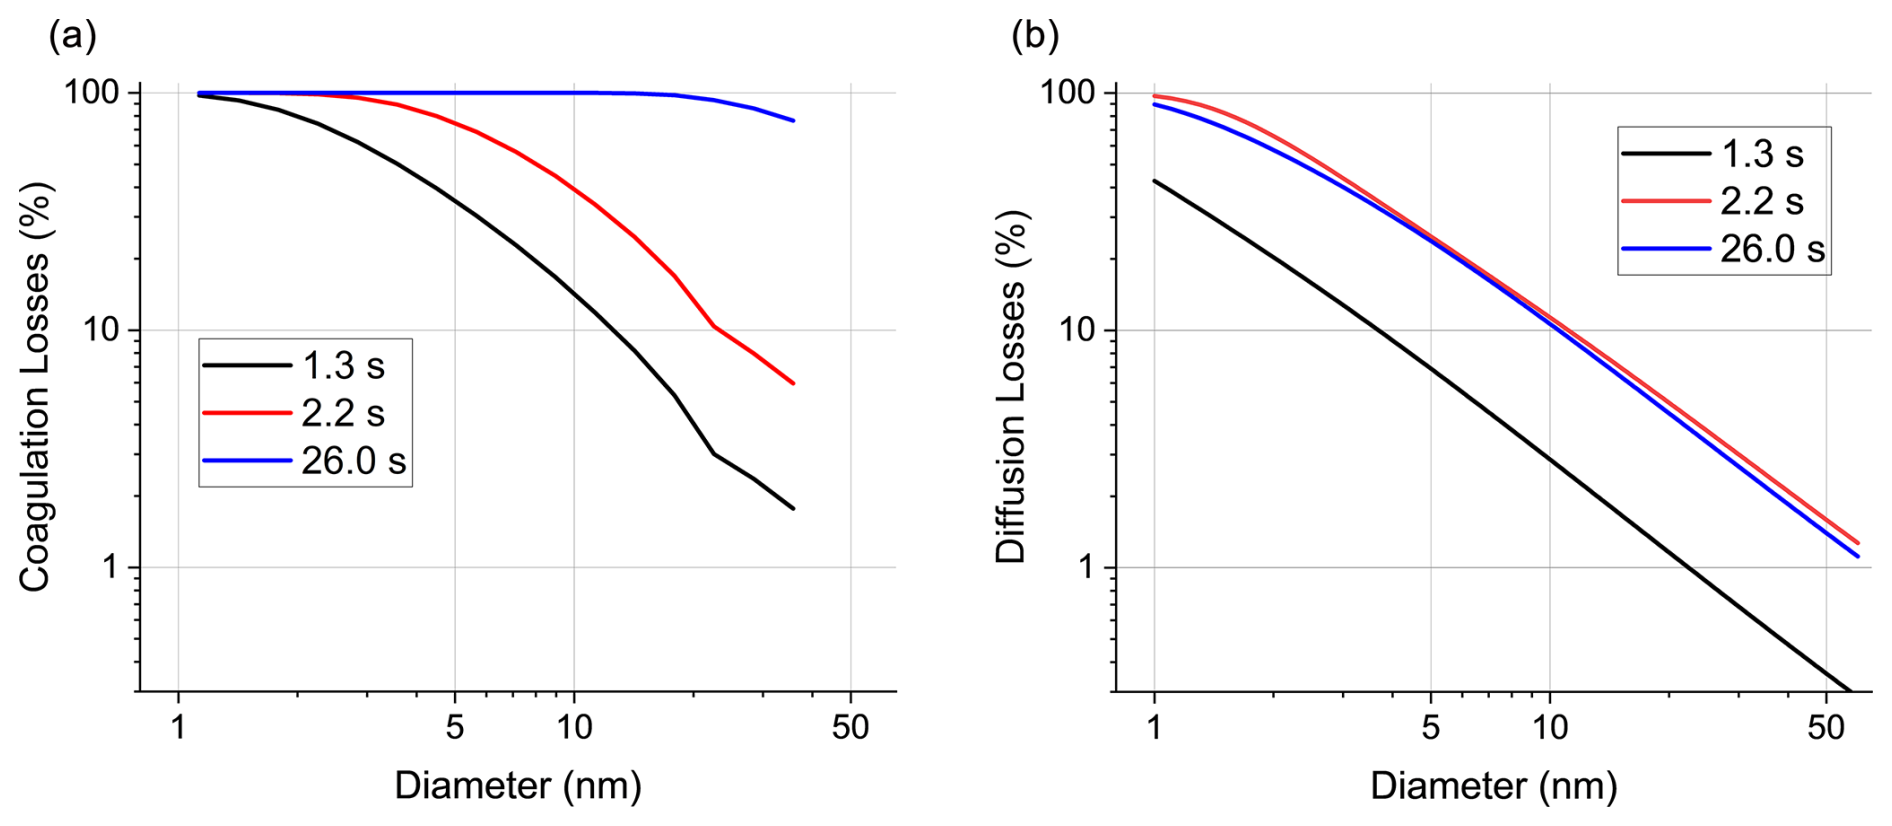
Figure C1(a) Modelled “losses” (decrease in particle concentration) due to coagulation during coating of Au on TiO2 after coagulation times 1.3, 2.2 and 26.0 s. (b) Size-dependent diffusion losses for the three coagulation times. Losses for 1 nm particles are about 10 times higher than for 10 nm and about 100 times higher than for 50 nm particles for all coagulation times. Times of 2.2 s (long, small diameter tube) and 26.0 s (shorter, larger diameter tube) have similar losses given the non-linear (i.e. exponential) dependence of the diffusion losses on the tube length.
Figure C1a shows how many particles per size bin are lost due to coagulation during the coating. For this calculation, the Au NP concentration before coating (t = 0 s) is compared to the modelled concentration after a specific coagulation time. For 26.0 s up to approximately 20 nm, nearly all of the particles coagulated. Less pronounced losses are observed for the much shorter coagulation times of 1.3 and 2.2 s, as expected. Although the modal model does not include diffusion losses which are highly relevant for < 50 nm particles, they are accounted for separately via a particle loss calculator (von der Weiden et al., 2009) (Fig. C1b). The diffusive losses were determined for all three coagulation times. Results from these calculations (Fig. C1b) show the importance of diffusive losses, especially for < 10 nm particles. For an accurate assessment of the particle losses in our experiments, a combined coagulation and diffusional loss model would be needed, which will be presented in a forthcoming study.
Data for this article, consisting of Excel files, are available in the Open Science Framework at https://doi.org/10.17605/OSF.IO/ZM3G4 (Gfeller, 2024).
Conceptualisation – MB and BG; investigation – BG, MB and ADA; methodology (adaptation and model implementations) – NB and BG; methodology (image analysis) – BG; methodology (electron microscopy) – MW, BG and MB; project administration – MB and BG; funding acquisition and supervision – MK; writing (original draft) – BG; writing (review and editing) – all authors.
The contact author has declared that none of the authors has any competing interests.
Publisher's note: Copernicus Publications remains neutral with regard to jurisdictional claims made in the text, published maps, institutional affiliations, or any other geographical representation in this paper. While Copernicus Publications makes every effort to include appropriate place names, the final responsibility lies with the authors.
This research has been supported by the Schweizerischer Nationalfonds zur Förderung der Wissenschaftlichen Forschung (grant no. 200021_192192/1).
This paper was edited by Georgios Kelesidis and reviewed by three anonymous referees.
Arcidiacono, S., Bieri, N. R., Poulikakos, D., and Grigoropoulos, C. P.: On the coalescence of gold nanoparticles, Int. J. Multiphas. Flow, 30, 979–994, https://doi.org/10.1016/j.ijmultiphaseflow.2004.03.006, 2004.
Backman, U., Tapper, U., and Jokiniemi, J. K.: An aerosol method to synthesize supported metal catalyst nanoparticles, Synthetic Met., 142, 169–176, https://doi.org/10.1016/j.synthmet.2003.08.007, 2004.
Baig, N., Kammakakam, I., and Falath, W.: Nanomaterials: a review of synthesis methods, properties, recent progress, and challenges, Mater. Adv., 2, 1821–1871, https://doi.org/10.1039/D0MA00807A, 2021.
Barr, T. L.: An ESCA study of the termination of the passivation of elemental metals, J. Phys. Chem., 82, 1801–1810, https://doi.org/10.1021/j100505a006, 1978.
Brilke, S., Resch, J., Leiminger, M., Steiner, G., Tauber, C., Wlasits, P. J., and Winkler, P. M.: Precision characterization of three ultrafine condensation particle counters using singly charged salt clusters in the 1–4 nm size range generated by a bipolar electrospray source, Aerosol Sci. Tech., 54, 396–409, https://doi.org/10.1080/02786826.2019.1708260, 2020.
Buffat, Ph. and Borel, J.-P.: Size effect on the melting temperature of gold particles, Phys. Rev. A, 13, 2287–2298, https://doi.org/10.1103/PhysRevA.13.2287, 1976.
Castro, T., Reifenberger, R., Choi, E., and Andres, R. P.: Size-dependent melting temperature of individual nanometer-sized metallic clusters, Phys. Rev. B, 42, 8548–8556, https://doi.org/10.1103/PhysRevB.42.8548, 1990.
Chen, D.-R., Pui, D. Y. H., Hummes, D., Fissan, H., Quant, F. R., and Sem, G. J.: Design and evaluation of a nanometer aerosol differential mobility analyzer (Nano-DMA), J. Aerosol Sci., 29, 497–509, https://doi.org/10.1016/S0021-8502(97)10018-0, 1998.
Cuenya, B. R.: Synthesis and catalytic properties of metal nanoparticles: Size, shape, support, composition, and oxidation state effects, Thin Solid Films, 518, 3127–3150, https://doi.org/10.1016/j.tsf.2010.01.018, 2010.
Daruich De Souza, C., Ribeiro Nogueira, B., and Rostelato, M. E. C. M.: Review of the methodologies used in the synthesis gold nanoparticles by chemical reduction, J. Alloy. Compd., 798, 714–740, https://doi.org/10.1016/j.jallcom.2019.05.153, 2019.
Debecker, D. P., Hongmanorom, P., Pfeiffer, T. V., Zijlstra, B., Zhao, Y., Casale, S., and Sassoye, C.: Spark ablation: a dry, physical, and continuous method to prepare powdery metal nanoparticle-based catalysts, Chem. Commun., 60, 11076–11079, https://doi.org/10.1039/D4CC03469D, 2024.
Domaschke, M., Schmidt, M., and Peukert, W.: A model for the particle mass yield in the aerosol synthesis of ultrafine monometallic nanoparticles by spark ablation, J. Aerosol Sci., 126, 133–142, https://doi.org/10.1016/j.jaerosci.2018.09.004, 2018.
Eggersdorfer, M. L. and Pratsinis, S. E.: The Structure of Agglomerates Consisting of Polydisperse Particles, Aerosol Sci. Tech., 46, 347–353, https://doi.org/10.1080/02786826.2011.631956, 2012.
Feng, J., Huang, L., Ludvigsson, L., Messing, M. E., Maisser, A., Biskos, G., and Schmidt-Ott, A.: General Approach to the Evolution of Singlet Nanoparticles from a Rapidly Quenched Point Source, J. Phys. Chem. C, 120, 621–630, https://doi.org/10.1021/acs.jpcc.5b06503, 2016.
Fissan, H., Ristig, S., Kaminski, H., Asbach, C., and Epple, M.: Comparison of different characterization methods for nanoparticle dispersions before and after aerosolization, Anal. Methods, 6, 7324, https://doi.org/10.1039/C4AY01203H, 2014.
Fuchs, N. A.: On the stationary charge distribution on aerosol particles in a bipolar ionic atmosphere, Geofisica Pura e Applicata, 56, 185–193, https://doi.org/10.1007/BF01993343, 1963.
Gao, F. and Gu, Z.: Melting Temperature of Metallic NanoparticlesMetal nanoparticlessynthetic methods, in: Handbook of Nanoparticles, edited by: Aliofkhazraei, M., Springer International Publishing, Cham, 1–25, https://doi.org/10.1007/978-3-319-13188-7_6-1, 2015.
Gao, J., Liu, Q., Gu, F., Liu, B., Zhong, Z., and Su, F.: Recent advances in methanation catalysts for the production of synthetic natural gas, RSC Adv., 5, 22759–22776, https://doi.org/10.1039/C4RA16114A, 2015.
Gfeller, B.: Data on Metal Nanoparticle Paper, OSF [data set], https://doi.org/10.17605/OSF.IO/ZM3G4, 2024.
Grammatikopoulos, P., Cassidy, C., Singh, V., and Sowwan, M.: Coalescence-induced crystallisation wave in Pd nanoparticles, Sci. Rep., 4, 5779, https://doi.org/10.1038/srep05779, 2014.
Gudikandula, K. and Charya Maringanti, S.: Synthesis of silver nanoparticles by chemical and biological methods and their antimicrobial properties, J. Exp. Nanosci., 11, 714–721, https://doi.org/10.1080/17458080.2016.1139196, 2016.
Guo, D., Xie, G., and Luo, J.: Mechanical properties of nanoparticles: basics and applications, J. Phys. D, 47, 013001, https://doi.org/10.1088/0022-3727/47/1/013001, 2013.
Hallberg, R. T., Ludvigsson, L., Preger, C., Meuller, B. O., Dick, K. A., and Messing, M. E.: Hydrogen-assisted spark discharge generated metal nanoparticles to prevent oxide formation, Aerosol Sci. Tech., 52, 347–358, https://doi.org/10.1080/02786826.2017.1411580, 2018.
Harra, J., Juuti, P., Haapanen, J., Sorvali, M., Roumeli, E., Honkanen, M., Vippola, M., Yli-Ojanperä, J., and Mäkelä, J. M.: Coating of Silica and Titania Aerosol Nanoparticles by Silver Vapor Condensation, Aerosol Sci. Tech., 49, 767–776, https://doi.org/10.1080/02786826.2015.1072263, 2015.
He, Z., Zhang, Z., and Bi, S.: Nanoparticles for organic electronics applications, Mater. Res. Express, 7, 012004, https://doi.org/10.1088/2053-1591/ab636f, 2020.
Hejral, U., Vlad, A., Nolte, P., and Stierle, A.: In Situ Oxidation Study of Pt Nanoparticles on MgO(001), J. Phys. Chem. C, 117, 19955–19966, https://doi.org/10.1021/jp404698k, 2013.
Hinds, W. C.: Aerosol Technology: Properties, Behavior, and Measurement of Airborne Particles, Subsequent edition, Wiley-Interscience, New York, ISBN 978-1-119-49404-1, 1999.
Huhtamäki, T., Tian, X., Korhonen, J. T., and Ras, R. H. A.: Surface-wetting characterization using contact-angle measurements, Nat. Protoc., 13, 1521–1538, https://doi.org/10.1038/s41596-018-0003-z, 2018.
Jamkhande, P. G., Ghule, N. W., Bamer, A. H., and Kalaskar, M. G.: Metal nanoparticles synthesis: An overview on methods of preparation, advantages and disadvantages, and applications, J. Drug Deliv. Sci. Tec., 53, 101174, https://doi.org/10.1016/j.jddst.2019.101174, 2019.
Jennings, T. and Strouse, G.: Past, Present, and Future of Gold Nanoparticles, in: Bio-Applications of Nanoparticles, edited by: Chan, W. C. W., Springer, New York, NY, 34–47, https://doi.org/10.1007/978-0-387-76713-0_3, 2007.
Jones, F. L.: Electrode Erosion by Spark Discharges, Br. J. Appl. Phys., 1, 60, https://doi.org/10.1088/0508-3443/1/3/302, 1950.
José-Yacamán, M., Gutierrez-Wing, C., Miki, M., Yang, D.-Q., Piyakis, K. N., and Sacher, E.: Surface Diffusion and Coalescence of Mobile Metal Nanoparticles, J. Phys. Chem. B, 109, 9703–9711, https://doi.org/10.1021/jp0509459, 2005.
Jung, W., Jung, Y.-H., Pikhitsa, P. V., Feng, J., Yang, Y., Kim, M., Tsai, H.-Y., Tanaka, T., Shin, J., Kim, K.-Y., Choi, H., Rho, J., and Choi, M.: Three-dimensional nanoprinting via charged aerosol jets, Nature, 592, 54–59, https://doi.org/10.1038/s41586-021-03353-1, 2021.
Kangasluoma, J., Cai, R., Jiang, J., Deng, C., Stolzenburg, D., Ahonen, L. R., Chan, T., Fu, Y., Kim, C., Laurila, T. M., Zhou, Y., Dada, L., Sulo, J., Flagan, R. C., Kulmala, M., Petäjä, T., and Lehtipalo, K.: Overview of measurements and current instrumentation for 1–10 nm aerosol particle number size distributions, J. Aerosol Sci., 148, 105584, https://doi.org/10.1016/j.jaerosci.2020.105584, 2020.
Karlsson, L. S., Deppert, K., and Malm, J.-O.: Size Determination of Au Aerosol Nanoparticles by Off-Line TEM/STEM Observations, J. Nanopart. Res., 8, 971–980, https://doi.org/10.1007/s11051-006-9094-5, 2006.
Khan, I., Saeed, K., and Khan, I.: Nanoparticles: Properties, applications and toxicities, Arab. J. Chem., 12, 908–931, https://doi.org/10.1016/j.arabjc.2017.05.011, 2019.
Kinloch, A. J.: Adhesion and Adhesives, Springer Netherlands, Dordrecht, https://doi.org/10.1007/978-94-015-7764-9, 1987.
Kofman, R., Cheyssac, P., Aouaj, A., Lereah, Y., Deutscher, G., Ben-David, T., Penisson, J. M., and Bourret, A.: Surface melting enhanced by curvature effects, Surf. Sci., 303, 231–246, https://doi.org/10.1016/0039-6028(94)90635-1, 1994.
Kumari, S., Raturi, S., Kulshrestha, S., Chauhan, K., Dhingra, S., András, K., Thu, K., Khargotra, R., and Singh, T.: A comprehensive review on various techniques used for synthesizing nanoparticles, Journal of Materials Research and Technology, 27, 1739–1763, https://doi.org/10.1016/j.jmrt.2023.09.291, 2023.
Labat, F., Baranek, P., and Adamo, C.: Structural and Electronic Properties of Selected Rutile and Anatase TiO2 Surfaces: An ab Initio Investigation, J. Chem. Theory Comput., 4, 341–352, https://doi.org/10.1021/ct700221w, 2008.
Lähde, A., Raula, J., and Kauppinen, E. I.: Combined synthesis and in situ coating of nanoparticles in the gas phase, J. Nanopart. Res., 10, 121–130, https://doi.org/10.1007/s11051-008-9399-7, 2008.
Lehtinen, K. E. J. and Zachariah, M. R.: Energy accumulation in nanoparticle collision and coalescence processes, J. Aerosol Sci., 33, 357–368, https://doi.org/10.1016/S0021-8502(01)00177-X, 2002.
Loizidis, C., Petallidou, K. C., Maisser, A., Bezantakos, S., Pfeiffer, T. V., Schmidt-Ott, A., and Biskos, G.: Insights into the enhancement of nanoparticle production throughput by atmospheric-pressure spark ablation, Aerosol Sci. Tech., 58, 1421–1431, https://doi.org/10.1080/02786826.2024.2403578, 2024.
Lopez, N.: On the origin of the catalytic activity of gold nanoparticles for low-temperature CO oxidation, J. Catal., 223, 232–235, https://doi.org/10.1016/j.jcat.2004.01.001, 2004.
Lu, C.-H. and Jagannathan, R.: Cerium-ion-doped yttrium aluminum garnet nanophosphors prepared through sol-gel pyrolysis for luminescent lighting, Appl. Phys. Lett., 80, 3608–3610, https://doi.org/10.1063/1.1475772, 2002.
Meuller, B. O., Messing, M. E., Engberg, D. L. J., Jansson, A. M., Johansson, L. I. M., Norlén, S. M., Tureson, N., and Deppert, K.: Review of Spark Discharge Generators for Production of Nanoparticle Aerosols, Aerosol Sci. Tech., 46, 1256–1270, https://doi.org/10.1080/02786826.2012.705448, 2012.
Molina, L. M. and Hammer, B.: Some recent theoretical advances in the understanding of the catalytic activity of Au, Appl. Catal. A-Gen., 291, 21–31, https://doi.org/10.1016/j.apcata.2005.01.050, 2005.
Moskal, A. and Payatakes, A. C.: Estimation of the diffusion coefficient of aerosol particle aggregates using Brownian simulation in the continuum regime, J. Aerosol Sci., 37, 1081–1101, https://doi.org/10.1016/j.jaerosci.2005.10.005, 2006.
Murthy, S. K.: Nanoparticles in modern medicine: State of the art and future challenges, Int. J. Nanomed., 2, 129–141, 2007.
Nagarajan, R.: Nanoparticles: Building Blocks for Nanotechnology, in: Nanoparticles: Synthesis, Stabilization, Passivation, and Functionalization, vol. 996, American Chemical Society, 2–14, https://doi.org/10.1021/bk-2008-0996.ch001, 2008.
Olszok, V., Bierwirth, M., and Weber, A. P.: Interaction of Reactive Gases with Platinum Aerosol Particles at Room Temperature: Effects on Morphology and Surface Properties, Nanomaterials, 11, 2266, https://doi.org/10.3390/nano11092266, 2021.
Olszok, V., Bierwirth, M., and Weber, A. P.: Creation of Gases with Interplanetary Oxygen Concentration at Atmospheric Pressure by Nanoparticle Aerosol Scavengers: Implications for Metal Processing from nm to mm Range, ACS Appl. Nano Mater., 6, 1660–1666, https://doi.org/10.1021/acsanm.2c04585, 2023.
Olszok, V., Rembe, P., and Weber, A. P.: Aerosol photoemission as a versatile tool for nanoparticle surface investigations: Evaluation of metal oxide formation and surface properties of multi-component particles, Aerosol Sci. Tech., 58, 54–69, https://doi.org/10.1080/02786826.2023.2285307, 2024.
Pashminehazar, R., Kharaghani, A., and Tsotsas, E.: Determination of fractal dimension and prefactor of agglomerates with irregular structure, Powder Technol., 343, 765–774, https://doi.org/10.1016/j.powtec.2018.10.046, 2019.
Payne, B. P., Biesinger, M. C., and McIntyre, N. S.: The study of polycrystalline nickel metal oxidation by water vapour, J. Electron Spectrosc., 175, 55–65, https://doi.org/10.1016/j.elspec.2009.07.006, 2009.
Petallidou, K. C., Ternero, P., Messing, M. E., Schmidt-Ott, A., and Biskos, G.: Tuning atomic-scale mixing of nanoparticles produced by atmospheric-pressure spark ablation, Nanoscale Adv., 5, 6880–6886, https://doi.org/10.1039/D3NA00152K, 2023.
Pfeiffer, T., Kedia, P., Messing, M., Valvo, M., and Schmidt-Ott, A.: Precursor-Less Coating of Nanoparticles in the Gas Phase, Materials, 8, 1027–1042, https://doi.org/10.3390/ma8031027, 2015.
Pfeiffer, T. V., Feng, J., and Schmidt-Ott, A.: New developments in spark production of nanoparticles, Adv. Powder Technol., 25, 56–70, https://doi.org/10.1016/j.apt.2013.12.005, 2014.
Reinmann, R. and Akram, M.: Temporal investigation of a fast spark discharge in chemically inert gases, J. Phys. D, 30, 1125, https://doi.org/10.1088/0022-3727/30/7/010, 1997.
Schlexer, P., Andersen, A. B., Sebok, B., Chorkendorff, I., Schiøtz, J., and Hansen, T. W.: Size-Dependence of the Melting Temperature of Individual Au Nanoparticles, Part. Part. Syst. Char., 36, 1800480, https://doi.org/10.1002/ppsc.201800480, 2019.
Schmidt-Ott, A. (Ed.): Spark Ablation: Building Blocks for Nanotechnology, Jenny Stanford Publishing, New York, 472 pp., https://doi.org/10.1201/9780367817091, 2019.
Schwyn, S., Garwin, E., and Schmidt-Ott, A.: Aerosol generation by spark discharge, J. Aerosol Sci., 19, 639–642, https://doi.org/10.1016/0021-8502(88)90215-7, 1988.
Seipenbusch, M., Weber, A. P., Schiel, A., and Kasper, G.: Influence of the gas atmosphere on restructuring and sintering kinetics of nickel and platinum aerosol nanoparticle agglomerates, J. Aerosol Sci., 34, 1699–1709, https://doi.org/10.1016/S0021-8502(03)00355-0, 2003.
Snellman, M., Eom, N., Messing, M. E., and Deppert, K.: A thermal evaporator for aerosol core-shell nanoparticle synthesis, J. Aerosol Sci., 175, 106276, https://doi.org/10.1016/j.jaerosci.2023.106276, 2024.
Tabrizi, N. S., Ullmann, M., Vons, V. A., Lafont, U., and Schmidt-Ott, A.: Generation of nanoparticles by spark discharge, J. Nanopart. Res., 11, 315–332, https://doi.org/10.1007/s11051-008-9407-y, 2009.
Tabrizi, N. S., Xu, Q., Van Der Pers, N. M., and Schmidt-Ott, A.: Generation of mixed metallic nanoparticles from immiscible metals by spark discharge, J. Nanopart. Res., 12, 247–259, https://doi.org/10.1007/s11051-009-9603-4, 2010.
Terna, A. D., Elemike, E. E., Mbonu, J. I., Osafile, O. E., and Ezeani, R. O.: The future of semiconductors nanoparticles: Synthesis, properties and applications, Mater. Sci. Eng. B, 272, 115363, https://doi.org/10.1016/j.mseb.2021.115363, 2021.
Tritt, T. M.: Thermal Conductivity: Theory, Properties, and Applications, Springer Science & Business Media, ISBN 978-0-306-48327-1, 2005.
Tyson, W. R. and Miller, W. A.: Surface free energies of solid metals: Estimation from liquid surface tension measurements, Surf. Sci., 62, 267–276, https://doi.org/10.1016/0039-6028(77)90442-3, 1977.
Ullmann, M., Friedlander, S. K., and Schmidt-Ott, A.: Nanoparticle Formation by Laser Ablation, J. Nanopart. Res., 4, 499–509, https://doi.org/10.1023/A:1022840924336, 2002.
Ulmer, U., Dingle, T., Duchesne, P. N., Morris, R. H., Tavasoli, A., Wood, T., and Ozin, G. A.: Fundamentals and applications of photocatalytic CO2 methanation, Nat. Commun., 10, 3169, https://doi.org/10.1038/s41467-019-10996-2, 2019.
Van Teijlingen, A., Davis, S. A., and Hall, S. R.: Size-dependent melting point depression of nickel nanoparticles, Nanoscale Adv., 2, 2347–2351, https://doi.org/10.1039/D0NA00153H, 2020.
von der Weiden, S.-L., Drewnick, F., and Borrmann, S.: Particle Loss Calculator – a new software tool for the assessment of the performance of aerosol inlet systems, Atmos. Meas. Tech., 2, 479–494, https://doi.org/10.5194/amt-2-479-2009, 2009.
Wang, G., Xu, Y.-S., Qian, P., and Su, Y.-J.: The effects of size and shape on the structural and thermal stability of platinum nanoparticles, Comp. Mater. Sci., 169, 109090, https://doi.org/10.1016/j.commatsci.2019.109090, 2019.
Wang, Y., Liu, F., He, C., Bi, L., Cheng, T., Wang, Z., Zhang, H., Zhang, X., Shi, Z., and Li, W.: Fractal Dimensions and Mixing Structures of Soot Particles during Atmospheric Processing, Environ. Sci. Technol. Lett., 4, 487–493, https://doi.org/10.1021/acs.estlett.7b00418, 2017.
Weber, A. P. and Friedlander, S. K.: In situ determination of the activation energy for restructuring of nanometer aerosol agglomerates, J. Aerosol Sci., 28, 179–192, https://doi.org/10.1016/S0021-8502(96)00062-6, 1997.
Weber, A. P., Seipenbusch, M., Thanner, C., and Kasper, G.: Aerosol Catalysis on Nickel Nanoparticles, J. Nanopart. Res., 1, 253–265, https://doi.org/10.1023/A:1010016919254, 1999.
Wu, R., Zhao, X., and Liu, Y.: Atomic insights of Cu nanoparticles melting and sintering behavior in Cu Cu direct bonding, Mater. Design, 197, 109240, https://doi.org/10.1016/j.matdes.2020.109240, 2021.
Zhang, H., Sharma, G., Dhawan, S., Dhanraj, D., Li, Z., and Biswas, P.: Comparison of discrete, discrete-sectional, modal and moment models for aerosol dynamics simulations, Aerosol Sci. Tech., 54, 739–760, https://doi.org/10.1080/02786826.2020.1723787, 2020.
Zhang, Q., Yang, Z., Ding, B., Lan, X., and Guo, Y.: Preparation of copper nanoparticles by chemical reduction method using potassium borohydride, T. Nonferr. Metal. Soc., 20, s240–s244, https://doi.org/10.1016/S1003-6326(10)60047-7, 2010.