the Creative Commons Attribution 4.0 License.
the Creative Commons Attribution 4.0 License.
 | 17 Sep 2025
Insights into new particle formation in a Siberian boreal forest from nanoparticle ranking analysis
Anastasia Lampilahti
Olga Garmash
Diego Aliaga
Mikhail Arshinov
Denis Davydov
Boris Belan
Janne Lampilahti
Veli-Matti Kerminen
Tuukka Petäjä
Markku Kulmala
Ekaterina Ezhova
New particle formation (NPF) plays a critical role in atmospheric processes and climate dynamics. Its mechanisms and impacts remain poorly understood in remote regions like Siberia. In this study, we used the dataset from a long-term campaign (2019–2021) employing particle spectrometers (NAIS and DMPS) to investigate NPF at a boreal forest site in Western Siberia. So far, this is the longest dataset for statistics of Siberian NPF. We classified NPF events, calculated formation and growth rates, and performed nanoparticle ranking analysis. Similar to other boreal sites, spring is the most favorable period for NPF events in Siberia. We observed a seasonal variability in growth rates, with the higher values in summer and the lower values in winter. We showed that the results of the ranking analysis can be used to identify the days with high or low NPF event probability, similar to the previous results obtained on the dataset from a Finnish boreal forest (SMEAR II station). Nanoparticle ranking analysis introduces a new metric, ΔN2.5−5, which is the daily maximum concentration of particles in the 2.5–5 nm range with subtracted background concentration and is linked with both probability and intensity of NPF. In order to identify the factors influencing NPF in Siberia, we analyzed the correlations between ΔN2.5−5 and concentrations of trace gases, such as SO2, O3, NO, and NO2, as well as global solar radiation, temperature, relative humidity (RH), and wind speed. We investigated the dependence of particle formation rate (J3) on ΔN2.5−5, finding a strong positive correlation confirming the connection of ΔN2.5−5 with the probability and intensity of NPF. SO2, linked to anthropogenic pollution, played a significant role in spring when most of the NPF events were observed. Ozone correlated positively with ΔN2.5−5 in spring and summer, likely due to volatile organic compound oxidation. NOx showed seasonally variable effects, with NO positively influencing NPF in autumn and NO2 showing both positive and negative correlations depending on the season. Global solar radiation significantly enhanced NPF by driving photochemical reactions leading to sulfuric acid production. Temperature suppressed NPF in spring and summer, aligning with the SMEAR II findings. RH had a negative influence across seasons, while condensation sink suppressed NPF, particularly in winter when its values peaked. Sulfuric acid calculated via proxy, critical for nucleation and growth, was a key driver of NPF in winter, spring, and autumn. These findings provide a comprehensive understanding of NPF processes in Siberia and highlight the importance of long-term datasets for uncovering regional and seasonal patterns in aerosol formation and growth.
- Article
(3670 KB) - Full-text XML
- BibTeX
- EndNote


New particle formation (NPF) is a phenomenon in which new aerosol particles are formed due to the gas-to-particle conversion influencing atmospheric aerosol particle population (Kulmala et al., 2014). Aerosols can scatter solar radiation, but some of the aerosols can absorb solar radiation (Myhre et al., 2013). Aerosols that mainly scatter solar radiation have a cooling effect on climate (IPCC, 2021). Aerosols also have an impact on clouds, because they can act as cloud condensation nuclei (CCN) (Merikanto et al., 2009; Kazil et al., 2010; Kerminen et al., 2012) and have a significant influence on Earth's radiation budget and climate (Makkonen et al., 2012; Dunne et al., 2016; Gordon et al., 2017). NPF occurs in different environments (Kerminen et al., 2018); one of the well-studied environments is boreal forest because NPF is often associated with biogenic emissions of volatile organic compounds (Bäck et al., 2012; Tunved et al., 2006; Mäki et al., 2019). A significant part of the global boreal forests are located in Siberia, Russia; however, our knowledge is largely based on measurements conducted at European sites, such as the SMEAR II station in Hyytiälä, Finland (Hari and Kulmala, 2005), or SMEAR Estonia in Järvselja, Estonia (Noe et al., 2015).
NPF in forested areas has been widely studied. Dal Maso et al. (2005) analyzed long-term data from the SMEAR II station in Hyytiälä, Finland, finding that NPF events occurred on about 23 % of days annually, with peaks in spring and autumn. These events typically involved the formation of 1.5–3 nm particles that grew into CCN-relevant sizes at rates of 1–10 nm h−1. NPF was associated with sunny, dry conditions, suggesting a photochemical origin of precursor vapors. Despite a high condensation sink, particle formation persisted, likely driven by sulfuric acid and biogenic volatile organic compounds (BVOCs). Studies of NPF in other forested areas have also been conducted. Debevec et al. (2018) found that Mediterranean forests are a significant source of BVOCs, especially monoterpenes and isoprene. Emissions from forest vegetation were primarily influenced by temperature and solar radiation, and the highest NPF activity occurred on warm, sunny days with high emissions levels. Song et al. (2024) studied nighttime particle growth at a rural forest site in southwestern Germany and found that BVOCs, particularly monoterpenes and sesquiterpenes, formed semi-volatile organic compounds that contributed to the rapid mass growth. The air mass trajectory analysis revealed a synergistic role of local vegetation and regional air masses from nearby urban areas as sources of precursor gases for aerosol particles. Andreae et al. (2022) found frequent NPF events in the remote subboreal forest of North America, also presumably driven by BVOCs from forest vegetation.
NPF has also been widely studied in other environments. Bousiotis et al. (2021) investigated NPF events across 13 European sites, covering rural, urban, and roadside environments. They found that NPF events are most common in rural areas, while urban sites show higher particle growth rates due to anthropogenic emissions. Seasonal and air mass differences also impact NPF characteristics, with cleaner air masses favoring NPF events and polluted ones enhancing particle growth. García-Marlès et al. (2024) studied source partitioning of ultrafine particles at urban European sites and found that at 16 out of 19 sites, photonucleation (NPF) contributed between 4 %–41 % of aerosol distribution. Nieminen et al. (2018) conducted a global analysis of NPF in the continental boundary layer using long-term measurements from 36 sites worldwide. Their study revealed that NPF events are prevalent across various environments, including forested, urban, and polluted areas. The frequency of these events exhibits strong seasonal variability, with higher occurrence rates in spring and autumn. The formation rates of 10 nm particles and growth rates in the 10–25 nm size range also show regional differences, influenced by factors such as precursor concentrations and meteorological conditions.
For investigating NPF processes, the classification method described by Dal Maso et al. (2005) is common, and the guidelines for using this method are described in Kulmala et al. (2012). For calculating NPF event frequency, all the days when the measurements are conducted are usually divided into three categories: NPF event days, when formation and growth are clearly observed; non-event days, when no formation or growth happens; and undefined days. Undefined days are those that contain other types of events like “tail”, “apple”, or “bump” (Buenrostro Mazon et al., 2009; Yli-Juuti et al., 2009). We refer to this classification as “traditional”, because it is widely used in the literature (Vana et al., 2016; Dada et al., 2017; Cai et al., 2017; Kerminen et al., 2018; Nieminen et al., 2018; Deng et al., 2020; Bousiotis et al., 2021). The typical annual NPF event frequencies in boreal forest regions vary from 10 % to 30 % (Kerminen et al., 2018; Artaxo et al., 2022). The yearly average NPF event frequency at the SMEAR II station is 26 % (Dal Maso et al., 2005; Vana et al., 2016; Nieminen et al., 2018), and at SMEAR Estonia, it is about 21 % (Vana et al., 2016).
Aerosol-related studies in Siberia were mostly performed using the data from Zotino Tall Tower Observatory (ZOTTO) (Heintzenberg et al., 2011; Chi et al., 2013; Mikhailov et al., 2015; Wiedensohler et al., 2019) and Fonovaya station (Buchelnikov et al., 2020; Arshinov et al., 2021, 2022; Lampilahti et al., 2023; Garmash et al., 2024). Wiedensohler et al. (2019) reported very low annual NPF event frequencies at ZOTTO; only 3 % of days were classified as events. Our previous study at Fonovaya station showed that NPF on average occurs in less than 10 % of days (Lampilahti et al., 2023). We showed that high values of the sky clearness index and high concentrations of trace gases, especially SO2, NO2, and NO, have the largest impact on Siberian NPF in spring. Also, important NPF properties such as growth rates (GR) and formation rates (J) at 5 to 20 nm particle diameter were reported. However, GR and J in Lampilahti et al. (2023) were calculated using the data from the diffusional particle sizer (DPS). This instrument measures particle number size distribution from 3 to 200 nm with 20 size bins, and its resolution is not enough for rigorous calculations. Because of this, the GR and J values, calculated using the data from this instrument, might be less accurate than those calculated from the Neutral cluster Air Ion Spectrometer (NAIS), which measures particle and ion size distributions from 2 to 40 nm with 24 size bins (Gonzalez Carracedo et al., 2022) using the appearance time method (Lehtipalo et al., 2014).
Our recent study based on the data from Fonovaya station showed unexpectedly high monthly NPF frequency (50 % of days in March were event days) during early spring caused by the Siberian heat wave in 2020 (Garmash et al., 2024). That study showed that vapors, such as sulfuric acid, ammonia, and biogenic organic vapors, contribute to the particle formation at this site. The warmer temperatures during the spring heat wave triggered biogenic activity that enhanced NPF event frequency in air masses from polluted areas. Interestingly, frequent NPF in Siberia occurred in polluted masses, whereas at SMEAR II station in the Finnish boreal forest, NPF occurs in the air masses from the clean sector (Vana et al., 2016).
Most of the previous studies focusing on NPF in different environments have used the traditional NPF classification method discussed above. It has certain disadvantages: classification is done manually, which can bring human bias to the results. In this study, alongside the traditional classification, we also used the nanoparticle ranking method. Nanoparticle ranking, introduced by Aliaga et al. (2023), based on the data from the Finnish station SMEAR II, uses the variable ΔN2.5−5, calculated from the particle number concentration at sizes from 2.5 to 5 nm, which is shown to be tightly linked to the occurrence probability and intensity of atmospheric NPF events. The nanoparticle ranking method is objective, quantifiable, and replicable, and it provides a representative value for each measurement day. Another advantage of nanoparticle ranking is that the days are not divided into three categories like in the traditional classification but rather represented in a probabilistic framework. This method provides a continuous variable where, on the one hand, most of the days can be classified as non-events and as events on the other hand.
In this study, we use a new dataset from the measurement campaign at Fonovaya station spanning 2 years (July 2019–November 2021) to get better insight into NPF taking place in Siberia. We analyze NPF statistics using two methods and determine particle formation (J) and growth rates (GR) using more precise calculations, utilizing data from high-resolution instruments, providing better accuracy compared to our previous study (Lampilahti et al., 2023). Furthermore, we explore the seasonal differences in NPF events and use the ranking method to analyze the link of various atmospheric parameters to ΔN2.5−5, representing the occurrence of NPF events and identifying atmospheric conditions that favor NPF in western Siberia during different seasons.
Measurements in remote boreal and subarctic environments are rare but critically important for understanding atmospheric processes under natural conditions, with minimal and mild anthropogenic influence. Our study provides datasets from Fonovaya station, complementing earlier observations from sites such as SMEAR II in Finland (Hari and Kulmala, 2005); SMEAR I in Värriö, northern Finland (Vana et al., 2016); and ZOTTO in central Siberia (Wiedensohler et al., 2019). Comparison between those sites and Fonovaya station shows that the NPF characteristics in boreal forest and sub-Arctic environments can differ significantly even within similar climatic zones. Vana et al. (2016) found that NPF at the three sites is influenced by condensable vapor availability, condensation sink, and air mass origin. Hyytiälä and Järvselja had higher NPF frequencies and growth rates presumably due to higher condensable vapor source rates, while Värriö showed lower rates. Despite a high condensation sink at all sites, NPF persisted in areas with higher vapor availability. Additionally, clean Arctic air masses, associated with clear sky, colder temperature, and lower condensation sink, were associated with more widespread NPF events. While some general trends such as the influence of biogenic emissions are consistent with previous observations, the strongest NPF events at Fonovaya station were observed in polluted air masses (Lampilahti et al., 2023; Garmash et al., 2024). By reporting these findings, we help to fill an important observational gap in the largely unexplored forested area and contribute to a more comprehensive understanding of aerosol processes in boreal and subarctic ecosystems, ultimately supporting the improvement of regional and global climate models.
2.1 Observation sites
In the current study, we used data collected at Fonovaya station in western Siberia, Russia. The station (56°25′′ N, 84°04′′ E) is located in Tomsk region, Russia. The description of the station can be found in Antonovich et al. (2018) and Lampilahti et al. (2023). The closest cities are Tomsk (60 km east of the station, about 600 000 inhabitants) and Novosibirsk (170 km south-southwest, 1 200 000 inhabitants). The measurement site is situated on the east bank of the Ob river and surrounded by the mixed boreal forest.
2.2 Instrumentation
In 2019–2021, INAR and IAO undertook a measurement campaign at Fonovaya station to perform a more accurate and comprehensive analysis. The following instrument suite was used: Neutral cluster Air Ion Spectrometer (NAIS), Particle Size Magnifier (PSM), Differential Mobility Particle Sizer (DMPS), and Chemical Ionization Atmospheric Pressure interface Time-Of-Flight Mass Spectrometer (CI-APi-TOF). PSM and DMPS allowed particle number size distributions to be measured in a wider size range. Here, we present for the first time the analysis of the 2-year detailed dataset of aerosol measurements using NAIS and DMPS.
Table 1Variables and corresponding instrumentation used in this study.
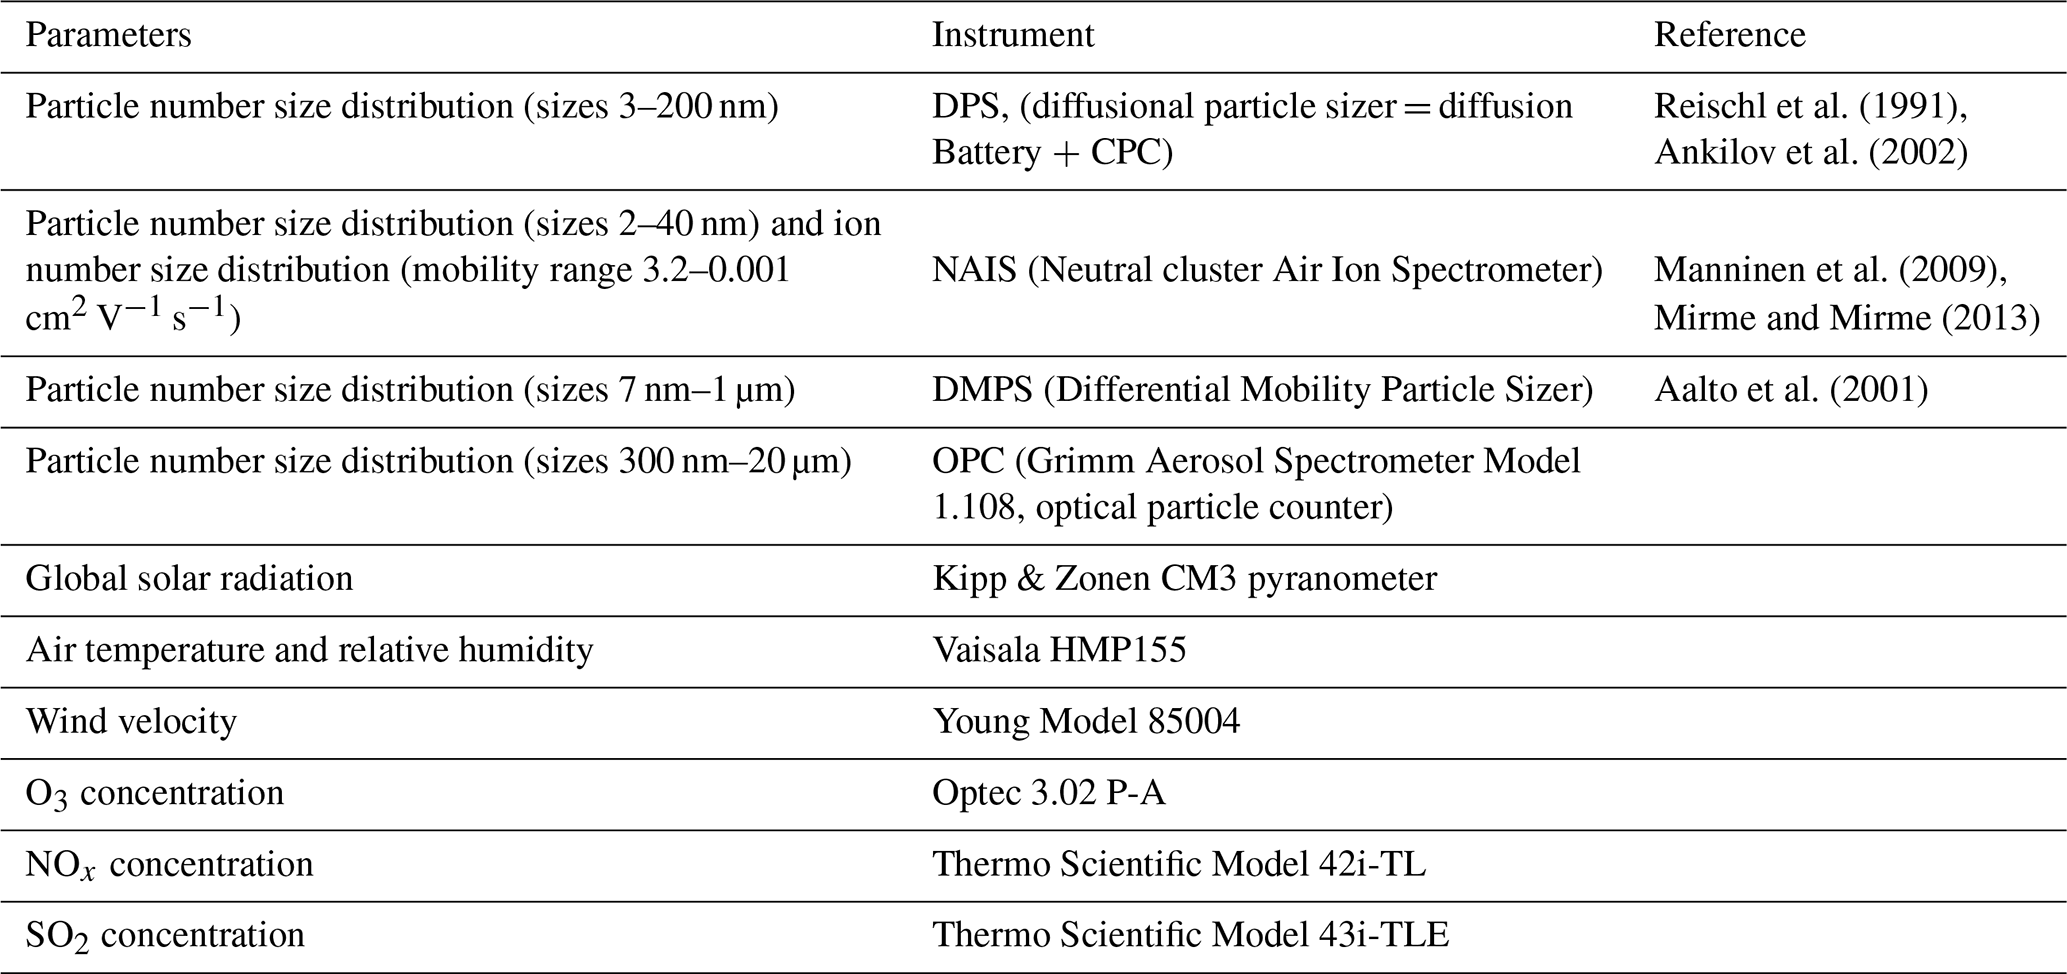
The instruments we used in the present study are listed in Table 1. For measuring particle and ion size distributions we used a Neutral cluster Air Ion Spectrometer (NAIS, Airel OÜ) (Manninen et al., 2009; Mirme and Mirme, 2013). NAIS measures the number size distribution of aerosol particles within a size range from 2.0 to 40 nm, as well as the number size distribution of positive and negative ions with the electric mobility range within 3.2–0.001 cm2 V−1 s−1, corresponding to 0.8–40 nm (Millikan–Fuchs equivalent diameter; Mäkelä et al., 1996).
For measuring particle number size distribution in size range from 7 nm to 1 µm, we used the Differential Mobility Particle Sizer (DMPS). The instrument consists of two parts: a differential mobility analyzer (DMA), made at the University of Helsinki, and a condensation particle counter (CPC), A10 manufactured by Airmodus Oy. The aerosol sample is neutralized using an X-ray source (Hamamatsu, Japan). DMPS was described in detail by Aalto et al. (2001).
Particle size distributions ranging from 3 nm to 0.2 µm at the Fonovaya station are measured routinely using a diffusional particle sizer (DPS). The DPS consists of the Novosibirsk-type eight-stage screen diffusion battery (Reischl et al., 1991; Ankilov et al., 2002) connected to the condensation particle counter (CPC). CPC Model 5.403 (GRIMM Aerosol Technik, Germany) was used until July 2019, and after CPC Model 3756 (TSI Inc., USA) was used. Additionally, the distribution of particles within the size range of 0.3 to 20 µm (across 15 size bins) is measured using the Grimm aerosol spectrometer Model 1.108 (OPC).
Continuous measurements of different atmospheric parameters are concurrently performed. The measured parameters are meteorological, such as atmospheric pressure, temperature, relative humidity (RH), wind speed and direction, and global solar radiation. The trace gas concentrations were measured with a set of trace level monitors indicated in Table 1 for SO2, O3, and NOx.
2.3 Data analysis
2.3.1 Classification of new particle formation events
We classified all days based on NPF characteristics using two different methods: traditional manual classification, described by Dal Maso et al. (2005), and nanoparticle ranking analysis, described by Aliaga et al. (2023), and then compared the results obtained from these two approaches.
2.3.2 Traditional new particle formation event classification
We classified NPF events, non-events, and undefined events using the algorithm, described in Dal Maso et al. (2005). As this method was widely used in previous studies, here we call it “traditional”. As mentioned before, we classify individual measurement days into three categories and calculate the fraction of days when NPF events occur, non-event days, and undefined days. We analyze data visually on a day-to-day basis. Days when new particle mode appears in the sub-5 nm range and shows subsequent signs of growth longer than 2 h are classified as NPF event days. Days when no new mode is observed or if the new mode persists shorter than half an hour are classified as nonevent days. Other days are classified as undefined. If the month has less than 80 % of data available, it is excluded from monthly statistics. We considered the years from 2016 to 2021. We used DPS particle number size distribution for the time period from January 2016 to June 2019. For the time period from July 2019 to November 2021, we used the distributions derived from NAIS (particle operation mode).
Traditional classification has several disadvantages. NPF events with weak intensity can be classified incorrectly due to instrumental limitations. In addition, when differently visualized, even non-event days clearly demonstrate signs of growth of the aerosol particles similar to NPF days (Kulmala et al., 2012). That is why in this study we compare traditional classification with the results of nanoparticle ranking analysis, which fits better at recognizing the quiet new particle formation (Kulmala et al., 2022).
Nanoparticle ranking analysis
We used nanoparticle ranking analysis to determine the occurrence probability and estimate the strength of NPF events. This method was described in Aliaga et al. (2023). Unlike the traditional classification, nanoparticle ranking analysis is objective, quantifiable, and replicable and does not contain human bias. It is based on analysis of the particle number concentration at sizes from 2.5 to 5 nm. Particles of this range are sensitive to the presence of atmospheric NPF, and the increasing particle number concentration indicates nucleation and growth in the atmosphere. To perform ranking analysis, we extract the time series of the particle number concentration in the above-mentioned size range and filter the data (rolling median with 2 h window). The metric used is ΔN2.5−5, which represents the difference between the daily maximum and daily background concentrations of particles in this size range. Then, each day is ranked according to this metric. For each measurement day, we have a single representative value of ΔN2.5−5 that allows us to compare the results of nanoparticle ranking analysis with traditional NPF classification. All the days were grouped into 5 % intervals based on their ranking to determine the corresponding potential NPF pattern for each interval. We used ΔN2.5−5 representing the peak daytime number concentration of the formed particles with respect to the background concentration on that day, to see how it correlates with different parameters linked to NPF, such as trace gases concentrations, meteorological parameters, global solar radiation, and condensation sink. For calculations, we used data from NAIS from July 2019 to November 2021. For all atmospheric parameters, we took daily medians between 10:00 and 14:00 local time because NPF events at Fonovaya station occur in this time interval. The raw SO2 data have an increasing linear trend that is related to instrument calibration. We corrected this instrumental bias by subtracting the trend line's slope from the measured concentrations during 2016–2021.
2.3.3 Particle loss parameters
Condensation sink (CS) is a parameter that shows how fast the molecules are lost by condensation onto pre-existing aerosol particles (Pirjola et al., 1999), and it is calculated from the particle number size distribution. We calculated CS using two different methods. Firstly, it was calculated using particle number size distribution data from DPS and OPC. This dataset covers the period from January 2020 to the end of June 2021. The ranges of particle diameters covered by those instruments do not overlap; the data from 200 to 300 nm are missing, which is why the missing part was gap-filled with the nearest neighbor method (Ezhova et al., 2018). Secondly, CS was calculated using the data from DMPS. This dataset includes data from March to September 2020 and from January to May 2021. The scatterplot comparing the results from the different instruments is shown in Fig. 1. The CSs from both datasets are strongly correlated (Fig. 1). We relied on DMPS-based CS, calculated from the non-gap-filled distribution, and corrected the DPS + OPC obtained values of CS. The DPS + OPC dataset has longer data coverage. Therefore, the corrected CS values from this instrument were used in this study.
Coagulation sink (CoagS) is the parameter that shows how fast the particles of a certain size are lost by collisions with particles of larger sizes (Dal Maso et al., 2002). It is related to CS (Kulmala et al., 2012) and can be calculated using the following equation:
where the exponent m depends on the shape of the size distributions and is approximated to be equal to −1.7 (Lehtinen et al., 2007).
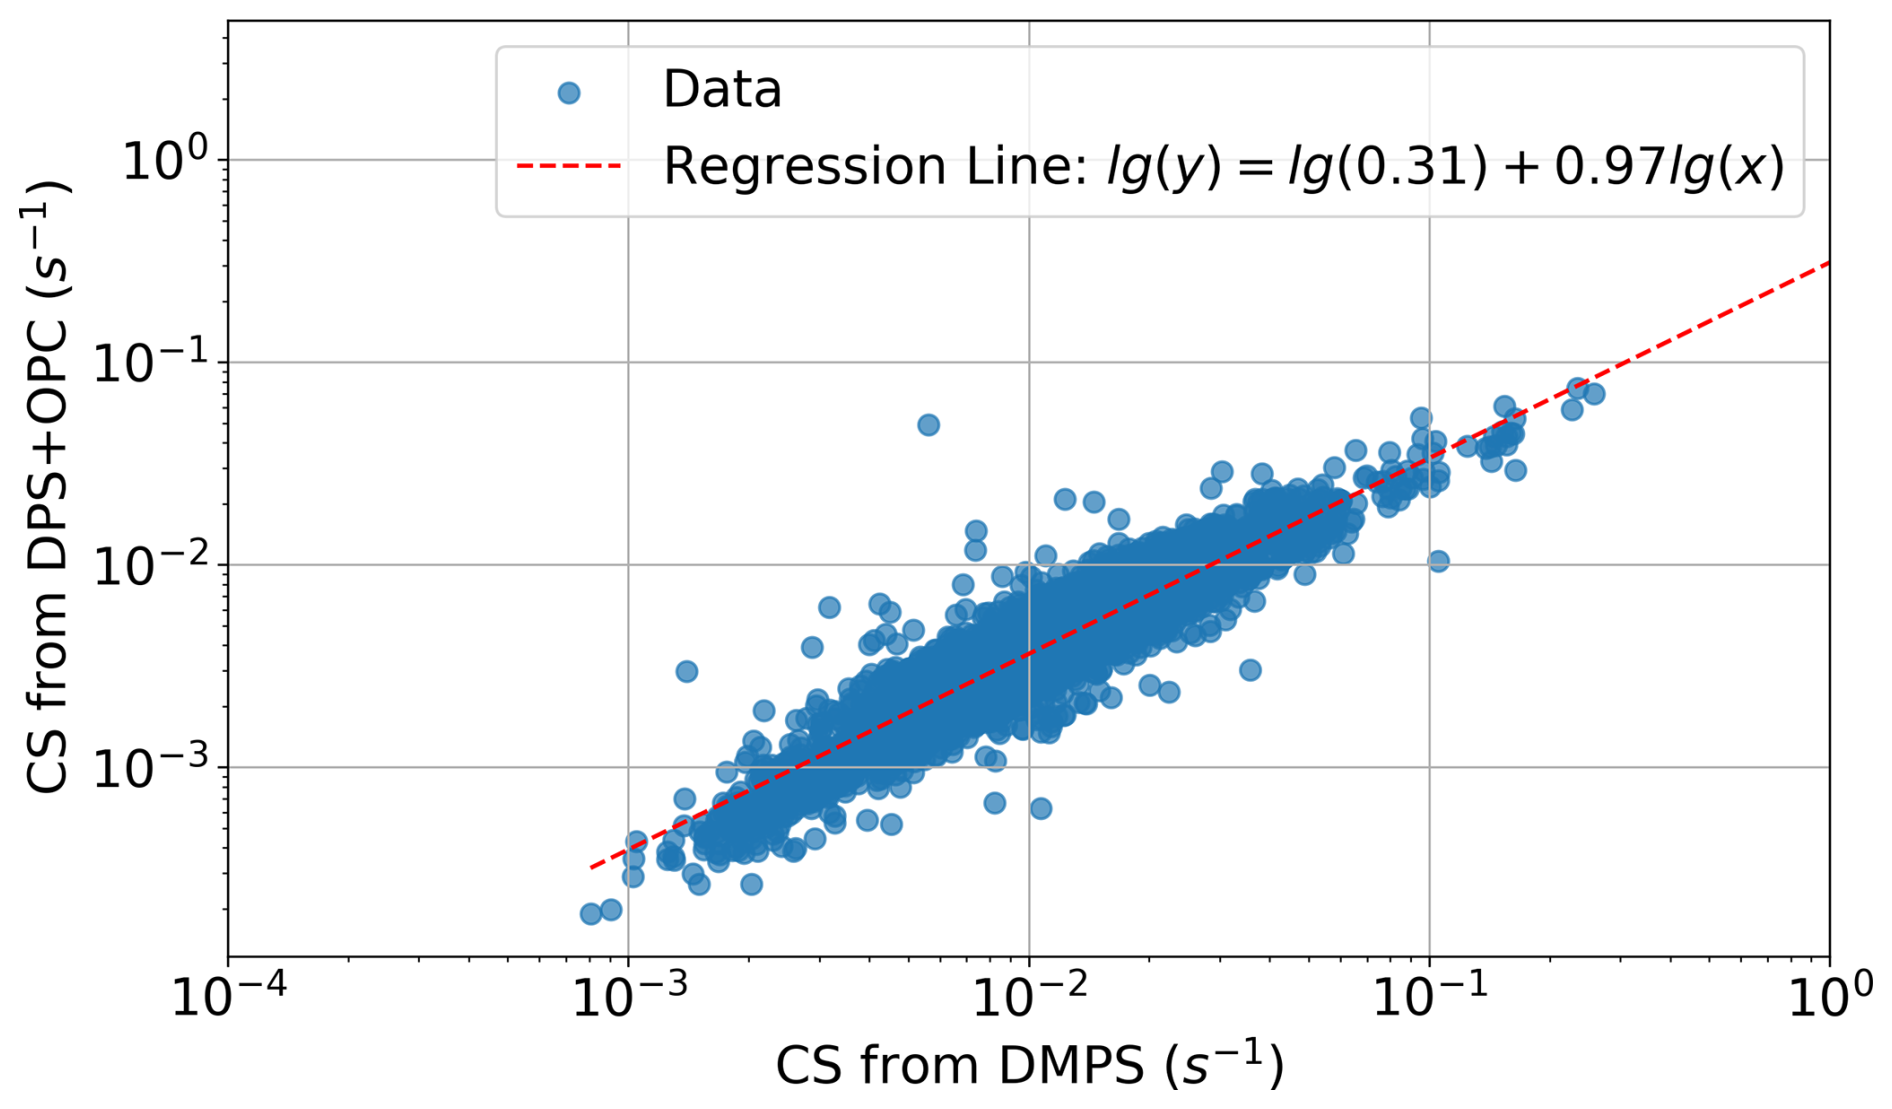
Figure 1Comparison between CS calculated from DMPS and DPS + OPC, hourly resolution. Correlation coefficient = 0.90.
2.3.4 Particle formation and growth rates
Growth rate (GR) is a parameter that characterizes how fast the population of particles with diameter dp grows in time:
where dp1 and dp2 are the representative particle diameters at times t1 and t2 respectively (Kulmala et al., 2012).
In this study, growth rate (GR) values were calculated using the appearance time method, as described by Lehtipalo et al. (2014). This method involves selecting a time interval during which particles reach a specific size and calculating the GR based on the time difference between successive sizes. To do this, we select various particle diameters and fit the time-dependent concentration of particles at each diameter with a sigmoid function. The time at which the sigmoid function reaches 50 % of its maximum value is recorded for each diameter. Finally, the relationship between particle diameter and time is fitted with a linear function, and the slope of this line provides the GR value.
For calculating GR, we used the data from NAIS. GR was calculated using ion size distributions in the following size ranges: from 2 to 3 nm, from 3 to 7 nm, and from 7 to 20 nm. We used ion data for calculations because the ion mobility range corresponds to a wider mobility diameter range than particle data. It is especially important when considering the GR of particles with smaller diameters.
The formation rate (J) of particles in a size range between dp and dp+Δdp was calculated as follows (Kulmala et al., 2012):
The particle formation rate at size dp is in this equation. J can be estimated using the following equation:
We calculated J values using two different methods. In the first method, J values only for NPF event days were calculated using the NAIS data. The particle formation rate for 3 nm particles (J3) was calculated using particle data; meanwhile, for J2 we used ion data because, in the ion mode, the detection limit is lower than in particle mode.
For calculating J, we take the time t1, where the particles start forming, and time t2, where newly formed particles grow till 6 nm. Then we calculate the daily J time series and calculate the median J from t1 to t2. This value is a sought J used in this analysis.
In the second method, we used combined data from NAIS and DMPS and calculated J values for all available days, including NPF event days, non-event days, and undefined. This method is fully automated. The first method of J calculation gives better accuracy, and the second method is needed for an overall picture because it allows us to calculate J values also for non-event days. For calculating GR and J, we used data from July 2019 to November 2021.
2.3.5 Sulfuric acid proxy
A simple sulfuric acid proxy was calculated from the parameterization introduced by Petäjä et al. (2009):
where [SO2] is the measured concentration of sulfur dioxide, GlobR is the measured global radiation, and CS is the condensation sink. Parameter m2 W−1 s−1 was calculated for spring 2021 at the Fonovaya station based on the measurements with CI-APi-TOF (Garmash et al., 2024).
3.1 New particle formation event classification
3.1.1 Traditional NPF event classification: formation and growth rates during NPF days
The classification of NPF events following Dal Maso et al. (2005) is illustrated in Fig. 2a. The fraction of NPF event days has maxima in spring (March, April 2020) and autumn (October 2019, September 2020). This result is qualitatively similar to previous results for the Fonovaya station (Lampilahti et al., 2023) and other boreal forest stations, such as SMEAR II (Dada et al., 2017). However, the year 2020 was unique in comparison to other years (Garmash et al., 2024). In 2020, 24 % of days were classified as event days, 31.6 % were undefined days, and 44.4 % were nonevents, which differs strikingly from previous results. During 2016–2018, less than 10 % of the days contained events, 21.1 % were undefined, and 69 % were nonevents (Lampilahti et al., 2023). The number of event days in 2020 is thus significantly higher than during 2016–2018 (Fig. 2b), especially in spring. The number of undefined days was also higher. Garmash et al. (2024) hypothesized that in spring 2020 warmer temperatures triggered early biogenic activity, which caused a high NPF frequency in early spring (March–April). Both spring and winter 2020 were exceptionally warm. Figure 1b shows that more NPF events also occurred in October 2019 than in other years, which preceded the heat wave in 2020 (Garmash et al., 2024).
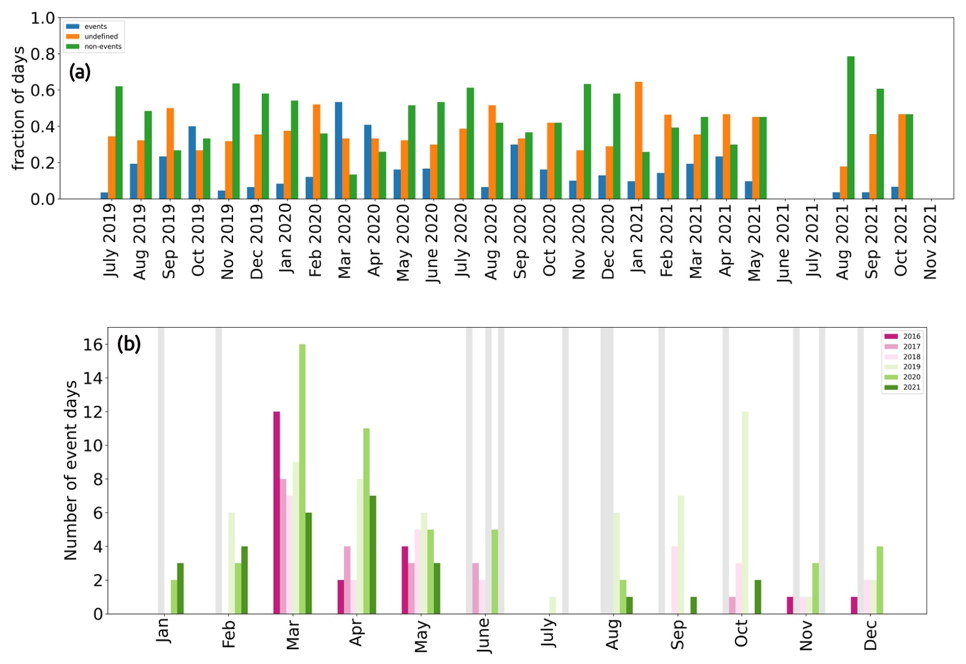
Figure 2(a) Monthly traditional NPF event classification from July 2019 till October 2021, the y axis representing fractions of NPF event, nonevent, and undefined days. (b) Number of NPF event days for each month shown for each year from 2016 to 2021. Gray shading corresponds to the months with data excluded from analysis (<80 % data available).
For the NPF event days, we calculated J and GR values and considered yearly (Table 2) and monthly medians for each diameter range. Figure 3a shows the boxplot of monthly J2, ions for the whole dataset. The median J2, ions for the whole measurement period equals 0.01 cm−3 s−1. Figure 3b represents the boxplot of monthly J3, total. Yearly medians for and J3, particles are listed in Table 2. J values have a seasonal variability according to Fig. 3: the highest J values are observed in spring, followed by autumn. Summer and winter have the lowest median J. This result agrees with previous studies. J values for Fonovaya station were previously reported by Nieminen et al. (2018), and they were calculated for particles from 10 to 25 nm using the DPS data. The median J values were 1.2 cm−3 s−1 for spring, 0.7 cm−3 s−1 for summer, 1.0 cm−3 s−1 for autumn, and 0.3 cm−3 s−1 for winter, so the seasonal pattern is similar to our results. The same pattern was observed at another boreal forest site SMEAR II station in Hyytiälä, Finland. J values reported by Nieminen et al. (2018) from SMEAR II have similar seasonal variability. J values from 5 to 30 nm for the Fonovaya station were calculated by Lampilahti et al. (2023). The median value was equal to 0.8 cm−3 s−1.
Figure 4a, b, and c show the monthly median total GR values (calculated from positive + negative ions) in the size ranges 2–3, 3–7, and 7–25 nm, respectively. For the size ranges 3–7 and 7–25 nm (Fig. 4b and c), we can clearly see a seasonal variability: monthly median values have minima in winter and maxima in May. For summer there is not enough measurement data to draw any firm conclusions.
For the Fonovaya station, GR was reported by Lampilahti et al. (2023). In that study, growth rates were calculated in the diameter range from 5 to 20 nm, and the median value of GR was equal to 2.0 nm h−1 during 2016–2018. This value is lower than the values we got in the current study (Table 2; the closest variable is GR7−20, which is equal to 2.9–3.3 nm h−1 depending on the year). The difference can be caused by several reasons: first, we use ion size distribution for calculations, whereas in the previous study, the particle size distribution was used; second, we used NAIS data instead of DPS data; and third, we used different methods for GR calculations (appearance time versus mode fitting method in Lampilahti et al., 2023). The observed growth rates reported for various boreal forest sites in the literature vary from about 0.5 to 5.3 nm h−1 (5th to 95th percentile values), with a median GR of 2.7 nm h−1 (Kerminen et al., 2018) At the SMEAR II station in Hyytiälä, Finland, the median values of GR were found to be the highest in summer (4.5 nm h−1) and the lowest in winter (2.0 nm h−1) (Nieminen et al., 2018). For the same SMEAR II station, Yli-Juuti et al. (2011) reported the following median GR values: 1.9 nm h−1 for the size range from 1.5 to 3 nm, 3.8 nm h−1 for the size range from 3 to 7 nm, and 4.3 nm h−1 for the size range from 7 to 20 nm. That research covered the time period 2003–2009. Overall both the seasonal pattern of GR (Fig. 4) and its size dependency (Table 2) observed in our study are broadly in line with earlier studies in various boreal forest environments.
Previously, a GR for Fonovaya station was reported by Nieminen et al. (2018). In that study, the authors calculated GR from 10 to 25 nm for 36 different measurement sites all over the world. The median value of GR at the Fonovaya station was the highest in summer (6.7 nm h−1) and the lowest in winter (0.8 nm h−1), while the corresponding medians across all the stations were equal to 4.0 and 2.9 nm h−1. In comparison to other sites, the seasonal variability for Fonovaya station was higher. The spring median for Fonovaya was reported as 2.6 nm h−1, and the autumn median was 2.3 nm h−1 (Nieminen et al., 2018). For calculations, the authors used DPS data. In our study, we also observe a similar seasonal variability: GR7−20 values are lower in winter and increased in May (Fig. 4c).
3.1.2 Nanoparticle ranking analysis and comparison to traditional classification
In order to have a quantifiable parameter that characterizes NPF, we decided to perform nanoparticle ranking analysis. The first step of nanoparticle ranking analysis is extracting hourly particle concentrations in the 2.5 to 5 nm size range. We grouped the time series by season (Fig. 5) in order to understand how those values vary seasonally. Most of the NPF events at the Fonovaya station fall in March and early April (Fig. 1a), and accordingly, in ranking analysis, we observe the maximum concentration in spring at around 12:00 LT. A similar result is observed also at the SMEAR II station, where spring maximum concentration is also reached at around 12:00 LT (Aliaga et al., 2023). Winter and autumn have very similar daily medians and profiles, while summertime concentrations are lower.
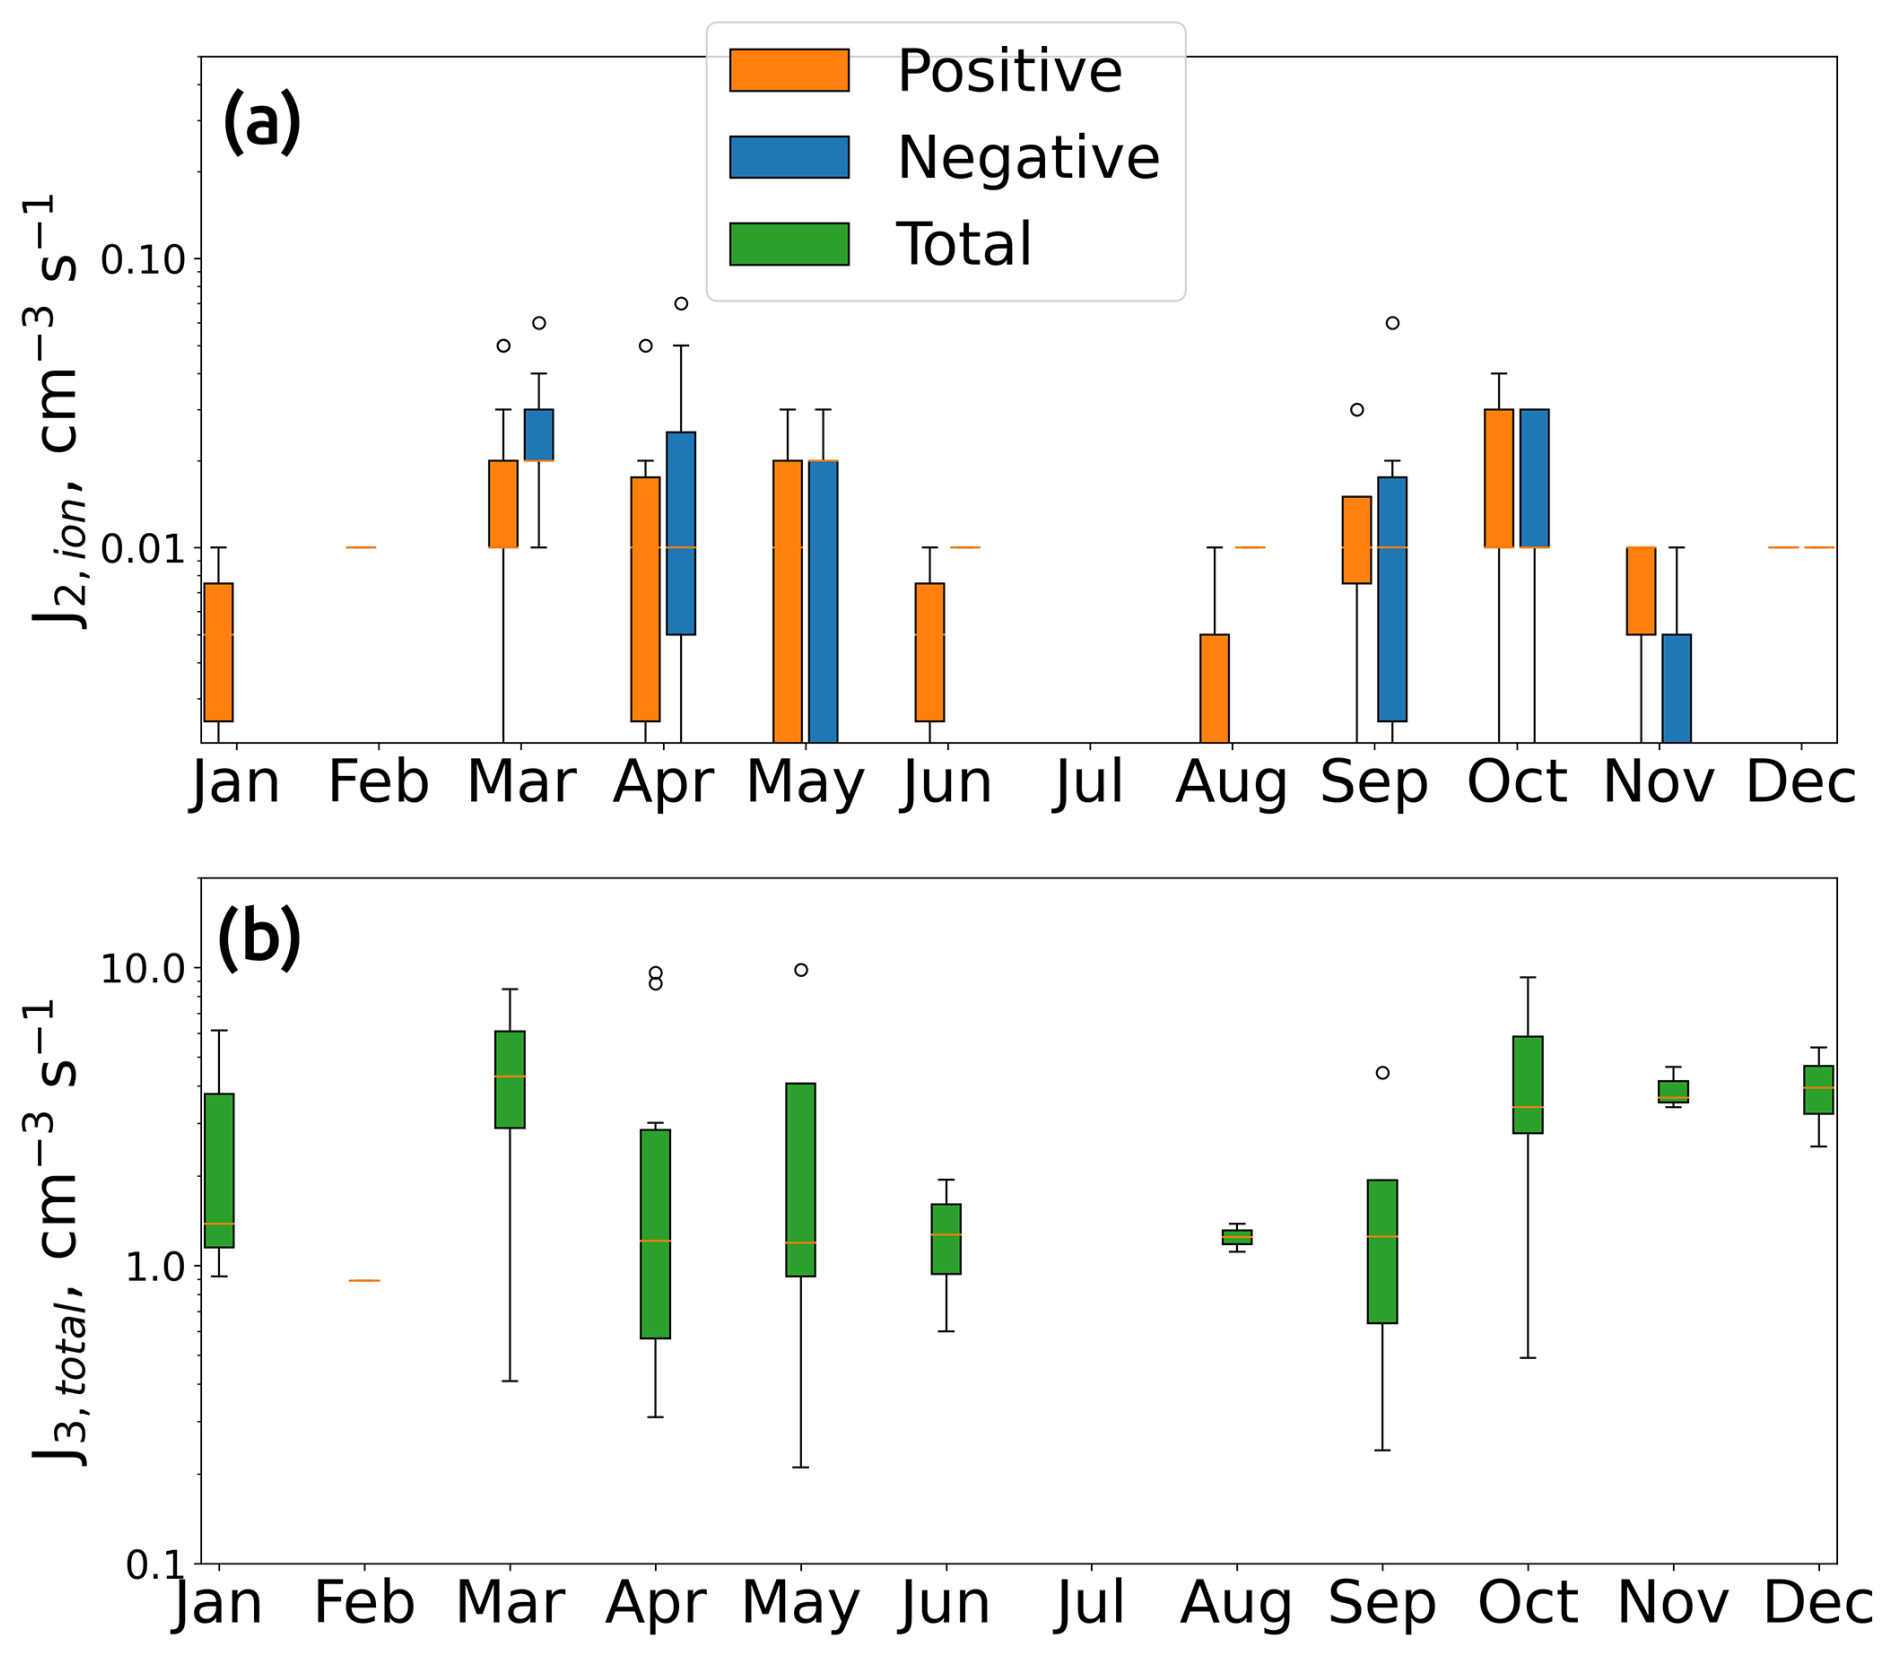
Figure 3Monthly boxplots for formation rates. The y axis represents particle formation rates (J); the x axis represents months. Positively charged ions (a) are marked orange and negatively charged marked blue. Total values (positively charged + negatively charged) are marked green.
Figure 6 shows daily median particle size distributions grouped into 5 % intervals based on ΔN2.5−5 values. The figure illustrates the shape of particle distribution in each interval. In this figure, one can clearly see that smaller rank values visibly correspond to non-events (0 %–60 % interval), whereas NPF events become visible for higher rank values (60 %–100 % intervals). The median number size distribution in 5 % intervals could be influenced by the half-a-year heat wave of 2019–2020: we observed an increased number of NPF events in spring, resulting in a higher representation of these events in our statistics. Particularly, in Fig. 6 we can currently observe formation and growth starting from the 60 %–65 % interval. Without heat wave data during ordinary years, this visible formation and growth might be shifted to higher percentiles like 70 %–75 % or more. In Fig. 7 in 60 %–65 % and 65 %–70 % intervals during ordinary years, we might observe less event data and more nonevent data.
Furthermore, we compared results from the nanoparticle ranking analysis with traditional NPF event classification (Fig. 7). The histogram displays the percentile rankings divided into 5 % bins, and the color code represents the traditional classification. Days with ranks below 60 % are mostly classified as non-event days or undefined events. Above the 60 % interval, the number of non-event days decreases, and at the highest interval, 95 %–100 %, non-events are not observed. The fraction of days classified as NPF event days starts to grow after a percentile ranking of 85 % and above and reaches the maximum at 90 %–100 % intervals. At the interval of 60 %–85 %, weak NPF events are visible. This result is in line with the results presented by Aliaga et al. (2023), where a similar relationship between the results of ranking analysis and traditional NPF classification was observed for the SMEAR II station. Ranks below 65 % are classified as non-event days, from 65 % to 85 % NPF events are weak, and above 85 % NPF events are clear with maximum intensity at 90 %–100 % intervals. It helps to identify ΔN2.5−5 corresponding to traditionally classified NPF and non-NPF events; this will be used in the next section. Note, however, that the present analysis was performed on the dataset containing the exceptional year 2020 with a large number of NPF events, which may have influenced the comparison between ΔN2.5−5 and NPF events at higher ΔN2.5−5 values.
Table 2Yearly medians of formation and growth rates. J2 is calculated using NAIS ion data, and J3 is calculated using NAIS particle data.
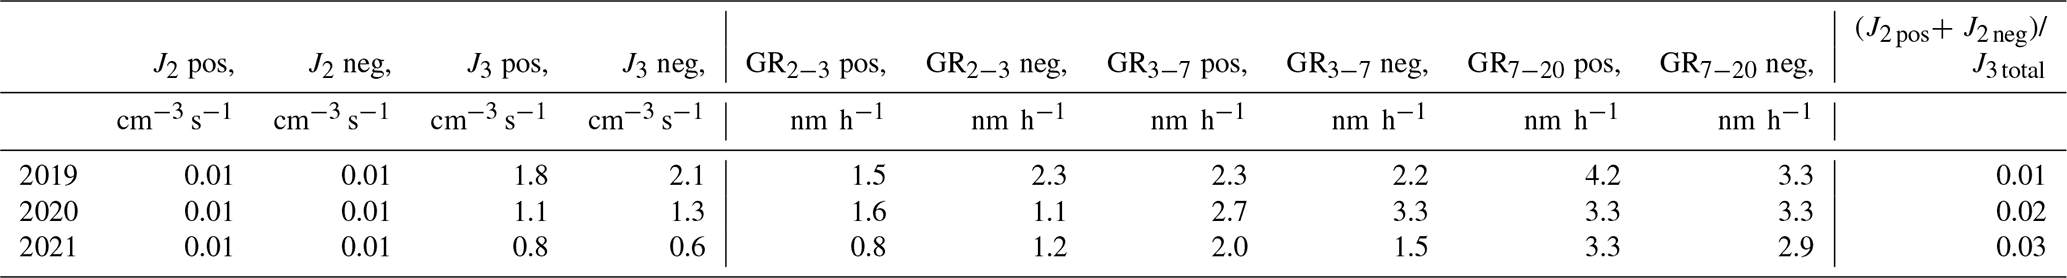
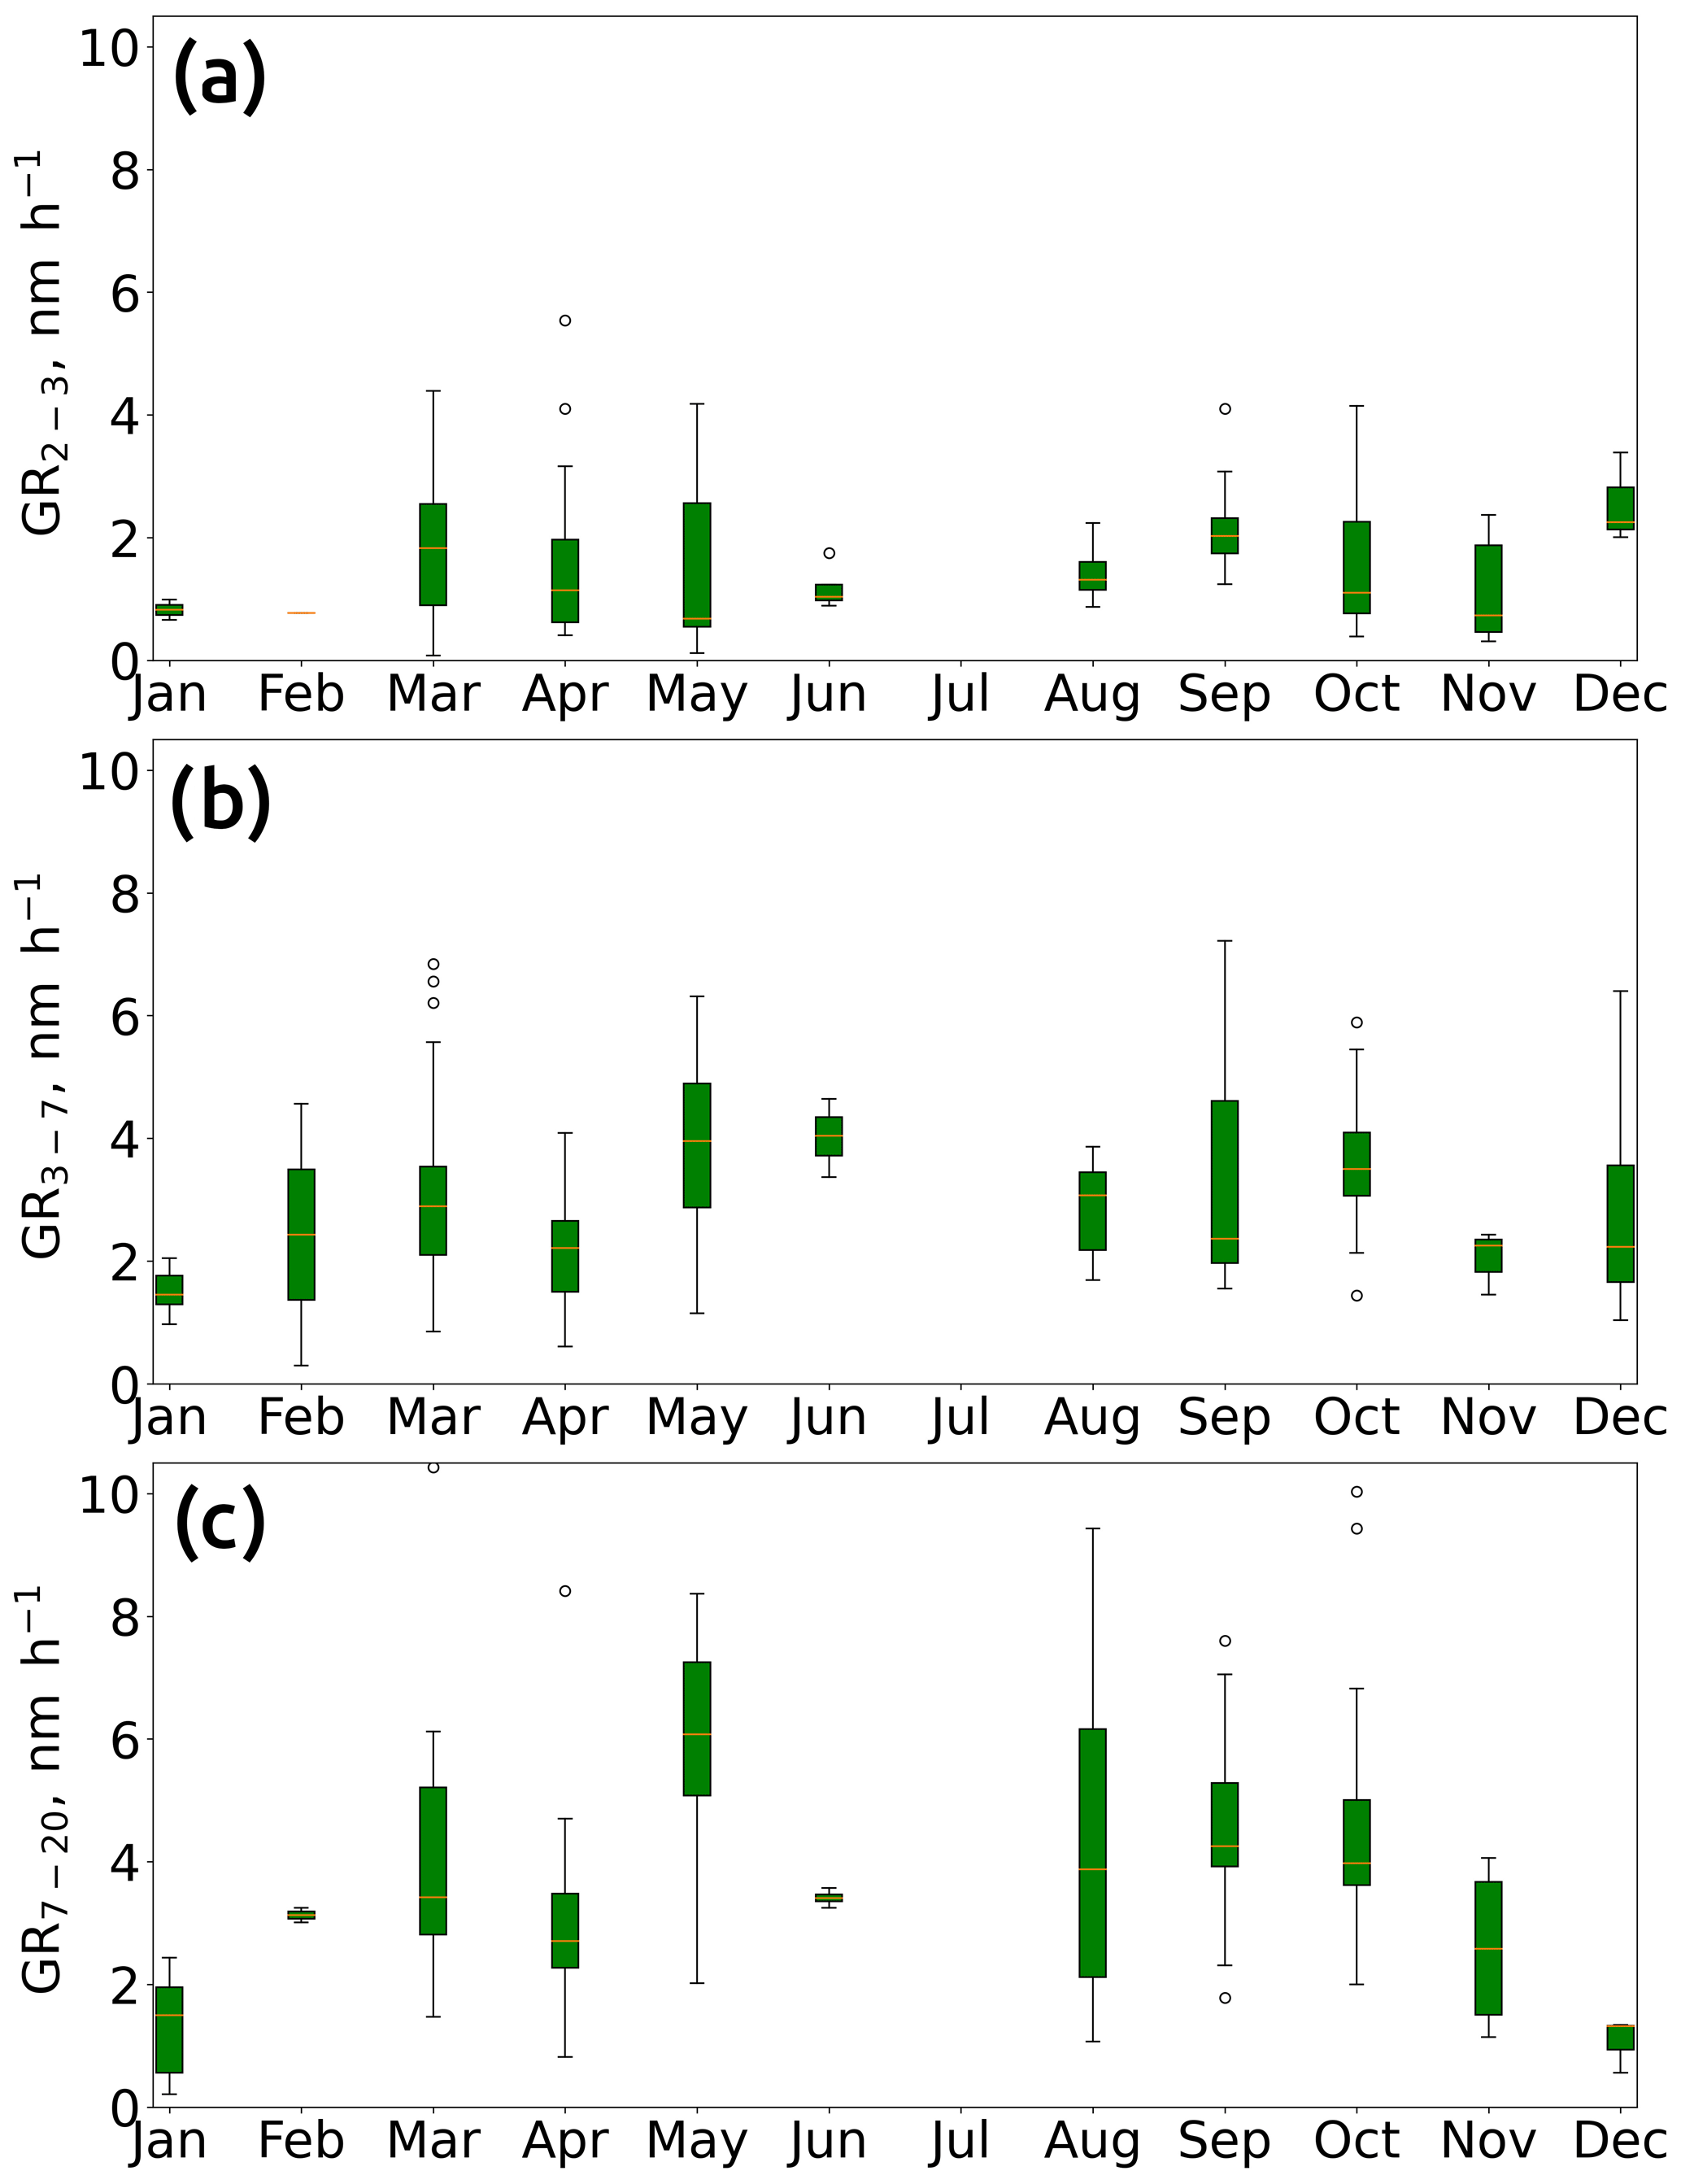
Figure 4Monthly boxplots for growth rates. The y axis represents the total GR values; the x axis represents months.
3.1.3 Correlations between nanoparticle ranking and different atmospheric parameters
Using the nanoparticle ranking framework, we can investigate the influence of different atmospheric parameters on NPF occurrence. We considered the correlation between ΔN2.5−5 and relevant atmospheric variables, such as concentrations of trace gases (SO2, O3, NO, NO2), global solar radiation, temperature, relative humidity (RH), and wind speed. ΔN2.5−5 values that correspond to percentiles above 85 % are associated with NPF events and those below 40 % with nonevents (Fig. 7), and the corresponding ΔN2.5−5 values are above 2400 cm−3 for NPF events and ΔN2.5−5 below 250 cm−3 for non-events. The correlations are shown in Fig. 9 with all the data points color-coded seasonally. The light-blue shading in those plots indicates the values of ΔN2.5−5 corresponding to a high probability (percentile >85 %) of NPF event days, and the green shading highlights the days with low NPF probability (percentile <40 %).
Under the influence of solar radiation, SO2 in the atmosphere is oxidized by OH to form sulfuric acid (H2SO4) vapor, which plays a central role in aerosol formation and growth because its low volatility and high affinity for water makes it a key component in cluster formation and early growth of such clusters (Petäjä et al., 2009; Kulmala et al., 2013; Cai et al., 2021). The correlation between ΔN2.5−5 and SO2 is positive and statistically significant in spring (Table 3), when most NPF events are observed (Fig. 2b). Similarly, Lampilahti et al. (2023) reported that median values of SO2 concentration have a statistically significant difference between event days and non-event days at the Fonovaya station during spring 2016–2018. This study suggested that SO2 is associated with anthropogenic emissions coming from the city of Novosibirsk and Kazakhstan, and the median SO2 concentration at the Fonovaya is about an order of magnitude higher than at the SMEAR II station. High SO2 concentrations at SMEAR II station are also associated with anthropogenic emission sources in Saint Petersburg, Baltic countries, and the Kola Peninsula (Hulkkonen et al., 2012; Riuttanen et al., 2013). The highest SO2 concentrations were observed in winter (Fig. 9a), because in Siberia house heating is done by burning fossil fuels (coal, oil, gas) that release SO2 into the atmosphere, as well as because of air mass transport from polluted areas. During this season, however, the amount of solar radiation is low, which is possibly why sulfuric acid concentration is low (Fig. 10b) and the number of NPF events is also low. Similar seasonal patterns were reported for the SMEAR II station: SO2 concentration has a maximum in winter (February), and the lowest levels prevail from May to September. The winter maximum is connected to heating and slower atmospheric chemistry due to the low intensity of sunlight (Nieminen et al., 2014). The connection between SO2 concentration and NPF frequencies in previous studies is ambiguous, as the NPF frequencies were reported to be either higher (Birmili and Wiedensohler, 2000; Woo et al., 2001; Dunn et al., 2004; Boy et al., 2008; Young et al., 2013; Zhao et al., 2015) or lower (Wu et al., 2007; Dai et al., 2017) concentration depending on the location. One study reported that the correlation between NPF occurrence and SO2 concentration depends on the season: in spring and summer SO2 concentrations during the NPF event days were higher than during the non-event days (Qi et al., 2015).
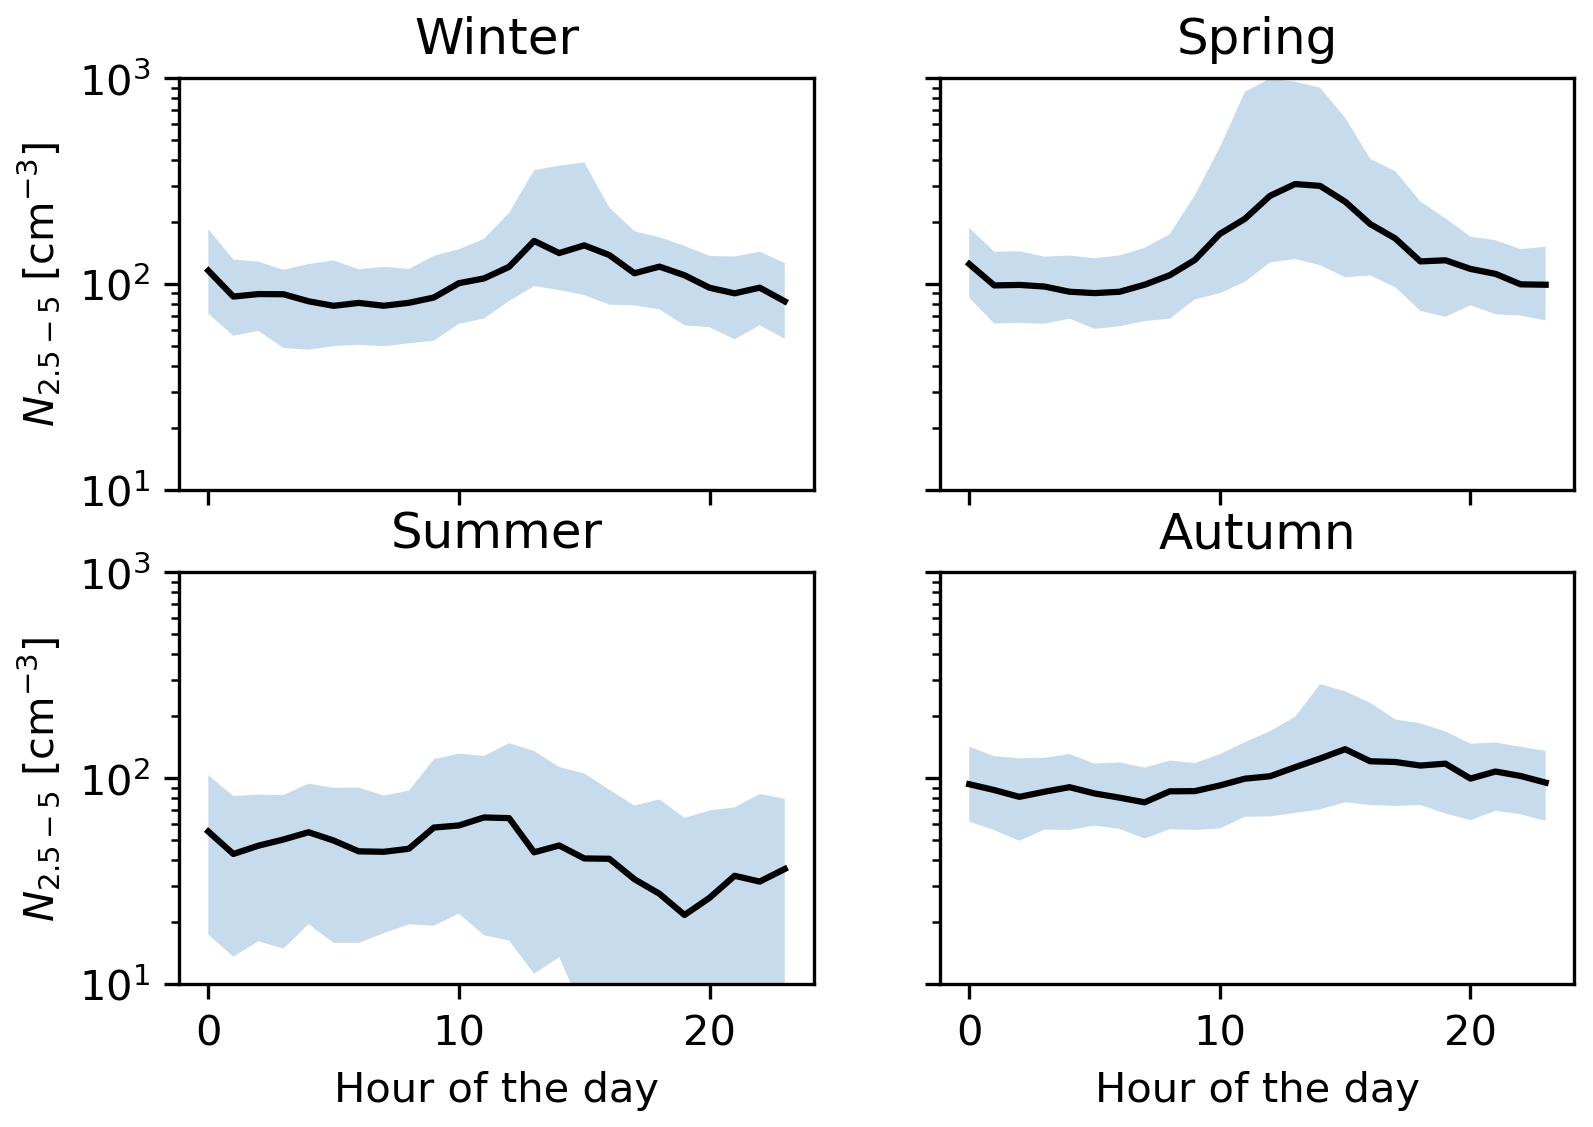
Figure 5Daily medians of particle concentration in the 2.5 to 5 nm range grouped by season. The x axis represents the hour of the day; the y axis is the particle concentration.
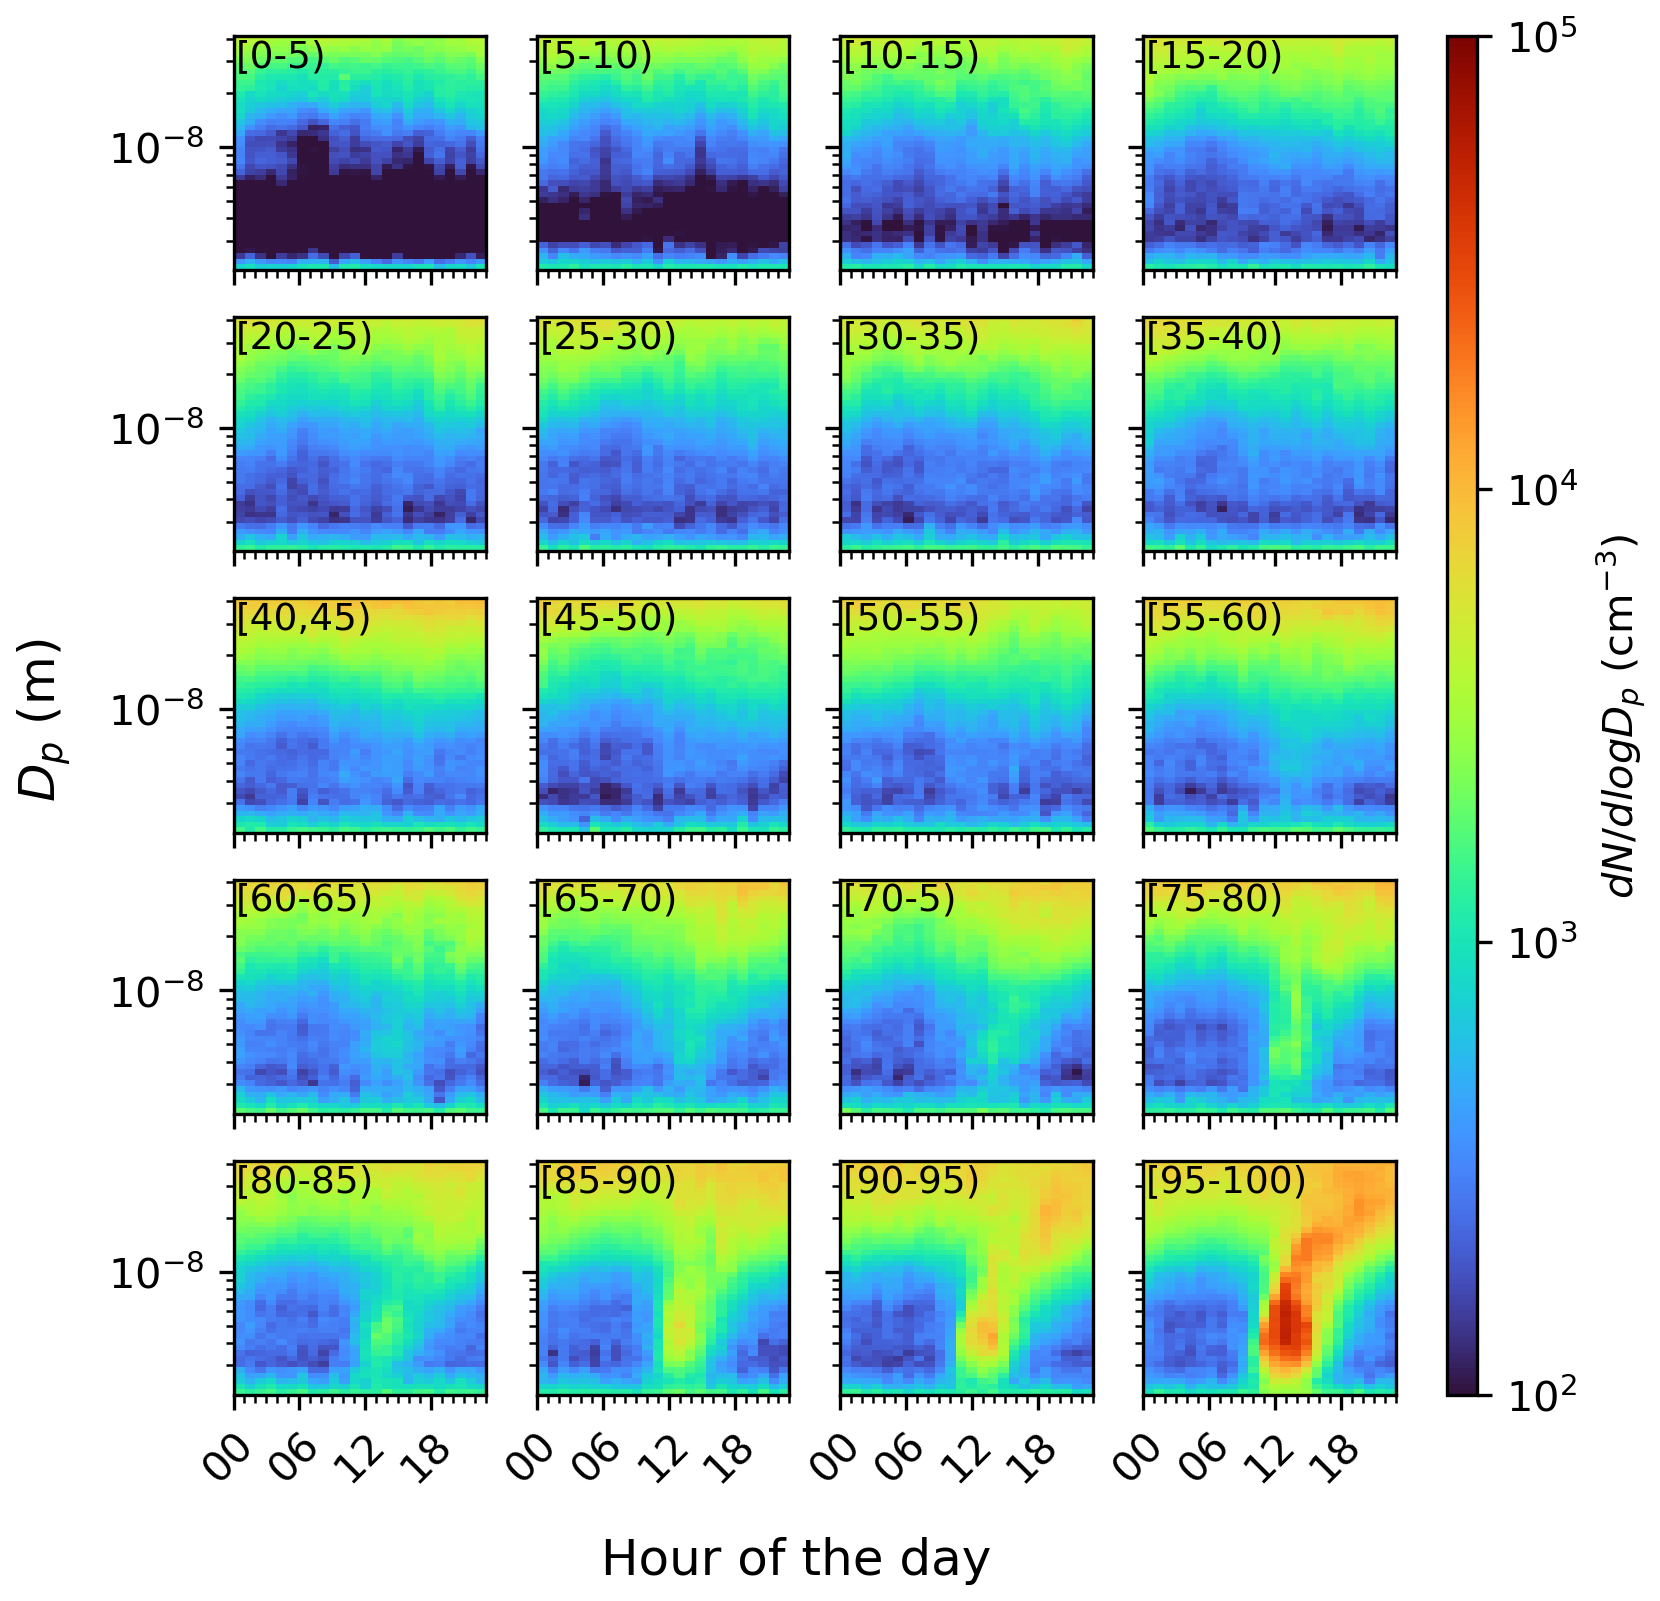
Figure 6Daily median number particle size distribution grouped into 5 % intervals based on the ΔN2.5−5, as an illustration of the potential NPF events in each interval.
Figure 9b shows the dependence between ΔN2.5−5 and O3 concentration. The correlation is statistically significant in spring and summer (Table 3), and ozone has a seasonal pattern with a maximum in spring and a minimum in autumn. A similar seasonal pattern for ozone was observed at the SMEAR II station, the concentrations being the highest in spring (March–April) and lowest in early winter (November) (Chen et al., 2018), as well as at SMEAR Estonia (Noe et al., 2015). Such behavior is connected to the spring recovery of photochemical production (Dibb et al., 2003) and ozone accumulation during winter (Liu et al., 1987). The ambient ozone concentration at the Fonovaya station was reported to be lower than at the SMEAR II and SMEAR Estonia stations (Lampilahti et al., 2023). That study also reported that the difference between ozone concentrations during NPF events and nonevents is statistically significant, with higher ozone concentrations during NPF event days. The relationship between the ozone concentration and NPF occurrence has been studied before, and O3 is expected to enhance NPF because it is an oxidant forming extremely low volatility organic compounds (ELVOCs) (Donahue et al., 2011; Ehn et al., 2014). Other studies also considered ozone to have positive influences on NPF (Woo et al., 2001; Berndt et al., 2006). In contrast, Carnerero et al. (2019) showed that at a site in Spain, higher ozone concentrations were associated with lower NPF occurrences, but this correlation may not be causal due to associations with other atmospheric parameters, such as temperature, RH, or global solar radiation. Another reason for the positive O3 correlation with NPF could be due to the enhanced ozone production during VOC oxidation in the presence of NOx, which is associated with pollution and, hence, higher SO2 and sulfuric acid as well (Bousiotis et al., 2021). At this Siberian site, NPF occurs predominantly within polluted air masses (Lampilahti et al., 2023; Garmash et al., 2024).
NO and NO2 concentrations remain relatively constant during the spring season for all values of ΔN2.5−5 (Fig. 9c, d). The positive relationship between NO and ΔN2.5−5 is statistically significant in autumn (Table 3). With NO2, the relationship is statistically significant in winter (negative correlation) and summer (positive correlation). High NOx concentrations are associated with pollution: for instance, at the SMEAR II station higher NOx was associated with air mass transport from polluted areas (Riuttanen et al., 2013). In addition, NO can also be emitted from the soils (Kesik et al., 2005; Pilegaard, 2013). From Fig. 9c and d we can see that NOx concentrations are the highest during winter, spring, and autumn. This follows the observations at the SMEAR II station, where NOx concentrations are highest during winter months and early spring because of combustion sources and the weakness of the photochemical sink (Riuttanen et al., 2013). NO reacts with ozone and volatile organic compounds (VOCs) emitted by vegetation (Wildt et al., 2014). NOx can affect NPF occurrence in different ways: it can reduce NPF because VOC oxidation in the presence of NOx produces higher-volatility products, and NOx contributes to oxidant recycling (Sillman, 1999), and as a result, this process can suppress NPF. The influence of NOx on NPF was studied in the laboratory chamber by Yan et al. (2020), revealing that NOx suppresses NPF, but the suppression effect is nonuniform and size-dependent. A similar dependence of NPF on NOx was reported by Zhao et al. (2018). Other findings (Wildt et al., 2014) indicate that NOx can either promote or inhibit NPF depending on its concentration levels and the availability of other atmospheric components like VOCs and SO2. Specifically in their experiments, at NOx concentrations above 2 ppb, the particle formation rate decreased by up to 75 % compared to NOx-free conditions. For the Fonovaya station in spring, previous results showed that NOx concentrations are higher than at other boreal forest sites and that the difference in concentrations between the NPF events and non-events is statistically significant with higher NOx concentrations during NPF events (Lampilahti et al., 2023). NPF in Siberia is most likely driven by anthropogenic pollution, so NO2 emissions can influence NPF occurrence.
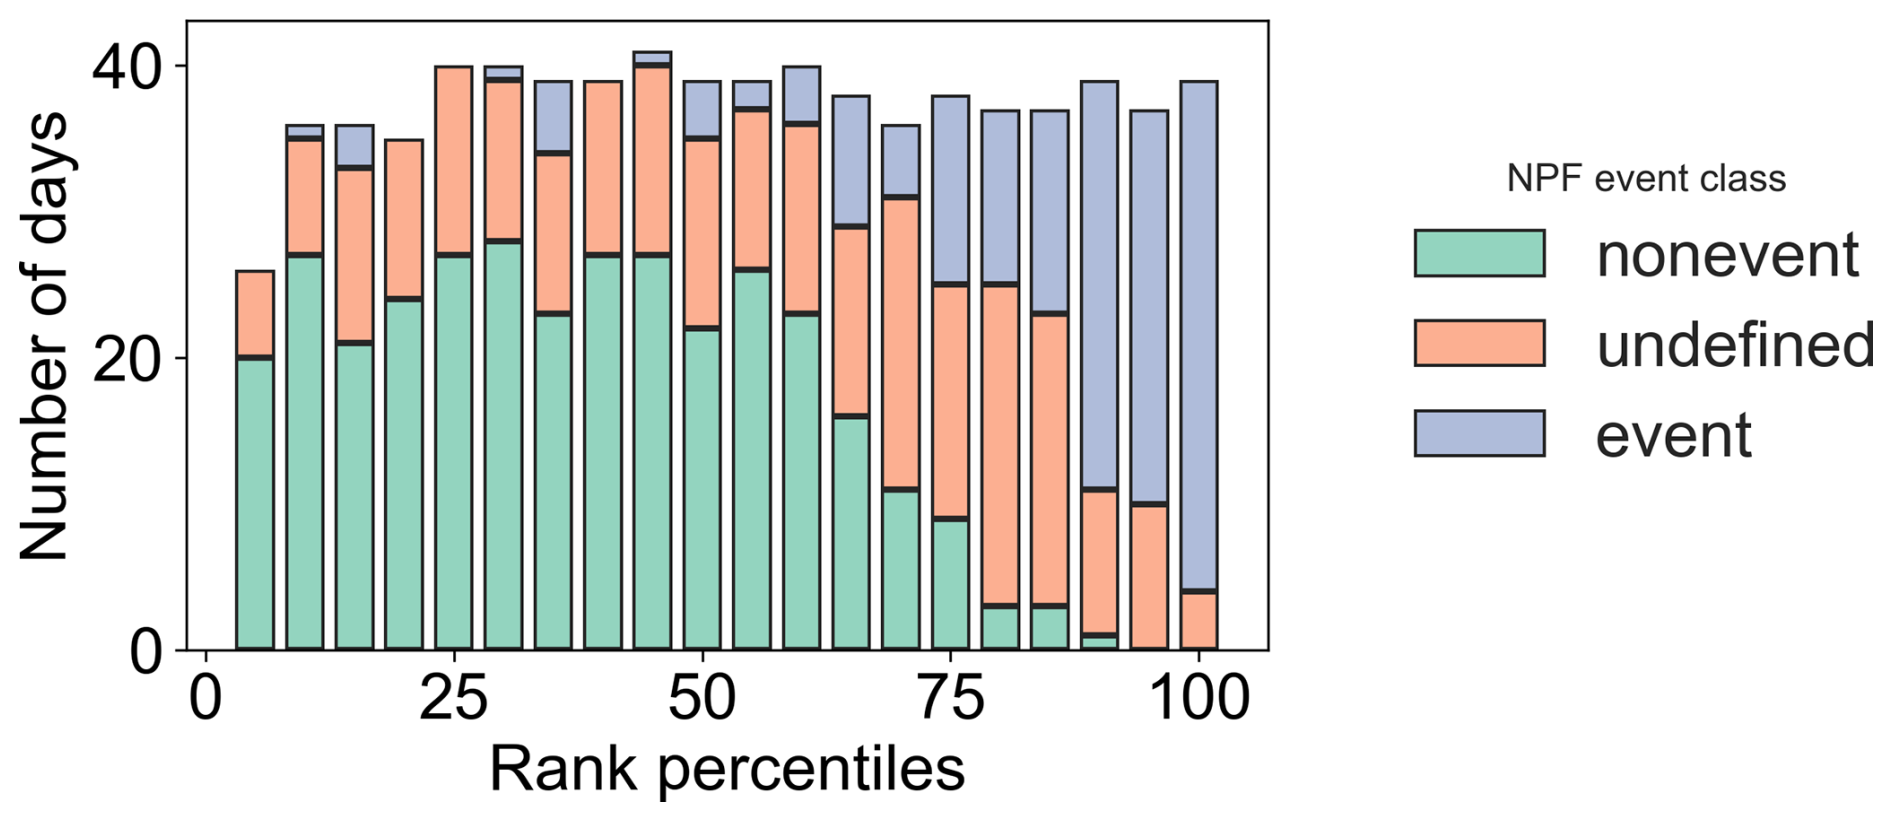
Figure 7Comparison between percentile ranking and traditional classification, with nanoparticle rank percentiles on the x axis and number of all days within a given rank on the y axis. Traditional NPF classes are marked by color.
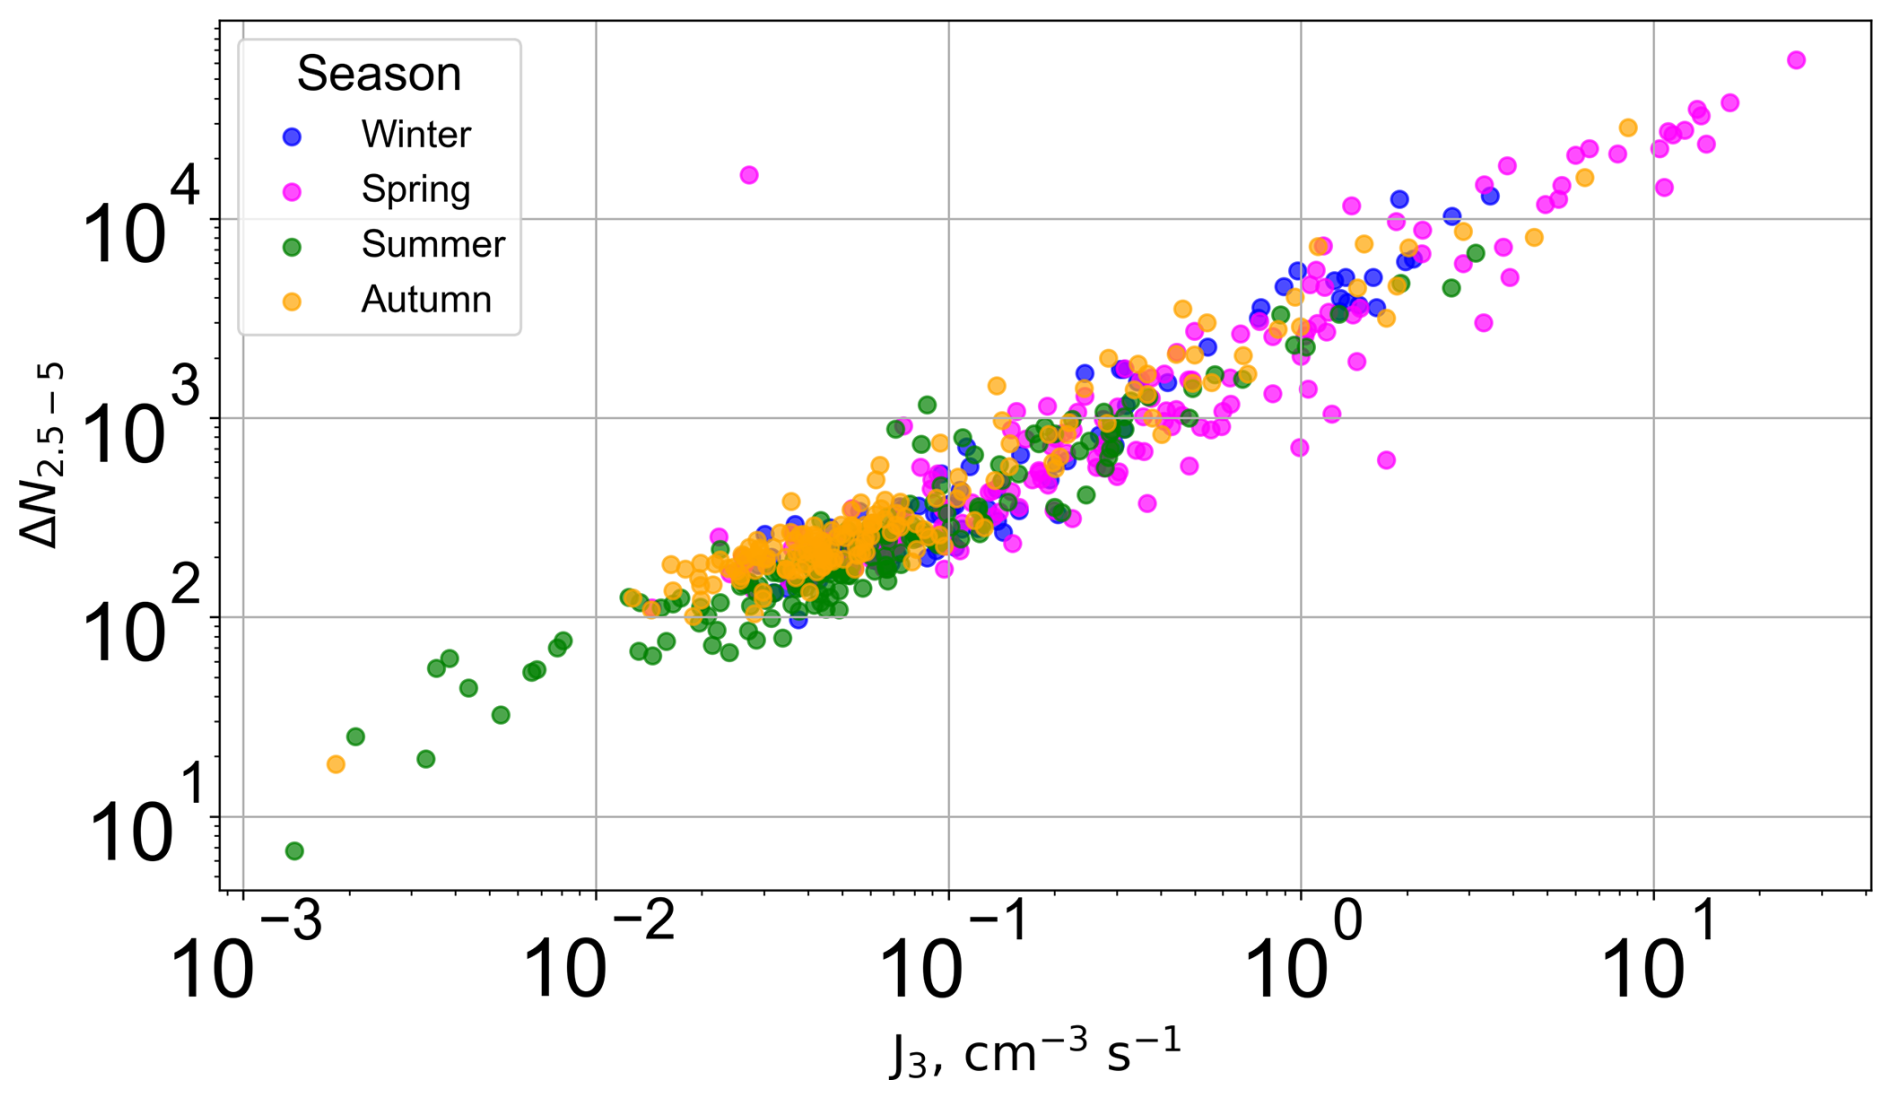
Figure 8The correlation between J3 and ΔN2.5−5 and those parameters have a strong positive dependence. We did a statistical test, and the correlation is statistically significant for all the seasons (Table 3). Similar results for the SMEAR II station were published by Aliaga et al. (2023), where daily maximum J3 also correlated clearly with ΔN2.5−5.
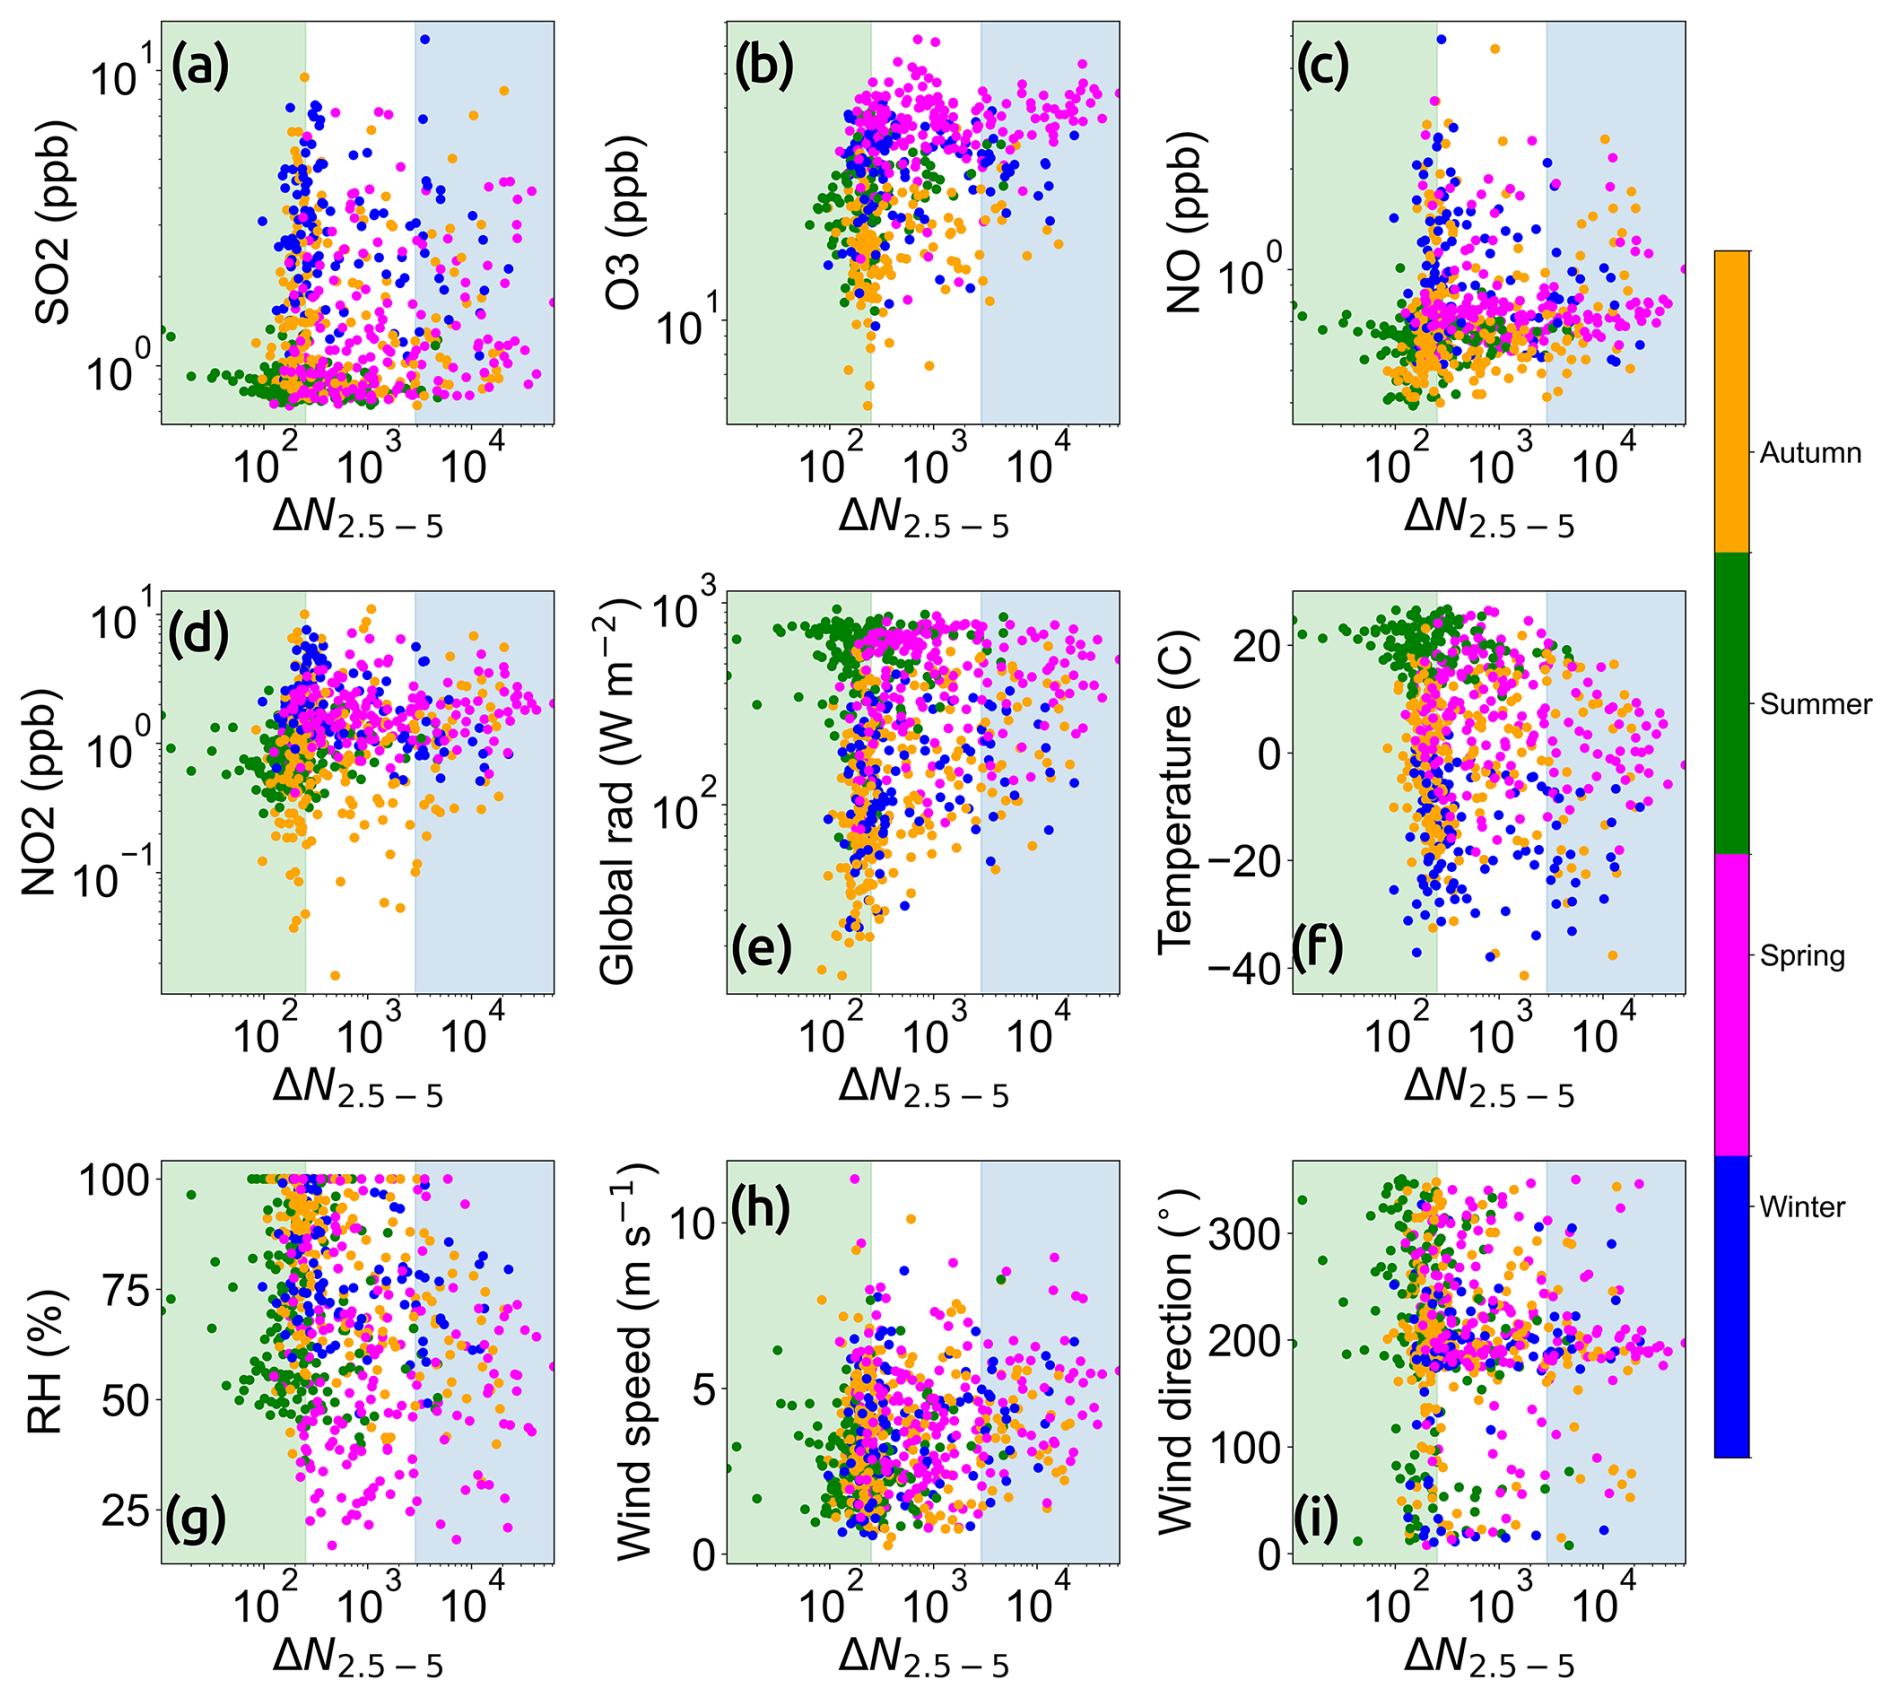
Figure 9Correlations between ΔN2.5−5 on the x axis and atmospheric variables: (a) SO2 concentration, (b) O3 concentration, (c) NO concentration, (d) NO2 concentration, (e) global solar radiation, (f) temperature, (g) relative humidity, (h) wind speed, and (i) wind direction on the y axis. Blue shading highlights the area with the maximum number of event days (above 85th percentile), and green shading shows the area with the maximum number of nonevent days (below 40th percentile). The colors of the symbols represent different seasons.
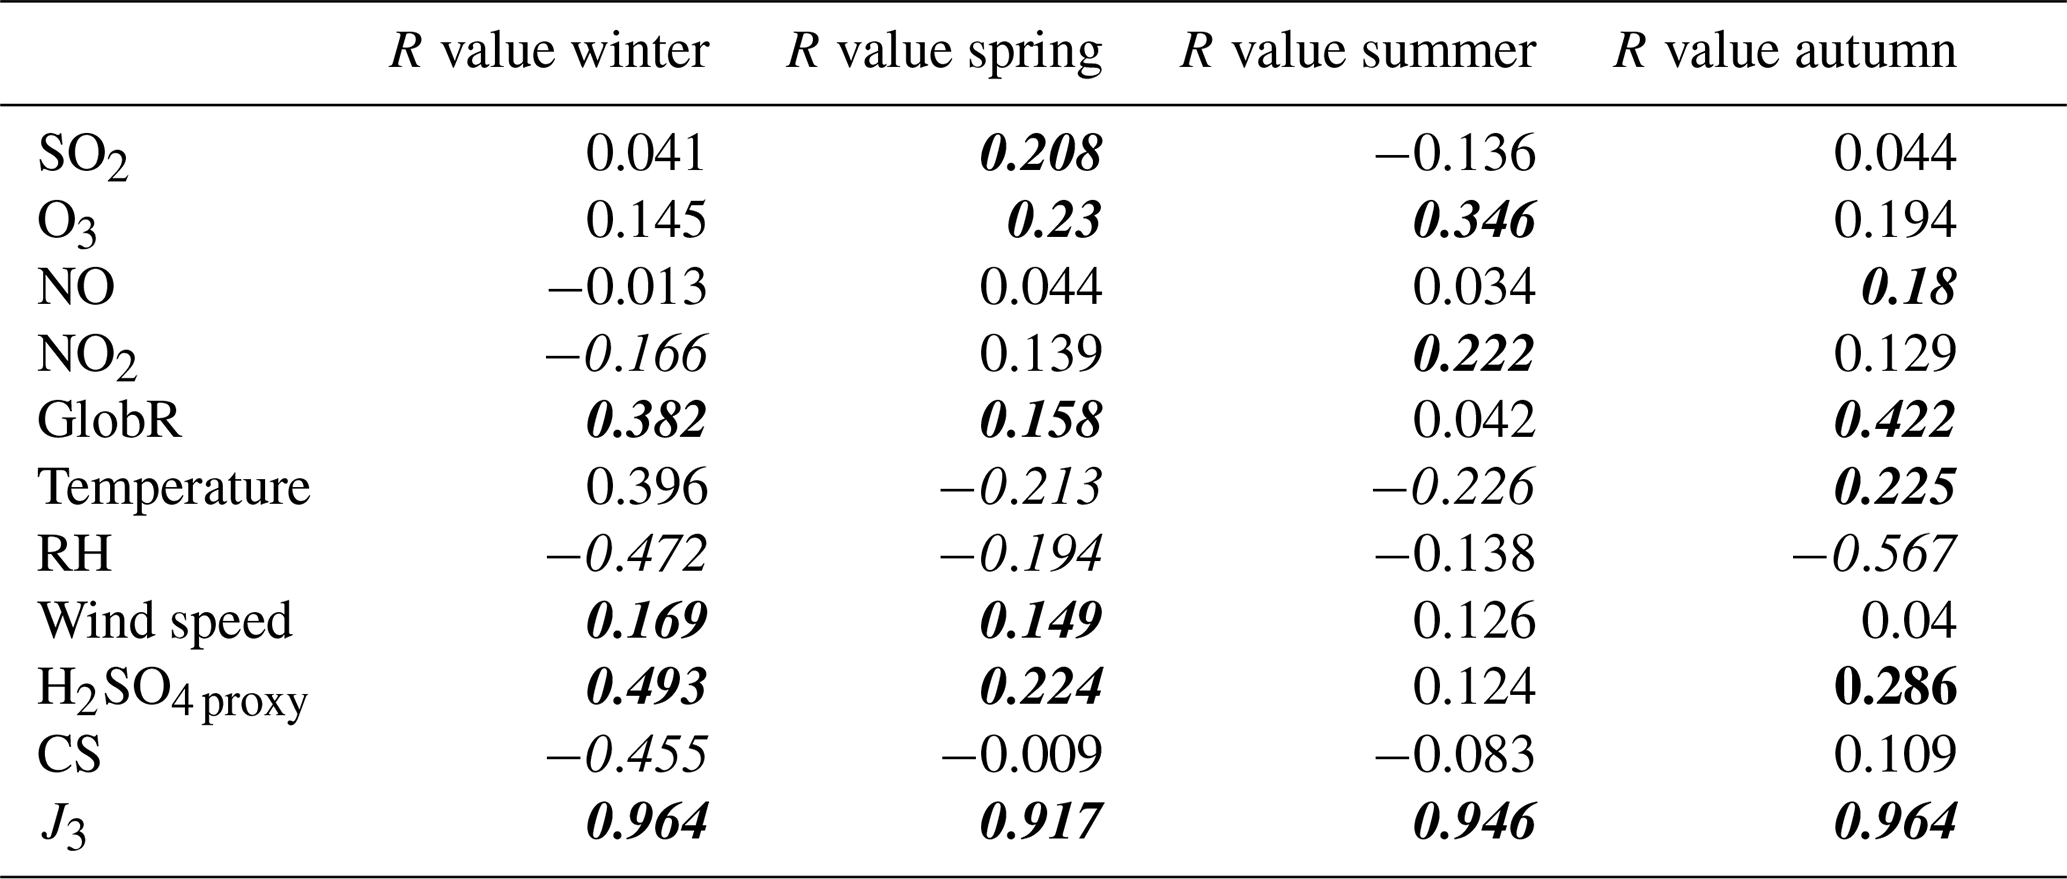
Table 3Pearson's correlation coefficients (R) between ΔN2.5−5 and different atmospheric parameters for each season. We marked by italic font the R coefficients for which the correlations are statistically significant (italic and bold italic numbers standing for negative and positive significant correlations, respectively) (p<0.05). For SO2, O3, NO, NO2, global solar radiation, H2SO4 proxy, CS, and J3, we did a significance test using log10(parameter) and log10(ΔN2.5−5). We did not apply log transformation to temperature, RH, and wind speed.
Global solar radiation (Fig. 9e) is one of the most important factors for the occurrence of NPF (Kerminen et al., 2018), primarily because it initiates the chemical reactions that contribute to aerosol formation in the atmosphere. Aaltonen et al. (2011) highlighted that high levels of solar radiation can enhance the photochemical reactions that lead to the production of oxygenated organic compounds as well as oxidize SO2, increasing H2SO4 concentrations in the atmosphere (Petäjä et al., 2009), which is essential for nucleation and growth of new particles. In our study, the correlation between ΔN2.5−5 and global solar radiation is positive and statistically significant in winter, spring, and autumn (Table 3). Previously we found out that at the Fonovaya station, the largest fraction of NPF events take place during clear-sky or low-cloudiness conditions (Lampilahti et al, 2023). A similar dependence was observed at the SMEAR II station (Dada et al., 2017). Our present analysis aligns well with previous studies, showing that higher values of ΔN2.5−5, associated with increased NPF occurrence, correspond to increased global radiation (Kanawade et al., 2014; Pierce et al, 2014; Qi et al., 2015; Wonaschütz et al., 2015).
The correlation between the temperature and ΔN2.5−5 (Fig. 9f) is negative and statistically significant in spring and summer and negative but not statistically significant in autumn. The effect of temperature on NPF is ambiguous, and different studies are showing different dependencies. Dada et al. (2017) found out that at the SMEAR II station, NPF is more frequent during increased temperatures in the cold season and decreased temperatures during warm seasons. At Fonovaya, warmer seasons are spring and summer (Fig. 9f), and the correlations with ΔN2.5−5 are negative, which agrees with the results for SMEAR II. Also, Dada et al. (2017) found out that both very low (below −21 °C) and very high (above 25 °C) temperatures correspond to nonevent days. Bousiotis et al. (2021) explored the correlation between the temperature and NPF occurrence for various sites worldwide. At most of the sites, the temperature relationship with NPF was positive, but at several sites the correlation was negative. Different studies show different effects of temperature on NPF likely because temperature has both direct and indirect effects, which can either enhance or suppress NPF (Kerminen et al., 2018). Increased temperatures in spring enhance biogenic emissions of aerosol precursor vapors and their oxidation to low-volatility vapors (Grote and Niinemets, 2007). However, as shown by Garmash et al. (2024), early spring with low temperatures is favorable to NPF compared to late spring, which might be due to enhanced stability of molecular clusters at lower temperatures.
The relationship between RH and ΔN2.5−5 (Fig. 9g) is statistically significant in winter, spring, and autumn, and the dependence is negative. Previous studies showed that RH tends to be lower during NPF event days in comparison to non-event days (Birmili and Wiedensohler, 2000; Kanawade et al., 2014; Pierce et al., 2014; Qi et al., 2015; Zhao et al., 2015; Salma et al., 2016). The negative effect on NPF can be explained with with negative influence of RH on solar intensity and photochemical reactions and precursor vapors as a result (Hamed et al., 2011). A similar dependence was observed also at the SMEAR II station (Dada et al., 2017). Overall, our result agrees with previous studies.
Wind speed (Fig. 9h) has a positive and statistically significant correlation with ΔN2.5−5 in winter and spring (Table 3). According to Bousiotis et al. (2021), wind speed can have both positive and negative effects on NPF occurrence. A higher wind speed can promote NPF by increasing mixing and reducing CS, while on the other hand, it can suppress NPF due to increased dilution of condensing vapors. In general, the influence of wind speed on NPF was reported to be different for different sites (Bousiotis et al., 2021).
In addition, we considered the link between ΔN2.5−5, condensation sink (CS), and sulfuric acid proxy (Fig. 10a, b). CS is a very important parameter in atmospheric observations because it describes how fast precursor vapors are lost to aerosol surface, and hence it is known as a factor that suppresses NPF (Kulmala and Kerminen, 2008). At the SMEAR II station, NPF occurs during low values of condensation sink (Dada et al., 2017), and the CS has a seasonal pattern with a maximum in summer with the peak value in July and a minimum in around November (Nieminen et al., 2014). At the Fonovaya station, the seasonal CS pattern is different, with maximum values in winter and spring. In other studies, a low CS sink is associated with increased NPF occurrence (Boy and Kulmala, 2002; Hyvönen et al., 2005; Baranizadeh et al., 2014).
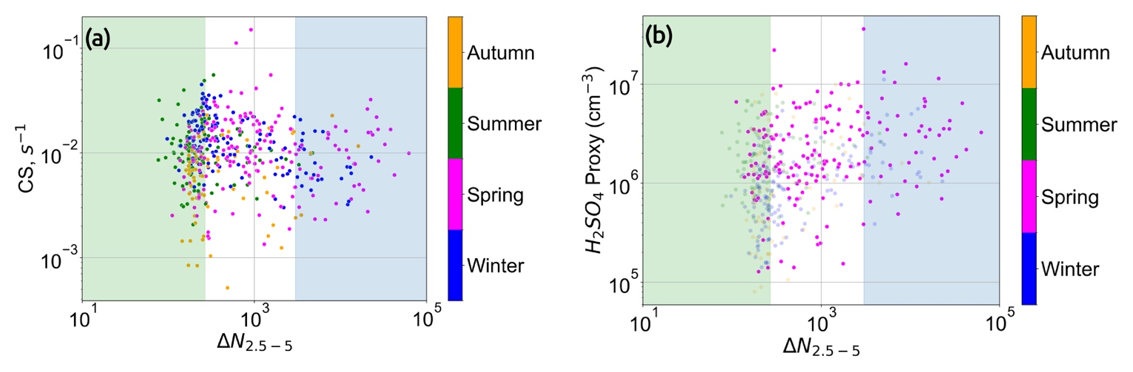
Figure 10(a) Correlations between ΔN2.5−5 on the x axis and CS, calculated using DPS + OPC data and corrected on the cross-correlation coefficient, on the y axis. Colors represent different seasons. (b) Sulfuric acid proxy concentration on the y axis compared to the ΔN2.5−5 on the x axis; colors represent different seasons. The proxy calculation is designed for spring, which is why all other seasons except spring are plotted as transparent.
We compared the calculated sulfuric acid proxy to ΔN2.5−5 (Fig. 10b). The correlation is positive and statistically significant in winter, spring, and autumn. H2SO4 is a precursor vapor for NPF, and a connection between those parameters was reported in various studies (Petäjä et al., 2009; Paasonen et al., 2010; Wang et al., 2011; Yao et al., 2018). At the SMEAR II station, the H2SO4 proxy reaches a maximum in spring (March and April) and a minimum in autumn (Nieminen et al., 2014). A similar seasonal pattern is observed at the Fonovaya station (Fig. 10b). The seasonal variations in the H2SO4 proxy are affected by the seasonal variations in the SO2 concentration, CS, and global solar radiation. Nieminen et al. (2014) reported that H2SO4 concentration alone did not separate NPF events and non-event days, suggesting that oxidized organics also play an important role in determining the occurrence of NPF. Other studies reported higher H2SO4 concentrations during NPF event days (Birmili et al., 2003; Boy et al., 2008). Our result agrees with those studies.
The influence of VOCs on NPF in Siberia is likely substantial although not possible to quantify with the datasets we have obtained during this long-term campaign. The role of VOCs in driving NPF in boreal forests has been widely studied. Ehn et al. (2014) demonstrated that biogenic VOCs, particularly α-pinene emitted by boreal trees, can rapidly oxidize to form ELVOCs. These ELVOCs effectively contribute to particle nucleation and growth. Taipale et al. (2021) modeled the effects of biotic plant stress, such as herbivory and fungal infections, on aerosol particle processes throughout the growing season, showing that VOC emissions, especially monoterpenes and sesquiterpenes, can substantially enhance NPF. Furthermore, organic vapors, in combination with sulfuric acid, are essential for the growth of newly formed particles to sizes large enough to act as cloud condensation nuclei (Paasonen et al., 2013). The presence of these organic compounds allows the particles to grow effectively, preventing them from quickly disappearing through coagulation and enabling them to reach sizes that can influence atmospheric processes. Our previous study (Garmash and Ezhova et al., 2024) shows that strong NPF events in spring 2020 began with the onset of biogenic activity, at the air temperature characteristic for monoterpene emission bursts in the Finnish boreal forest (Aalto et al., 2015). Thus, the observed increase in NPF during unusually warm periods could result from enhanced VOC emissions in the polluted air masses bringing SO2, together providing vapors for particle formation and early growth. To better constrain these processes, future studies should include year-round VOC measurements in Siberian forests, with a focus on both baseline emissions and stress-induced responses under varying climatic conditions.
In this study, we investigated the NPF process and factors affecting it at the Fonovaya station in Siberia. We did a traditional NPF event classification using a 2-year-long dataset of NAIS measurements and compared NPF frequencies for 6 years from 2016 to 2021. The results that we got generally followed previous studies: we observed the maximum number of NPF events in March and the second smaller peak in autumn, however with an abnormally high number of events during spring 2020 and autumn 2019. We also reported aerosol formation and growth rates calculated from the NAIS data. The growth rates are somewhat lower than at the SMEAR II station, but the numbers are comparable. We observed seasonal variability of particle formation rates J with a maximum in spring and autumn and a minimum in winter. Growth rates also have a seasonal variability, with a minimum in winter and a maximum in May. The seasonal variability of GR at the Fonovaya station is larger than at the other boreal forest sites reported in the literature. By far this is the longest formation and growth rate dataset reported for the Siberian region.
We compared the results of traditional event classification with the nanoparticle ranking method, which was used for Siberian data for the first time. NPF events occur mostly at percentile ranking above 85 %. Percentile rankings below 40 % correspond mostly to non-events. We then investigated the relationship between J3 and ΔN2.5−5, and the correlation was strongly positive and statistically significant for every season. This dependence illustrates the clear connection of ΔN2.5−5 with the probability and intensity of NPF.
Using the nanoparticle ranking method, we studied how various atmospheric parameters influence NPF at the Fonovaya station. SO2 plays an important role in NPF, and its influence is statistically significant in spring, when most of the NPF events are observed. SO2 is oxidized with OH and forms sulfuric acid vapor, which plays a key role in aerosol formation and growth. It has seasonal variability with a maximum in winter possibly because of residential heating. However, in winter due to lack of solar radiation, less sulfuric acid is formed, and that is possibly why the SO2 influence on NPF is statistically not significant. The correlation of ozone with ΔN2.5−5 is positive and statistically significant in spring and summer, and it has a seasonal pattern with a maximum in spring and a minimum in autumn. The influence of ozone on NPF can be explained by VOC oxidation, which enhances the occurrence of NPF. NOx plays a role in the NPF process at the Fonovaya station because particle formation in Siberia occurs mostly in polluted air masses. The relationship between NO and ΔN2.5−5 is statistically significant in autumn, and NO2 has a negative significant correlation to ΔN2.5−5 in winter and a positive significant correlation in summer. The influence of NOx on Siberian NPF is inconsistent. Global solar radiation is one of the most important factors in the occurrence of NPF, and its influence is statistically significant in winter, spring, and autumn – seasons when radiation can be low. Solar radiation enhances NPF by starting photochemical reactions that increase the oxidation of VOC and SO2, leading to increased concentrations of H2SO4 and low-volatility organic vapors in the atmosphere. The effect of temperature on NPF is negative and statistically significant in spring and summer, so NPF is more frequent with decreased temperatures during warmer seasons, which agrees with results from SMEAR II. RH has a negative influence on NPF because of its connection to reduced solar intensity. RH connection to the concentration of small particles is the strongest of all other variables and is statistically significant in winter, spring, and autumn. CS suppresses NPF in Siberia, but its influence is statistically significant only in winter when CS reaches maximum values. One of the most important parameters for Siberian NPF is the H2SO4 concentration, and the correlation of NPF with sulfuric acid proxy is significant in winter, spring, and autumn. Sulfuric acid promotes aerosol formation because of its low volatility and high affinity for water, influencing both cluster formation and the early growth of these clusters onto the growing particles. For further perspectives, future studies could focus on exploring additional precursors and atmospheric parameters influencing NPF and conducting a comparative analysis with other boreal forest sites to better understand the regional and global implications of Siberian NPF.
The codes used for this study can be downloaded from https://doi.org/10.5281/zenodo.16894022 (Lampilahti, 2025a).
The dataset used for this study can be downloaded from https://doi.org/10.5281/zenodo.16893859 (Lampilahti, 2025b).
AL, OG, MA, DD, BB, TP, MK, and EE organized the measurement campaign. AL, DA, and JL contributed to data analysis. OG, DA, MA, JL, VMK, TP, MK, and EE contributed to scientific discussion. AL wrote the manuscript with the help of co-authors.
At least one of the (co-)authors is a member of the editorial board of Aerosol Research. The peer-review process was guided by an independent editor, and the authors also have no other competing interests to declare.
Publisher's note: Copernicus Publications remains neutral with regard to jurisdictional claims made in the text, published maps, institutional affiliations, or any other geographical representation in this paper. While Copernicus Publications makes every effort to include appropriate place names, the final responsibility lies with the authors.
This research was supported by ACCC (The Atmosphere and Climate Competence Center) Flagship (grant no. 357902), an academy professorship funded by the Academy of Finland (grant no. 302958), Business Finland project CARBON+, Academy of Finland mobility grants (grant nos. 333581, 334625), the Jane and Aatos Erkko Foundation, the European Research Council (ERC) Project ATM-GTP (contract no. 742206), and a Novo Nordisk Foundation Start Package Grant (grant no. NNF24OC0090482).
This paper was edited by Daniele Contini and reviewed by two anonymous referees.
Aalto, J., Porcar-Castell, A., Atherton, J., Kolari, P., Pohja, T., Hari, P., Nikinmaa, E., Petäjä, T., and Bäck, J.: Onset of photosynthesis in spring speeds up monoterpene synthesis and leads to emission bursts, Plant Cell Environ., 38, 2299–2312, https://doi.org/10.1111/pce.12550, 2015.
Aalto, P., Hämeri, K., Becker, E., Weber, R., Salm, J., Mäkelä, J., Hoell, C., O'Dowd, C., Hansson, H.-C., Väkevä, M., Koponen, I., Buzorius, G., and Kulmala, M.: Physical characterization of aerosol particles during nucleation events, Tellus B, 53, 344–358, 2001.
Aaltonen, H., Pumpanen, J., Pihlatie, M., Hakola, H., Hellén, H., Kulmala, L., Vesala, T., and Bäck, J.: Boreal pine forest floor biogenic volatile organic compound emissions peak in early summer and autumn, Agr. Forest Meteorol., 151, 682–691, 2011.
Aliaga, D., Tuovinen, S., Zhang, T., Lampilahti, J., Li, X., Ahonen, L., Kokkonen, T., Nieminen, T., Hakala, S., Paasonen, P., Bianchi, F., Worsnop, D., Kerminen, V.-M., and Kulmala, M.: Nanoparticle ranking analysis: determining new particle formation (NPF) event occurrence and intensity based on the concentration spectrum of formed (sub-5 nm) particles, Aerosol Research, 1, 81–92, https://doi.org/10.5194/ar-1-81-2023, 2023.
Andreae, M. O., Andreae, T. W., Ditas, F., and Pöhlker, C.: Frequent new particle formation at remote sites in the subboreal forest of North America, Atmos. Chem. Phys., 22, 2487–2505, https://doi.org/10.5194/acp-22-2487-2022, 2022.
Ankilov, A., Baklanov, A., Colhoun, M., Enderle, K.-H., Gras, J, Julanov, Yu., Kaller, D., Lindner, A., Lushnikov, A., Mavliev, R., McGovern, F., Mirme, A., O'Connor, T., Podzimek, J., Preining, O., Reischl, G., Rudolf, R., Sem, G., Szymanski, W., Tamm, E., Vrtala, A., Wagner, P., Winklmayr, W., and Zagaynov, V.: Intercomparison of number concentration measurements by various aerosol particle counters, Atmos. Res., 62, 177–207, 2002.
Antonovich, V. V., Antokhin, P. N., Arshinov, M. Yu., Belan, B. D., Balin, Yu. S., Davydov, D. K., Ivlev, G. A., Kozlov, A. V., Kozlov, V. S., Kokhanenko, G. P., Novoselov, M. M., Panchenko, M. V., Penner, I. E., Pestunov, D. A., Savkin, D. E., Simonenkov, D. V., Tolmachev, G. N., Fofonov, A. V., Chernov, D. G., Smargunov, V. P., Yausheva, E. P., Paris, J.-D., Ancellet, G., Law, K., Pelon, J., Machida, T., and Sasakawa, M.: Station for the comprehensive monitoring of the atmosphere at Fonovaya Observatory, West Siberia: current status and future needs, Proc. SPIE 10833, 24th International Symposium on Atmospheric and Ocean Optics: Atmospheric Physics, 108337Z, https://doi.org/10.1117/12.2504388, 2018.
Arshinov, M. Y., Arshinova, V. G., Belan, B. D., Davydov, D. K., Ivlev, G. A., Kozlov, A. S., Kuibida, L. V., Rasskazchikova, T. M., Simonenkov, D. V., Tolmachev, G. N., and Fofonov, A. V.: Anomalous vertical distribution of organic aerosol over the South of Western Siberia in September 2018, Atmos. Ocean. Opt., 34, 495–502, 2021.
Arshinov, M. Y., Belan, B. D., Garmash, O. V., Davydov, D. K., Demakova, A. A., Ezhova, E. V., Kozlov, A. V., Kulmala, M., Lappalainen, H., and Petäjä, T.: Correlation between the Concentrations of Atmospheric Ions and Radon as Judged from Measurements at the Fonovaya Observatory, Atmos. Ocean. Opt., 35, 36–42, 2022.
Artaxo, P., Hansson, H.-C., Andreae, M. O., Bäck, J., Alves, E. G., Barbosa, H. M. J., Bender, F., Bourtsoukidis, E., Carbone, S., Chi, J., Decesari, S., Després, V. R., Ditas, F., Ezhova, E., Fuzzi, S., Hasselquist, N. J., Heintzenberg, J., Holanda, B. A., Guenther, A., Hakola, H., Heikkinen, L., Kerminen, V.-M., Kontkanen, J., Krejci, R., Kulmala, M., Lavric, J. V., de Leeuw, G., Lehtipalo, K., Machado, L. A. T., McFiggans, G., Franco, M. A. M., Meller, B. B., Morais, F. G., Mohr, C., Morgan, W., Nilsson, M. B., Peichl, M., Petäjä, T., Praß, M., Pöhlker, C., Pöhlker, M. L., Pöschl, U., Von Randow, C., Riipinen, I., Rinne, J., Rizzo, L. V., Rosenfeld, D., Silva Dias, M. A. F., Sogacheva, L., Stier, P., Swietlicki, E., Sörgel, M., Tunved, P., Virkkula, A., Wang, J., Weber, B., Yáñez-Serrano, A. M., Zieger, P., Mikhailov, E., Smith, J. N., and Kesselmeier, J.: Tropical and Boreal Forest – Atmosphere Interactions: A Review, Tellus B Chem. Phys. Meteorol., 74, 24–163, 2022.
Bäck, J., Aalto, J., Henriksson, M., Hakola, H., He, Q., and Boy, M.: Chemodiversity of a Scots pine stand and implications for terpene air concentrations, Biogeosciences, 9, 689–702, https://doi.org/10.5194/bg-9-689-2012, 2012.
Baranizadeh, E., Arola, A., Hamed, A., Nieminen, T., Mikkonen, S., Virtanen, A., Kulmala, M., Lehtinen, K., and Laaksonen, A.: The effect of cloudiness on new-particle formation: investigation of radiation levels, Boreal Environ. Res., 19, 343–354, 2014.
Berndt, T., Böge, O., and Stratmann, F.: Formation of atmospheric H2SO4H2O particles in the absence of organics: A laboratory study, Geophys. Res. Lett., 33, 2–6, https://doi.org/10.1029/2006GL026660, 2006.
Birmili, W. and Wiedensohler, A.: New particle formation in the continental boundary layer: Meteorological and gas phase parameter influence, Geophys. Res. Lett., 27, 3325–3328, 2000.
Birmili, W., Berresheim, H., Plass-Dülmer, C., Elste, T., Gilge, S., Wiedensohler, A., and Uhrner, U.: The Hohenpeissenberg aerosol formation experiment (HAFEX): a long-term study including size-resolved aerosol, H2SO4, OH, and monoterpenes measurements, Atmos. Chem. Phys., 3, 361–376, https://doi.org/10.5194/acp-3-361-2003, 2003.
Bousiotis, D., Brean, J., Pope, F. D., Dall'Osto, M., Querol, X., Alastuey, A., Perez, N., Petäjä, T., Massling, A., Nøjgaard, J. K., Nordstrøm, C., Kouvarakis, G., Vratolis, S., Eleftheriadis, K., Niemi, J. V., Portin, H., Wiedensohler, A., Weinhold, K., Merkel, M., Tuch, T., and Harrison, R. M.: The effect of meteorological conditions and atmospheric composition in the occurrence and development of new particle formation (NPF) events in Europe, Atmos. Chem. Phys., 21, 3345–3370, https://doi.org/10.5194/acp-21-3345-2021, 2021.
Boy, M. and Kulmala, M.: Nucleation events in the continental boundary layer: Influence of physical and meteorological parameters, Atmos. Chem. Phys., 2, 1–16, https://doi.org/10.5194/acp-2-1-2002, 2002.
Boy, M., Kazil, J., Lovejoy, E. R., Guenther, A., and Kulmala, M.: Relevance of ion-induced nucleation of sulfuric acid and water in the lower troposphere over the boreal forest at northern latitudes, Atmos. Res., 90, 151–158, 2008.
Buchelnikov, V. S., Talovskaya, A. V., Yazikov, E. G., Simonenkov, D. V., Belan, B. D., and Tentyukov, M. P.: Analysis of the content of chemical elements in aerosols using data from passive sampling at Fonovaya observatory, Atmos. Ocean. Opt., 33, 490–495, 2020.
Buenrostro Mazon, S., Riipinen, I., Schultz, D. M., Valtanen, M., Dal Maso, M., Sogacheva, L., Junninen, H., Nieminen, T., Kerminen, V.-M., and Kulmala, M.: Classifying previously undefined days from eleven years of aerosol-particle-size distribution data from the SMEAR II station, Hyytiälä, Finland, Atmos. Chem. Phys., 9, 667–676, https://doi.org/10.5194/acp-9-667-2009, 2009.
Cai, R., Yang, D., Fu, Y., Wang, X., Li, X., Ma, Y., Hao, J., Zheng, J., and Jiang, J.: Aerosol surface area concentration: a governing factor in new particle formation in Beijing, Atmos. Chem. Phys., 17, 12327–12340, https://doi.org/10.5194/acp-17-12327-2017, 2017.
Cai, R., Yan, C., Worsnop, D. R., Bianchi, F., Kerminen, V. M., Liu, Y., Wang, L., Zheng, J., Kulmala, M., and Jiang, J.: An indicator for sulfuric acid–amine nucleation in atmospheric environments, Aerosol Sci. Technol., 55, 1059–1069, 2021.
Carnerero, C., Pérez, N., Petäjä, T., Laurila, T. M., Ahonen, L. R., Kontkanen, J., Ahn, K. H., Alastuey, A., and Querol, X.: Relating high ozone, ultrafine particles, and new particle formation episodes using cluster analysis, Atmos. Environ. X, 4, p. 100051, https://doi.org/10.1016/j.aeaoa.2019.100051, 2019.
Chen, X., Quéléver, L. L. J., Fung, P. L., Kesti, J., Rissanen, M. P., Bäck, J., Keronen, P., Junninen, H., Petäjä, T., Kerminen, V.-M., and Kulmala, M.: Observations of ozone depletion events in a Finnish boreal forest, Atmos. Chem. Phys., 18, 49–63, https://doi.org/10.5194/acp-18-49-2018, 2018.
Chi, X., Winderlich, J., Mayer, J.-C., Panov, A. V., Heimann, M., Birmili, W., Heintzenberg, J., Cheng, Y., and Andreae, M. O.: Long-term measurements of aerosol and carbon monoxide at the ZOTTO tall tower to characterize polluted and pristine air in the Siberian taiga, Atmos. Chem. Phys., 13, 12271–12298, https://doi.org/10.5194/acp-13-12271-2013, 2013.
Dada, L., Paasonen, P., Nieminen, T., Buenrostro Mazon, S., Kontkanen, J., Peräkylä, O., Lehtipalo, K., Hussein, T., Petäjä, T., Kerminen, V.-M., Bäck, J., and Kulmala, M.: Long-term analysis of clear-sky new particle formation events and nonevents in Hyytiälä, Atmos. Chem. Phys., 17, 6227–6241, https://doi.org/10.5194/acp-17-6227-2017, 2017.
Dai, L., Wang, H., Zhou, L., An, J., Tang, L., Lu, C., Yan, W., Liu, R., Kong, S., Chen, M., and Lee, S.: Regional and local new particle formation events observed in the Yangtze River Delta region, China, J. Geophys. Res.-Atmos., 122, 2389–2402, 2017.
Dal Maso, M., Kulmala, M., Lehtinen, K. E., Mäkelä, J. M., Aalto, P. and O'Dowd, C. D.: Condensation and coagulation sinks and formation of nucleation mode particles in coastal and boreal forest boundary layers, J. Geophys. Res.-Atmos., 107, PAR-2 pp., https://doi.org/10.1029/2001JD001053, 2002.
Dal Maso, M., Kulmala, M., Riipinen, I., Wagner, R., Hussein, T., Aalto, P. P., and Lehtinen, K. E.: Formation and growth of fresh atmospheric aerosols: eight years of aerosol size distribution data from SMEAR II, Hyytiala, Finland, Boreal Env. Res., 10, 323–336, 2005.
Dal Maso, M., Sogacheva, L., Anisimov, M. P., Arshinov, M., Baklanov, A., Belan, B., Khodzher, T. V., Obolkin, V. A., Staroverova, A., Vlasov, A., and Zagaynov, V. A.: Aerosol particle formation events at two Siberian stations inside the boreal forest, Boreal Environ. Res., 13, 81–92, 2008.
Debevec, C., Sauvage, S., Gros, V., Sellegri, K., Sciare, J., Pikridas, M., Stavroulas, I., Leonardis, T., Gaudion, V., Depelchin, L., Fronval, I., Sarda-Esteve, R., Baisnée, D., Bonsang, B., Savvides, C., Vrekoussis, M., and Locoge, N.: Driving parameters of biogenic volatile organic compounds and consequences on new particle formation observed at an eastern Mediterranean background site, Atmos. Chem. Phys., 18, 14297–14325, https://doi.org/10.5194/acp-18-14297-2018, 2018.
Deng, C., Fu, Y., Dada, L., Yan, C., Cai, R., Yang, D., Zhou, Y., Yin, R., Lu, Y., Li, X., and Qiao, X.: Seasonal characteristics of new particle formation and growth in urban Beijing, Environ. Sci. Technol., 54, 8547–8557, 2020.
Dibb, J. E., Talbot, R. W., Scheuer, E., Seid, G., DeBell, L., Lefer, B., and Ridley, B.: Stratospheric influence on the northern North American free troposphere during TOPSE: 7Be as a stratospheric tracer, J. Geophys. Res.-Atmos., 108, 8363, https://doi.org/10.1029/2001JD001347, 2003.
Donahue, N. M., Epstein, S. A., Pandis, S. N., and Robinson, A. L.: A two-dimensional volatility basis set: 1. organic-aerosol mixing thermodynamics, Atmos. Chem. Phys., 11, 3303–3318, https://doi.org/10.5194/acp-11-3303-2011, 2011.
Dunn, M. J., Jiménez, J. L., Baumgardner, D., Castro, T., McMurry, P. H., and Smith, J. N.: Measurements of Mexico City nanoparticle size distributions: Observations of new particle formation and growth, Geophys. Res. Lett., 31, L10102, https://doi.org/10.1029/2004GL019483, 2004.
Dunne, E. M., Gordon, H., Kürten, A., Almeida, J., Duplissy, J., Williamson, C., Ortega, I. K., Pringle, K. J., Adamov, A., Baltensperger, U., and Barmet, P.: Global atmospheric particle formation from CERN CLOUD measurements, Science, 354, 1119-1124, 2016.
Ehn, M., Thornton, J. A., Kleist, E., Sipilä, M., Junninen, H., Pullinen, I., Springer, M., Rubach, F., Tillmann, R., Lee, B., and Lopez-Hilfiker, F.: A large source of low-volatility secondary organic aerosol, Nature, 506, 476–479, 2014.
Ezhova, E., Ylivinkka, I., Kuusk, J., Komsaare, K., Vana, M., Krasnova, A., Noe, S., Arshinov, M., Belan, B., Park, S.-B., Lavrič, J. V., Heimann, M., Petäjä, T., Vesala, T., Mammarella, I., Kolari, P., Bäck, J., Rannik, Ü., Kerminen, V.-M., and Kulmala, M.: Direct effect of aerosols on solar radiation and gross primary production in boreal and hemiboreal forests, Atmos. Chem. Phys., 18, 17863–17881, https://doi.org/10.5194/acp-18-17863-2018, 2018.
García-Marlès, M., Lara, R., Reche, C., Pérez, N., Tobías, A., Savadkoohi, M., Beddows, D., Salma, I., Vörösmarty, M., Weidinger, T., Hueglin, C., Mihalopoulos, N., Grivas, G., Kalkavouras, P., Ondráček, J., Zíková, N., Niemi, J. V., Manninen, H. E., Green, D. C., Tremper, A. H., Norman, M., Vratolis, S., Eleftheriadis, K., Gómez-Moreno, F. J., Alonso-Blanco, E., Wiedensohler, A., Weinhold, K., Merkel, M., Bastian, S., Hoffmann, B., Altug, H., Petit, J.-E., Favez, O., Martins dos Santos, S., Putaud, J.-P., Dinoi, A., Contini, D., Timonen, H., Lampilahti, J., Petäjä, T., Pandolfi, M., Hopke, P. K., Harrison, R. M., Alastuey, A., and Querol, X.: Inter-annual trends of ultrafine particles in urban Europe, Environ. Int., 194, p. 109149, https://doi.org/10.1016/j.envint.2024.108510, 2024.
Garmash, O., Ezhova, E., Arshinov, M., Belan, B., Lampilahti, A., Davydov, D., Räty, M., Aliaga, D., Baalbaki, R., Chan, T., Bianchi, F., Kerminen, V.-M., Petäjä, T., and Kulmala, M.: Heatwave reveals potential for enhanced aerosol formation in Siberian boreal forest, Environ. Res. Lett, 19, p. 014047, https://doi.org/10.1088/1748-9326/ad10d5, 2024.
Gonzalez Carracedo, L., Lehtipalo, K., Ahonen, L. R., Sarnela, N., Holm, S., Kangasluoma, J., Kulmala, M., Winkler, P. M., and Stolzenburg, D.: On the relation between apparent ion and total particle growth rates in the boreal forest and related chamber experiments, Atmos. Chem. Phys., 22, 13153–13166, https://doi.org/10.5194/acp-22-13153-2022, 2022.
Gordon, H., Kirkby, J., Baltensperger, U., Bianchi, F., Breitenlechner, M., Curtius, J., Dias, A., Dommen, J., Donahue, N. M., Dunne, E. M., and Duplissy, J.: Causes and importance of new particle formation in the present-day and preindustrial atmospheres, J. Geophys. Res.-Atmos., 122, 8739–8760, 2017.
Grote, R. and Niinemets, Ü.: Modeling volatile isoprenoid emissions – a story with split ends, Plant Biol., 9, e42–e59, 2007.
Hamed, A., Korhonen, H., Sihto, S. L., Joutsensaari, J., Järvinen, H., Petäjä, T., Arnold, F., Nieminen, T., Kulmala, M., Smith, J. N., and Lehtinen, K. E.: The role of relative humidity in continental new particle formation, J. Geophys. Res.-Atmos., 116, D18211, https://doi.org/10.1029/2011JD015934, 2011.
Hari, P. and Kulmala, M.: Station for measuring eco-system-atmosphere relations (SMEAR II), Boreal. Env. Res., 10, 315–322, 2005.
Heintzenberg, J., Birmili, W., Otto, R., Andreae, M. O., Mayer, J.-C., Chi, X., and Panov, A.: Aerosol particle number size distributions and particulate light absorption at the ZOTTO tall tower (Siberia), 2006–2009, Atmos. Chem. Phys., 11, 8703–8719, https://doi.org/10.5194/acp-11-8703-2011, 2011.
Hulkkonen, M., Riuttanen, L. I., Dal Maso, M., Junninen, H., and Kulmala, M.: Trajectory-based source area analysis of atmospheric fine particles, SO2, NOx, and O3 for the SMEAR II station in Finland in 1996–2008, Atmos. Chem. Phys. Discuss., 12, 1653–1685, https://doi.org/10.5194/acpd-12-1653-2012, 2012.
Hyvönen, S., Junninen, H., Laakso, L., Dal Maso, M., Grönholm, T., Bonn, B., Keronen, P., Aalto, P., Hiltunen, V., Pohja, T., Launiainen, S., Hari, P., Mannila, H., and Kulmala, M.: A look at aerosol formation using data mining techniques, Atmos. Chem. Phys., 5, 3345–3356, https://doi.org/10.5194/acp-5-3345-2005, 2005.
Kanawade, V. P., Tripathi, S. N., Siingh, D., Gautam, A. S., Srivastava, A. K., Kamra, A. K., Soni, V. K., and Sethi, V.: Observations of new particle formation at two distinct Indian subcontinental urban locations, Atmos. Environ., 94, 264–273, 2014.
Kazil, J., Stier, P., Zhang, K., Quaas, J., Kinne, S., O'Donnell, D., Rast, S., Esch, M., Ferrachat, S., Lohmann, U., and Feichter, J.: Aerosol nucleation and its role for clouds and Earth's radiative forcing in the aerosol-climate model ECHAM5-HAM, Atmos. Chem. Phys., 10, 10733–10752, https://doi.org/10.5194/acp-10-10733-2010, 2010.
Kerminen, V.-M., Paramonov, M., Anttila, T., Riipinen, I., Fountoukis, C., Korhonen, H., Asmi, E., Laakso, L., Lihavainen, H., Swietlicki, E., Svenningsson, B., Asmi, A., Pandis, S. N., Kulmala, M., and Petäjä, T.: Cloud condensation nuclei production associated with atmospheric nucleation: a synthesis based on existing literature and new results, Atmos. Chem. Phys., 12, 12037–12059, https://doi.org/10.5194/acp-12-12037-2012, 2012.
Kerminen, V. M., Chen, X., Vakkari, V., Petäjä, T., Kulmala, M., and Bianchi, F.: Atmospheric new particle formation and growth: review of field observations, Environ. Res. Lett., 13, p. 103003, https://doi.org/10.1088/1748-9326/aadf3c, 2018.
Kesik, M., Ambus, P., Baritz, R., Brüggemann, N., Butterbach-Bahl, K., Damm, M., Duyzer, J., Horváth, L., Kiese, R., Kitzler, B., Leip, A., Li, C., Pihlatie, M., Pilegaard, K., Seufert, S., Simpson, D., Skiba, U., Smiatek, G., Vesala, T., and Zechmeister-Boltenstern, S.: Inventories of N2O and NO emissions from European forest soils, Biogeosciences, 2, 353–375, https://doi.org/10.5194/bg-2-353-2005, 2005.
Kulmala, M. and Kerminen, V. M.: On the formation and growth of atmospheric nanoparticles, Atmos. Res., 90, 132–150, 2008.
Kulmala, M., Petäjä, T., Nieminen, T., Sipilä, M., Manninen, H. E., Lehtipalo, K., Dal Maso, M., Aalto, P. P., Junninen, H., Paasonen, P., and Riipinen, I.: Measurement of the nucleation of atmospheric aerosol particles, Nat. Protocols, 7, 1651–1667, 2012.
Kulmala, M., Kontkanen, J., Junninen, H., Lehtipalo, K., Manninen, H. E., Nieminen, T., Petäjä, T., Sipilä, M., Schobesberger, S., Rantala, P., Franchin, A., Jokinen, T., Järvinen, E., Aijälä, M., Kangasluoma, J., Hakala, J., Aalto, P. P., Mikkilä, J., Vanhanen, J., Aalto, J., Hakola, H., Makkonen, U., Ruuskanen, T., Mauldin III, R. L., Duplissy, J., Vehkämäki, H., Bäck, J., Kortelainen, A., Riipinen, I., Kurten, T., Johnston, M. V., Smith, J. S., Ehn, M., Mentel, T. F., Lehtinen, K. E. J., Laaksonen, A., Kerminen, V. M. and Worsnop, D.: Direct observations of atmospheric aerosol nucleation, Science, 339, 943–946, 2013.
Kulmala, M., Petäjä, T., Ehn, M., Thornton, J., Sipilä, M., Worsnop, D. R., and Kerminen, V.-M.: Chemistry of atmospheric nucleation: on the recent advances on precursor characterization and atmospheric cluster composition in connection with atmospheric new particle formation, Annu. Rev. Phys. Chem., 65, 21–37, 2014.
Kulmala, M., Junninen, H., Dada, L., Salma, I., Weidinger, T., Thén, W., Vörösmarty, M., Komsaare, K., Stolzenburg, D., Cai, R., and Yan, C.: Quiet new particle formation in the atmosphere, Front. Environ. Sci. 10, p. 912385, https://doi.org/10.3389/fenvs.2022.912385, 2022.
Lampilahti, A.: Insights into new particle formation in a Siberian boreal forest from nanoparticle ranking analysis – Codes, Zenodo [code], https://doi.org/10.5281/zenodo.16894022, 2025a.
Lampilahti, A.: Insights into new particle formation in a Siberian boreal forest from nanoparticle ranking analysis – Data, Zenodo [data set], https://doi.org/10.5281/zenodo.16893859, 2025b.
Lampilahti, A., Garmash, O., Arshinov, M., Davydov, D., Belan, B., Noe, S., Komsaare, K., Vana, M., Junninen, H., Bianchi, F., Lampilahti, J., Dada, L., Kerminen, V.-M., Petäjä, T., Kulmala, M., and Ezhova, E.: New particle formation in boreal forests of Siberia, Finland and Estonia, Boreal Env. Res., 28, 147–167, 2023.
IPCC: Climate Change 2021 – the Physical Science basis, Interaction, 49, 44–45, https://doi.org/10.1017/9781009157896, 2021.
Lehtinen, K. E., Dal Maso, M., Kulmala, M., and Kerminen, V. M.: Estimating nucleation rates from apparent particle formation rates and vice versa: Revised formulation of the Kerminen–Kulmala equation, J. Aeros. Sci., 38, 988–994, 2007.
Lehtipalo, K., Leppa, J., Kontkanen, J., Kangasluoma, J., Franchin, A., Wimnner, D., Schobesberger, S., Junninen, H., Petaja, T., Sipila, M., and Mikkila, J.: Methods for determining particle size distribution and growth rates between 1 and 3 nm using the Particle Size Magnifier, Boreal Environ. Res., 19, 13–27, 2014.
Liu, S. C., Trainer, M., Fehsenfeld, F. C., Parrish, D. D., Williams, E. J., Fahey, D. W., Hobler, G., and Murphy, P. C.: Ozone Production in the Rural Troposphere and the Implications for Regional and Global Ozone Distributions, J. Geophys. Res., 92, 4191–4207, https://doi.org/10.1029/JD092iD04p04191, 1987.
Mäkelä, J. M., Riihelä, M., Ukkonen, A., Jokinen, V., and Keskinen, J.: Comparison of mobility equivalent diameter with Kelvin-Thomson diameter using ion mobility data, The J. Chem. Phys., 105, 1562–1571, 1996.
Mäki, M., Aaltonen, H., Heinonsalo, J., Helleìn, H., Pumpanen, J., and Bäck, J.: Boreal forest soil is a significant and diverse source of volatile organic compounds, Plant Soil, 441, 89–110, 2019.
Makkonen, R., Asmi, A., Kerminen, V.-M., Boy, M., Arneth, A., Guenther, A., and Kulmala, M.: BVOC-aerosol-climate interactions in the global aerosol-climate model ECHAM5.5-HAM2, Atmos. Chem. Phys., 12, 10077–10096, https://doi.org/10.5194/acp-12-10077-2012, 2012.
Manninen, H. E., Petäjä, T., Asmi, E., Riipinen, I., Nieminen, T., Mikkilä, J., Hõrrak, U., Mirme, A., Mirme, S., Laakso, L., Kerminen, V.-M., and Kulmala, M.: Long-term field measurements of charged and neutral clusters using Neutral cluster and Air Ion Spectrometer (NAIS), Boreal Env. Res., 14, 591–605, 2009.
Merikanto, J., Spracklen, D. V., Mann, G. W., Pickering, S. J., and Carslaw, K. S.: Impact of nucleation on global CCN, Atmos. Chem. Phys., 9, 8601–8616, https://doi.org/10.5194/acp-9-8601-2009, 2009.
Mikhailov, E. F., Mironov, G. N., Pöhlker, C., Chi, X., Krüger, M. L., Shiraiwa, M., Förster, J.-D., Pöschl, U., Vlasenko, S. S., Ryshkevich, T. I., Weigand, M., Kilcoyne, A. L. D., and Andreae, M. O.: Chemical composition, microstructure, and hygroscopic properties of aerosol particles at the Zotino Tall Tower Observatory (ZOTTO), Siberia, during a summer campaign, Atmos. Chem. Phys., 15, 8847–8869, https://doi.org/10.5194/acp-15-8847-2015, 2015.
Mirme, S. and Mirme, A.: The mathematical principles and design of the NAIS – a spectrometer for the measurement of cluster ion and nanometer aerosol size distributions, Atmos. Meas. Tech., 6, 1061–1071, https://doi.org/10.5194/amt-6-1061-2013, 2013.
Myhre, C. E. L., Samset, B. H., and Storelvmo, T.: Aerosols and their relation to global climate and climate sensitivity, Nat. Educ. Know., 4, p. 7, 2013.
Nieminen, T., Asmi, A., Dal Maso, M., Aalto, P. P., Keronen, P., Petäjä, T., Kulmala, M., and Kerminen, V. M.: Trends in atmospheric new-particle formation: 16 years of observations in a boreal-forest environment, Boreal Env. Res., 19B, 191–214, 2014.
Nieminen, T., Kerminen, V.-M., Petäjä, T., Aalto, P. P., Arshinov, M., Asmi, E., Baltensperger, U., Beddows, D. C. S., Beukes, J. P., Collins, D., Ding, A., Harrison, R. M., Henzing, B., Hooda, R., Hu, M., Hõrrak, U., Kivekäs, N., Komsaare, K., Krejci, R., Kristensson, A., Laakso, L., Laaksonen, A., Leaitch, W. R., Lihavainen, H., Mihalopoulos, N., Németh, Z., Nie, W., O'Dowd, C., Salma, I., Sellegri, K., Svenningsson, B., Swietlicki, E., Tunved, P., Ulevicius, V., Vakkari, V., Vana, M., Wiedensohler, A., Wu, Z., Virtanen, A., and Kulmala, M.: Global analysis of continental boundary layer new particle formation based on long-term measurements, Atmos. Chem. Phys., 18, 14737–14756, https://doi.org/10.5194/acp-18-14737-2018, 2018.
Noe, S. M., Niinemets, U., Krasnova, A., Krasnov, D., Motallebi, A., Kängsepp, V., Jopgiste, K., Hoprrak, U., Komsaare, K., Mirme, S., and Vana, M.: SMEAR Estonia: Perspectives of a large-scale forest ecosystem–atmosphere research infrastructure, Forest. Stud., 63, 56–84, 2015.
Paasonen, P., Nieminen, T., Asmi, E., Manninen, H. E., Petäjä, T., Plass-Dülmer, C., Flentje, H., Birmili, W., Wiedensohler, A., Hõrrak, U., Metzger, A., Hamed, A., Laaksonen, A., Facchini, M. C., Kerminen, V.-M., and Kulmala, M.: On the roles of sulphuric acid and low-volatility organic vapours in the initial steps of atmospheric new particle formation, Atmos. Chem. Phys., 10, 11223–11242, https://doi.org/10.5194/acp-10-11223-2010, 2010.
Paasonen, P., Asmi, A., Petäjä, T., Kajos, M. K., Äijälä, M., Junninen, H., Holst, T., Abbatt, J. P. D., Arneth, A., Birmili, W., Denier van der Gon, H., Hamed, A., Hoffer, A., Laakso, L., Laaksonen, A., Leaitch, W. R., Plass-Duelmer, C., Pryor, S. C., Räisänen, P., Swietlicki, E., Wiedensohler, A., and Kulmala, M.: Warming-induced increase in aerosol number concentration likely to moderate climate change, Nat. Geosci., 6, 438–442, https://doi.org/10.1038/ngeo1800, 2013.
Petäjä, T., Mauldin, III, R. L., Kosciuch, E., McGrath, J., Nieminen, T., Paasonen, P., Boy, M., Adamov, A., Kotiaho, T., and Kulmala, M.: Sulfuric acid and OH concentrations in a boreal forest site, Atmos. Chem. Phys., 9, 7435–7448, https://doi.org/10.5194/acp-9-7435-2009, 2009.
Pierce, J. R., Westervelt, D. M., Atwood, S. A., Barnes, E. A., and Leaitch, W. R.: New-particle formation, growth and climate-relevant particle production in Egbert, Canada: analysis from 1 year of size-distribution observations, Atmos. Chem. Phys., 14, 8647–8663, https://doi.org/10.5194/acp-14-8647-2014, 2014.
Pilegaard, K.: Processes regulating nitric oxide emissions from soils,Philos. T. Roy. Soc. B, 368, p. 20130126, https://doi.org/10.1098/rstb.2013.0126, 2013.
Pirjola, L., Kulmala, M., Wilck, M., Bischoff, A., Stratmann, F., and Otto, E.: Formation of sulphuric acid aerosols and cloud condensation nuclei: an expression for significant nucleation and model comprarison, J. Aerosol Sci., 30, 1079–1094, 1999.
Qi, X. M., Ding, A. J., Nie, W., Petäjä, T., Kerminen, V.-M., Herrmann, E., Xie, Y. N., Zheng, L. F., Manninen, H., Aalto, P., Sun, J. N., Xu, Z. N., Chi, X. G., Huang, X., Boy, M., Virkkula, A., Yang, X.-Q., Fu, C. B., and Kulmala, M.: Aerosol size distribution and new particle formation in the western Yangtze River Delta of China: 2 years of measurements at the SORPES station, Atmos. Chem. Phys., 15, 12445–12464, https://doi.org/10.5194/acp-15-12445-2015, 2015.
Reischl, G. P., Majerowicz, A., Ankilow, A., Eremenko, S., and Mavliev, R.: Comparison of the Novosibirsk automated diffusion battery with the Vienna electro mobility spectrometer, J. Aeros. Sci., 22, 223–228, 1991.
Riuttanen, L., Hulkkonen, M., Dal Maso, M., Junninen, H., and Kulmala, M.: Trajectory analysis of atmospheric transport of fine particles, SO2, NOx and O3 to the SMEAR II station in Finland in 1996–2008, Atmos. Chem. Phys., 13, 2153–2164, https://doi.org/10.5194/acp-13-2153-2013, 2013.
Salma, I., Néemeth, Z., Kerminen, V.-M., Aalto, P., Nieminen, T., Weidinger, T., Molnár, Á., Imre, K., and Kulmala, M.: Regional effect on urban atmospheric nucleation, Atmos. Chem. Phys., 16, 8715–8728, https://doi.org/10.5194/acp-16-8715-2016, 2016.
Sillman, S.: The relation between ozone, NOx and hydrocarbons in urban and polluted rural environments, Atmos. Environ., 33, 1821–1845, 1999
Song, J., Saathoff, H., Jiang, F., Gao, L., Zhang, H., and Leisner, T.: Sources of organic gases and aerosol particles and their roles in nighttime particle growth at a rural forested site in southwest Germany, Atmos. Chem. Phys., 24, 6699–6717, https://doi.org/10.5194/acp-24-6699-2024, 2024.
Taipale, D., Kerminen, V.-M., Ehn, M., Kulmala, M., and Niinemets, Ü.: Modelling the influence of biotic plant stress on atmospheric aerosol particle processes throughout a growing season, Atmos. Chem. Phys., 21, 17389–17431, https://doi.org/10.5194/acp-21-17389-2021, 2021.
Tunved, P., Hansson, H. C., Kerminen, V. M., Ström, J., Dal Maso, M., Lihavainen, H., Viisanen, Y., Aalto, P. P., Komppula, M., and Kulmala, M.: High natural aerosol loading over boreal forests, Science, 312, 261–263, 2006.
Vana, M., Komsaare, K., Horrak, U., Mirme, S., Nieminen, T., Kontkanen, J., Manninen, H. E., Petaäja, T., Noe, S. M., and Kulmala, M.: Characteristics of new-particle formation at three SMEAR stations, Boreal Env. Res., 21, 345–362, 2016.
Wang, Z. B., Hu, M., Yue, D. L., Zheng, J., Zhang, R. Y., Wiedensohler, A., Wu, Z. J., Nieminen, T., and Boy, M.: Evaluation on the role of sulfuric acid in the mechanisms of new particle formation for Beijing case, Atmos. Chem. Phys., 11, 12663–12671, https://doi.org/10.5194/acp-11-12663-2011, 2011.
Wiedensohler, A., Ma, N., Birmili, W., Heintzenberg, J., Ditas, F., Andreae, M. O., and Panov, A.: Infrequent new particle formation over the remote boreal forest of Siberia, Atmos. Environ., 200, 167–169, 2019.
Wildt, J., Mentel, T. F., Kiendler-Scharr, A., Hoffmann, T., Andres, S., Ehn, M., Kleist, E., Müsgen, P., Rohrer, F., Rudich, Y., Springer, M., Tillmann, R., and Wahner, A.: Suppression of new particle formation from monoterpene oxidation by NOx, Atmos. Chem. Phys., 14, 2789–2804, https://doi.org/10.5194/acp-14-2789-2014, 2014.
Wonaschütz, A., Demattio, A., Wagner, R., Burkart, J., Zikova, N., Vodicka, P., Ludwig, W., Steiner, G., Schwarz, J., and Hitzenberger, R.: Seasonality of new particle formation in Vienna, Ausria–Influence of air mass origin and aerosol chemical composition, Atmos. Environ., 118, 118–126, 2015.
Woo, K. S., Chen, D. R., Pui, D. Y. H. H., and McMurry, P. H.: Measurement of Atlanta aerosol size distributions: Observations of ultrafine particle events, Aerosol Sci. Tech., 34, 75–87, https://doi.org/10.1080/02786820120056, 2001.
Wu, Z., Hu, M., Liu, S., Wehner, B., Bauer, S., Massling, A., Wiedensohler, A., Petäjä, T., Dal Maso, M., and Kulmala, M.: New particle formation in Beijing, China: statistical analysis of a 1 year data set, J. Geophys. Res., 112, D09209, https://doi.org/10.1029/2006JD007308, 2007.
Yan, C., Nie, W., Vogel, A.L., Dada, L., Lehtipalo, K., Stolzenburg, D., Wagner, R., Rissanen, M. P., Xiao, M., Ahonen, L., and Fischer, L.: Size-dependent influence of NOx on the growth rates of organic aerosol particles, Sci. Adv., 6, eaay4945, https://doi.org/10.1126/sciadv.aay4945, 2020.
Yao, L., Garmash, O., Bianchi, F., Zheng, J., Yan, C., Kontkanen, J., Junninen, H., Mazon, S. B., Ehn, M., Paasonen, P., and Sipilä, M.: Atmospheric new particle formation from sulfuric acid and amines in a Chinese megacity, Science, 361, 278–281, 2018.
Yli-Juuti, T., Riipinen, I., Aalto, P. P., Nieminen, T., Maenhaut, W., Janssens, I. A., Claeys, M., Salma, I., Ocskay, R., Hoffer, A., Imre, K., and Kulmala, M.: Characteristics of new particle formation events and cluster ions at K-puszta, Hungary, Boreal Environ. Res., 14, 683–698, 2009.
Yli-Juuti, T., Nieminen, T., Hirsikko, A., Aalto, P. P., Asmi, E., Hõrrak, U., Manninen, H. E., Patokoski, J., Dal Maso, M., Petäjä, T., Rinne, J., Kulmala, M., and Riipinen, I.: Growth rates of nucleation mode particles in Hyytiälä during 2003–2009: variation with particle size, season, data analysis method and ambient conditions, Atmos. Chem. Phys., 11, 12865–12886, https://doi.org/10.5194/acp-11-12865-2011, 2011.
Young, L.-H., Lee, S.-H., Kanawade, V. P., Hsiao, T.-C., Lee, Y. L., Hwang, B.-F., Liou, Y.-J., Hsu, H.-T., and Tsai, P.-J.: New particle growth and shrinkage observed in subtropical environments, Atmos. Chem. Phys., 13, 547–564, https://doi.org/10.5194/acp-13-547-2013, 2013.
Zhao, D., Schmitt, S. H., Wang, M., Acir, I.-H., Tillmann, R., Tan, Z., Novelli, A., Fuchs, H., Pullinen, I., Wegener, R., Rohrer, F., Wildt, J., Kiendler-Scharr, A., Wahner, A., and Mentel, T. F.: Effects of NOx and SO2 on the secondary organic aerosol formation from photooxidation of α-pinene and limonene, Atmos. Chem. Phys., 18, 1611–1628, https://doi.org/10.5194/acp-18-1611-2018, 2018.
Zhao, S., Yu, Y., Yin, D., and He, J.: Meteorological dependence of particle number concentrations in an urban area of complex terrain, Atmos. Res., 164–165, 304–305, 2015.