the Creative Commons Attribution 4.0 License.
the Creative Commons Attribution 4.0 License.
 | 18 Nov 2025
Condensation diffusion charging – particle number measurement of high concentrations down to 3 nm
Helmut Krasa
Victoria M. Fruhmann
Sebastian Schurl
Martin Kupper
Alexander Bergmann
Particle number (PN) measurement of particles smaller than 10 nm is challenging and has so far primarily relied on condensation particle counters (CPCs). In this work, we present a concept that combines a condensational growth stage with a diffusion charger to allow for PN measurement with a lower particle cutoff diameter of 2.5 nm, with the ability to measure PN concentrations exceeding 106 cm−3. We use diethylene glycol as a working fluid to magnify ultrafine particles into monodisperse µm-sized droplets, which are then charged by a corona charger and finally detected with a Faraday cup electrometer. The sensor developed in this work, the Condensation Diffusion Charger (CDC), shows a size-independent counting efficiency above 10 nm, similar to CPCs. Finite-element simulations were performed to model the particle activation and subsequent droplet growth. The particle activation was verified experimentally and showed a counting efficiency of 50 % for particles with 3 nm mobility diameter. The CDC was tested on exhaust emissions at a chassis dynamometer for category-L vehicles to demonstrate its viability for vehicle emission measurements. The results closely correlate with a 2.5 nm reference CPC. Our findings indicate that this method offers an approach for a compact and portable PN measurement system for ultrafine particles at very high concentrations without the need for dilution.
- Article
(2705 KB) - Full-text XML
-
Supplement
(1558 KB) - BibTeX
- EndNote


Exposure to elevated levels of airborne pollution is estimated to have caused more than 8 million premature deaths annually worldwide in 2021 (Health Effects Institute, 2024). Increased levels of fine particulate matter with an aerodynamic diameter < 2.5 µm (PM2.5), as well as coarse particulate matter with an aerodynamic diameter < 10 µm, are known to have severe health effects (Brook et al., 2010). While ultrafine particles smaller than 100 nm constitute only a minor fraction of the total particle mass, their increased exposure is known for its contribution to short-term respiratory health effects (Penttinen et al., 2001) and cardiovascular diseases (Franck et al., 2011), and has been linked to numerous other health concerns (Schraufnagel, 2020). Due to their low mass, ultrafine particles are typically quantified using particle number (PN) concentration rather than mass.
The recently revised directive (EU) 2024/2881 sets stricter limit values for pollutants such as PM2.5 and introduces monitoring requirements for ultrafine particles. The most commonly used instruments for PN measurements are condensation particle counters (CPCs), which detect and count single particles by growing them to optically detectable droplets using a supersaturated vapor. This measures the number concentration by quantifying the scattered light pulses of the individual droplets.
While CPCs are widely used in areas such as air quality monitoring, vehicle exhaust emission homologation (Giechaskiel et al., 2014), and clean-room monitoring (Ahonen et al., 2017), electrical methods offer an alternative method for PN analysis via measurement of the charge carried by the particles. Electrometers (EMs) can be positioned downstream of a differential mobility analyzer (DMA) to serve as a reference instrument for CPC calibration (ISO, 2015). By analyzing the particle size distribution data obtained from scans over the particle mobility diameter, the detection and characterization of multiply charged particles becomes feasible to allow precise determination of the charge state within the aerosol population. This methodology allows for a high level of accuracy in assessing PN concentrations for calibration purposes (Vasilatou et al., 2025).
Electric PN measurement methods typically rely on unipolar ion sources to charge aerosols via diffusion, after which the total charge is evaluated. Instruments such as the Electrical Low Pressure Impactor (ELPI) by Dekati (Keskinen et al., 1992), the DMS500 by Cambustion (Reavell et al., 2002), and the Partector by Naneos (Asbach et al., 2024) are widely used for this purpose. These instruments are particularly effective for capturing highly transient events and measuring elevated PN concentrations. In recent years, several countries have mandated PN monitoring during periodic technical inspections of cars and trucks (Burtscher et al., 2019), creating a demand for affordable, robust instruments capable of accurately measuring high PN levels. In response, several diffusion charging-based instruments have been commercialized to meet these regulatory requirements (Melas et al., 2023).
Diffusion chargers (DCs) are generally robust and compact instruments. However, they come with certain limitations. Since the charge acquired by particles generally depends on their size, the resulting measurement is inherently size-dependent. Additionally, the small electrical currents generated during the sensing process, due to the low absolute charge levels carried by the particles, lead to increased measurement uncertainty, particularly at low PN concentrations.
To overcome these limitations, we combine a condensation particle magnifier stage with a DC-based sensor for PN measurement, down to particle sizes of 2.5 nm. Polydisperse particles are activated and grown into droplets with a homogeneous size of about 2 µm before being detected electrically by a DC. This allows us to (1) extend the lower detectable particle size limit comparable to that of CPCs, (2) reduce the inherent size dependency of electrically based PN counters, and (3) lower the limit of detection compared to conventional DCs, while being able to measure PN concentrations exceeding 106 cm−3.
Figure 1 shows a schematic drawing of the instrument presented in this work: the Condensation Diffusion Charger (CDC). The CDC consists of a custom-built condensation stage for particle magnification, a diffusion charger DC for electrical charging and subsequent current measurement of PN concentration. The DC used in this work was previously extensively characterized, both experimentally and theoretically (Schriefl et al., 2019, 2020; Knoll et al., 2021).
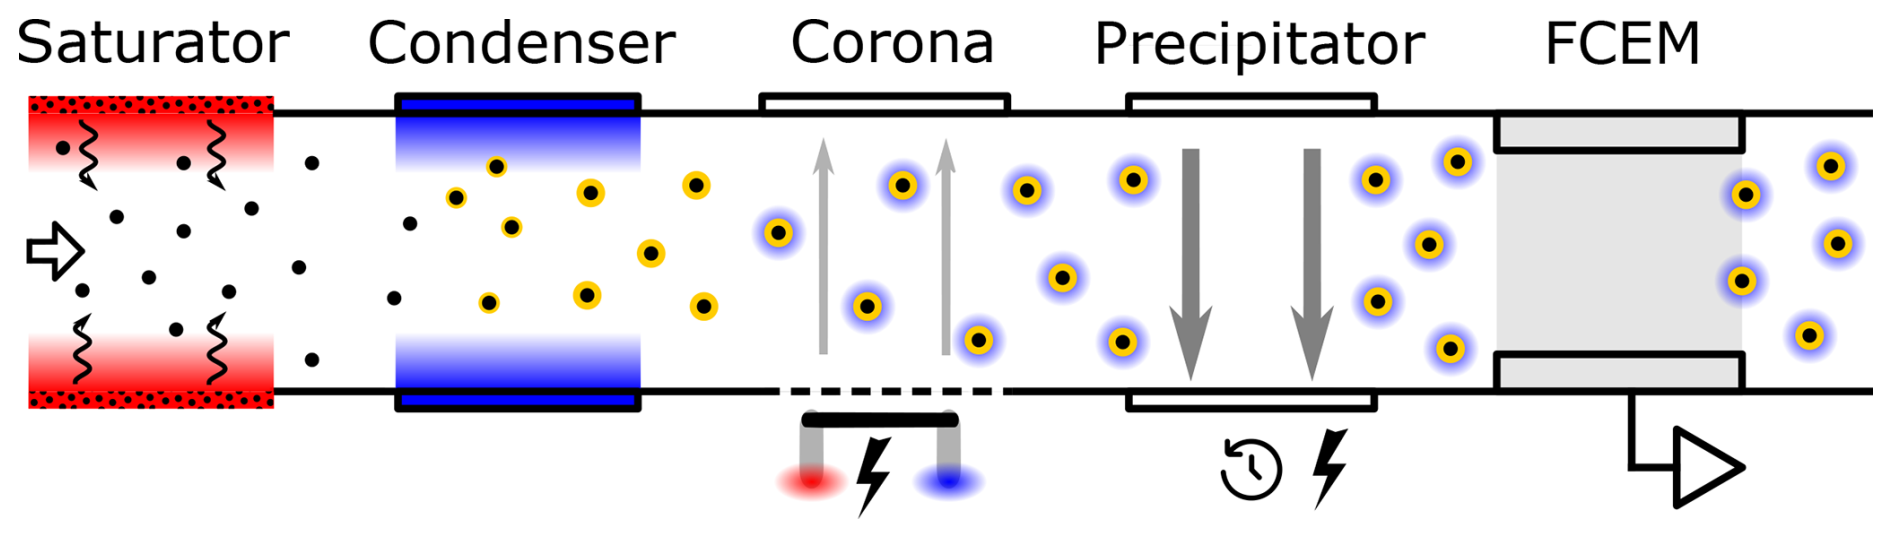
Figure 1Schematic of the CDC. The carrier gas is saturated after entering the device and then cooled in the condenser to induce supersaturation and subsequent particle growth. The enlarged particles then enter the detector section, where they are charged by ions from an external high-voltage corona and drawn into the flow path with a small voltage. The charged particles are then periodically precipitated and finally counted by a Faraday cup electrometer (FCEM).
The condensation stage combines a heated saturation section with a cooled condenser and was dimensioned based on simulation results, as discussed in Sect. 5.1. The saturator is 200 mm in length and was made from two solid 100 × 70 × 70 mm (L × W × H) aluminum blocks. It features drilled channels for the wick and two 50 W heating cartridges.
The wick was custom-made from a 3D-printed honeycomb mesh with a 6.35 mm (0.25 in.) flow channel inside and has an outer diameter of 16 mm. A silicate cord was wrapped around and soaked in a working fluid (WF), which was either 2-(2-hydroxyethoxy) ethanol (also diethylene glycol, DEG) or propan-1,2,3-triol (glycerol). Selection criteria and properties of the WF are discussed in Sect. 4. An active WF management system was not required due to the low WF consumption rate. The condenser section is made out of a 100 × 70 × 40 mm aluminum block and is cooled by a Thorlabs TECH 4 Peltier element. The 100 mm long flow channel has the same inner diameter as the condenser at 6.35 mm. Temperature control was realized with a PT-100 element and a PID controller for both the saturator and condenser.
The 30 mm long thermal insulator between the saturator and condenser and connections for the inlet and outlet were resin 3-D printed. Temperatures of 55 °C or 40 °C for the saturator and 20 °C for the condenser were selected to achieve the desired supersaturation conditions at a flow rate of 0.54 L min−1.
The carrier gas is first saturated with the WF vapor in the saturator and then cooled in the condenser section. As the temperature decreases, the saturation vapor pressure drops, causing the vapor saturation ratio to exceed unity, creating a supersaturated environment. When the supersaturation level is sufficient for a given seed particle diameter dp (as discussed in Sect. 3.1), the particles become activated and grow into droplets, with sizes of up to a few µm. This process transforms the initially polydisperse particle distribution into droplets of uniform size.
The carrier gas containing the droplets grown in the condenser then flows into the DC. The flow channel of the DC is rectangular, with a cross-section of 4 × 16 mm. A corona wire outside of the flow path is operated at a voltage of approximately 2.8 kV. The corona discharge process causes ionization of the surrounding gas, as described in Sect. 3.2. The created ions are then drawn across the flow channel by a counter electrode with negative voltage, where they either attach to particles via diffusion or are captured in the electrode acting as an ion trap. Due to the working principle of the used Faraday cup electrometer (FCEM), which operates based on induced currents (Fierz et al., 2014), a differential signal is required. This is achieved by modulating the precipitation stage (see Fig. 1). The EM unit then measures a current, which is directly proportional to the change of the total aerosol charge state. The flow rate was set to the operation point of the DC at 0.54 L min−1.
This approach offers several advantages over conventional diffusion charging methods. The detection of particles smaller than 10 nm by DC is possible by the magnification of the ultrafine particles. The lower detection limit can therefore be extended to size ranges similar to those of CPCs or particle size magnifiers (2.5 nm in this work). The magnification also disregards the inherent size dependency of diffusion charging, since all particles independent of their initial seed diameter grow into similarly sized droplets. Furthermore, the particle magnification size leads to an increase in charge carried per particle and therefore an amplification in the sensor signal, significantly reducing the limit of detection.
3.1 Particle activation and growth
Ultrafine particles are grown into µm-sized droplets in particle size magnifiers through condensational growth in a supersaturated vapor. In CPCs, these droplets are then detected optically by measuring light pulses produced through light scattering. Supersaturation in laminar-flow CPCs is typically generated by saturating the carrier gas in a heated section that contains a wetted wick, allowing the gas to absorb vapor before it is cooled to induce supersaturation (Stolzenburg and McMurry, 1991).
The minimum particle size that can be activated is given by the Kelvin equation:
where σ is the surface tension, R is the molar gas constant, T is the temperature, S is the supersaturation ratio, and vm is the molar volume. The seed particle with the diameter dp in this model is assumed to be of the same species as the condensing liquid, negating any further chemical influences in addition to the surface tension. Depending on the temperature settings, which determine the supersaturation profile in the condenser, particles larger than dp are grown into droplets, whereas smaller particles are not activated. Higher temperature differences between the saturator and condenser lead to greater supersaturation, resulting in the activation of smaller particles.
A theoretical framework describing heterogenous nucleation and time-dependent droplet growth, including the governing equations and assumptions, is provided in the Supplement.
3.2 PN measurement by diffusion charging
The measurement of the PN concentration via diffusion charging consists of two steps. First, the particles are electrically charged. Unipolar chargers are typically used because they achieve higher charge levels per particle compared to bipolar chargers. A common method for generating unipolar ions involves a controlled corona discharge, and chargers that use this technique are known as corona chargers. The ions generated in the discharge region recombine with the aerosol via diffusion, charging the particles. Direct charging of the aerosol leads to particle losses due to depositions on the corona, which in turn can lead to unstable ion generation (Qi et al., 2007). To avoid direct interaction between the high-voltage corona wire and the particles, ions are often generated outside the flow path and pulled into the aerosol flow, where they recombine via diffusion by an applied electric field (Park et al., 2007).
Following charging, the electrical charge carried by the aerosol is measured using an EM. Particles can be collected on a filter, and the resulting deposited current measured. Alternatively, a filter-less method that measures induced currents upon a change in charge state in the Faraday cup can be used. A more detailed description of the induced current detection method used in this work can be found in the Supplement.
The charge acquired by a particle via diffusion charging is not constant but depends significantly on particle size:
Qtot is the total charge carried by the particles, N is the number concentration of the aerosol to be measured, and is the average charge per particle. The size dependency of the average charge is roughly proportional to the particle diameter () and is dependent on the exact charger design (Jung and Kittelson, 2005; Fierz et al., 2011) and particle morphology (Biskos et al., 2005).
4.1 Influence of the WF material properties
The most widely used WF for CPCs is butanol. It enables particle growth into droplets with diameters of up to 10 µm, which can subsequently be detected via light scattering (Iida et al., 2009). However, butanol has limitations when it comes to the reliable detection of particles smaller than 3 nm. This is because the supersaturation levels required to activate sub-3 nm particles approach the threshold for homogeneous nucleation, where droplet formation can occur spontaneously without the presence of pre-existing seed particles.
Hao et al. (2021) analyzed 46 different WFs and optimized the saturator temperature to achieve the lowest possible d50 value without triggering homogeneous nucleation. Analysis showed that the material parameters directly influence the ability to condense on sub-3 nm particles without causing homogeneous nucleation. While a high surface tension increases the free energy barrier for particle conversion, a lower vapor pressure reduces the vapor collision rate. Both effects increase the required saturation ratio for homogeneous nucleation to become significant (Iida et al., 2009). Therefore, DEG has the ability to condense on sub-3 nm particles without causing homogeneous nucleation (Kuang et al., 2011).
Due to its lower vapor pressure, however, DEG droplets grow to smaller sizes compared to butanol. Mixing-type devices, like the Airmodus Particle Size Magnifier, grow droplets to approximately 100 nm and thus require a separate CPC for counting (Vanhanen et al., 2011). The laminar-flow approach used in this work results in larger droplet diameters. Simulations of laminar-flow DEG systems have yielded final droplet sizes of approximately 1 µm (Iida et al., 2009) to 1.5 µm (Hao et al., 2021), with the exact size being dependent on the specific operating parameters and instrument dimensions.
While a certain droplet diameter must be reached for CPCs to detect the scattered light, the scattering intensity does not directly influence the measured particle concentration as long as the scattering event is registered. As discussed in Sect. 3.2, diffusion charging is size sensitive, and the particle size directly influences the charge uptake. The droplet growth rate is mainly influenced by the vapor pressure above the droplet surface in the condenser (details can be found in the Supplement, Eqs. S1 to S5). Therefore, both the choice of WF, as well as the temperature settings of the condenser and saturator, influence the final droplet size.
WFs that generate larger droplets have the advantage of increasing the signal amplitude and therefore lowering the limit of detection at the cost of a higher WF consumption rate. Additionally, larger droplet sizes help to minimize the influence of particle pre-charge and initial particle size on final droplet formation. If WFs and temperature settings are chosen so that vapor pressures can be kept low, droplets might only grow into sizes as small as 100 nm. At these small sizes, the final droplet size becomes dependent on the seed particle diameter, which prevents direct measurement of PN concentration independent of the initial particle size. Conversely, with increasing size, droplets are more susceptible to losses within the DC due to inertial impaction or gravitational settling, leading to performance degradation.
4.2 Concentration-dependent effects
While inertial and gravitational losses can be mitigated by using straight flow channels and a vertical setup, concentration-dependent supersaturation reductions influence the final droplet size. Condensational heating increases the temperature in the condenser, lowering the supersaturation. Additionally, the uptake of WF vapor by the condensing particles reduces the vapor concentration in the condenser, leading to vapor depletion. Both effects lead to a reduction in the final droplet size and therefore a change in the counting behavior.
Condensational heating is caused by the release of latent heat as vapor condenses onto the particles. This effect is proportional to the amount of condensed vapor and thus to the total droplet mass, scaling with , where Hvap is the latent heat of vaporization.
Vapor depletion results from a reduction in vapor concentration as vapor is absorbed by growing droplets. The reduction in vapor concentration is dependent on the droplet mass but, in this case, is relative to the vapor pressure p of the WF of the working fluid, giving a dependence of . No consistent trend can generally be stated for vapor depletion effects, as fluids with higher vapor pressures tend to grow larger particles. However, for WFs with lower vapor pressures, droplet growth is reduced, which in turn reduces condensational heating effects.
Lewis and Hering (2013) and Stratmann et al. (2010) analyzed concentration-dependent effects in water-based CPCs. Both studies revealed a reduction in droplet size, mainly caused by condensational heating effects, which are strong due to the larger droplet size within the system, whereas vapor depletion does not play a significant role. Lewis and Hering (2013) changed the condenser width and reported a decrease in concentration-dependent effects for narrower geometries caused by smaller particle diameters due to shortened residence times within the condenser. In the case of high concentrations of 106 cm−3 and a bimodal distribution, concentration-dependent effects can become so strong that particle sizes previously above d50 are no longer counted in the CPC (Stratmann et al., 2010).
As the DC signal is sensitive to particle size, smaller droplets, which form at elevated PN concentrations, lead to a reduction of the measured signal amplitude. This results in a non-linear response, where the signal no longer increases proportionally to the PN concentration. This non-linear behavior is characterized in Sect. 6.5.
4.3 Working fluids for diffusion charging
Considering all of the above influences, the requirements regarding the WF for a condensation-based electrical counter are different from those of a CPC. In a CPC, a minimum droplet size for reliable detection via light scattering is required. Therefore, liquids with a high vapor pressure, such as water or butanol, are often the preferred choice. Without the drawback of requiring an additional booster stage, WFs with smaller saturation vapor pressures are suitable in this setup. However, due to the direct influence of the droplet diameter on the measurement signal, the situation is more nuanced for the CDC developed in this work. The signal amplitude and therefore the limit of detection directly depend on the droplet diameter. On the other hand, concentration effects can be expected to be more pronounced, with larger droplets, and have a direct influence on the measured PN concentration.
WFs with a lower saturation vapor pressure lead to smaller droplet sizes and allow for the activation of smaller particles without causing homogeneous nucleation. Additionally, a lower evaporation rate leads to a reduced consumption of the WF and therefore an extended refilling interval. The reduced droplet size resulting from the lower vapor saturation pressure also reduces inertial and gravitational losses due to impaction, as droplets in water-based CPCs grow up to 8 µm (Lewis and Hering, 2013).
Two WFs, DEG and glycerol, were evaluated for their suitability of condensational particle magnification out of a wide range of potential candidates. DEG is commonly used in booster stages for particle size magnifiers, proven in commercial instruments, and was therefore evaluated as one of two WFs in this work. The thermodynamic properties of DEG, including vapor pressure, surface tension, and diffusion coefficient, were used as inputs for the fluid dynamics simulation. As these parameters directly influence particle activation and droplet growth rates, the choice of WF therefore defined the viable range of temperature settings and boundaries for the optimization of the condensation stage geometry.
Glycerol was also considered due to its significantly lower vapor pressure, approximately 30 times less than DEG, which was the lowest among the WFs evaluated by Hao et al. (2021). This results in smaller droplet diameters at temperature settings for comparable d50 diameters. However, the obtained signal amplitude with glycerol as WF was found to be reduced over time and therefore not a suitable WF. This may be caused by the high water affinity of glycerol, which then takes up water within the wick, reducing the vapor concentration and therefore droplet growth in the condenser.
5.1 CFD simulation
The condensation growth stage of the CDC was modeled in COMSOL Multiphysics 6.0. The model consists of a heated saturator followed by the thermal insulation and a cooled condenser stage. The subsequent droplet growth was calculated in MATLAB.
The COMSOL model consists of a 2-D axially symmetric model and couples the laminar flow, heat transfer in fluids, and stabilized convection–diffusion modules. The required temperature-dependent material parameters were taken from Yaw (2003) and are spatially resolved within the geometry. The 2-D fields of the gas flow, temperature, and WF vapor pressure of the condenser stage are then passed to MATLAB. To account for concentration-based effects as described in Sect. 4.2, a simple approach using a concentration-dependent vapor sink for vapor depletion and a corresponding heat source for condensational heating was modeled. However, this approach was excluded from further analysis as its predictions were inconsistent with experimental observations.
As the diffusion coefficient of the WFs in use is lower than the thermal diffusivity of the carrier gas, the supersaturation decreases from the centerline toward the wall (Li et al., 2024). One can therefore integrate from the centerline to the outermost radius rmax, where the particles are still activated, while taking into account the parabolic flow velocity v(r). This yields the size-dependent counting efficiency (CE):
Equation (3) assumes a uniform distribution of the PN concentration along the radial axis and therefore neglects axial diffusion effects. Generally, two distinct particle sizes are of interest: the largest diameter, at which no particle activation occurs (d0); and the particle diameter, at which 50 % of the particles are counted (d50).
Once a sufficient supersaturation ratio along the flow direction is reached for a given radial position and particle size dp according to Eq. (1), the droplet growth simulation is initialized in MATLAB and solved via the built-in ode15s solver. The growth rate along the flow path is calculated via Eq. S1. Particle growth was simulated until the beginning of the corona discharge region. To allow for simulation within the 2-D axially symmetric model used for the droplet growth, the diffusion charger was approximated as having a cylindrical cross-section, although the actual device features a rectangular profile. The length after the exit of the condenser was adjusted to ensure that the residence time in the model matched that of the physical instrument.
The geometry of the condensation stage was the result of the following considerations and a simulation-based parameter optimization. The width and length of the condenser and saturator directly influence the residence time and therefore determine the diffusional losses in the system. For a given flow rate and flow path width, the saturator length is optimized once the centerline of the flow path is fully saturated. The condenser length can be considered as optimized once the droplet no longer grows significantly (Balendra et al., 2024). Both the diffusion rate of the vapor toward the center of the saturator and the droplet growth rate in the condenser are dependent on the material parameters of the WF. Therefore, the optimum saturator and condenser length are also dependent on the chosen WF.
5.2 Particle activation
The saturation of the WF vapor inside the condenser was modeled for three different temperature settings. As expected, the maximum supersaturation occurs along the centerline of the condenser and decreases toward the walls. The supersaturation field and corresponding Kelvin equilibrium diameter are shown in the Supplement (Fig. S2). According to Eq. (1), smaller particle sizes require higher supersaturation, which is only achieved near the centerline of the condenser. As a result, only a portion of the particles are activated, and a reduced CE, as described by Eq. (3), is observed. The dependence of CE on particle diameter is shown in Fig. 2.
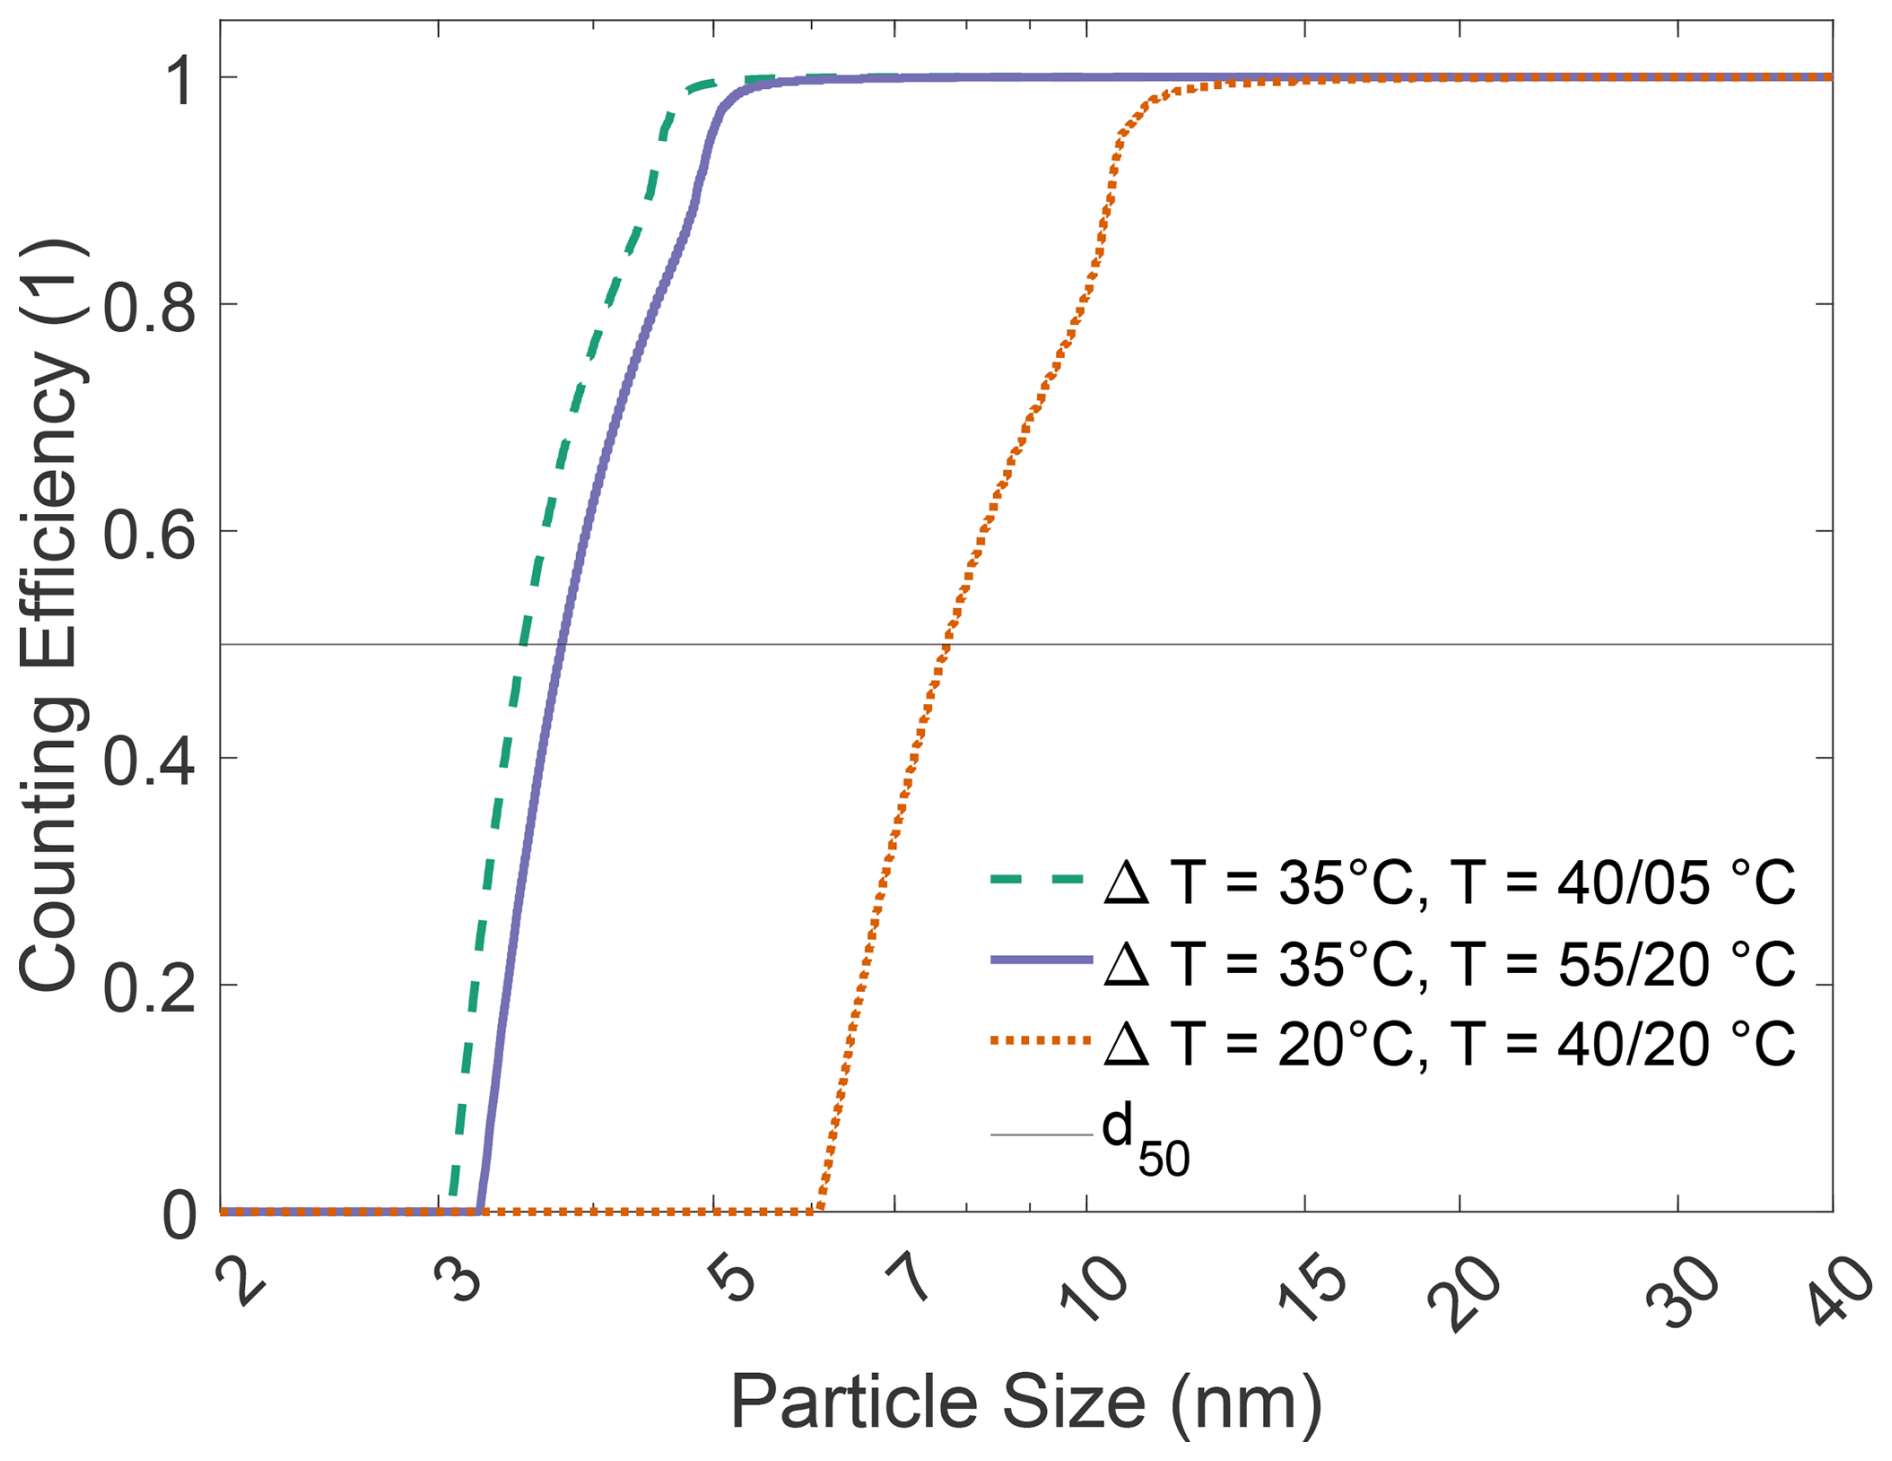
Figure 2Simulated activation efficiency of the growth stage at three different temperature settings according to the Kelvin equation.
A larger temperature difference (ΔT) between the saturator and condenser leads to higher supersaturation, enabling the activation of smaller particles. For example, at a fixed condenser temperature of Tc=20 °C, reducing the saturator temperature Ts from 55 to 40 °C decreases ΔT from 35 to 20 °C. This reduction in ΔT shifts the d50 diameter from 3.5 to 7.8 nm, as calculated by the Kelvin equation. Conversely, when ΔT is held constant but both saturator and condenser temperatures are reduced, in this instance from 55/20 °C (saturator/condenser temperature) to 40/5 °C, the resulting change in d50 is minimal, with a decrease of only 0.3 nm. This trend can also be observed at further temperature settings with a constant ΔT, which is shown in the Supplement.
The small magnitude of the change in d50 can be explained by considering two competing mechanisms. According to Eq. (1), the Kelvin diameter decreases with increasing temperature at constant supersaturation. However, at lower temperatures the diffusion coefficient of the WF is reduced, increasing the difference between the vapor diffusion rate and the thermal diffusivity of the carrier gas, which in turn raises the overall supersaturation, as shown in Fig. S1. Additionally, temperature-dependent properties such as surface tension, diffusivity, and fluid density also influence the Kelvin equilibrium diameter. Together, these factors result in only a slight decrease in the d50 diameter when operating at lower absolute temperatures but maintaining the same ΔT.
Increasing the ΔT further would allow the activation of particles down to 2 nm and below. However, due to the absence of a sheathed-flow design, diffusional losses in this size range become significant. Furthermore, the increased required supersaturation approaches that of homogenous nucleation, where clusters start to nucleate, leading to false counts in the detector.
5.3 Droplet growth
The droplet growth over time for the same temperature settings and three initial particle diameters is presented in Fig. 3a. A change in the absolute temperature at a constant ΔT has a large effect on the final droplet size, while the d50 diameter is largely unaffected. Lowering both Ts and Tc by 15 °C reduces the final droplet size by more than 50 %. Due to the overall lower temperatures, the supersaturation is increased, but the vapor concentration decreases, as shown in Fig. S1.
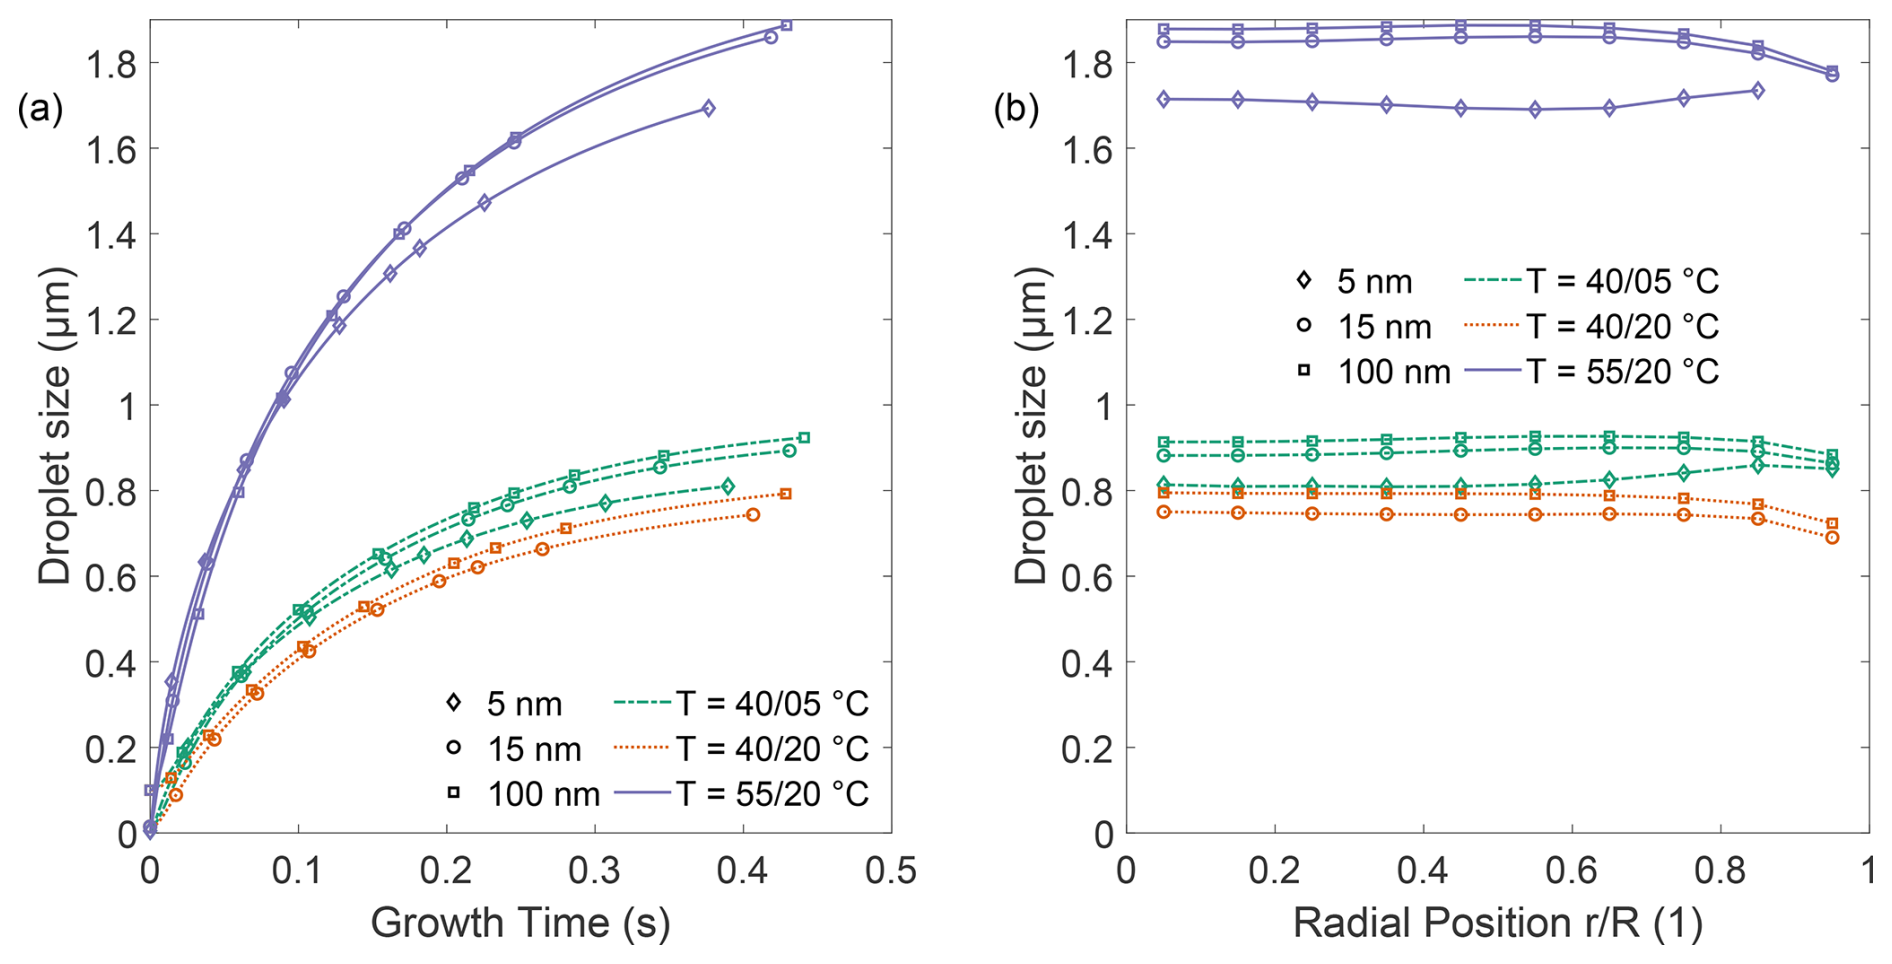
Figure 3(a) Simulated droplet growth along the radial position over time until the droplet reaches the charger. (b) Final droplet size dependency on the radial position and particle diameter. The color indicates the temperature setting used, and the marker and line type indicate the particle seed diameter.
Reducing Tc while keeping Ts constant has a weak effect on droplet size but a significant impact on the d50 diameter. Lowering Tc by 15 °C while maintaining Ts constant decreases the droplet diameter by only 10 %, while the d50 decreases from 7.8 to 3.5 nm. The d50 value is therefore mainly determined by the temperature difference ΔT between the saturator and condenser, whereas the overall droplet size is mainly influenced by the absolute vapor pressure and thus dependent on Ts.
This distinction enables partial decoupling of the droplet size and d50 diameter, allowing for the optimization of signal amplification independently of particle activation within the constraints of the WF. As a result, the sensor response amplitude can be tuned accordingly. At higher temperatures, larger droplets increase the overall signal, allowing for a reduction in limit of detection of the FCEM, whereas at larger PN concentrations, smaller droplets are preferred to minimize condensational heating and possible coagulation effects.
Ideally, all particles would grow into droplets of the same size independent of their initial seed size to allow for size-independent PN counting. The influence of the particle seed size as well as the radial position within the condenser on the final droplet size is shown in Fig. 3b. Smaller seed diameters increase the required supersaturation within the condenser, and particles therefore activate later in the condenser and have a reduced time to grow. This effect was used by Kuang et al. (2011) in a DEG-based CPC, where smaller seed particle diameters resulted in reduced droplet sizes within the detector. As in their work, the effect is particularly pronounced close to the transition region of the counter. Above 20 nm, droplet sizes remain constant, and smaller particle seed diameters closer to the cutoff diameter result in reduced droplet sizes. The size discrepancy between a 5 and 100 nm seed particle diameter can be reduced from a factor of 20 down to 25 % according to simulations. This allows for the charging of the droplet almost independent of the initial seed particle diameter and therefore direct PN measurement.
Particles closer to the centerline are exposed to a higher supersaturation and can therefore be expected to grow at a faster rate. The enhanced growth due to higher supersaturation at the center is partially offset by the reduced residence time, which is caused by the parabolic flow profile. Particles closer to the wall have an increased residence time in the condenser and therefore more time to grow. Both effects mitigate each other, leading to a consistent droplet size with only a minor reduction on the outermost region of the condenser. The calculated droplet sizes vary by up to 10 %, depending on the temperature setting and initial seed particle diameter.
6.1 Experimental setup
Figure 4 illustrates the experimental setups used for the laboratory evaluation of the CDC. Setup (a) was used to evaluate the size-dependent response of the condensation stage for monodisperse particles from 2.4 to 125 nm. For particles with a mobility diameter of 23 nm and below, we used a Palas Charme EM (Palas, Germany); and for particles of 23 nm and above, we used a TSI 3775 CPC (TSI Inc., USA). The plateau efficiency of both instruments was calibrated against a 3752 CPC (TSI Inc., USA) with a valid calibration certificate prior to the measurements. This allows for the limitations of both instruments to be accounted for: the CPC has a reduced CE at smaller sizes, whereas the EM tends to overestimate particle number concentrations at larger sizes due to the increased likelihood of multiply charged particles.
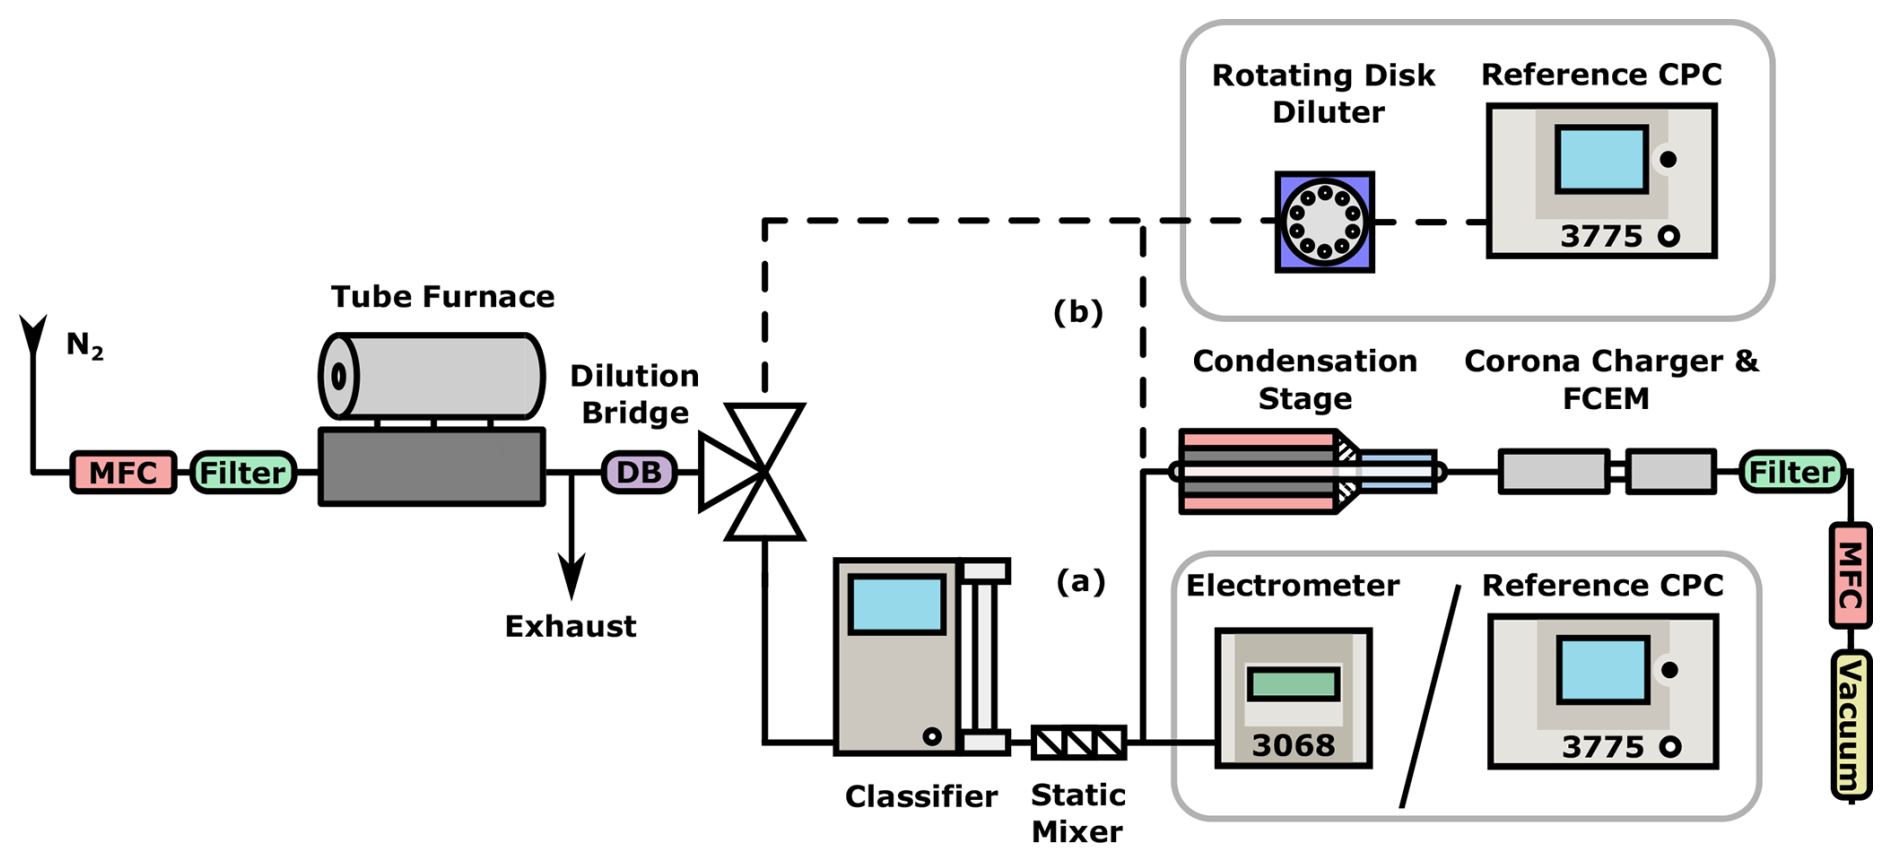
Figure 4Experimental setup to measure (a) the size-dependent response with monodisperse aerosol and (b) the concentration-dependent response of the CDC with polydisperse aerosol.
Setup (b) was used to determine the response over a wide range of concentrations with polydisperse aerosol. To stay within the single-count mode of the CPC for the linearity test, the aerosol upstream of the CPC was diluted with a rotating disk diluter at a fixed dilution ratio of 1 : 50. The size distribution of the generated polydisperse aerosols was measured prior to the CDC characterization tests, and size-dependent losses of the rotating disk diluter were characterized in previous work (Krasa et al., 2021) and accounted for.
Particles were generated by the evaporation–condensation technique as described by Scheibel and Porstendörfer (1983). A ceramic boat containing Ag for monodisperse tests and NaCl for polydisperse tests was placed inside an alumina tube in a Carbolite MTF 12/38/250 tube furnace, which was operated with N2 as a carrier gas. The particle shape and composition can influence the counting performance of DC-based instruments (Hammer et al., 2024). However, in this case, the particle surface is almost entirely composed of DEG, and the droplets become spherical after condensation. Once a particle is activated, its original composition is not expected to affect its counting behavior in the DC. Therefore, the particle composition primarily influences the activation efficiency, particularly for particles 10 nm and smaller. As no sufficient method for generating soot in this size range in the laboratory exists, silver particles were used to evaluate the counting efficiency in the transition regime of the CDC.
Nitrogen was used as a carrier gas at a flow rate of 2.5 L min−1. After passing through the tube furnace, the gas cools down passively in the alumina tube, causing supersaturation and nucleation of the vaporized material. For monodisperse measurements, particles were classified by their electrical mobility diameter via a 3083 classifier and a 3088 (TSI Inc., USA) X-ray source. Depending on the particle size, either a 3081 long DMA for larger particles or a 3086 nano DMA (TSI Inc., USA) for smaller particles was used. The sheath-to-sample flow rate was set to > 10 : 1 to ensure highly monodisperse aerosol after size selection.
6.2 Droplet size measurement
Prior to evaluation of the CDC response, both the condensation stage and the DC were characterized independently. The droplets downstream of the condensation stage were analyzed with an aerosol particle sizer 3321 (TSI Inc., USA) and compared with the simulation results for the assessment of the growth model. A temperature setting of T=55/20 °C for the condensation stage was used, and an additional flow before the particle sizer was introduced to reduce the flow rate through the condensation stage to the desired value of 0.54 L min−1 to maintain the instrument flow rate of 1 L min−1. The residence time in the system increases due to the additional tubing between the exit of the condenser and the entrance of the particle sizer, allowing for additional growth of the droplet. The influence of the increased path length was modeled and resulted in an estimated droplet size of 2.05 µm for seed particle diameters above 20 nm. The measured droplet sizes showed no significant size differences for particle seed diameters between 10 and 100 nm and averaged 1.94 µm (the average geometric standard deviation was 1.12). Therefore, the simulation overestimated the droplet size by about 6 %. The median droplet sizes are listed in the Supplement in Table S1.
6.3 Characterization of the DC for µm-sized particles
The response of the DC without the condensation stage for larger particles was evaluated. Polystyrene spheres of 2 µm were atomized in ultrapure water and classified with an aerodynamic aerosol classifier, and the DC response was compared to that of the reference counters. Due to the size-dependent nature of the diffusion charging, the DC overestimated the PN concentration by a factor of 23.4 compared to its initial calibration at 50 nm.
6.4 Size-dependent response
The size-dependent particle detection of the CDC was evaluated experimentally at a temperature setting of T=55/20 °C with the experimental setup shown in Fig. 4a and compared with simulations. The simulations include activation according to the Kelvin equation, as modeled in Fig. 2, as well as heterogeneous nucleation theory for two contact angles. The particle concentration was kept constant at ∼ 5000 cm−3 to reduce the possible influences of concentration-induced effects on the count ratio. Experimental results compared to the simulated particle activation are shown in Fig. 5.
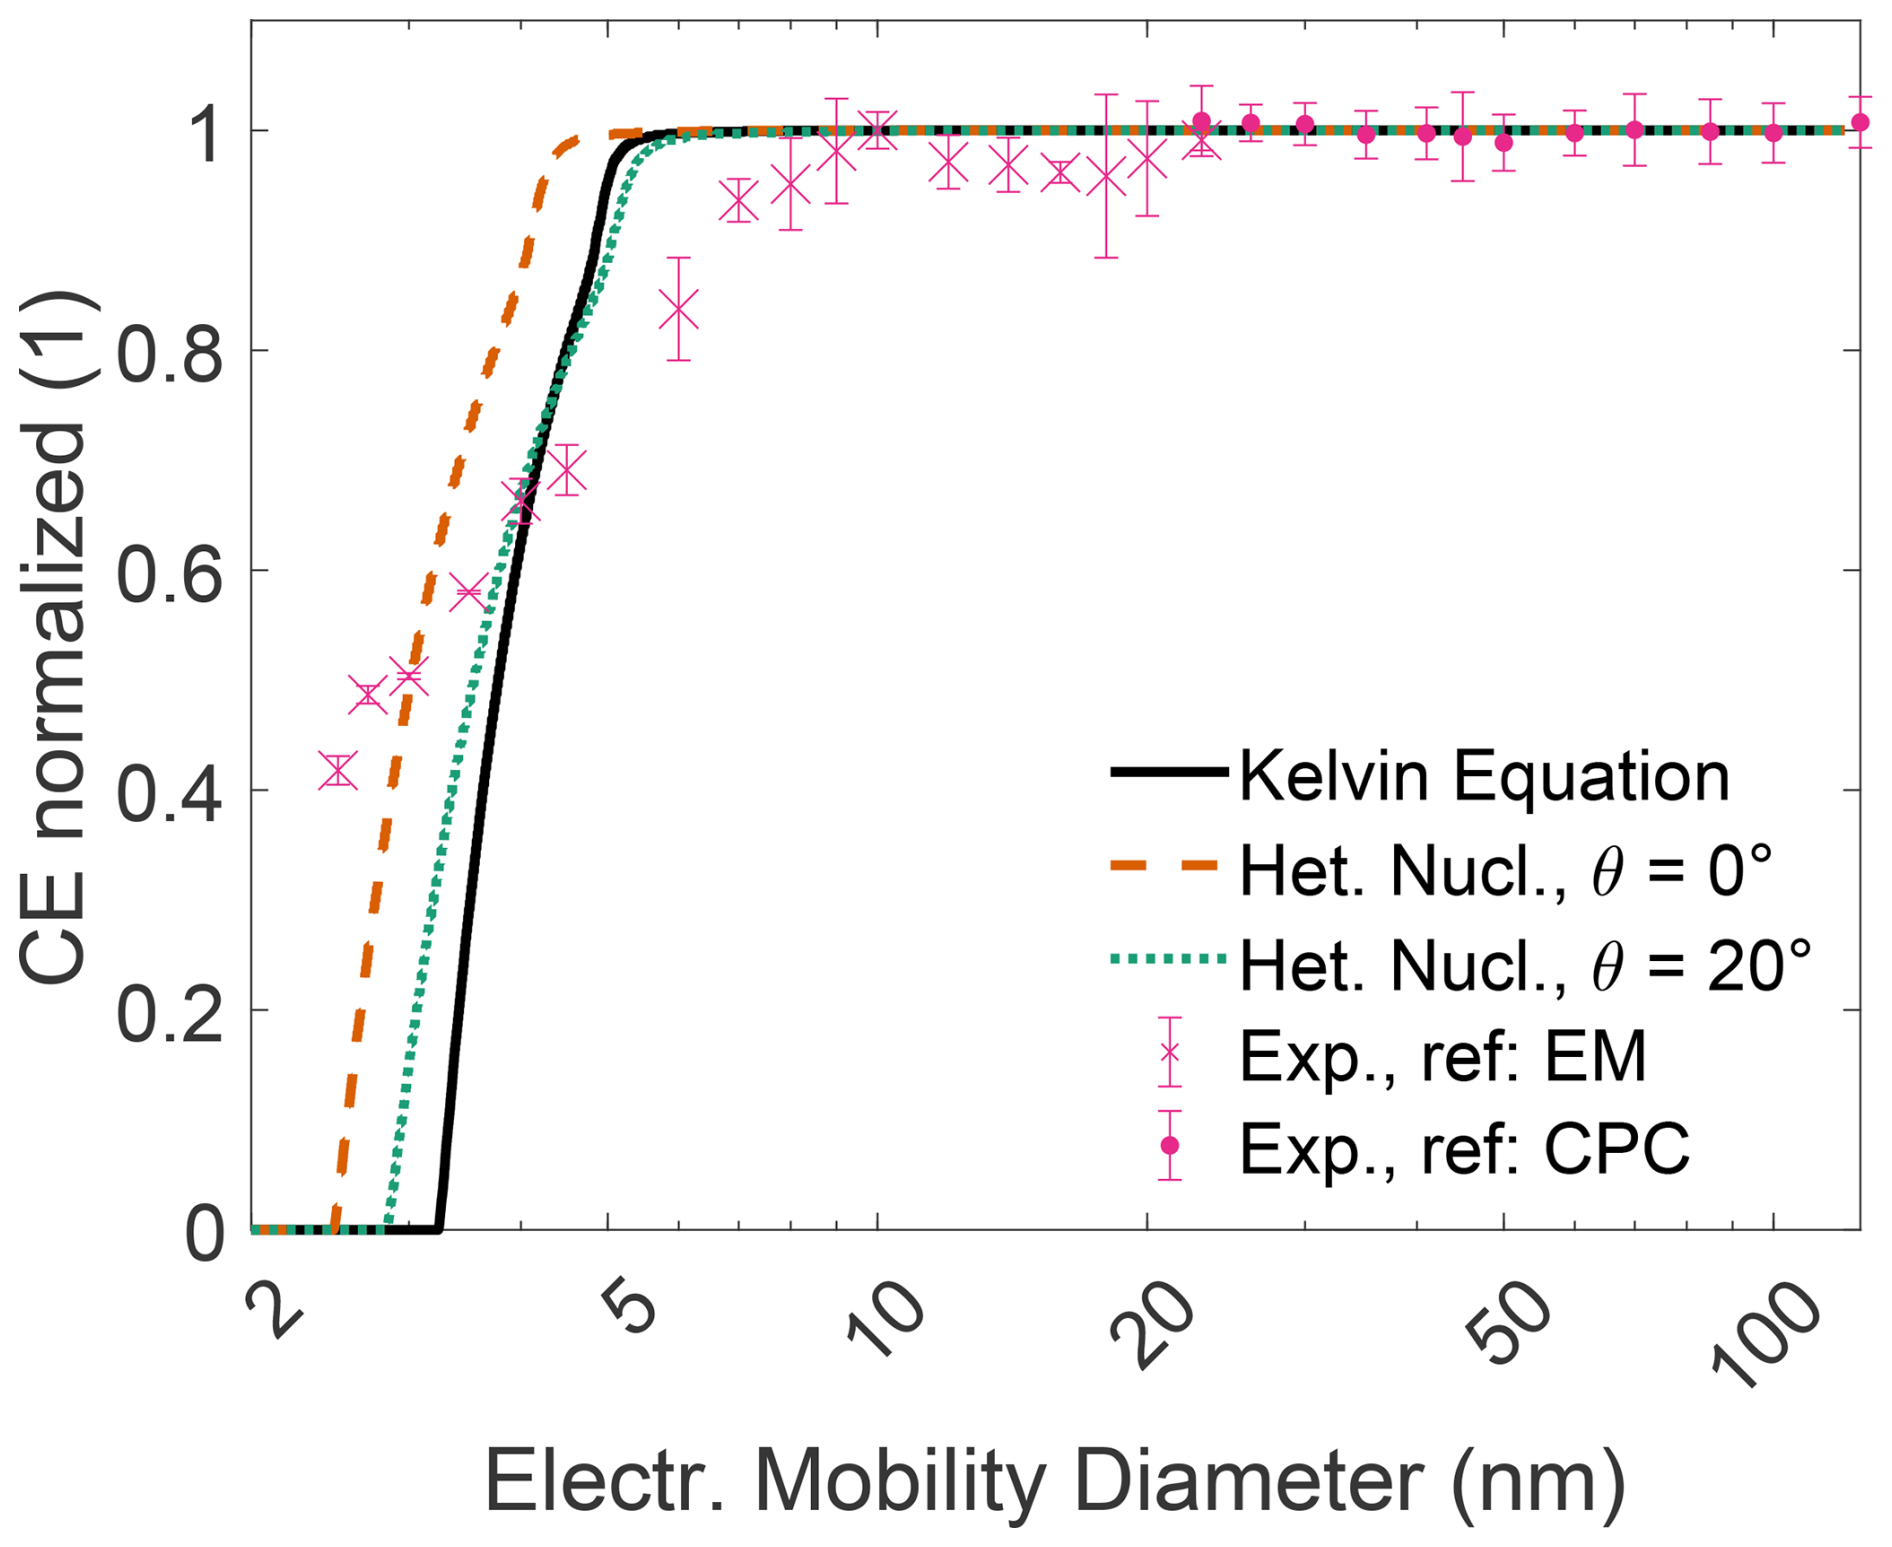
Figure 5Normalized counting efficiency of the CDC sensor, combining a DEG condensation stage and a diffusion charger at a temperature setting of 55/20 °C.
The signal amplitude of the DC increased by an average factor of 19.6 compared to the initial calibration for unmagnified 50 nm particles. The CE of the CDC stayed within 20 % of the value obtained with standardized 2 µm polystyrene spheres for the DC. The sensor response remained stable within 5 % between 10 and 125 nm, enabling PN measurement independent of their size. Slight variations in the CE compared to the EM between 10 and 20 nm can be partly attributed to an increase in doubly charged particles at larger sizes, which leads to a higher measured concentration by the reference EM.
The change in particle or droplet diameter, which is dynamic and cannot be measured exactly at the moment of charging, can alter the CE of the instrument. Furthermore, the gas composition, altered by the introduction of DEG vapor (in this case) is known to influence the discharge process as well and can therefore influence the average charge per particle (Schaffer, 2021).
As the simulation gives the ratio of activated particles, a reduction in final droplet size for particles close to the cutoff diameter due to later activation in the condenser is not considered. Therefore, the experimentally obtained CE in the transition regime is expected to be slightly lower than predicted by the simulation. For instance, a 20 % reduction in droplet size at 5 nm compared to larger seed particles is expected to decrease the signal by approximately the same amount, as per Eq. 2. Concentrations above the noise level of the reference EM could not be achieved below 2.4 nm with this setup. Below the d50 diameter, measured at 3 nm, both the Kelvin equation and heterogeneous nucleation theory underestimated the ratio of activated particles.
The condensation stage was further evaluated at a second set of temperatures, Ts = 40 °C and Tc = 20 °C. In these tests, only the particle activation without the DC was evaluated to verify the modeled particle activation. Experimental results aligned well with heterogeneous nucleation theory at an assumed contact angle of θ=20°. Further information can be found in the Supplement, and the corresponding data are shown in Fig. S3.
Giechaskiel et al. (2011) fitted contact angles in heterogeneous nucleation theory to match experimental results for a butanol-based CPC using various seed particle materials and diameters. A contact angle between 15 and 35° was found to match for most combinations of particle seed material and sizes. While the d50 value for both temperature settings in our study agrees reasonably well with a contact angle of θ=20°, the steepness of the particle activation curve is not accurately predicted for either setting.
Discrepancies between the activation models and experimental data are well documented in the literature and vary depending on CPC temperatures and selected particle diameters. The seed particle material has an influence on the activation efficiency – Wimmer et al. (2013) reported variances as high as 40 % for DEG-based condensation counters. Other contributing factors include the relative humidity of the carrier gas (Iida et al., 2009) and particle charge, which has a more pronounced effect on smaller particles and enhances their activation (Scheibel and Porstendörfer, 1983). Moreover, the simulation model assumes idealized conditions, such as perfect insulation and uniform boundary temperatures, which differ from real experimental environments. These assumptions can further contribute to deviations between simulation results and experimental observations (Reinisch et al., 2019).
Most of the previous work in literature that combines condensation with electrical sensing methods focused on nanoparticles that were grown via condensation, charged, and subsequently re-evaporated, adding an additional step. Similar to the results obtained in this work, Choi and Kim (2007) indirectly charged droplets grown with condensation and re-evaporated them, reporting no significant influence of the particle charge on the initial particle diameter, with only a minor decrease in the median charge at the lower particle sizes. In contrast, Suh et al. (2005) used a corona ionizer and could increase the average charge per particle by a factor of up to 100 but found a large dependency on the particle seed diameter. Similarly, Kim et al. (2006), who used the same setup as Suh et al., also reported a similar size dependency of the initial seed particle diameter on the charge uptake. Furthermore, they also observed an upper charge limit, at which larger grown droplets do not take up more charges.
6.5 Linearity and concentration limits
The setup used to evaluate the linearity of the sensor is shown in Fig. 4b. The linear response of the CDC instrument was evaluated with polydisperse NaCl aerosol at the same temperature setting of T = 55/20 °C. The geometric mean diameters of the polydisperse particle size distributions ranged from 20 to 60 nm, and data were collected over three separate days. The PN calibration factor of 19.6, obtained using monodisperse aerosol, was applied to the measurements conducted with polydisperse aerosol. The resulting data are shown in Fig. 6. The measured PN concentrations for the three size distributions are within 25 %. It can be observed that the measured concentration begins to decrease from approximately 104 cm−3. The raw signal of the CDC decreases by about 50 % at a concentration of 106 cm−3. The larger spread observed at lower concentration levels can be attributed to fluctuations in the CDC concentration signal. This effect was not observed in the linearity measurements, which were conducted at similar concentration levels. Sampling issues, caused by the operation of the rotating disk diluter, could have influenced the counting performance of the CDC at reduced PN concentrations.
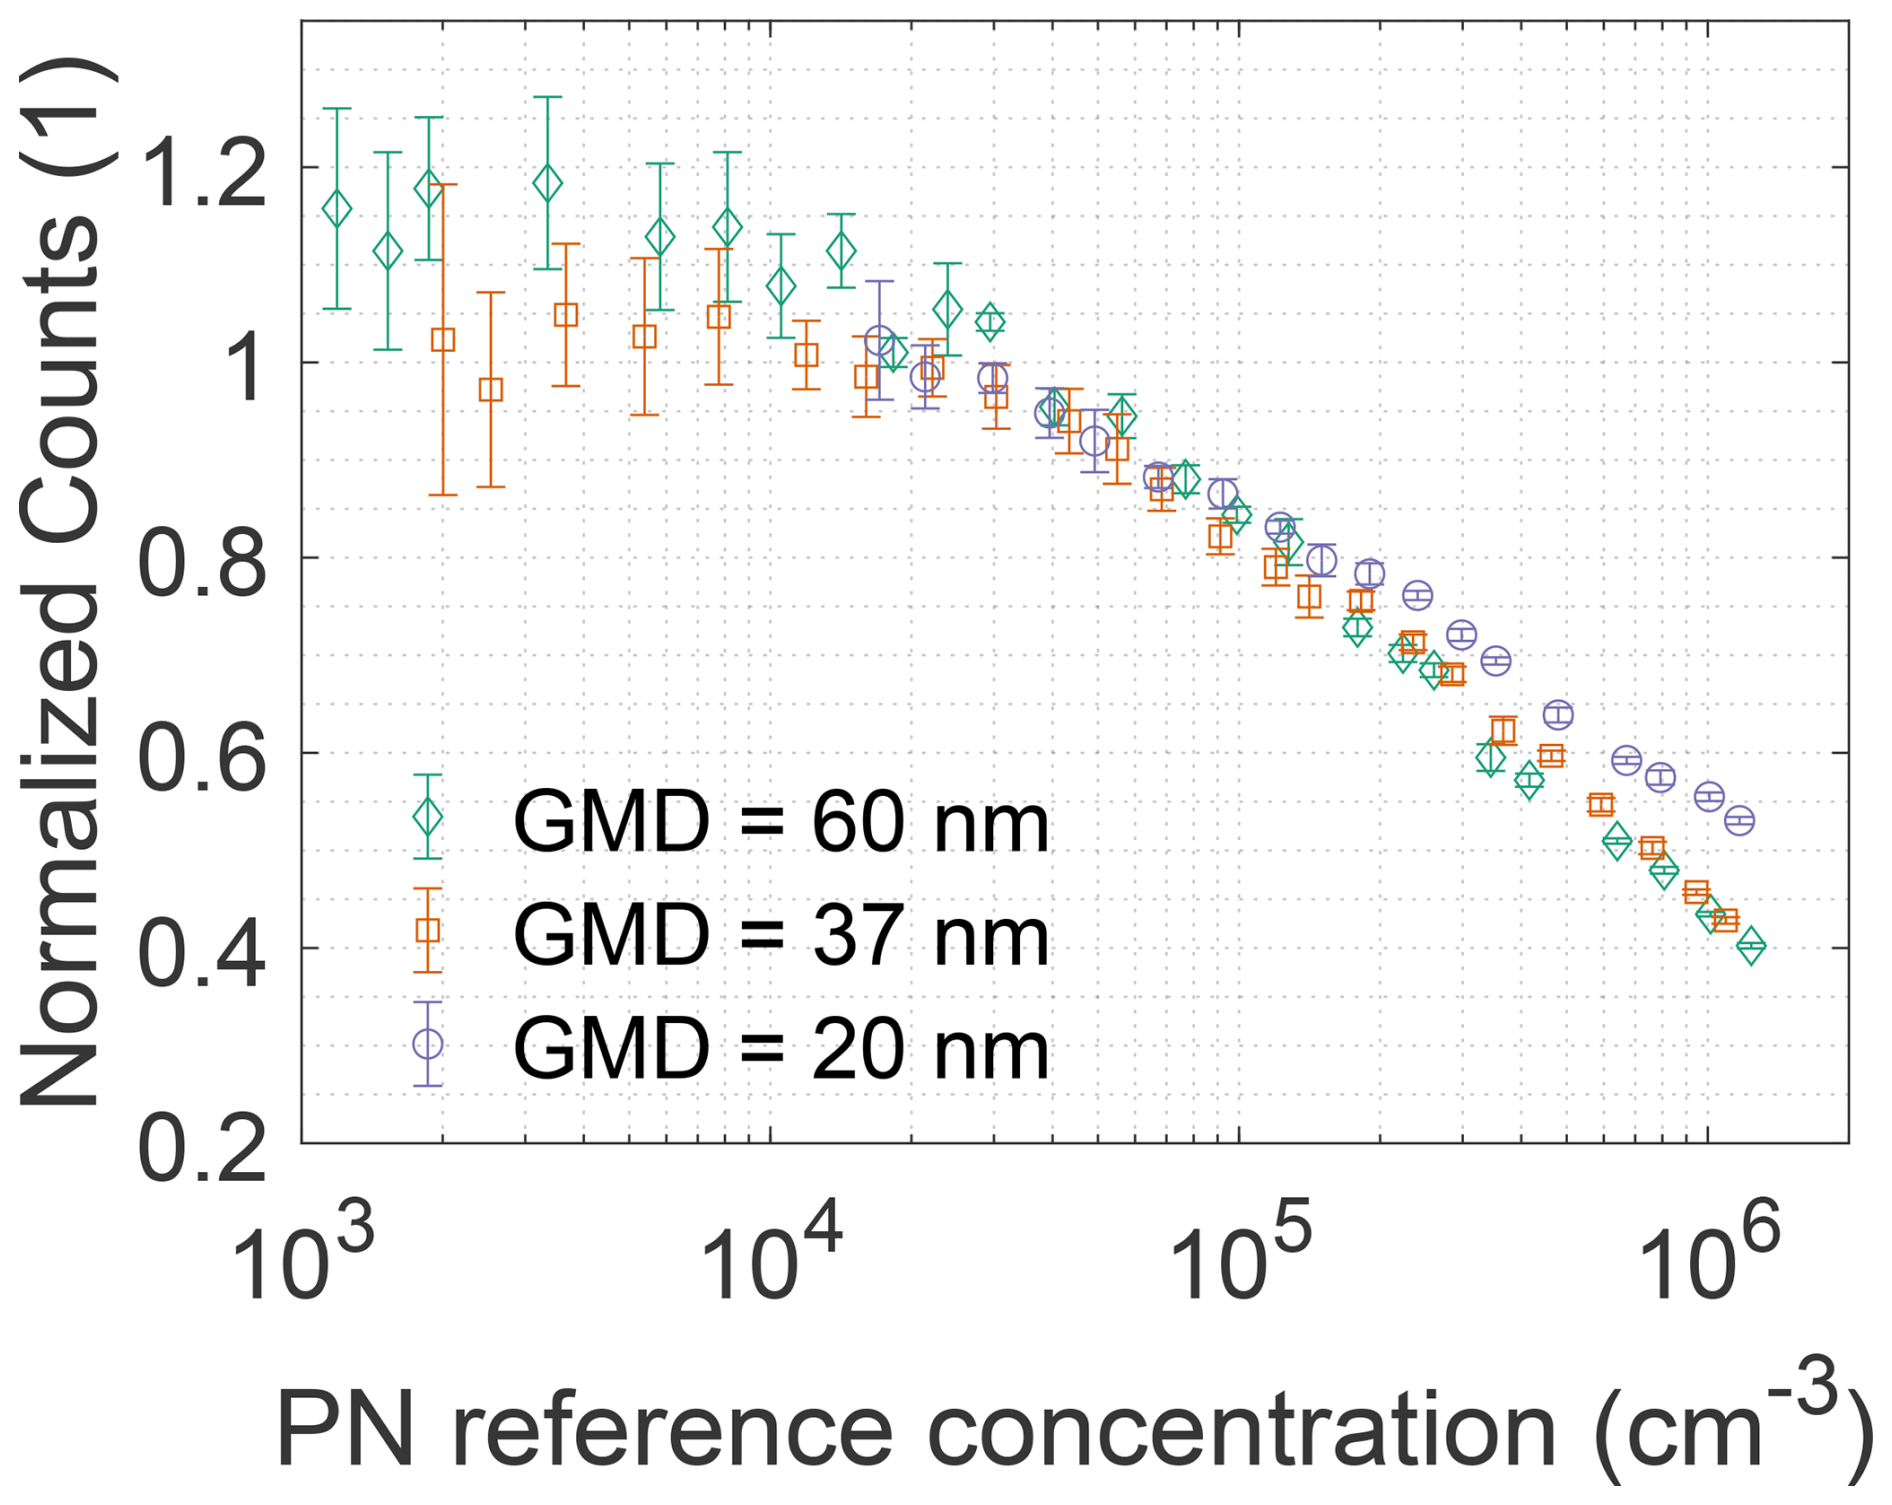
Figure 6Normalized CDC linearity evaluation response for three polydisperse size distributions from 103 to 1.5 × 106 cm−3.
The observed reduction in raw counts at high concentrations is similar to the behavior of CPCs, which experience pulse overlap at high PN concentrations and apply internal coincidence correction to account for this reduction (Takegawa et al., 2017). For concentrations above the single-count mode range, some CPCs use a photometric mode and integrate the total scattered light intensity to measure the PN concentration. However, these measured concentrations strongly depend on the initial seed particle diameter and can vary by a factor of up to 3 for initial sizes between 10 and 100 nm at a concentration of 106 cm−3 (Giechaskiel et al., 2023).
In contrast to CPCs, where signal reduction is caused by the dead time of the optical detection system, the CDC signal depends on the product of average droplet charge (and therefore size) and particle concentration. Coagulation and agglomeration rates were calculated and found to reduce the PN concentration by less than 1 % and are therefore negligible. However, condensational heating and vapor depletion are known to significantly reduce the final droplet size, thereby directly affecting the signal count. As discussed in Sect. 4, WFs with higher vapor pressures are increasingly influenced by the latent heat effect. Compared to DEG, glycerol has a saturation vapor pressure that is approximately 30 times lower. At a temperature setting of T = 40/20 °C, concentration-dependent effects were not observed, with glycerol up to a particle number concentration of 2 × 105 cm−3. The corresponding data are shown in the Supplement in Fig. S4. In contrast to glycerol, no significant reduction in signal amplitude was observed over several weeks when DEG was used as the working fluid.
The amplification of the signal amplitude enables the measurement of lower PN concentrations. At 1 s measurement time, the 3σ limit of detection was determined to be 40.8 cm−3, which is about a factor of 25 lower compared to conventional DC instruments, such as the Naneos Partector 2 at 103 cm−3 (naneos particle solutions GmbH, 2024). The current upper detection limit of 1.5 × 106 cm−3 is limited by the signal amplification in the analog digital converter used in the DC. This limit can be extended to higher concentrations at the cost of the noise level. Alternatively, adjusting the temperature settings and therefore droplet size also allows for shifting the concentration range of the instrument.
6.6 Chassis dynamometer exhaust emission measurements
The CDC was tested on a two-wheeler chassis dynamometer against a reference counter with a Euro 5-compliant L3e-A2 (medium performance) motorcycle, equipped with a single-cylinder four-stroke engine during a homologation World Motorcycle Test Cycle. The exhaust gas was sampled from a constant volume sampling (CVS) tunnel into a dilution system compliant with the current UN-ECE R83, which is described in more detail in Schurl et al. (2023). The dilution system consists of a volatile particle remover to allow for the measurement of the solid PN concentration. The CDC system was placed parallel to the sampling system, which diluted the aerosol concentration by a factor of 1 : 196. As the volatile particle remover in the sampling system could not be removed, and the CDC measured without additional pre-treatment, two different metrics – solid PN vs. total PN – were evaluated. To stay within the concentration limits of the CDC, the sampled aerosol was diluted by a factor of 1 : 10. The CPC previously used in the sampling system (nominal cutoff: 10 nm) was replaced with a 3756 CPC (TSI Inc., USA), with a nominal d50 value of 2.5 nm, and is therefore very close to that of the CDC system, with a temperature setting of T = 55/20 °C.
The resulting data are shown in Fig. 7. The CDC PN signal was reduced by a constant factor over the whole test cycle compared to the laboratory calibration. The reduction was correlated with an increase in the required corona voltage for a set corona current, suggesting the corona discharge process is affected by the gas composition (Schaffer, 2021). The effect was most pronounced at higher engine loads, where increased levels of humidity and CO2 – gases with much higher vapor pressures than DEG – could further influence the ion mobility. While an increased temperature of the corona module reduced the corona voltage, this also led to re-evaporation of the droplets before charging.
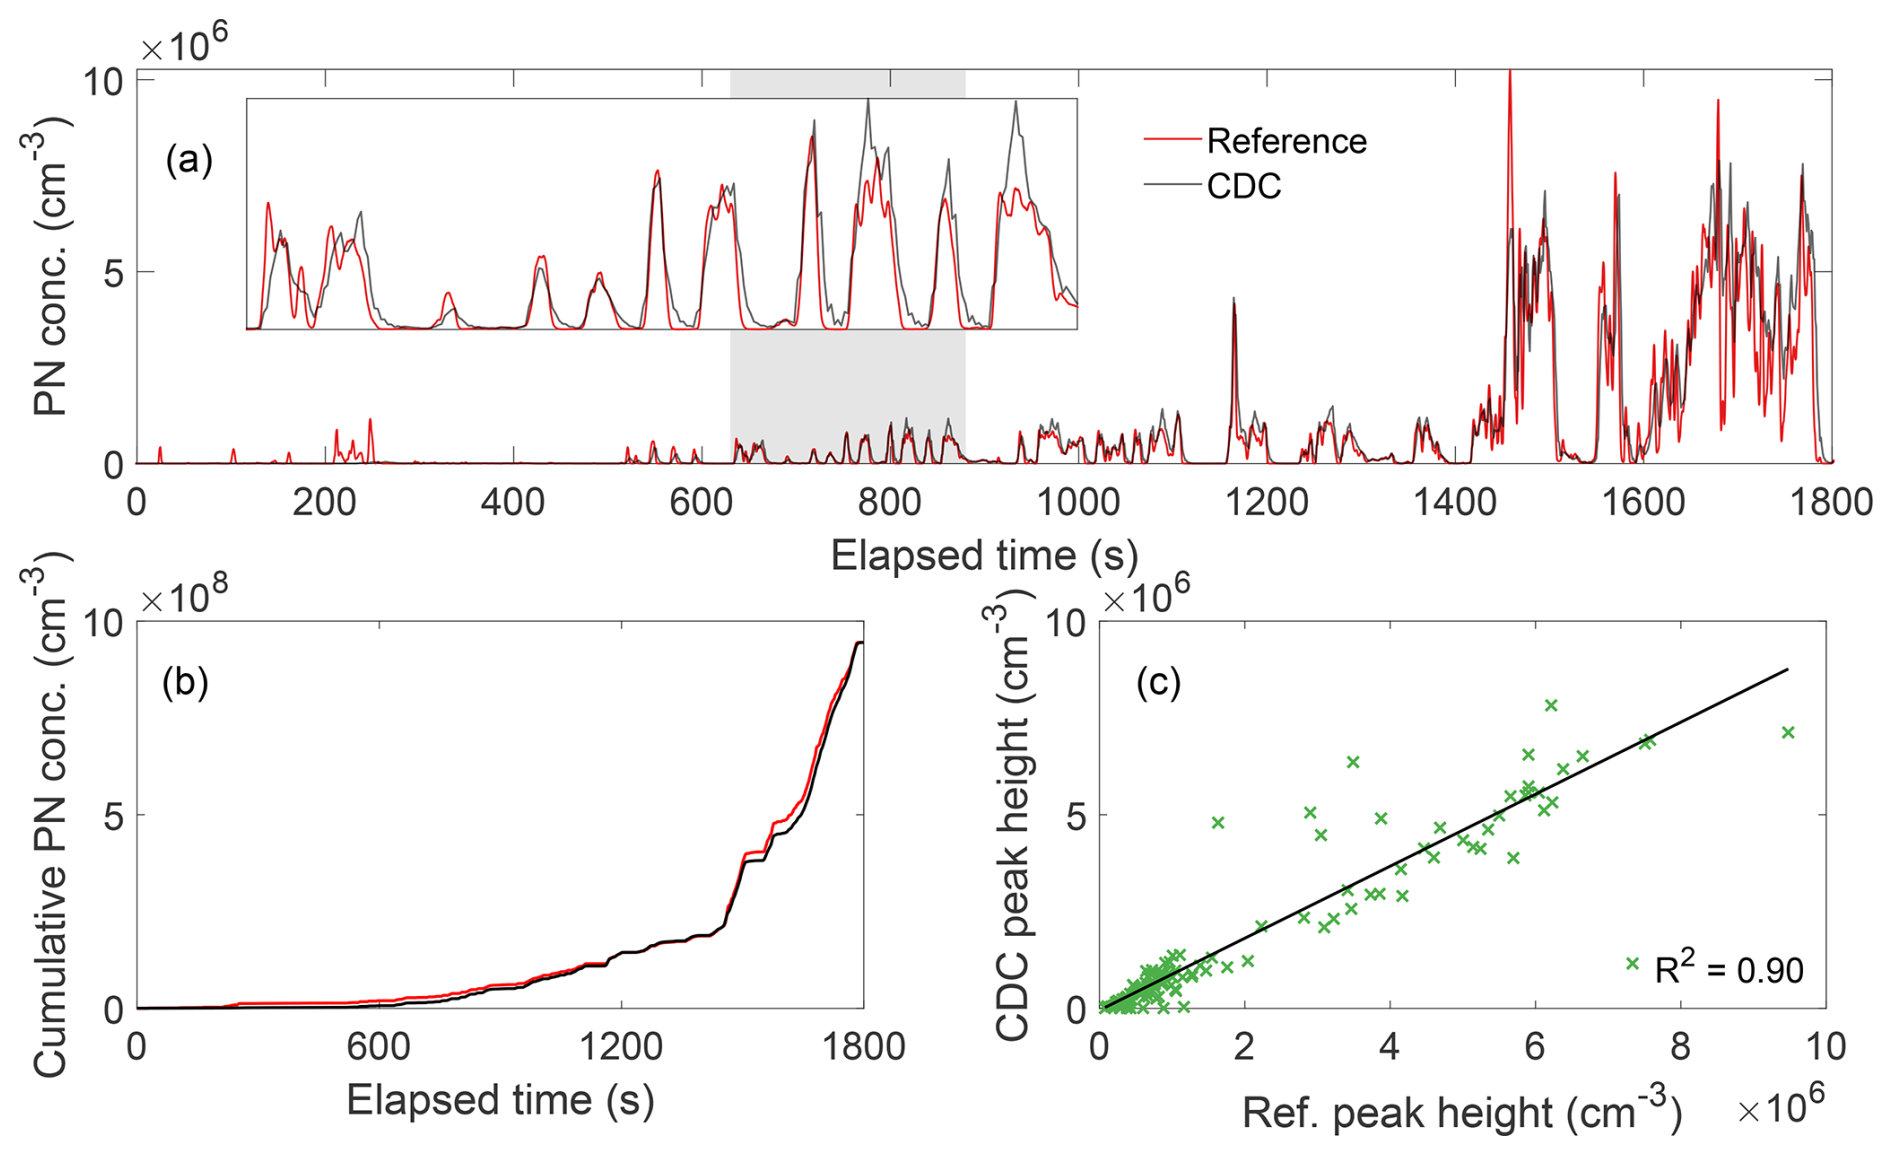
Figure 7Calibrated PN concentrations from a chassis dynamometer test. (a) Time-dependent measured concentration of both the CDC counter and a reference counter. (b) Background-adjusted cumulative PN concentration of both counters. (c) Correlation of 90 detected emission peaks.
The charger was operated at 25 °C, and the raw CDC data were adjusted with a linear offset to that of the reference counter. The adjustment factor was calibrated to the cumulative PN concentration of the reference at the end of the run after performing a background correction of the CDC data. To account for the concentration-dependent effects of the CDC, a concentration-dependent fit function, obtained from the data in Fig. 6, was used. Furthermore, a moving average of the 10 Hz CPC data was performed to match the switching period of the precipitator of 2 s.
As shown in Fig. 7a, the CDC sensor closely followed the PN concentration of the reference CPC. This is also observed in the cumulative PN concentration (Fig. 7b), which shows good correlation between both instruments. At high PN concentrations toward the end of the driving cycle, the CDC system slightly over-counts compared to the reference counter after implementation of the concentration-dependent fit function. Peak detection was performed, and 90 emission peaks of the test cycle were identified. The maximum peak heights for both instruments were correlated to each other. The CDC shows a very good correlation with an R2 of 0.90. The slope of the correlation was k = 0.94 and therefore underestimated the peak height by about 6 % compared to the cumulative PN concentration. The slightly higher but narrower peak shape for the concentration measured with CPC indicates that the response time of the CDC is slightly below that of the reference counter after time averaging. An averaging of 3 s for the CPC resulted in a slope of k = 0.98, indicating that the real response time of the CDC is closer to 3 s.
To enable a direct comparison between the two instruments, the CDC was positioned parallel to the CPC, downstream of the sampling system. In this configuration, both devices measured the solid PN concentration. As the sampled carrier gas is identical (assuming adequate mixing before the flow is split up), a slight improvement in the tracking of the cumulative PN concentration and a better correlation of the detected emission peaks was achieved. The increased peak correlation yielded an R2 value of 0.94. The resulting data are shown in Fig. S5. Further details are found in the Supplement.
In this work, we present a new instrument combining a condensation growth stage with a DC for PN measurement. The condensational magnification transforms a polydisperse size distribution into monodisperse droplets. This addresses key characteristics associated with DC, such as particle size dependence and lower particle size limit. The increased and uniform droplet sizes lead to a more uniform charge distribution and significantly improved sensitivity. The lower detection limit was extended down to 2.5 nm, while maintaining the advantages of electrical detection for high PN concentrations.
Simulations were performed to model the size-dependent particle activation and subsequent growth dynamics. The choice of working fluid was found to be critical due to the direct influence of the final droplet size on the measurement signal. Furthermore, the lower size threshold, vapor pressure, and limitations in the dimensions and temperature settings of the growth stage need to be considered.
The experimental study confirmed the modeled sensor response regarding the lower particle detection limit and signal amplification. The d50 diameter was measured to be at 3.0 nm at the chosen temperature settings, with potential to further decrease the cutoff diameter. The CDC is capable of measuring concentrations above 106 cm−3 at a flow rate of 0.54 L min−1. This exceeds the total particle count rate of a CPC operating in single-count mode at comparable flow rates by approximately an order of magnitude at the cost of an introduced lower detection limit due to the noise of the electrical detection method. This makes it unsuitable for very low concentration measurements. The 3σ limit of detection was evaluated to below 50 cm−3; however, the use of the rotating disk diluter led to an increased uncertainty during the linearity measurements in the lower concentration range.
Compared to conventional DC instruments, the CDC sensor shows a reduced size dependence and a lower limit of detection. This comes at the cost of non-linear behavior regarding the particle concentration, which can nonetheless be calibrated. While CPCs optically detect particles and require a minimum droplet size threshold for sufficient light scattering, the CDC measures the total charge acquired by the droplets. The working fluid selection is therefore widened as smaller droplet diameters are sufficient. However, a change in size directly influences the measurement amplitude.
The CDC was compared to a 2.5 nm CPC at a chassis dynamometer. The CDC is a suitable candidate to measure real-world driving emissions with highly transient particle emission events. As the upper concentration limit is higher than that of a CPC, dynamic measurements are possible over a wide concentration range without an extensive dilution system. This allows for a more compact instrument potentially using on-board light-duty vehicles, which are limited in their weight and are typically high-emitting vehicles.
The sensor principle is open to a range of future improvements, including the potential adoption of an alternative WF and a refinement of the temperature settings. These modifications could further lower the particle detection limit to below 2 nm, enhance the instrument's linearity, and increase the upper concentration limit. Depending on the target application, the FCEM geometry and flow rate can be adapted. A reduction in FCEM size would result in faster gas exchange times and, consequently, an improved instrument response time. Conversely, a larger FCEM would increase sensitivity and reduce the limit of detection. Moreover, further investigation is required to assess the influence of the condensing vapor on the corona discharge process, as well as to evaluate the long-term stability of the sensor.
The data are publicly available at https://doi.org/10.3217/tmhk6-rrd07 (Krasa, 2025).
The supplement related to this article is available online at https://doi.org/10.5194/ar-3-521-2025-supplement.
Conceptualization: HK and AB. Laboratory characterization: HK. Chassis dynamometer measurements: HK and SS. Simulations: HK and VF. Writing of paper: HK. Scientific discussion, interpretation of the results, and paper review: HK, VF, SS, MK, and AB. Funding: AB.
The contact author has declared that none of the authors has any competing interests.
Publisher's note: Copernicus Publications remains neutral with regard to jurisdictional claims made in the text, published maps, institutional affiliations, or any other geographical representation in this paper. While Copernicus Publications makes every effort to include appropriate place names, the final responsibility lies with the authors. Views expressed in the text are those of the authors and do not necessarily reflect the views of the publisher.
The authors would like to thank Mario Schriefl and Markus Knoll from AVL DiTEST for providing the diffusion charger. The grammar and language quality of the text were improved using generative AI.
This research has been supported by Horizon Europe Climate, Energy and Mobility (grant no. 101056777).
This paper was edited by Christof Asbach and reviewed by three anonymous referees.
Ahonen, L. R., Kangasluoma, J., Lammi, J., Lehtipalo, K., Hämeri, K., Petäjä, T., and Kulmala, M.: First measurements of the number size distribution of 1–2 nm aerosol particles released from manufacturing processes in a cleanroom environment, Aerosol Science and Technology, 51, 685–693, https://doi.org/10.1080/02786826.2017.1292347, 2017. a
Asbach, C., Todea, A. M., and Kaminski, H.: Evaluation of a Partector Pro for atmospheric particle number size distribution and number concentration measurements at an urban background site, Aerosol Research, 2, 1–12, https://doi.org/10.5194/ar-2-1-2024, 2024. a
Balendra, S., Kale, A., Pongetti, J., Kazemimanesh, M., Haugen, M., Weller, L., and Boies, A.: Condensation particle counters: Exploring the limits of miniaturisation, Journal of Aerosol Science, 175, 106266, https://doi.org/10.1016/J.JAEROSCI.2023.106266, 2024. a
Biskos, G., Reavell, K., and Collings, N.: Unipolar diffusion charging of aerosol particles in the transition regime, Journal of Aerosol Science, 36, 247–265, https://doi.org/10.1016/J.JAEROSCI.2004.09.002, 2005. a
Brook, R. D., Rajagopalan, S., Pope, C. A., Brock, J. R., Bhatnagar, A., Diez-Roux, A. V., Holguin, F., Hong, Y., Luepker, R. V., Mittleman, M. A., Peters, A., Siscovick, D., Smith, S. C., Whitsel, L., and Kaufman, J. D.: Particulate Matter Air Pollution and Cardiovascular Disease, Circulation, 121, 2331–2378, https://doi.org/10.1161/CIR.0B013E3181DBECE1, 2010. a
Burtscher, H., Lutz, T., and Mayer, A.: A New Periodic Technical Inspection for Particle Emissions of Vehicles, Emission Control Science and Technology, 5, 279–287, https://doi.org/10.1007/S40825-019-00128-Z, 2019. a
Choi, Y. and Kim, S.: An Improved Method for Charging Submicron and Nano Particles with Uniform Charging Performance, Aerosol Science and Technology, 41, 259–265, https://doi.org/10.1080/02786820601148262, 2007. a
Fierz, M., Houle, C., Steigmeier, P., and Burtscher, H.: Design, calibration, and field performance of a miniature diffusion size classifier, Aerosol Science and Technology, 45, 1–10, https://doi.org/10.1080/02786826.2010.516283, 2011. a
Fierz, M., Meier, D., Steigmeier, P., and Burtscher, H.: Aerosol measurement by induced currents, Aerosol Science and Technology, 48, 350–357, https://doi.org/10.1080/02786826.2013.875981, 2014. a
Franck, U., Odeh, S., Wiedensohler, A., Wehner, B., and Herbarth, O.: The effect of particle size on cardiovascular disorders – The smaller the worse, Science of The Total Environment, 409, 4217–4221, https://doi.org/10.1016/J.SCITOTENV.2011.05.049, 2011. a
Giechaskiel, B., Wang, X., Gilliland, D., and Drossinos, Y.: The effect of particle chemical composition on the activation probability in n-butanol condensation particle counters, Journal of Aerosol Science, 42, 20–37, https://doi.org/10.1016/J.JAEROSCI.2010.10.006, 2011. a
Giechaskiel, B., Maricq, M., Ntziachristos, L., Dardiotis, C., Wang, X., Axmann, H., Bergmann, A., and Schindler, W.: Review of motor vehicle particulate emissions sampling and measurement: From smoke and filter mass to particle number, Journal of Aerosol Science, 67, 48–86, https://doi.org/10.1016/j.jaerosci.2013.09.003, 2014. a
Giechaskiel, B., Melas, A., and Mamakos, A.: Assessment of two condensation particle counters (CPCs) in photometric mode for high concentration exhaust emission measurements, Combustion Engines, 193, 15–23, https://doi.org/10.19206/CE-161190, 2023. a
Hammer, T., Roos, D., Giechaskiel, B., Melas, A., and Vasilatou, K.: Influence of soot aerosol properties on the counting efficiency of instruments used for the periodic technical inspection of diesel vehicles, Aerosol Research, 2, 261–270, https://doi.org/10.5194/ar-2-261-2024, 2024. a
Hao, W., Stolzenburg, M. R., Attoui, M., Zhang, J., and Wang, Y.: Optimizing the activation efficiency of sub-3 nm particles in a laminar flow condensation particle counter: Model simulation, Journal of Aerosol Science, 158, 105841, https://doi.org/10.1016/J.JAEROSCI.2021.105841, 2021. a, b, c
Health Effects Institute: State of Global Air 2024. Special Report, https://www.stateofglobalair.org/sites/default/files/documents/2024-06/soga-2024-report_0.pdf (last access: 14 November 2025), 2024. a
Iida, K., Stolzenburg, M. R., and McMurry, P. H.: Effect of working fluid on sub-2 nm particle detection with a laminar flow ultrafine condensation particle counter, Aerosol Science and Technology, 43, 81–96, https://doi.org/10.1080/02786820802488194, 2009. a, b, c, d
International Organization for Standardization (ISO): Aerosol particle number concentration – Calibration of condensation particle counters, 2015, International Standard ISO 27891:2015(E), ISBN 978 0 580 80574 5, 2015. a
Jung, H. and Kittelson, D. B.: Characterization of aerosol surface instruments in transition regime, Aerosol Science and Technology, 39, 902–911, https://doi.org/10.1080/02786820500295701, 2005. a
Keskinen, J., Pietarinen, K., and Lehtimäki, M.: Electrical low pressure impactor, Journal of Aerosol Science, 23, 353–360, https://doi.org/10.1016/0021-8502(92)90004-F, 1992. a
Kim, D. S., Suk Lee, D., Gyu Woo, C., and Choi, M.: Control of nanoparticle charge via condensation magnification, Journal of Aerosol Science, 37, 1876–1882, https://doi.org/10.1016/J.JAEROSCI.2006.08.003, 2006. a
Knoll, M., Schriefl, M. A., Nishida, R. T., and Bergmann, A.: Impact of pre-charged particles on steady state and pulsed modes of unipolar diffusion chargers, Aerosol Science and Technology, 55, 512–525, https://doi.org/10.1080/02786826.2021.1873910, 2021. a
Krasa, H.: Condensation Diffusion Charging – Particle Number Measurement of High Concentrations Down to 2.5 nm, Graz University of Technology [data set], https://doi.org/10.3217/tmhk6-rrd07, 2025. a
Krasa, H., Bainschab, M., Kupper, M., and Bergmann, A.: 10 nm Exhaust Particle Counting System for Automotive Certification Measurements, in: 39th Annual Meeting of the American Association for Aerosol Research, https://aaarabstracts.com/2021/AbstractBook.pdf (last access: 14 November 2025), 2021. a
Kuang, C., Chen, M., McMurry, P. H., and Wang, J.: Modification of Laminar Flow Ultrafine Condensation Particle Counters for the Enhanced Detection of 1 nm Condensation Nuclei, 46, 309–315, https://doi.org/10.1080/02786826.2011.626815, 2011. a, b
Lewis, G. and Hering, S.: Minimizing Concentration Effects in Water-Based, Laminar-Flow Condensation Particle Counters, Aerosol Science and Technology, 47, 645–654, https://doi.org/10.1080/02786826.2013.779629, 2013. a, b, c
Li, Y., Chen, X., Wu, J., Zhang, Q., Zhang, Z., Hao, J., and Jiang, J.: A convertible condensation particle counter using alcohol or water as the working fluid, Aerosol Science and Technology, https://doi.org/10.1080/02786826.2024.2395939, 2024. a
Melas, A., Vasilatou, K., Suarez-Bertoa, R., and Giechaskiel, B.: Laboratory measurements with solid particle number instruments designed for periodic technical inspection (PTI) of vehicles, Measurement, 215, 112839, https://doi.org/10.1016/J.MEASUREMENT.2023.112839, 2023. a
naneos particle solutions GmbH: Partector 2 Aerosol Dosimeter Operation Manual, http://www.naneos.ch (last access: 14 November 2025), 2024. a
Park, D., An, M., and Hwang, J.: Development and performance test of a unipolar diffusion charger for real-time measurements of submicron aerosol particles having a log-normal size distribution, Journal of Aerosol Science, 38, 420–430, https://doi.org/10.1016/J.JAEROSCI.2007.01.003, 2007. a
Penttinen, P., Timonen, K. L., Tiittanen, P., Mirme, A., Ruuskanen, J., and Pekkanen, J.: Ultrafine particles in urban air and respiratory health among adult asthmatics, European Respiratory Journal, 17, 428–435, https://doi.org/10.1183/09031936.01.17304280, 2001. a
Qi, C., Chen, D.-R., and Pui, D. Y. H.: Experimental study of a new corona-based unipolar aerosol charger, Aerosol Science, 38, 775–792, https://doi.org/10.1016/j.jaerosci.2007.05.005, 2007. a
Reavell, K., Hands, T., and Collings, N.: A fast response particulate spectrometer for combustion aerosols, in: SAE Technical Papers, https://doi.org/10.4271/2002-01-2714, 2002. a
Reinisch, T., Radl, S., Bergmann, A., Schriefl, M., and Kraft, M.: Effect of model details on the predicted saturation profiles in condensation particle counters, Advanced Powder Technology, 30, 1625–1633, https://doi.org/10.1016/j.apt.2019.05.011, 2019. a
Schaffer, P.: Influence of gas composition on the corona discharge process : Modeling and experimental verification, Master thesis, Graz University of Technology, https://doi.org/10.3217/55y4h-hsw18, 2021. a, b
Scheibel, H. G. and Porstendörfer, J.: Generation of monodisperse Ag- and NaCl-aerosols with particle diameters between 2 and 300 nm, Journal of Aerosol Science, 14, 113–126, https://doi.org/10.1016/0021-8502(83)90035-6, 1983. a, b
Schraufnagel, D. E.: The health effects of ultrafine particles, Experimental & Molecular Medicine, 52, 311–317, https://doi.org/10.1038/s12276-020-0403-3, 2020. a
Schriefl, M. A., Bergmann, A., and Fierz, M.: Design principles for sensing particle number concentration and mean particle size with unipolar diffusion charging, IEEE Sensors Journal, 19, 1392–1399, https://doi.org/10.1109/JSEN.2018.2880278, 2019. a
Schriefl, M. A., Nishida, R. T., Knoll, M., Boies, A., and Bergmann, A.: Characterization of particle number counters based on pulsed-mode diffusion charging, Aerosol Science and Technology, 54, 772–789, https://doi.org/10.1080/02786826.2020.1724257, 2020. a
Schurl, S., Kupper, M., Krasa, H., Heidinger, A., and Schmidt, S.: A PN-Measurement System for Small Engine Applications, in: Small Powertrains and Energy Systems Technology Conference, ISBN 2023011809, 2023. a
Stolzenburg, M. R. and McMurry, P. H.: An Ultrafine Aerosol Condensation Nucleus Counter, Aerosol Science and Technology, 14, 48–65, https://doi.org/10.1080/02786829108959470, 1991. a
Stratmann, F., Herrmann, E., Petäjä, T., and Kulmala, M.: Modelling Ag-particle activation and growth in a TSI WCPC model 3785, Atmos. Meas. Tech., 3, 273–281, https://doi.org/10.5194/amt-3-273-2010, 2010. a, b
Suh, J., Han, B., Seong Kim, D., and Choi, M.: A method for enhanced charging of nanoparticles via condensation magnification, Journal of Aerosol Science, 36, 1183–1193, https://doi.org/10.1016/J.JAEROSCI.2005.02.001, 2005. a, b
Takegawa, N., Iida, K., and Sakurai, H.: Modification and laboratory evaluation of a TSI ultrafine condensation particle counter (Model 3776) for airborne measurements, Aerosol Science and Technology, 51, 235–245, https://doi.org/10.1080/02786826.2016.1261990, 2017. a
Vanhanen, J., Mikkilä, J., Lehtipalo, K., Sipilä, M., Manninen, H. E., Siivola, E., Petäjä, T., and Kulmala, M.: Particle size magnifier for nano-CN detection, Aerosol Science and Technology, 45, 533–542, https://doi.org/10.1080/02786826.2010.547889, 2011. a
Vasilatou, K., Iida, K., Kazemimanesh, M., Olfert, J., Sakurai, H., Sipkens, T. A., and Smallwood, G. J.: Aerosol physical characterization: A review on the current state of aerosol documentary standards and calibration strategies, Journal of Aerosol Science, 183, 106483, https://doi.org/10.1016/J.JAEROSCI.2024.106483, 2025. a
Wimmer, D., Lehtipalo, K., Franchin, A., Kangasluoma, J., Kreissl, F., Kürten, A., Kupc, A., Metzger, A., Mikkilä, J., Petäjä, T., Riccobono, F., Vanhanen, J., Kulmala, M., and Curtius, J.: Performance of diethylene glycol-based particle counters in the sub-3 nm size range, Atmos. Meas. Tech., 6, 1793–1804, https://doi.org/10.5194/amt-6-1793-2013, 2013. a
Yaw, C. L.: Yaws' handbook of thermodynamic and physical properties of chemical compounds : physical, thermodynamic and transport properties for 5000 organic chemical compounds, 1st edn., Knovel, ISBN 978-1-59124-444-8, 2003. a
- Abstract
- Introduction
- Instrument description
- Theoretical background
- Working fluid selection
- Condensation stage model
- Experimental evaluation of the CDC
- Conclusion
- Data availability
- Author contributions
- Competing interests
- Disclaimer
- Acknowledgements
- Financial support
- Review statement
- References
- Supplement