the Creative Commons Attribution 4.0 License.
the Creative Commons Attribution 4.0 License.
 | 25 Feb 2026
Development of the SiMPLE-PAS: a low-cost, three-wavelength photoacoustic spectrometer for aerosol absorption
Ashley M. Scott
Charles A. Wise
Ryan P. Poland
Anna D. Jordan
Photoacoustic spectroscopy (PAS) has become a common method for measuring aerosol absorption and is one of the few techniques capable of directly measuring absorption by suspended aerosol particles at ambient concentrations. When multiple wavelengths are used, PAS provides a way of measuring the absorption Ångström exponent (AAE) and, when combined with a scattering or extinction method, provides a measure of the aerosol single-scattering albedo (SSA), and both AAE and SSA are important parameters in climate models. Despite this utility, few commercial PAS instruments are available, and no multi-wavelength commercial instruments are currently available. Thus, most extant PAS instruments are custom-built and therefore come with considerable cost and development time and require access to machine shops capable of fabricating the needed components. The goal of this work was to provide a blueprint for a low-cost, multi-wavelength PAS for measurement of the aerosol AAE both in the laboratory and in the field. In an effort to create an instrument with a low barrier to entry, we aim to use low-cost, readily available components and use open-source options wherever possible. In this paper, we present the SiMPLE-PAS, a single-pass, multi-wavelength, portable, and low-expense photoacoustic spectrometer that uses low-cost electronics and a 3D-printed cell to meet these design goals. The instrument has a total bill-of-materials cost on the order of USD 500. The instrument is, to the best of our knowledge, the first 3D-printed PAS for aerosols and likely the lowest-cost PAS to date. The instrument performed well in laboratory validation experiments and showed good agreement with measurements of aerosol absorption by the previously developed MultiPAS-IV instrument when co-located at the second Georgia Wildland Fire Simulation Experiment (G-WISE 2) during April 2025. The instrument shows competitive detection limits of 0.63, 1.99, and 0.55 Mm−1 for the blue, green, and red channels (10 min, 2σ), respectively, which will allow it to measure both ambient and laboratory-generated aerosols. The SiMPLE-PAS therefore provides a low-cost, accessible photoacoustic spectrometer that offers to lower the barrier to entry for groups wishing to measure aerosol absorption, whether in the laboratory or in the field.
- Article
(2809 KB) - Full-text XML
-
Supplement
(18890 KB) - BibTeX
- EndNote


This paper presents the initial development of the SiMPLE-PAS, a single-pass, multi-wavelength, portable, and low-expense photoacoustic spectrometer designed to measure aerosol absorption and the aerosol absorption Ångström exponent (AAE). The instrument relies on the technique of photoacoustic spectroscopy (PAS) to directly measure the absorption coefficient of suspended aerosols at three wavelengths using inexpensive blue (450 nm), green (515 nm), and red (665 nm) laser diodes. PAS is one of the few absorption techniques with the sensitivity required to measure the absorption of light by suspended aerosols that is not also sensitive to scattering (Krzempek, 2019). This allows measurement of the aerosol single-scattering albedo (SSA) when combined with an extinction or scattering method. When multiple wavelengths are used, PAS allows the retrieval of the AAE, which describes the wavelength dependence of the aerosol absorption spectrum. Such measurements of SSA and AAE are vital for understanding Earth's climate (Moosmüller et al., 2009; Li et al., 2022).
In the atmosphere, absorbing aerosols are typically composed of black carbon (BC), brown carbon (BrC), or a mixture thereof, with an absorption spectrum following the form of , where babs is the absorption coefficient of the aerosol, λ is the wavelength, and β is the pre-exponential scaling factor (Moosmüller et al., 2009). These categories are largely defined by their spectroscopic characteristics (not chemical composition), with black carbon having an AAE of 1.0 and brown carbon having an AAE of ≫ 1.0 (Moosmüller et al., 2011; Saleh et al., 2018). Instruments with at least two wavelengths can retrieve the aerosol AAE using a linear fit to log-transformed data, although it is typically better to have at least three or four wavelengths for separating the individual contributions of BC and BrC to the overall absorption spectrum (Zhang et al., 2016; Nakayama et al., 2015). Fischer and Smith (2018a) developed a four-wavelength, multi-pass PAS called the MultiPAS-IV, and another group uses a three-wavelength derivative of this instrument called the MultiPAS-III (e.g., Yu et al., 2021; Cheng et al., 2021). More recently, Schnaiter et al. (2023) developed the PAAS-4λ, which used a single-pass PAS cell but yielded similar detection limits to multi-pass instruments. And, even more recently, a three-wavelength cantilever-enhanced PAS (i.e., QE-PAS) was developed for aerosol absorption (Karhu et al., 2025).
Despite its use as one of the only direct, online methods of measuring aerosol absorption, few commercial PAS instruments exist, and many PAS groups use custom-built instruments (Upadhyay et al., 2025; Nakayama et al., 2015). There is therefore a significant up-front expense in terms of both financial cost and time cost to develop an instrument. Although numerous PAS designs have come to exist with varying levels of complexity, in principle, a PAS is composed of relatively few components and could be built relatively cheaply. The required components are (1) a light source, typically a laser, capable of being modulated at a frequency of several kHz; (2) a sample cell that consists of an acoustic resonator (usually) with windows on either end; (3) a microphone and preamplifier to detect and amplify the signal; and (4) a data acquisition card capable of digitizing the relatively slow (several kHz) audio signal produced by the microphone. Often, instrument designers will also include a photodiode or power meter at the back of the sample cell to monitor changes in source power in real time (e.g., Ajtai et al., 2010; Nakayama et al., 2015; Linke et al., 2016; Fischer and Smith, 2018a; Yu et al., 2019; Karhu et al., 2022; Schnaiter et al., 2023). Despite these things, low-cost development has rarely, if ever, been realized in practice.
Many options now exist for low-cost electronic components (e.g., development boards such as Arduino and Raspberry Pi Pico) and manufacturing techniques (e.g., fused deposition modeling, FDM “3D printing”), but few have been applied to PAS. Recently, Haedrich et al. (2025) presented a “low-cost opto-acoustic black carbon sensor” based on quartz-enhanced PAS (QE-PAS) and designed to measure ship emissions via on-board deployment. This was based on the QE-PAS developed by Stylogiannis et al. (2021). QE-PAS differs from traditional PAS in that the signal is detected with a quartz tuning fork instead of a microphone. Therefore, while this instrument employs low-cost consumer electronics (i.e., Arduino), it still requires a custom-machined sample cell and further requires a custom quartz tuning fork or a commercial QE-PAS cell. Although no price is given in the paper, the instrument is described as “relatively lower cost” by the authors, and it seems reasonable to assume the instrument costs in the range of at least several thousand dollars based on the cost of commercial QE-PAS cells (which are roughly USD 4000 via Thor Labs at the time of this writing and do not include light sources or electronics). Keeratirawee et al. (2022) developed low-cost circuitry for PAS but do not present a corresponding low-cost cell design and present applications to gases only, not aerosols, and only at a single wavelength. Kapp et al. (2019) developed an LED-based photoacoustic sensor for nitrogen dioxide. The authors do not describe this instrument as low cost but did use a low-cost microphone and home-built preamplifier along with an innovative “T-cell” resonator design that allowed a low-cost LED to be used as the light source. This instrument was also manufactured using additive manufacturing in the form of direct metal laser sintering (DMLS), which allowed for a unique and easy-to-manufacture cell, although DMLS machines themselves are quite expensive and not as widely available as other additive manufacturing equipment (e.g., FDM 3D printers). Helmholtz-style PAS cells have also recently been explored for gas-phase measurements. Such cells use alternative resonator designs that have features that make them potentially amenable to low-cost designs, including short, large-diameter sample cells that would allow for the use of LED light sources. For example, Fu et al. (2024) used FDM 3D printing to build a Helmholtz-based PAS for trace gas detection, and Zhang et al. (2024) developed a differential Helmholtz PAS with a short, large diameter that could accommodate a laser multi-pass cell, although it would also be amendable to LEDs. However, most of these studies have largely focused on the development and description of the Helmholtz resonators, and there have been no applications to aerosols and no apparent attempt to use low-cost components for the light source or detection/DAQ portions of the instrument. In short, no PAS has combined all of the features needed for a truly low-cost PAS, and those that come close have not been applied to aerosols and/or measure only at a single wavelength.
The objective of this work is to explore the viability of using low-cost electronics and 3D printing to construct a multi-wavelength PAS for aerosol absorption, with the ultimate goal of presenting a simple, accessible, low-cost design for an aerosol PAS using open-source hardware and software wherever possible. Although several groups have made progress toward low(er)-cost PAS instruments or components thereof (Haedrich et al., 2025; Keeratirawee et al., 2022; Kapp et al., 2019), no group has presented a low-cost multi-wavelength PAS. Further, existing papers largely omit details about how to apply low-cost methods to scientific instrumentation, such as the steps used to create gas-tight sample cells using FDM 3D printing. Here, we present a portable, sensitive, single-pass, laser-based, three-wavelength PAS that measures aerosol absorption at 450, 515, and 665 nm and that can be constructed for a material cost of roughly USD 500. We further discuss the considerations and cautions that go into developing a gas-tight instrument with FDM 3D printing. We anticipated that building a PAS for such a low cost would inherently limit sensitivity; although this is true to an extent, the SiMPLE-PAS has detection limits that are competitive when compared to much more expensive instruments and exhibits a large dynamic range. Together, these features make it suitable for use in measurements of ambient atmospheric aerosols where concentrations are often very low and in lab campaigns where concentrations are often very high. In this paper, we present the design of the sample cell, electronics and data acquisition hardware, data acquisition software, and portable case and mounting system, with a detailed discussion of the considerations taken and tradeoffs made to make the instrument low cost. We then describe calibration of the instrument with NO2 and validation with gas-phase measurements of the ozone absorption cross-section, discuss limits of detection, and finally demonstrate the capabilities of the instrument to measure aerosols with deployment at the G-WISE 2 (Georgia Wildland Fire Simulation Experiment 2) laboratory campaign, where the instrument was co-located with the MultiPAS-IV (Fischer and Smith, 2018a) instrument for intercomparison.
The SiMPLE-PAS is a low-cost, single-pass, three-wavelength, laser-based photoacoustic spectrometer that uses a sample cell manufactured with FDM 3D printing. To the best of our knowledge, the SiMPLE-PAS is the first multi-wavelength PAS and first aerosol PAS manufactured with 3D printing and the first PAS under USD 1000, making it orders of magnitude less expensive than most PAS instruments. Figure 1 shows a functional block diagram of the SiMPLE-PAS, including rough cost estimates for each item (a full cost breakdown is provided in Fig. S6 in the Supplement). It is composed of a low-cost red, green, blue (RGB) laser module controlled by a Raspberry Pi Pico 2, a 3D-printed cell, a custom microphone and preamplifier board, a 24-bit USB sound card, and open-source software written in the language Julia. We will describe these components in this section, with a special focus on steps unique to developing a low-cost and 3D-printed PAS, and then we will further describe the calibration, characterization, and measurement methods, including a brief description of the theoretical principles underlying PAS.
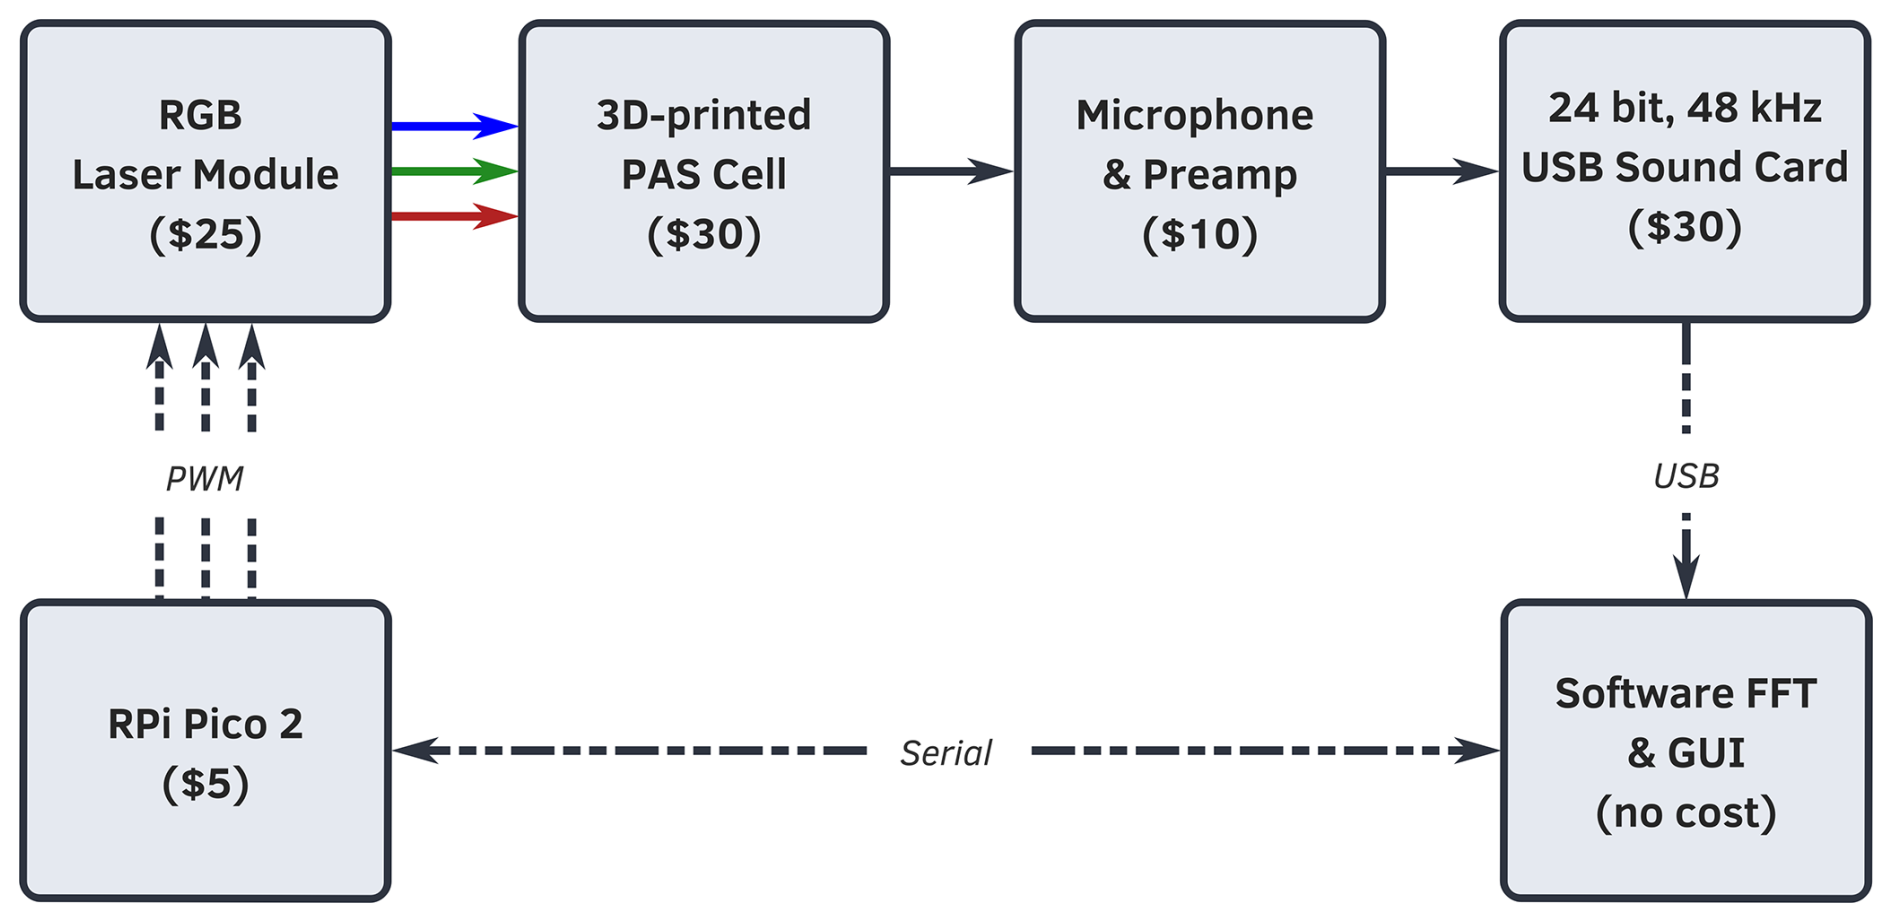
Figure 1Functional block diagram of the SiMPLE-PAS, including rough cost estimates for each item. A Raspberry Pi Pico 2 development board is used to control an RGB laser module that illuminates the 3D-printed PAS cell at three distinct frequencies (one for each wavelength); the signal is digitized with a USB sound card, and an FFT is performed on the signal using custom software written in Julia, which also allows for user control of the lasers and other PAS components. A full cost breakdown is provided in the Supplement.
2.1 Instrument description and operating principle
The SiMPLE-PAS relies on the technique of photoacoustic spectroscopy (PAS), which has been described in detail in various reviews and tutorials (Bell, 1880; Miklós et al., 2001; Dumitras et al., 2007; Palzer, 2020; Upadhyay et al., 2025). In the SiMPLE PAS, as with most PAS instruments, a laser is directed into a sample cell, which is composed of an acoustic resonator of length (where λ represents the wavelength of a waveform at the resonant frequency), with a resonator on either end to cancel background noise. Here, the main resonator has a nominal length of 100 mm. The sample is carried into the resonator by a bath gas, typically air, nitrogen, or oxygen depending on the analyte, and light absorbed by the sample is converted into heat via non-radiative decay and is ultimately transferred to the bath gas (Cotterell et al., 2019, 2021). As a first approximation, one can surmise that this increase in temperature leads to an increase in pressure via the ideal gas law (PV=nRT). Thus, when the light source is modulated on and off at the inherent resonant frequency of the sample cell, a standing wave forms wherein the amplitude of the waveform is proportional to the amount of light absorbed by the sample. The cell is designed with an acoustic resonant frequency (in our case, roughly 1600 Hz), such that a microphone placed at the center of the sample cell (i.e., the antinode of the standing wave) can then detect the pressure (sound) wave, and the volume of the detected sound is proportional to the amount of light absorbed. For a single wavelength, the sound wave resultant on the microphone can be described by the following:
Here, S is the signal detected by the microphone (units: V) at wavelength λ, P0 is the power of the incident light (W), M is the sensitivity of the microphone (V Pa−1), Ccell is the PAS cell constant (Pa M W−1), σabs is the absorption cross-section of the analyte (m2), N is the number density of the analyte (m−3), and Ab is the background signal (Pa W−1) (Ajtai et al., 2010; Bozóki et al., 2011; Schnaiter et al., 2023). The cell constant is dependent on the geometry of the sample cell and the bath gas according to
with γ being equal to the ratio of specific heat constants of the bath gas, fm being equal to the resonant frequency of the cell (Hz), Ares representing the cross-sectional area of the cell (m2), Q being the unitless quality factor of the resonator, and G being the unitless “geometric factor” that can range from 0 to 1 and that accounts for the spatial overlap (or lack thereof) between the laser beam and acoustic mode of the cell. Ideally, all terms in Eq. (2) – and, thus, in Ccell, should be constant with wavelength. But for the multi-wavelength cell described here, the lasers are each modulated at a different frequency and run simultaneously, such that the waveform detected by the microphone represents the sum of Eq. (1) at three separate wavelengths, where fm is set uniquely for each wavelength. Although the modulation frequencies are close enough that Q varies little from one wavelength to another and although we work to keep G the same for all wavelengths, we measure Ccell independently for each wavelength during calibration (as discussed in the Calibration section below).
2.1.1 The 3D-printed photoacoustic cell
As built, the photoacoustic cell used in this work consists of a 101 mm long by 4.6 mm inner-diameter stainless steel resonator held in a 3D-printed plastic body with 50 mm × 35 mm inner-diameter buffer volumes on either end. The body of the cell and buffer volumes are manufactured by means of PET-G (polyethylene terephthalate) using a Prusa i3 MK3S+ (Prusa Research). Briefly, FDM 3D printing works by extruding plastic filament through a hot nozzle, and the placement of the nozzle is controlled by G code, such that the 3D printer can build up a part layer by layer by placing the nozzle where plastic is desired; each layer of plastic is typically 0.2 mm thick. FDM 3D printing was chosen as the manufacturing method for its low cost and relatively widespread availability, with many academic institutions having maker spaces that contain 3D printers and many affordable 3D printer options being available to consumers, along with the availability of online vendors who will 3D print components for a relatively low cost. But 3D-printed parts present multiple challenges when incorporated into a photoacoustic spectrometer. First, and most importantly, parts made with FDM 3D printing are typically not gas-tight by default. Because typical calibration methods for PAS rely on pressurized, toxic gases (NO2, O3), this is a major concern, and thorough testing must be conducted to ensure that the instrument will not leak gases into the lab. Similarly, any leaks in the instrument could pose experimental issues when under vacuum; such is the case when sampling ambient aerosols or when sampling from a common sampling line in a laboratory campaign. Second, FDM 3D-printed parts are typically composed of “solid” inner and outer shells that are typically only three to five layers thick, with most of the inner volume of the part being composed of “infill” with a default density of 15 %–20 % plastic in a honeycomb or rectilinear pattern with empty space in between; for PAS, this creates a low-density part through which sound can easily travel and cause interference in the signal. Finally, tolerances are often poor in FDM 3D printing, and parts contain layer artifacts, such that the geometry of a particular feature may depend on the orientation in which the part was printed. For example, a cylinder (or PAS resonator) printed on the end will have a circular cross-section (because the nozzle can easily move in a circle), while a cylinder printed on its side will have an approximately circular geometry because it must be built up of 0.2 mm layers. In PAS, this is equivalent to a rough resonator and leads to a low Q and therefore low sensitivity. In another example, surfaces printed in contact with the build plate or as the top surface will have a relatively smooth surface (assuming that the build plate is smooth), while surfaces on the sides of parts will be rough; this becomes an important consideration when printing o-ring grooves and other sealing surfaces.
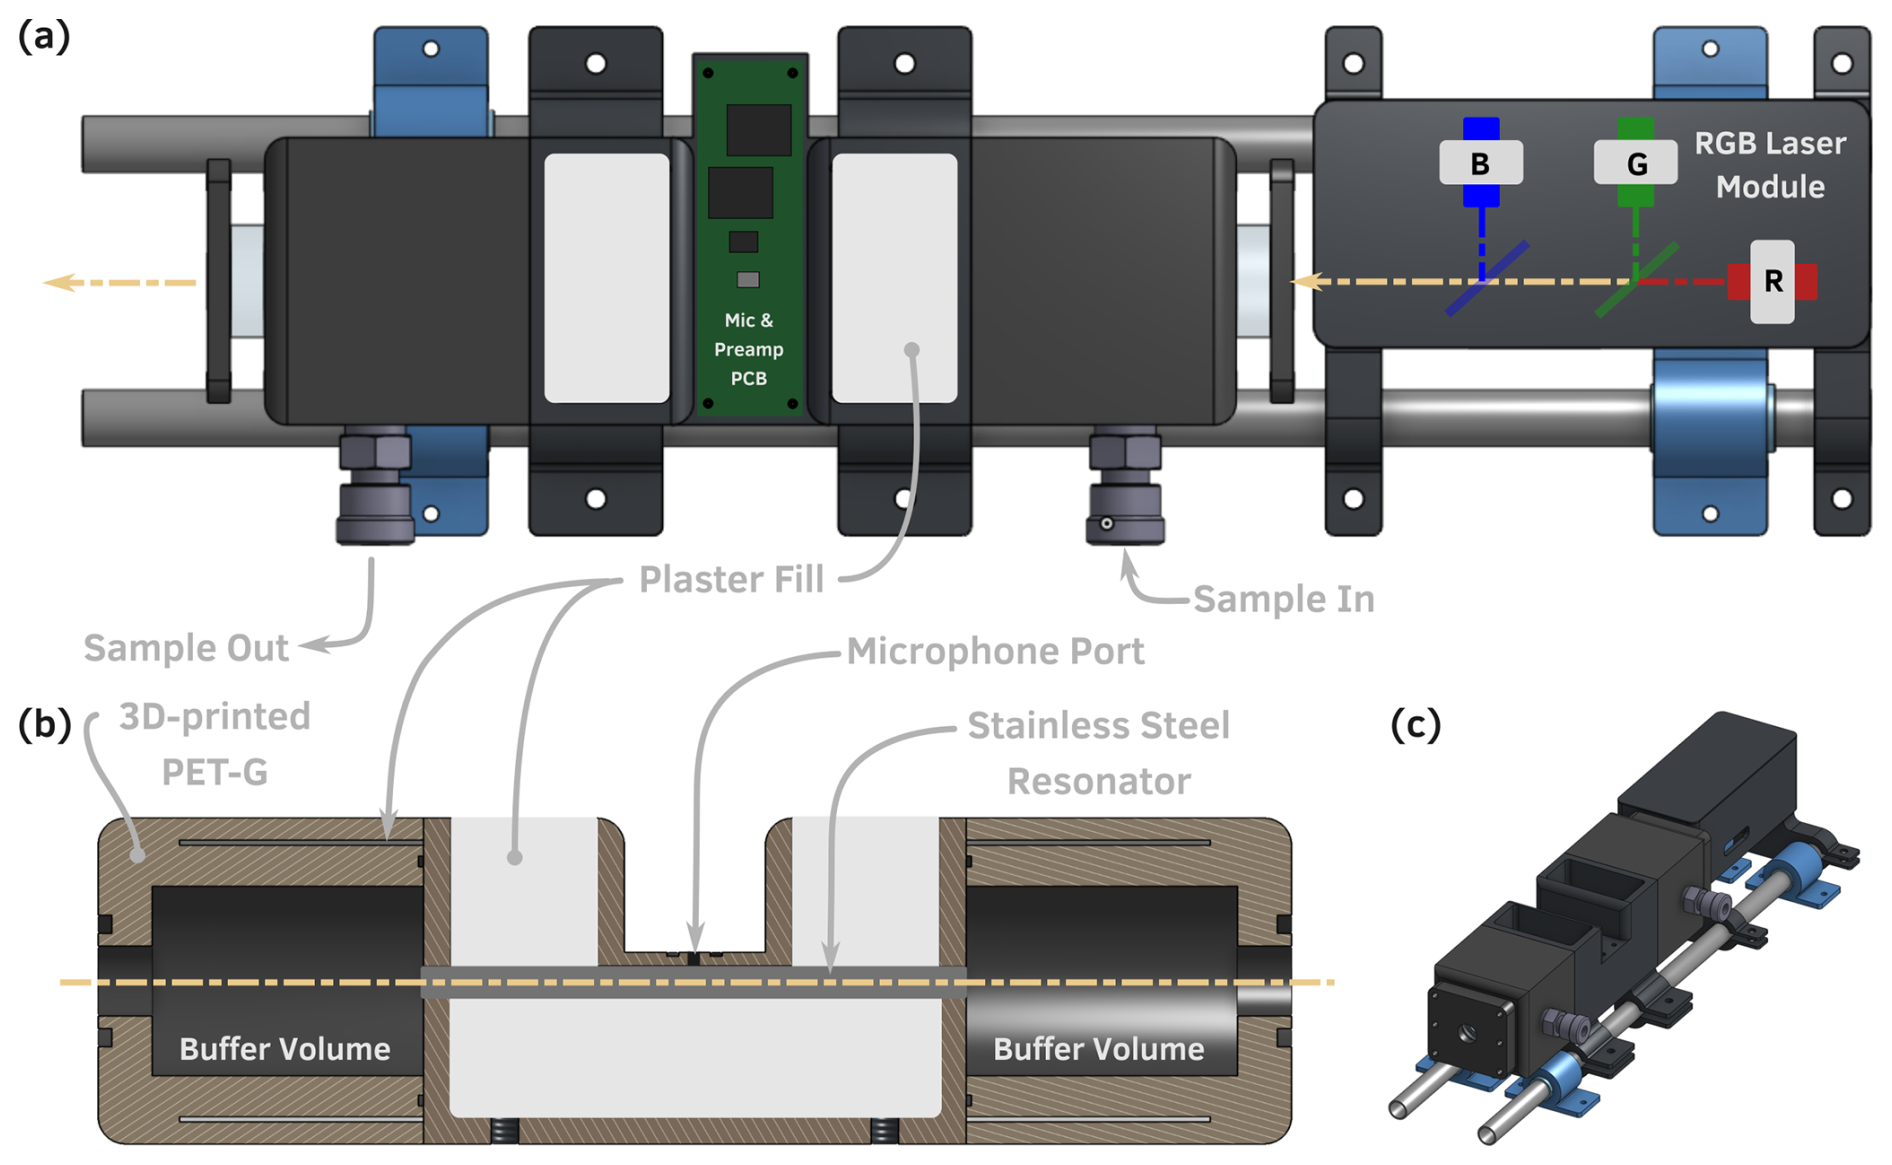
Figure 2Hardware components of the SiMPLE-PAS. (a) Top view of the SiMPLE-PAS. (b) Cross-section (side view) of the PAS cell showing the internal cell geometry, including plastic shell, infill areas that are filled with calcium sulfate, and the stainless steel resonator tube. (c) Isometric view of the SiMPLE-PAS (infill regions shown as empty). All components are mounted on a carbon fiber rail system that screws into a rugged case via acoustic isolation mounts. Photos of the laser module, PAS, and filling process are given in the Supplement.
Here, we have developed solutions to each of these problems. Figures 2 and S2–S3 show 3D CAD models and photos of the hardware that composes the PAS cell, which is printed in three pieces: (1) the central resonator and (2 and 3) the two buffer volumes, which are identical to each other. As shown in the cross-section in Fig. 2c and in the photos in Fig. S3, each part is printed as a plastic shell that defines the overall geometry of the cell, but the majority of each part is empty space. To help facilitate a sealed part, we add additional perimeter layers, use a higher infill of 50 %, and set the 3D printer to over extrude each layer slightly. Then, during the first step of assembly, we coat all parts with a spray-on acrylic coating (Minwax Polycrylic) to fill any voids left between layers of the 3D print. We note that there are commercial products designed to coat 3D prints and make them gas-tight (e.g., Dichtol by Diamant Polymer Solutions), but we were unable to procure these products in the United States during this study. We instead chose a widely available, low-cost consumer product. For the buffer volumes, we fill the empty space designed into the parts with a slurry of calcium sulfate in water, which we allow to harden for several days. We do the same for the main resonator part, but we first press a stainless steel tube of the desired length and diameter for the resonator into the 3D-printed part; we use 305 stainless steel six-gauge thin-walled hypodermic tubing (5.2 mm O.D., 4.6 mm I.D.) for this and wet sand the inside to a near-mirror finish prior installation. The purpose of this tube is to (1) provide a smooth surface with a clearly defined diameter for the resonator, which improves Q; (2) provide a metal surface to minimize particle wall loss in the resonator; and (3) provide a fully sealed surface inside the resonator to minimize leaks. After being pressed in, the joints where the tubing meets the plastic part are sealed with cyanoacrylate adhesive (Maxi-Cure, Bob Smith Industries, Inc; we note epoxy could also be used if needed). Once cured, the paster infill provides a dense, solid part that is more resistant to interference from external sounds. Calcium sulfate was chosen because it is low-cost; widely available; and, once cured, has a density similar to that of aluminum, the material from which many PAS cells in the literature are machined. After the curing, the plastic inlet and outlet holes on the buffer volumes are tapped with a in. NPT (11.07 mm nominal diameter) tap, and a corresponding fitting is installed (e.g., in. NPT PrestoConnect or Swagelok) using PTFE tape to create a removable seal between the fitting and the plastic part; it is important to tap the holes after filling with plaster to avoid splitting the part along layers of the 3D print. Finally, the buffer volumes are affixed to the main resonator with cyanoacrylate adhesive, using a gluing groove that is designed in the parts, and a 1 mm diameter hole is drilled into the center of the main resonator, where the microphone will be installed. The cell is capped on either end with 25 mm diameter by 5 mm thick AR-coated flat N-BK7 windows mounted on an o-ring (Thor Labs, WG11050-AB), although we note that those looking to reduce cost further could use a cheaper option here. A 3D-printed plate holds the window in place and is mounted on the end of the cell via M3-threaded metal inserts that are heat set into the plastic cell body. Two in.-20 (or M6) screws are set into the bottom of the cell to allow mounting to standard optical posts.
The PAS cell and laser module (described below) are mounted on two 12.2 mm diameter carbon fiber rods using 3D-printed mounts. Carbon fiber was chosen for its low thermal expansion and light weight; each rod costs roughly USD 25, and so those wishing to reduce costs could likely replace these rods with, with, e.g., similarly sized PVC pipe. The carbon fiber rods are held on each end by acoustic isolation mounts (HoldRite no. 1414509), which fasten the rods to the PAS case while isolating the PAS from external sounds and vibrations. The isolation mounts are screwed directly into metal-threaded inserts that are heat set into a hard plastic case. The case serves to protect the PAS from dust and physical damage, protect users from exposure to laser radiation, facilitate portability, and shield the PAS from external sounds. The inside of the case is lined with felt to provide additional sound dampening. When fully assembled, the PAS has outer dimensions of 0.5 m × 0.4 m × 0.2 m and a weight of roughly 5 kg.
As noted above, it is imperative to leak test the PAS prior to use. We leak test each cell in two ways. First, we flow nitrogen through the cell at roughly 300 sccm (the typical operating flow of the PAS) and measure the flow in and flow out. Any loss greater than several sccm is considered to be a failing leak test. Second, we seal the outlet of the PAS and pressurize the cell to 10 psig with nitrogen and then submerge it in water. Any bubbles that form are a sign of a failing leak test and may be further useful in pinpointing the location of the leak. Any cell that fails the leak test is not used and is either discarded or re-coated/re-glued until it passes. We then ensure not to exceed 10 psig pressure in the cell during operation.
2.1.2 Laser module
The PAS resonator is illuminated with a low-cost RGB laser module (Fig. S1) that is designed as a replacement module for laser projectors used in laser light shows. The module includes a control board that allows independent modulation of each laser. These modules cost roughly USD 25 from online vendors (e.g., eBay, Amazon, Alibaba) at the time of this writing and are sold generically as “500 mW RGB Laser Modules”. They consist of three individual diode lasers and use dichroic mirrors to make the beams, which are pre-aligned at the factory, collinear. Because these modules are commodity/consumer products, little information is given about the laser specifications, but our measurements indicate wavelengths of 450, 515, and 665 nm (Fig. S1) with powers of 140, 32, and 100 mW, respectively. We enclose the module in a 3D-printed enclosure to protect the optics from dust and other damage. The lasers are modulated at three distinct frequencies near the resonant frequency of the cell using the PWM (pulse width modulation) output of a Raspberry Pi Pico 2 with a 50 % duty cycle. This allows the signals for each wavelength to be demodulated using a fast Fourier transform during data acquisition. Although the lasers specify a 24 VAC supply voltage, examination of the included control board reveals that the 24 VAC is immediately passed through a bridge rectifier, and we surmise that the lasers run on DC and that the 24 VAC supply is recommended because laser projectors may already have a 24 VAC supply built in. Therefore, we choose to power them with a 12 VDC power supply and thereby eliminate the need for a separate 24 VAC source. When using a 50 % duty cycle at 12 VDC, the entire module draws roughly 150 mA, consuming just under 2 W.
The Raspberry Pi Pico 2 used to control the lasers costs roughly USD 5 and is based around the RP2350 chip, which provides 12 PWM generators with 12-bit resolution on the duty cycle. We use three of the PWM channels to modulate the lasers at a 50 % duty cycle at three separate frequencies, such that the signal for each wavelength appears in an FFT at a distinct frequency. Specifically, the green laser is modulated at the resonant frequency of the cell (i.e., ), the blue laser is modulated at Hz, and the red laser is modulated at Hz. It was experimentally determined that spacing closer than 6 Hz led to cross-talk between the signals for each color and increased noise. The laser controller runs custom firmware written in Python that allows the user to set the modulation frequency and turn the lasers on and off via a serial connection.
2.1.3 Preamplifier design
The detector in the PAS is a low-cost, high-sensitivity microphone, which produces a signal that requires amplification prior to digitization. For cost savings and clean integration in the PAS design, we developed our own preamplifier board for the SiMPLE-PAS. Although other groups have presented low-cost electronics for PAS, these electronics were based on lock-in detection of a single wavelength and are thus unsuitable for the multi-wavelength instrument here (Keeratirawee et al., 2022). Figure 3 shows the preamplifier circuit designed for the SiMPLE-PAS. The microphone is a bottom-ported, surface-mount (SMD) microphone (TDK ICS-40730), similar to that used by Kapp et al. (2019). The microphone is held on a custom printed circuit board (PCB) that mounts directly onto the PAS cell via four M2 threaded-metal heatset inserts. A seal is formed between the cell and PCB around the microphone port with an o-ring, with care being taken to avoid any vias or other through-holes within the sealing area of the PCB. The microphone has a nominal sensitivity of −32 dB (1 kHz, 94 dB sound pressure level) and a signal-to-noise ratio of 74 dBA (20 Hz to 20 kHz, A weighted) when operated in differential mode (as is done here), yielding a noise floor of −106 dBV. The differential output from the microphone is sent to a passive, differential high-pass filter with a cutoff frequency (fc) of 1000 Hz to remove low-frequency noise from the signals. The filtered differential signals are fed to a variable-gain instrumentation amplifier, which serves to cancel common mode noise while amplifying the signal to a user-variable gain. The instrumentation amplifier converts the differential signal into a single-ended signal, which is sent to an active high-pass Sallen–Key filter. That output is buffered prior to entering an active low-pass Sallen–Key filter. The two active filters are designed with a gain of 2.25 to yield a relatively high Q of 1.3, such that they amplify signal at the resonant frequency of the cell while attenuating signals at other frequencies, as shown in the simulation results in Fig. S5. Finally, the filtered signal is sent to an inverting amplifier, which we typically set to unity gain but could be arranged to produce additional gain if desired. The output of the preamp board is AC-coupled to allow easy interfacing with off-the-shelf audio components. The instrumentation amplifier is implemented via a dedicated instrumentation amplifier integrated circuit (IC, Texas Instruments INA118) in conjunction with a 5 kΩ potentiometer that functions as the gain resistor, RG. The Sallen–Key filters and buffer and/or inverting amplifiers are implemented using two dual low-noise, low-power precision op-amp ICs (Texas Instruments MCP6292). All components are held on a custom PCB, which was manufactured by JLCPCB. The preamp requires both a positive and negative supply; since the microphone has an upper supply voltage limit of 3.6 V, we use rail voltages of +3.3 and −3.3 V. For the data presented herein, these voltages are supplied with two standard benchtop linear DC power supplies (Rigol DP711), although we have since switched to cheaper original equipment manufacturer (OEM) power supplies with no apparent degradation of performance; for this reason, along with the fact that many labs may already have bench supplies on hand, the Rigol power supplies are not included in the cost estimate for the SiMPLE-PAS.
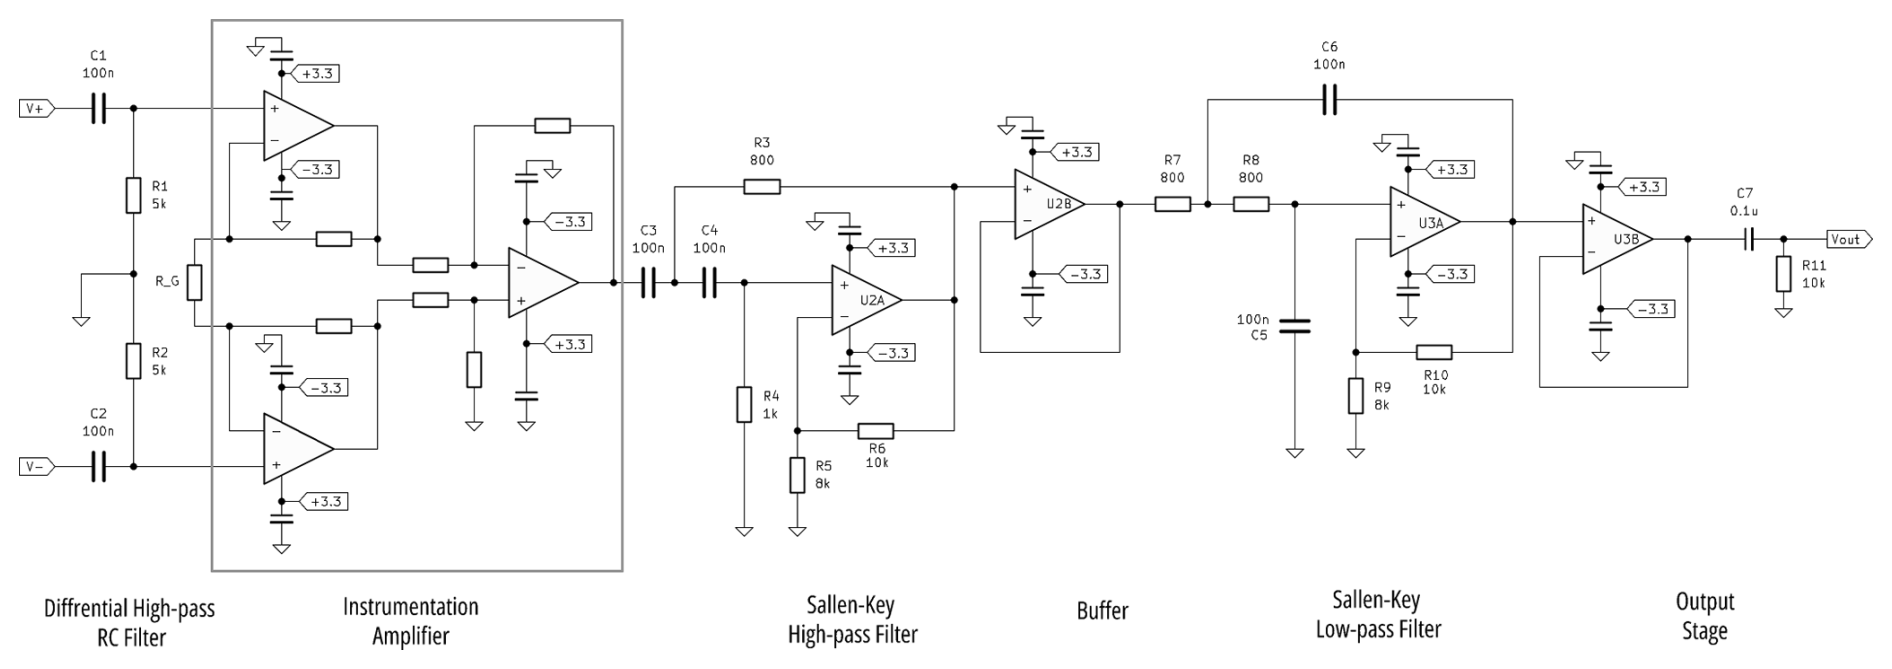
Figure 3Equivalent schematic for the SiMPLE-PAS preamplifier. The differential output from the microphone is represented by V+ and V− in the schematic. The instrumentation amplifier is implemented using a dedicated instrumentation amplifier IC, with only RG being supplied externally to the IC. U2 and U3 are dual op-amp ICs, such that the four op-amps for the filters and buffers require two ICs. The simulated output for the circuit is provided in the Supplement.
2.1.4 Data acquisition and software
The output from the preamplifier is digitized at 48 kHz using a 24-bit USB sound card (World Star Tech), similarly to Fischer and Smith (2018a). The sound card collects a 1 s waveform, which is then sent to a PC running a custom data acquisition program written in the language Julia (v 1.11) (Bezanson et al., 2017). The program intakes the 1 s waveform and performs an FFT on the data using the FFTW.jl library (v1.9.0). The software then extracts the magnitude of the signal at each of the laser frequencies and saves each magnitude in a CSV file with a corresponding timestamp. It is necessary to integrate for 1 s to achieve 1 Hz resolution in the FFT, which is desired for deconvolution of the three closely spaced laser frequencies. The FFT itself and data processing and saving take an additional ∼ 200 ms, leading to a total duty cycle of roughly 1.2 s; because this can vary from point to point based on what other tasks the processor is completing at any given moment, we throttle the program to a duty cycle of 2 s to maintain a consistent sampling rate of 0.5 Hz.
Although the program can be run from the command line, we use the Julia packages Pluto and PlutoUI to create a basic graphical user interface (GUI) for the SiMPLE-PAS. Pluto is a notebook environment developed specifically for Julia. It differs from other notebook environments (e.g., Jupyter) in that notebooks created with Pluto are reactive – that is, the notebook tracks execution order (such that the top-to-bottom order that code is written in does not matter), and the entire notebook updates automatically each time the user changes a variable; PlutoUI is an additional package that provides input and/or UI widgets such as buttons, sliders, and file pickers that can be used to trigger code execution (van der Plas et al., 2025). Although, as far as we can tell, Pluto was developed as a tool to teach programming and share data analysis files in an interactive format, the features mentioned above allow for the creation of basic instrument GUIs. With the available widgets, order-agnostic code, and Pluto's ability to break sections of the notebook up into “slides”, it is possible to create a “front-panel” slide with user controls and data plots and a “back-end” slide that contains the code to be executed, similar in fashion to LabVIEW's front-panel and block diagram Virtual Instrument structure. We chose to use Pluto because it requires minimal programming knowledge and handles UI creation for the user, such that it is relatively accessible to scientists who may not have extensive experience programming GUIs. Thus, although we note that Pluto is very limited as a GUI tool, we suggest that its simplicity and ease of use could make it useful as an open-source replacement for LabVIEW in the limited set of circumstances where only a simple GUI is needed (such is the case here), especially if continued development targets this application. A screenshot of the GUI can be found in Fig. S4. To the best of our knowledge, this is the first example of an instrument GUI created using Pluto.
2.2 Resonant-frequency determination
Before a measurement is made using PAS, the resonant frequency fr of the sample cell must be measured. We measure the resonant frequency prior to calibration, prior to the start of any measurement cycle, and whenever changing gas composition (e.g., nitrogen bath gas to oxygen bath gas or nitrogen bath gas to air bath gas). Typically, groups have either (1) scanned the laser frequency around the expected frequency or (2) introduced white noise or a very fast frequency chirp into the sample cell using an integrated speaker (e.g., Lack et al., 2006; Fischer and Smith, 2018a). In the first case, the sweep may take 5 min to do the minimum number of frequencies required to determine the resonant frequency and many minutes or hours to perform a sweep of the full frequency space of the cell. The second option is quicker but requires additional hardware and software functionality and requires an additional port in the PAS cell through which the sound can be introduced, which may degrade the quality factor of the resonator.
For the SiMPLE-PAS, we desired a quick and repeatable method of measuring the resonant frequency that did not add to the bill-of-materials cost of the PAS and that did not require additional ports in the narrow PAS resonator. We therefore developed a novel third approach to measure fr that is very fast like the chirp method but eliminates the need for extra hardware and extra ports in the sample cell. To measure the resonant frequency of the SiMPLE-PAS, we increase the gas flow from the nominal 300 sccm to roughly 1000 sccm. The higher flow rate leads to turbulent flow in the PAS, which creates broad-spectrum acoustic noise inside the sample cell. Sound at the resonant frequency of the cell will be amplified, leading to a peak at fr in the FFT (similar to blowing air across a pipe or bottle). With the flow rate increased, we collect eight waveforms and co-add the frequency spectra from the FFT of each waveform. The resulting spectrum is smoothed with a rolling average, and then fr is determined by fitting a Gaussian to the resonant peak using partial least-squares regression, wherein the center of the Gaussian represents fr . This approach is fast (approximately 10 s for a full frequency spectrum) and does not require additional hardware or ports. It can be performed manually, e.g., by adjusting a rotameter or swapping in a different orifice, or may be automated by, e.g., using a software-controlled mass flow controller. To the best of our knowledge, this is the first time this approach has been described.
2.3 Calibration
Multiple methods of calibrating aerosol PAS instruments have been discussed in the literature, with the most common being calibration to mixtures of NO2 or O3 or calibration with an absorbing aerosol such as nigrosin or Regal Black (e.g., Lack et al., 2006; Zhang et al., 2016; Fischer and Smith, 2018b; Davies et al., 2018; Yu et al., 2019; Schnaiter et al., 2023). For gases, these mixtures may be standard mixtures of known concentration, from which the absorption coefficient can be calculated, or they may be measured directly using cavity ringdown spectroscopy (CRDS) or UV–visible spectroscopy; for aerosols, it is necessary to know the size distribution, number density, and refractive index of the aerosol being measured. Therefore, gas-phase measurements are generally simpler. To minimize error, it is desirable to measure the absorption coefficient at levels directly relevant to aerosol measurements, which CRDS is capable of; CRDS is also, notably, a calibration-free method, assuming the relative ringdown times can be measured accurately (Fischer and Smith, 2018b; Wada and Orr-Ewing, 2005). Thus, our preferred calibration method for the SiMPLE-PAS is to calibrate with NO2 against a cavity ringdown spectrometer (CRDS), although we note a standard mixture of NO2 or an ozone generator could be used in labs where CRDS is not available. During laboratory experiments (ozone measurements, Allan or standard deviation analysis) we calibrated using a mixture of NO2 in N2 and measured the absorption coefficient of the mixture using CRDS. Briefly, the lab-built CRDS is composed of a 26 cm optical cavity bound on either end by a low-loss plano-concave cavity ringdown mirror (R=0.99993, 25 cm R.O.C., 25 mm diameter; FiveNine Optics). A 446 nm diode laser (Coherent OBIS 445LX, 75 mW) is passed through an optical isolator (Thor Labs) and coupled into the cavity, and an avalanche photodiode (Thor Labs APD130A) is used to detect light leaking through the back mirror. A USB oscilloscope (Pico Technology PicoScope 2000) is used to digitize the signal and is sent to a custom data acquisition program written in Julia/Pluto, which collects 16 ringdown events per second, fits each, and records the average; data were acquired at 0.2 Hz to match the sampling rate of the PAS. A purge of 11.5 sccm nitrogen was maintained over each mirror during NO2 measurements using a critical orifice (Lenox Laser) to limit the flow.
During calibration, a 50 ppm mixture of NO2 in N2 (Airgas) was diluted with additional N2 from a nitrogen generator (Vici DBS Whisper 0–120). Nitrogen flows were controlled by a mass flow controller (Alicat Scientific) and held at 3300 sccm, while NO2 flows were varied using a needle valve in the range of 1–20 sccm. The two flows were combined using a stainless steel T and allowed to mix in a 1 m length of in. O.D. PTFE tubing. After mixing, 300 sccm of the mixture was split to the PAS, while the remainder was sent to waste. The mixture passed through the PAS and was fed to the CRDS using a half-meter length of PTFE tubing, where it was diluted by the nitrogen purge flow on the front cavity mirror, supplied by the same nitrogen generator used for dilution. At the beginning of the calibration, a higher concentration (approximately 25 ppm) of NO2 was flowed through the experimental apparatus for several minutes to passivate all surfaces. Then, the NO2 flow was reduced to approximately 20 sccm for the first measurement and then was reduced successively until (typically) five concentrations were measured. Each concentration was measured for approximately 10 min. The ringdown time measured by the CRDS was converted into the absorption coefficient for the mixture babs–446, which was used to calculate the absorption coefficient for each PAS wavelength using the ratio of the absorption cross-sections at each wavelength (Bogumil et al., 2003). All measurements are reported as 2 min averages.
2.4 Ozone measurements
To verify the accuracy of the PAS, we measured absorption by ozone and compared the PAS values to those measured by the 446 nm CRDS described above and to literature values. A corona discharge ozone generator (Longevity Resources) was supplied with 99.999 % O2 (Airgas) at a rate of 2 standard liters per minute (slpm), and the ozone concentration was varied with the three lowest output settings of the generator, corresponding to the maximum we could measure without saturating the PAS DAQ card. The 2 slpm stream of O3+O2 exiting the generator was split via a stainless steel T, with 300 sccm entering the PAS via PTFE tubing and the remainder going to waste. The gas stream exiting the PAS was sent to the CRDS via a 0.5 m length of PTFE tubing; no purge flow was used in the CRDS for ozone experiments. Prior to measurements, we calibrated the SiMPLE-PAS with NO2 as described above. We then re-measured the resonant frequency of the cell after purging with oxygen for approximately 5 min, and we observed that the resonant frequency decreased by approximately 100 Hz, consistently with theoretical expectations for pure oxygen. After measuring the resonant frequency, we flooded the cell with a high concentration of ozone for several minutes to passivate all surfaces before lowering the concentration to the third lowest setting on the generator and beginning measurements and subsequently decreasing the concentration for successive measurements. Oxygen was chosen as the diluent to eliminate error associated with photodissociation of oxygen and inefficient energy transfer to the bath gas. The use of oxygen (or air) as the bath gas has been shown to effectively eliminate this error (Fischer and Smith, 2018b; Davies et al., 2018; Cotterell et al., 2019, 2021). We verified this by cycling each wavelength on and off and by looking for changes in the other wavelengths, as described by Fischer and Smith (2018b), and saw no detectable differences. Again, all measurements are reported as 2 min averages.
2.5 Limits of detection
To determine the limit of detection for the SiMPLE-PAS, the cell was purged with 300 sccm dry, filtered nitrogen, which was supplied by a nitrogen generator (Vici DBS Whisper 0–120) through a flow-limiting orifice. The PAS was turned on and allowed to warm up with a nitrogen purge overnight prior to data collection. After warm up, the signal for each wavelength was recorded for a period of 72 h (3 d). The data were mean centered and divided by the sensitivity coefficient (“calibration constant”) for each wavelength to convert the data into units of Mm−1. The data were then treated in two separate ways to estimate the limit of detection for the SiMPLE-PAS: (1) the absorption coefficient values were used to compute the Allan deviation for the dataset, and (2) the data were averaged in 2 min and 10 min bins, and drift was removed from the data, treating every 15th (for 2 min data) or 3rd (for 10 min data) data point as a background and subtracting it from the following 14 or 2 points, respectively, and the standard deviation was computed for the entire dataset.
2.6 GWISE-2 campaign
As an initial test of instrument performance and as a demonstration of the ability to measure aerosols, the SiMPLE-PAS was deployed to the second Georgia Wildland Fire Simulation Experiment (G-WISE 2) laboratory campaign at the USDA Forest Service Prescribed Fire Science Laboratory (USDA Forest Service Southern Research Station, Athens, GA, United States) in April 2025. This experiment was a follow up to the first G-WISE campaign, and the experiments and results will be described in detail in forthcoming publications (Saleh and O'Brien, 2025). The goal here is merely to compare the SiMPLE-PAS performance with that of other aerosol absorption instruments at G-WISE 2, namely the MultiPAS-IV, and not to draw scientific conclusions about the samples studied or to describe the scientific basis for the experiments. Briefly, fuel bed mixtures representative of the southeastern United States were prepared by the US Forest Service and placed in a 1 m × 1 m square in a sealed indoor burn room. The samples, which were composed of various compositions of pine needles, broadleaf leaves, duff, and wood, were ignited and allowed to burn to completion such that the burn room contained all of the smoke from the burned organic matter. A copper sample line was placed directly in the burn room and, for the data presented here, pumped into the MultiPAS-IV and SiMPLE-PAS on a shared sample line without dilution. Two homemade thermodenuders were available to remove organics from the aerosols, with one set to 100 °C and one set to 300 °C. Since the CRD was not available during G-WISE 2, we instead calibrated against a portable corona discharge ozone generator prior to the start of sampling, which itself was calibrated against a CRDS instrument after the campaign. The ozone calibration procedure is similar to that described below for validation below. The MultiPAS-IV was calibrated as described elsewhere (Fischer and Smith, 2018a).
Because the sample was composed of both BrC and BC, we determine the overall spectrum by first using the point at 665 nm to determine the BC component and then use a line matching the residual to determine the BrC component. The BC component is assumed to have an AAE of 1.0, and we calculate the BC absorption coefficient (bBC) at each wavelength (λ) from 400 to 800 nm (Moosmüller et al., 2011; Bond and Bergstrom, 2006):
We then calculate the AAE for BrC (AAEBrC), from the residual at the blue and green wavelengths:
We use AAEBrC to calculate the absorption coefficient of BrC (bBrC) at each wavelength from 400 to 800 nm, and then we calculate the final aerosol spectrum assuming :
In this section, we present the results of our measurements and compare to the values for similar instruments that have been published in the literature and theoretical expectations. These results include a comparison of the measured resonant frequency to the expected frequency using our new method, a discussion of the results of the PAS calibration to NO2, an analysis of accuracy via discussion of ozone measurements, and discussion of detection limits from both Allan deviation and standard deviation, as well as an intercomparison of aerosol measurements and the brown-carbon AAE made with the SiMPLE-PAS and the co-located MultiPAS-IV instrument (Fischer and Smith, 2018a).
3.1 Measurement of the resonant frequency
A typical frequency spectrum and fit from this approach is presented in Fig. S5. The spectrum shown here was acquired in dry nitrogen at 22 °C, and we measured a resonant frequency of fr=1609 Hz. The nominal length of the SiMPLE-PAS resonator is 100 mm, and the resonator used in this work was measured as 101 mm, not including the end correction (ΔL), which increases the effective length of the resonator. Although it has been typical to consider a PAS resonator to be an open- or closed-tube resonator and to apply an end correction of ΔL=0.6r, where r is the radius of the cell (Miklós et al., 2001), we argue that the end of the SiMPLE-PAS resonator is more similar to a flanged opening than an open tube. We therefore apply an end correction of on each end of the resonator, giving an effective length of mm. Assuming a speed of sound of 350 m s−1 for nitrogen, we calculate an expected resonant frequency of fr≈1660 Hz. This is higher than the measured value of 1609 Hz and would correspond to an effective resonator length of approximately 108 mm. We have also measured the resonant frequency in O2 and obtained a valued of 1514 Hz, which, again, is lower than the expected value of 1560 Hz. The measured value (1514 Hz) again corresponds to an effective resonator length of 108 mm. We hypothesize that the difference could be due to either non-ideal resonator behavior resulting from the buffer volumes. This could potentially be minimized by increasing the diameter of the buffer volumes, which would more effectively simulate open end conditions for the central resonator, although we have not tested this. However, we note that this error does not affect the accuracy of absorption measurements.
3.2 Calibration
Figure 4 shows the calibration curve for each wavelength, with points representing 2 min averages of measurements for a single concentration of NO2. All wavelengths were measured simultaneously, which caused a very high signal at the blue wavelength and a very low signal at the red wavelength due to differences in the absorption cross-section at each wavelength. This highlights the dynamic range of the PAS, which can measure from several Mm−1 up to over 1500 Mm−1. Typically, the slope of a PAS calibration curve represents the cell constant of the PAS, such that the same slope should be measured for all wavelengths, assuming the signal has been normalized to incident power. Here, we choose to prepare separate curves for each wavelength instead of normalizing the power and thereby eliminate the cost of a power meter from the PAS design. Therefore, here, the slope of each curve represents the P0×Ccell (Eq. 1). We observe a similar sensitivity for the green and red channels, but we see a sensitivity that is about 3 times lower for the green channel, which can be attributed to the lower power output from the green laser, which operates at about one-third of the power of the other two lasers. The points in Fig. 4 represent 2 min averages of both the PAS and CRD measurements, with y-error bars representing the propagated error for each instrument, as described in the Supplement. Although we typically measure only five concentrations during calibration, we show seven here to span a larger range and to highlight the ability of the PAS to measure values near the lower limit of detection (discussed further below). The data in Fig. 4 also demonstrate excellent precision, with R2=0.9999 or greater for the blue and green wavelengths and 0.9979 for the red. The reduced precision for the red is due to the inclusion of three points close to the detection limit of the SiMPLE-PAS, which we would not typically measure in a normal calibration. When these points are excluded from the calibration, we find R2>0.9999.
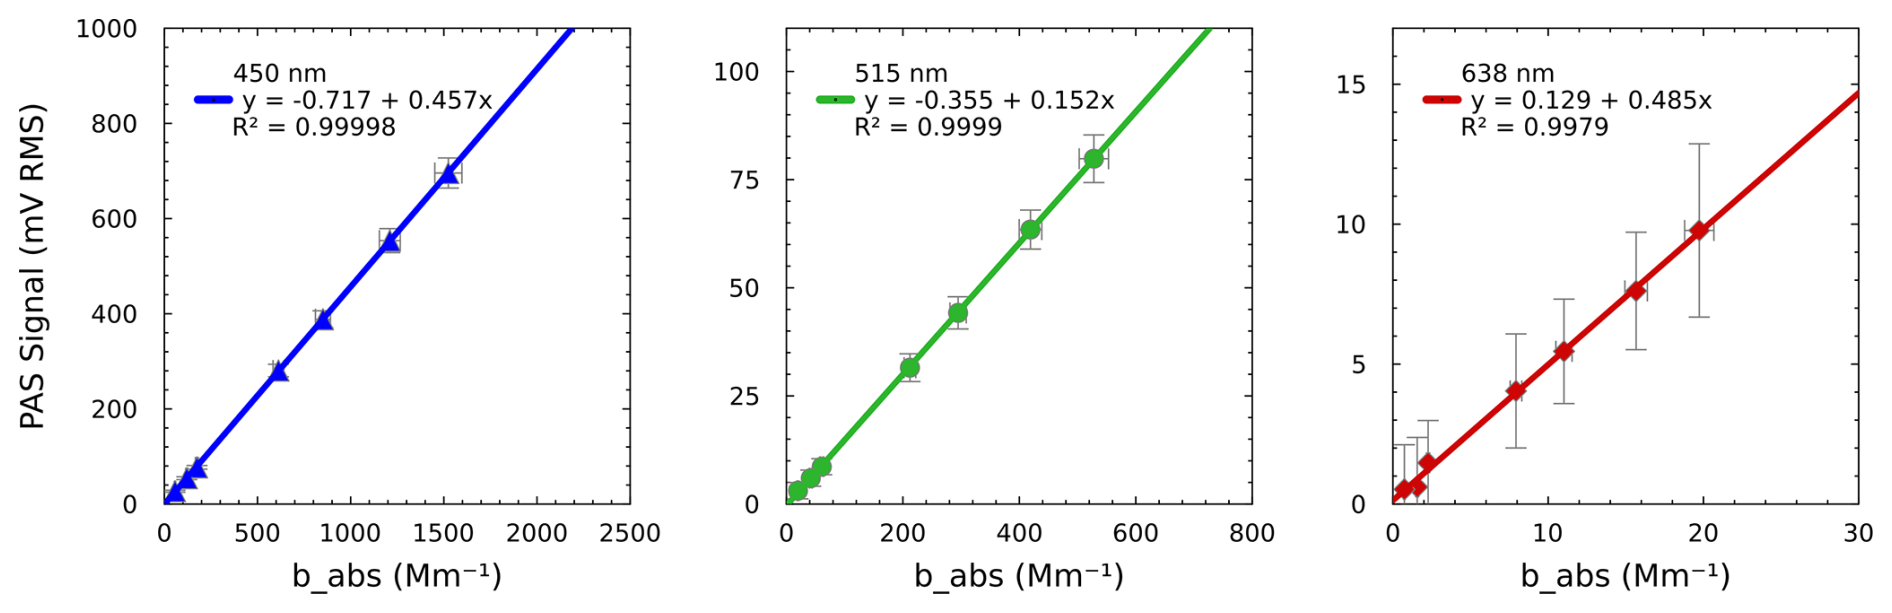
Figure 4Calibration of the SiMPLE-PAS. Points represent 2 min average measurements of NO2, and errors bars for y show 1 standard deviation of the PAS signal and the background propagated with the uncertainty of the ratios of the NO2 absorption cross-sections at each wavelength (λPAS/446 nm), and error bars for x are 1 standard deviation of the CRDS signal propagated with the uncertainty of flow rates and RL for 2 min averages (x). The points from 0 to 2 Mm−1 for the red channel highlight the 2 min limit of detection for the SiMPLE-PAS, which is 1.0 Mm−1 for the red channel. A zoomed-in version of the plots showing low absorbance values is provided in the Fig. S8.
3.3 Ozone measurements
Figure 5 shows the results of the ozone experiment. The data are plotted with 2 min averages of the PAS-measured values on the y axis ,and the CRDS values at 446 nm are plotted on the x axis (note that data from the blue PAS channel have been multiplied by 5 for clarity on the plot). When plotted this way, the slope of the line of best fit represents the ratio of the absorption cross-sections at each PAS wavelength vs. the value for 446 nm (i.e., , where if N is the number density of ozone). The solid lines in Fig. 5 represent the line of best fit, while the dashed lines represent the lines expected based on literature values. For comparison, we show the values of Bogumil et al. (2003) (for 293 K) and the NASA Jet Propulsion Laboratory (JPL) recommendation (for 293–298 K) from their 2020 report on photochemical data for atmospheric studies (Burkholder et al., 2020). Since the data of Bogumil et al. (2003) are of a higher resolution than the linewidth of our lasers, we take the average over the emission peak for each of the SiMPLE-PAS/CRDS lasers and report that in the plot in Fig. 5. The JPL recommendations are provided at a lower resolution than that of our lasers, and so we report the value closest to each of the SiMPLE-PAS/CRDS wavelengths. The error bars in Fig. 5 are described in the Supplement and encompass the uncertainty from the calibration with NO2 and indeterminate error in the ozone measurements. We measure values of 1.2±0.8, 10.2±3.6, and 12.0±1.2 for , where λ=450, 515, and 665 nm, respectively, and errors represent the 95 % confidence interval of the slope. We find no significant differences between the values of Burkholder et al. (2020) and the SiMPLE-PAS data at the α=0.05 confidence level and further find that the errors of individual points overlap with both literature sources. We therefore conclude that the SiMPLE-PAS calibration is accurate with the precision of the instrument and the uncertainty in literature values. We further note the implication of no (or at least minimal) loss of ozone and/or NO2 to the plastic cell walls, which was a hypothetical concern when developing the SiMPLE-PAS. We again see high R2 values, ranging from 0.997 to > 0.999 depending on wavelength, that highlight the precision and linearity of the SiMPLE-PAS.
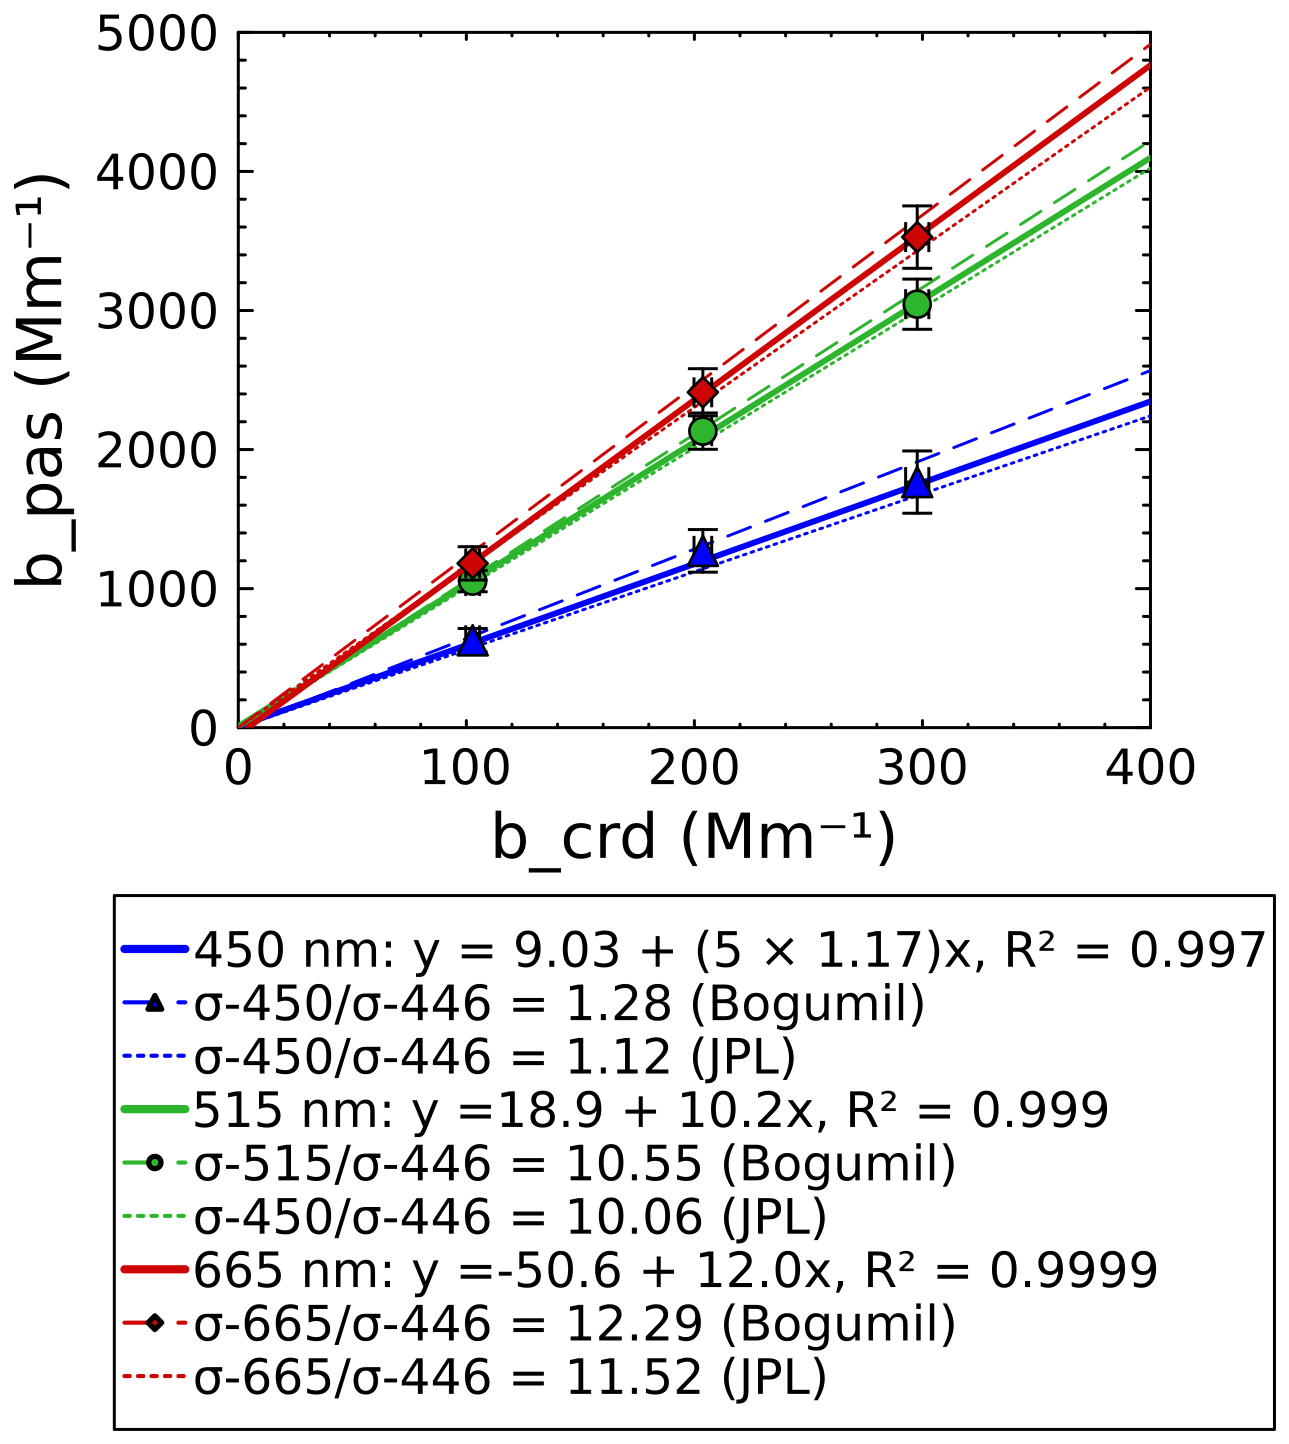
Figure 5Validation with ozone showing the ozone absorption coefficient measured by PAS at each wavelength (abscissa) vs. the ozone absorption cross-section measured at 446 nm using CRDS (ordinate). The slope of each solid line represents the ratio of as measured by PAS and CRDS, while dashed lines represent the expected ratio from literature values. Points represent 2 min average measurements of a single ozone concentration, and error bars represent the propagated uncertainties for the analysis and are discussed in the Supplement. PAS values for the blue channel have been multiplied by 5 for clarity on the plot.
3.4 Limits of detection
As discussed elsewhere, the Allan deviation provides an estimate of the instrument's ultimate detection limit (Giglio et al., 2016). Figure 6a shows the results of our Allan deviation analysis for the SiMPLE-PAS, which look typical for the Allan deviation. The Allan deviation is similar to the standard deviation but isolates the effects of random noise and long-term drift, while standard deviation does not (Langridge et al., 2008). The x axis in Fig. 6a represents different averaging times, τ, and the y axis shows the Allan deviation for each averaging time. The left portion of each trace shows a negative slope, which represents increased precision due to cancellation of random noise as averaging time is increased. The right portion of each trace exhibits a positive slope, which represents the decrease in precision associated with long-term instrument drift. The x value corresponding to the minimum deviation for each trace represents the optimum averaging time for that wavelength, with longer times representing a more stable instrument, while the y value represents the detection limit expected at that averaging time. Here, we observe good stability at all wavelengths, with the blue and green wavelengths reaching a minimum deviation at averaging times of approximately 1110 and 1180 s, respectively, while the red exhibits lower stability with an optimum averaging time of approximately 680 s; it is unknown why the red wavelength is less stable. The stability of the SiMPLE-PAS is therefore very competitive when compared to other PAS instruments. For example, Fischer and Smith (2018a) show inflection points at near 1000 s for the four channels of their MultiPAS-IV multi-pass, four-wavelength laser PAS; Schnaiter et al. (2023) show turn over points between 2000 and 3000 s for their single-pass, four-wavelength laser PAS; Kapp et al. (2019) show an optimum averaging time of approximately 1000 s for their single-wavelength LED PAS; and Cui et al. (2025) show a relative short optimum averaging time of 48 s for their 3D-printed PAS. Likewise, the ultimate detection limits deduced from Allan deviation for the SiMPLE-PAS are very competitive compared to other PAS instruments. We observe detection limits of 0.15, 0.50, and 0.17 Mm−1 at 450, 515, and 665 nm, respectively. Fischer and Smith (2018a) show Allan-deviation-based detection limits 0.05 to 0.1 Mm−1. Notably, their instrument uses a multi-pass cell to increase sensitivity and thereby achieve lower detection limits, although, here, we show similar numbers for the single-pass SiMPLE-PAS, which we attribute to the smaller cell diameter of the SiMPLE-PAS (per Eq. 2). This is in agreement with the work of Schnaiter et al. (2023), who report an ultimate detection limit of 0.09 Mm−1 for their four-wavelength, single-pass cell. Linke et al. (2016) report detection limits of 3.7–12 Mm−1 for their three-wavelength PAS; Yu et al. (2019) report detection limits in the range of 0.20–0.90 Mm−1 for their differential, multi-wavelength PAS (RGB-DPAS); Kapp et al. (2019) report a detection limit of 3 ppb NO2 or roughly 5 Mm−1 at the central wavelength of the LED (405 nm) assuming normal temperature and pressure (NTP) (Bogumil et al., 2003); and Cui et al. (2025) report an ultimate detection limit of 0.33 ppm CO2 or roughly 0.05 Mm−1 for their multi-pass, 3D-printed PAS.
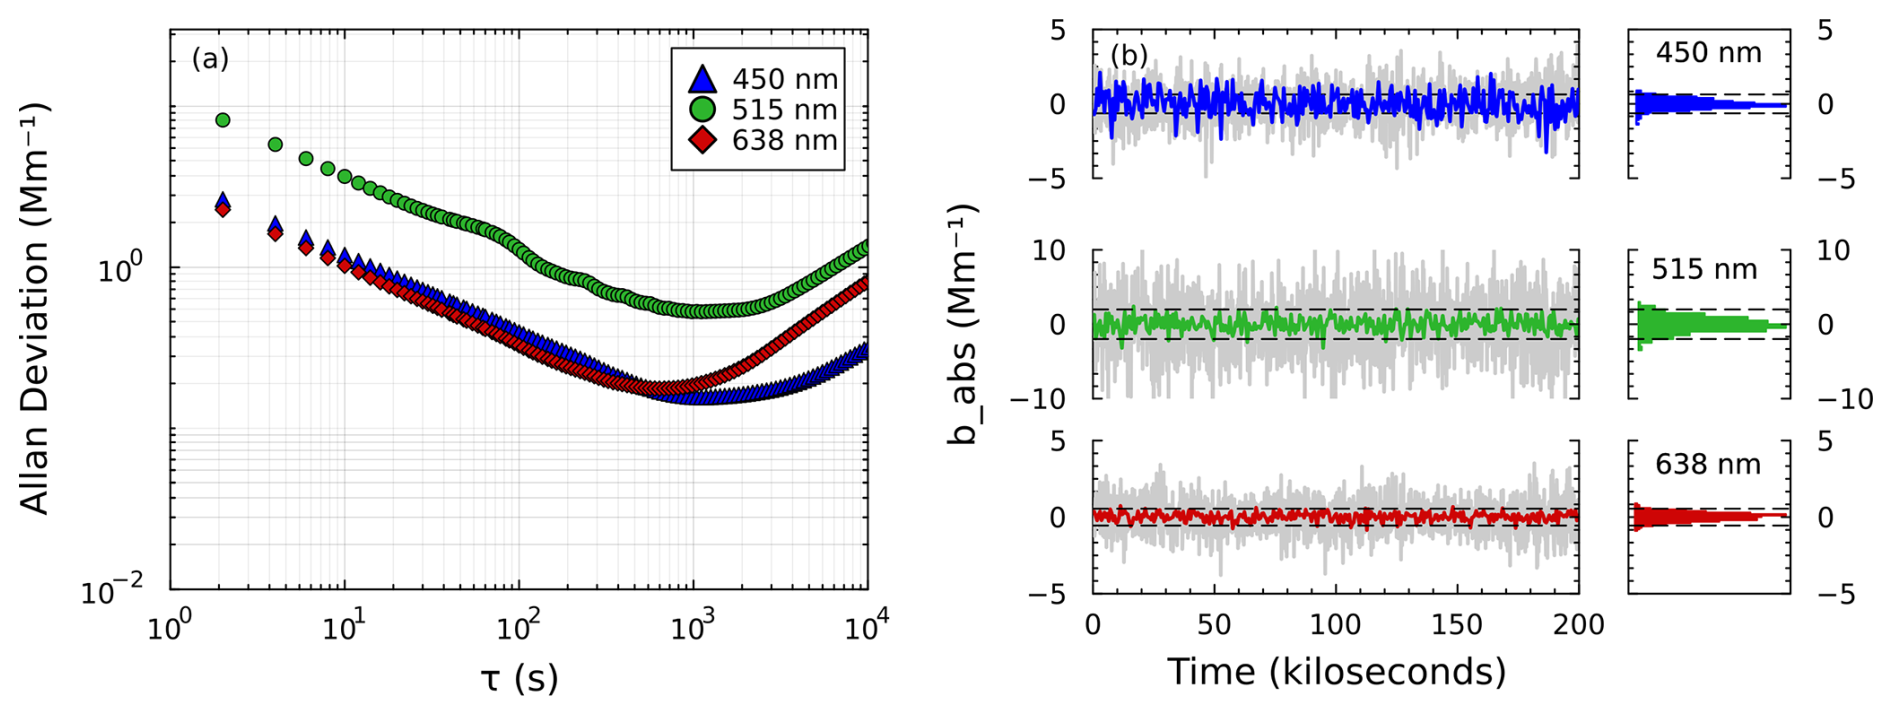
Figure 6Detection limits of the SiMPLE-PAS. (a) Allan deviation results and (b) method detection limits determined from standard deviation. For panel (b), gray lines correspond to 2 min averages, and colored lines (and histograms) correspond to 10 min averages. Dashed horizontal lines correspond to the 2σ limit of detection based on the 10 min averages. Uncorrected data from panel (b) are shown in Fig. S7.
The Allan deviation likely overestimates an instrument's limit of detection (i.e., yields a better or lower limit of detection than is practically possible). Moreover, IUPAC defines detection limits in terms of standard deviation, not Allan deviation (Kaiser and Chalk, 2019). Many groups have begun to report detection limits based on standard deviation along with their Allan deviation results, often using the 2σ standard that has become common in the field of aerosol PAS. When reporting standard deviation, groups often mimic their sampling routine by recomputing a background at defined time intervals, as described above. Standard deviation therefore provides a more realistic measure of an instrument's practical detection limits, which, here, we term the method detection limit (MDL) because it incorporates both instrumental and methodological considerations (Nakayama et al., 2015; Fischer and Smith, 2018a; Schnaiter et al., 2023). When treating the data in this way, we observe 2σ, 2 min lower limits of detection of 1.2, 3.6, and 1.0 Mm−1 and 2σ, 10 min detection limits of 0.63, 2.0, and 0.55 Mm−1 for the blue, green, and red channels, respectively. This is somewhat worse than the 2σ, 2 min detection limits reported by Fischer and Smith (2018a) (0.61–0.75 Mm−1, dependent on wavelength) and Schnaiter et al. (2023) (0.28 Mm−1). Although Schnaiter et al. (2023) do not report the power of their lasers, the manufacturer used therein offers the lasers used in powers that are several times – up to almost 10 times – greater than the power of the lasers used in this work, which likely accounts for their superior detection limits. And, notably, the SiMPLE-PAS has better detection limits than other low-cost PAS instruments. Keeratirawee et al. (2022) report a 3σ detection limit of 100 ppbv NO2 for their low-cost circuitry and a standard pas cell, which was determined by measurement of NO2; this corresponds to approximately 75 Mm−1 at their measurement wavelength of 450 nm after conversion to the 2σ level, assuming NTP, although no averaging time is reported. Kapp et al. (2019) report a 6σ detection limit of 200 ppb NO2 for the LED-based PAS, also determined by measurement of NO2; this corresponds to approximately 50 Mm−1 at their measurement wavelength of 405 nm, again after conversion to the 2σ level and assuming NTP, although no averaging time is reported (Bogumil et al., 2003). Haedrich et al. (2025) report a black-carbon (BC) detection limit of 10.5 µg m−3 BC for their low-cost QE-PAS at a 1 s integration time; assuming the standard BC mass absorption coefficient of 7.5 m2 g−1 and an improvement in the detection limit that scales as , this would correspond to approximately 7 Mm−1 for a 2 min, 2σ detection limit (Bond and Bergstrom, 2006). The SiMPLE-PAS therefore has better detection limits than other low-cost instrumentation and is competitive with the most sensitive PAS instrument in the literature, including multi-pass instruments. But one notable difference between the SiMPLE-PAS and other aerosol PAS instruments is the lack of a correction for drifts in laser power (i.e., we do not monitor P0 in Eq. 1). Thus, the detection limits presented here include drifts in the laser power, and incorporating a power monitor in the future would likely lead to lower detection limits. Nevertheless, the detection limits observed here are suitable for the detection of ambient aerosols except in very clean environments and are more than suitable for measurements of lab-generated aerosols.
3.5 G-WISE 2
Figure 7 shows aerosol absorption spectra (solid lines) for each treatment calculated from the AAE determined using the SiMPLE-PAS; MultiPAS-IV data are overlaid for comparison but are not used in the computation of the overall spectra. It was expected that the AAE would decrease as the thermodenuder temperature increased since more volatile and semi-volatile BrC components would be removed to leave behind an aerosol that is more BC-like, and this is what was observed, although it appears that some low-volatility BrC sticks to particles even after denuding at 300 °C, given that the AAE does not decrease fully to 1.0. The SiMPLE-PAS was able to clearly differentiate the AAE of these treatments with the expected trend and broadly agreed with the MultiPAS-IV. However, the assumption that all absorption at 665 nm is due to BC is likely to be imperfect, and this, combined with extrapolation errors and calibration errors, is likely to lead to discrepancies in the data. This highlights the need for broad wavelength coverage in PAS instruments whenever possible. Nevertheless, we conclude overall that the SiMPLE-PAS is able to measure the absorption coefficient of aerosols, and we suggest that it is likely to be more accurate than other lower-cost methods such as aethalometry, which is known to suffer from memory effects that cause inaccuracies in both babs and the retrieved AAE values (e.g., Fischer and Smith, 2018a; Yus-Díez et al., 2021; Schnaiter et al., 2023; Yus-Díez et al., 2025).
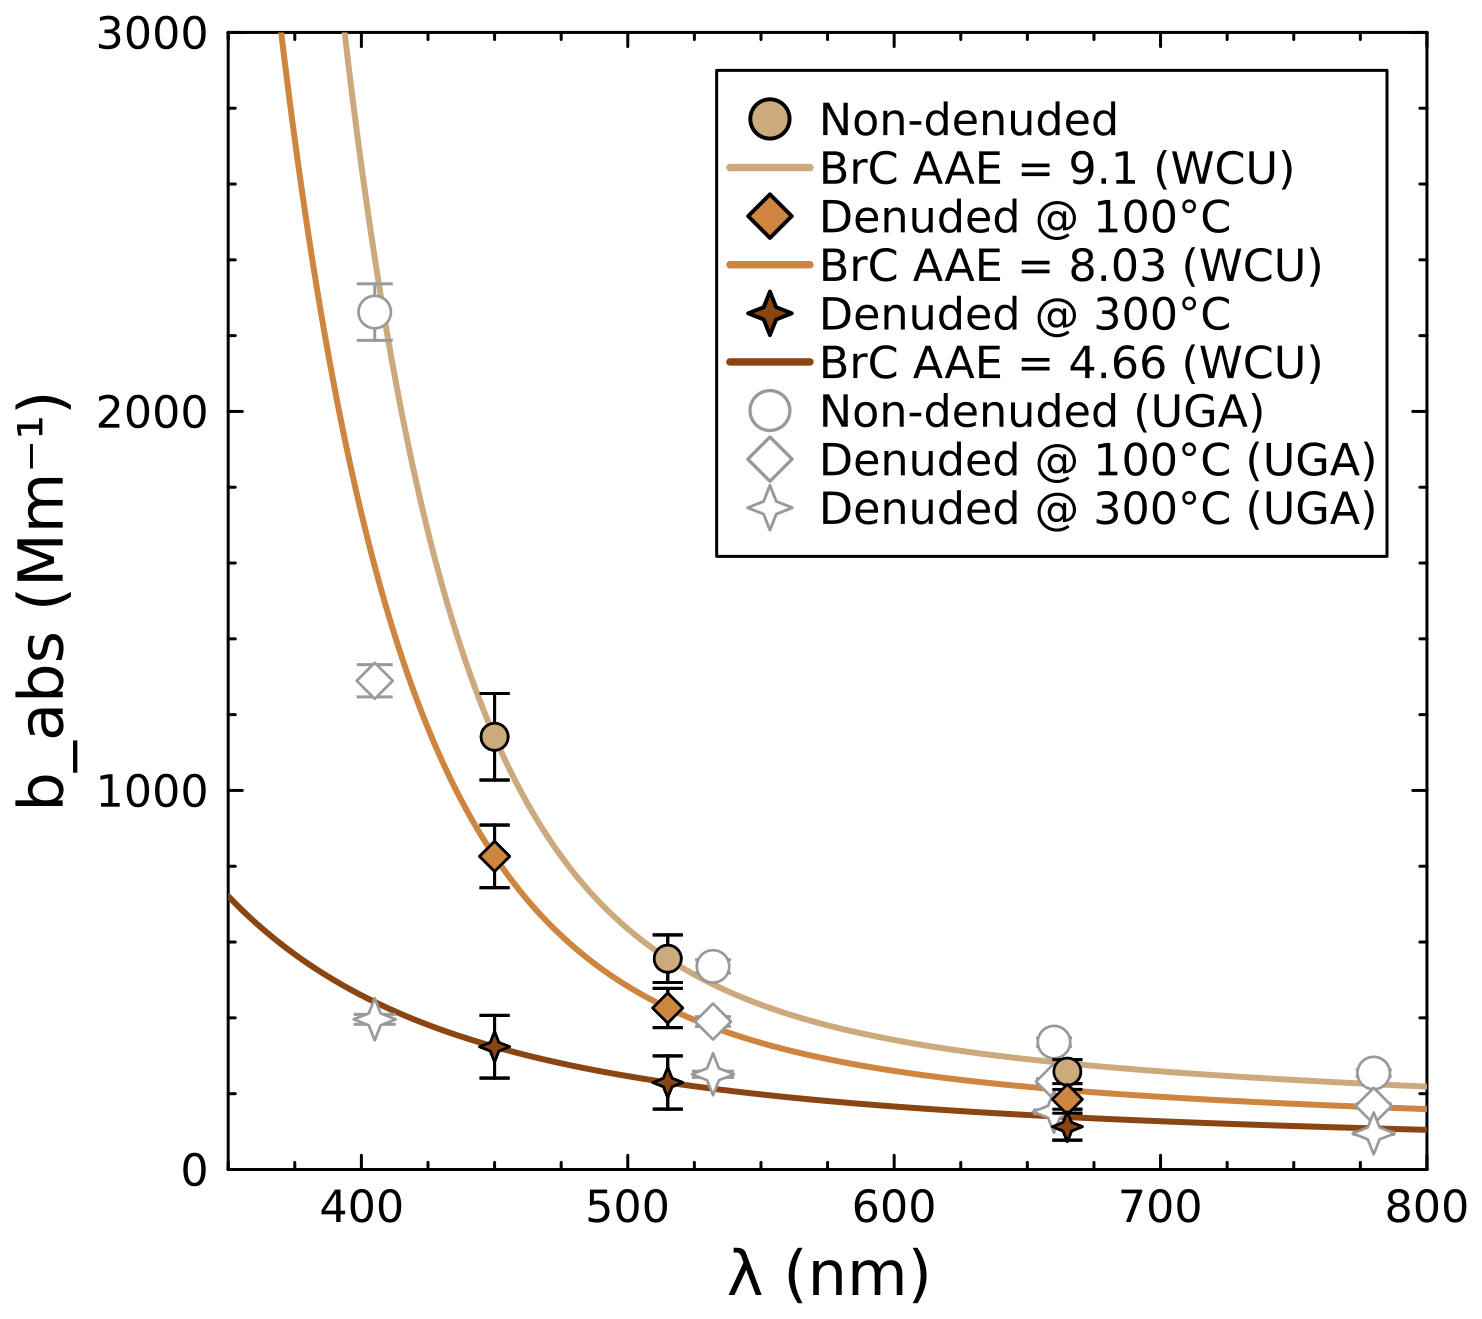
Figure 7Comparison of absorption spectra for denuded and non-denuded biomass aerosols measured by two PAS instruments. Colored points represent the SiMPLE-PAS measurements, while empty markers represent the MultiPAS-IV measurements. Lines are the calculated aerosol absorption spectrum (Eqs. 3–5) based on only the SiMPLE-PAS data; MultiPAS-IV data were not used to determine the lines.
To further compare the SiMPLE-PAS and MultiPAS-IV measurements, we bin the data for the full experiment into 60 s averages for both instruments and use the SiMPLE-PAS AAEs to calculate the absorption at 406, 532, 662, and 782 nm (the MultiPAS-IV measurement wavelengths). In Fig. 8, we show these values plotted against the MultiPAS-IV values measured at each wavelength. We see that most points tend to cluster around the 1 : 1 line, with R2 values in the range of 0.990–0.995 (depending on wavelength, as shown by series colors in the plot), indicating that the SiMPLE-PAS agrees with the MultiPAS-IV. We observe deviations from a 1 : 1 relationship ranging from −15 % to −9 % for the IR, red, and green wavelengths and a deviation of +8 % for 406 nm. For the first three, we suggest that this error is consistent with the determinate error in the calibration with ozone, which could have been greatly reduced by calibrating against the CRDS had it been available. For the case of 406 nm, we see a positive error. We attribute this to errors in extrapolating the SiMPLE-PAS AAE from 450 to 406 nm under high-AAE conditions where the wavelength dependence is very steep and therefore harder to predict via extrapolation. This analysis highlights the uncertainty involved in extrapolation and, therefore, the need for wide spectra coverage in PAS measurements, although it has been common in the PAS literature to extrapolate from two wavelengths or even one wavelength. Despite these errors, we again note that, overall, the points tend to cluster around the 1 : 1 line and therefore believe that these data demonstrate good agreement for absorption measurements of biomass aerosols.
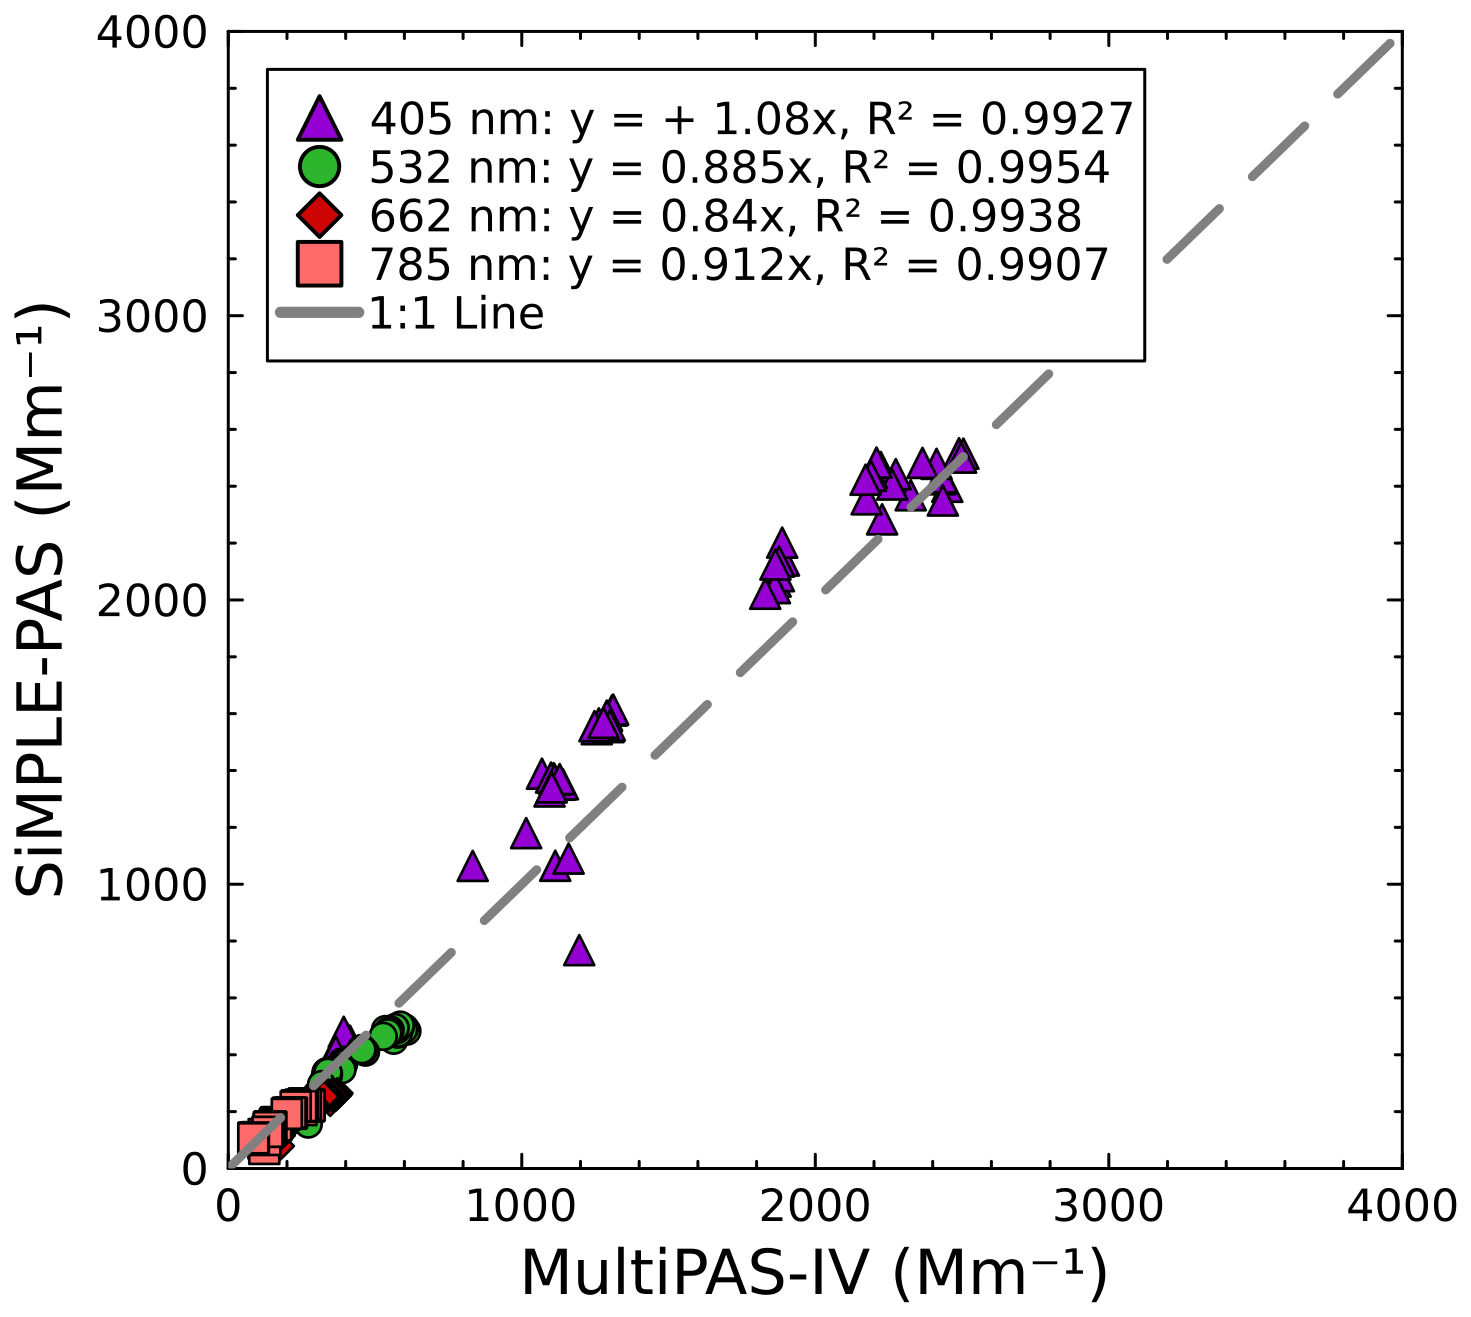
Figure 8Comparison of absorption coefficients retrieved by the SiMPLE-PAS and MultiPAS-IV instruments for biomass burning aerosols.
Finally, Fig. 9 shows a comparison of the AAE values measured by the SiMPLE-PAS and MultiPAS-IV for the 60 s averages. For these data, we calculated AAEBrC for each instrument as per Eq. (4), using the wavelength pairs 450–515 nm for the SiMPLE-PAS and 406–532 nm for the MultiPAS-IV; for the gold points, we calculated bBC using the red channel for both instruments (Eq. 3), while, for the gray points, we calculated it using the red channel for the SiMPLE-PAS and the NIR channel for the MultiPAS-IV. We see from the gray points in Fig. 9 that the instruments produce different AAE values when different assumptions about the amount of BC are made. We recognize this as an inherent limitation of the SiMPLE-PAS and of any other PAS or similar instrument without NIR wavelength coverage, and we suggest that it is important to consider these limitations when interpreting aerosol absorption data. Notwithstanding, we see generally good agreement between AAE values measured by the two instruments when considering the gold points (i.e., when the same assumptions about contributions from BC are used for both instruments), with the line of best fit yielding a slope of 0.99 and a correlation coefficient of 0.99. We see a deviation from the 1 : 1 relationship in lower-AAE samples, i.e., those that were thermodenuded at 300 °C. It remains unclear why the two instruments measure different AAEs for these samples, although we suggest that one explanation could be an increased dominance of absorption by nitroaromatic compounds in low-AAE spectra. Since BrC with a high concentration of nitroaromatics tends to be low-volatility and exhibits a relatively low AAE and a high absorption coefficient, this would be consistent with the removal of only high-volatility, high-AAE BrC in the thermodenuder, while the low-volatility nitroaromatics are left behind. This is also consistent with the fact that the AAE does not decrease fully to 1.0 after denuding. Such compounds preferentially absorb blue light and therefore would increase absorption in the 450 nm channel of the SiMPLE-PAS while affecting the 406 nm channel of the MultiPAS-IV to a lesser extent (Singh et al., 2021). This, in turn, would lead the blue-green AAE values retrieved by the SiMPLE-PAS to be higher than those retrieved by the MultiPAS-IV. We note that any instrument for in situ aerosol absorption measurements with a blue channel and without a violet or UV channel would be similarly affected and that instruments with a violet or UV channel and without a blue channel may erroneously ignore nitroaromatic absorption. In fact, this “feature” has been used to track the concentration of nitroaromatic compounds using the ratio of the 370 and 470 nm channels in aethalometer measurements (Barreira et al., 2024). Thus, we believe the differences at low-AAE values are due to real differences in the sample and not measurement error, and we therefore conclude that the SiMPLE-PAS accurately measures AAEBrC, especially because we see such good agreement at other values.
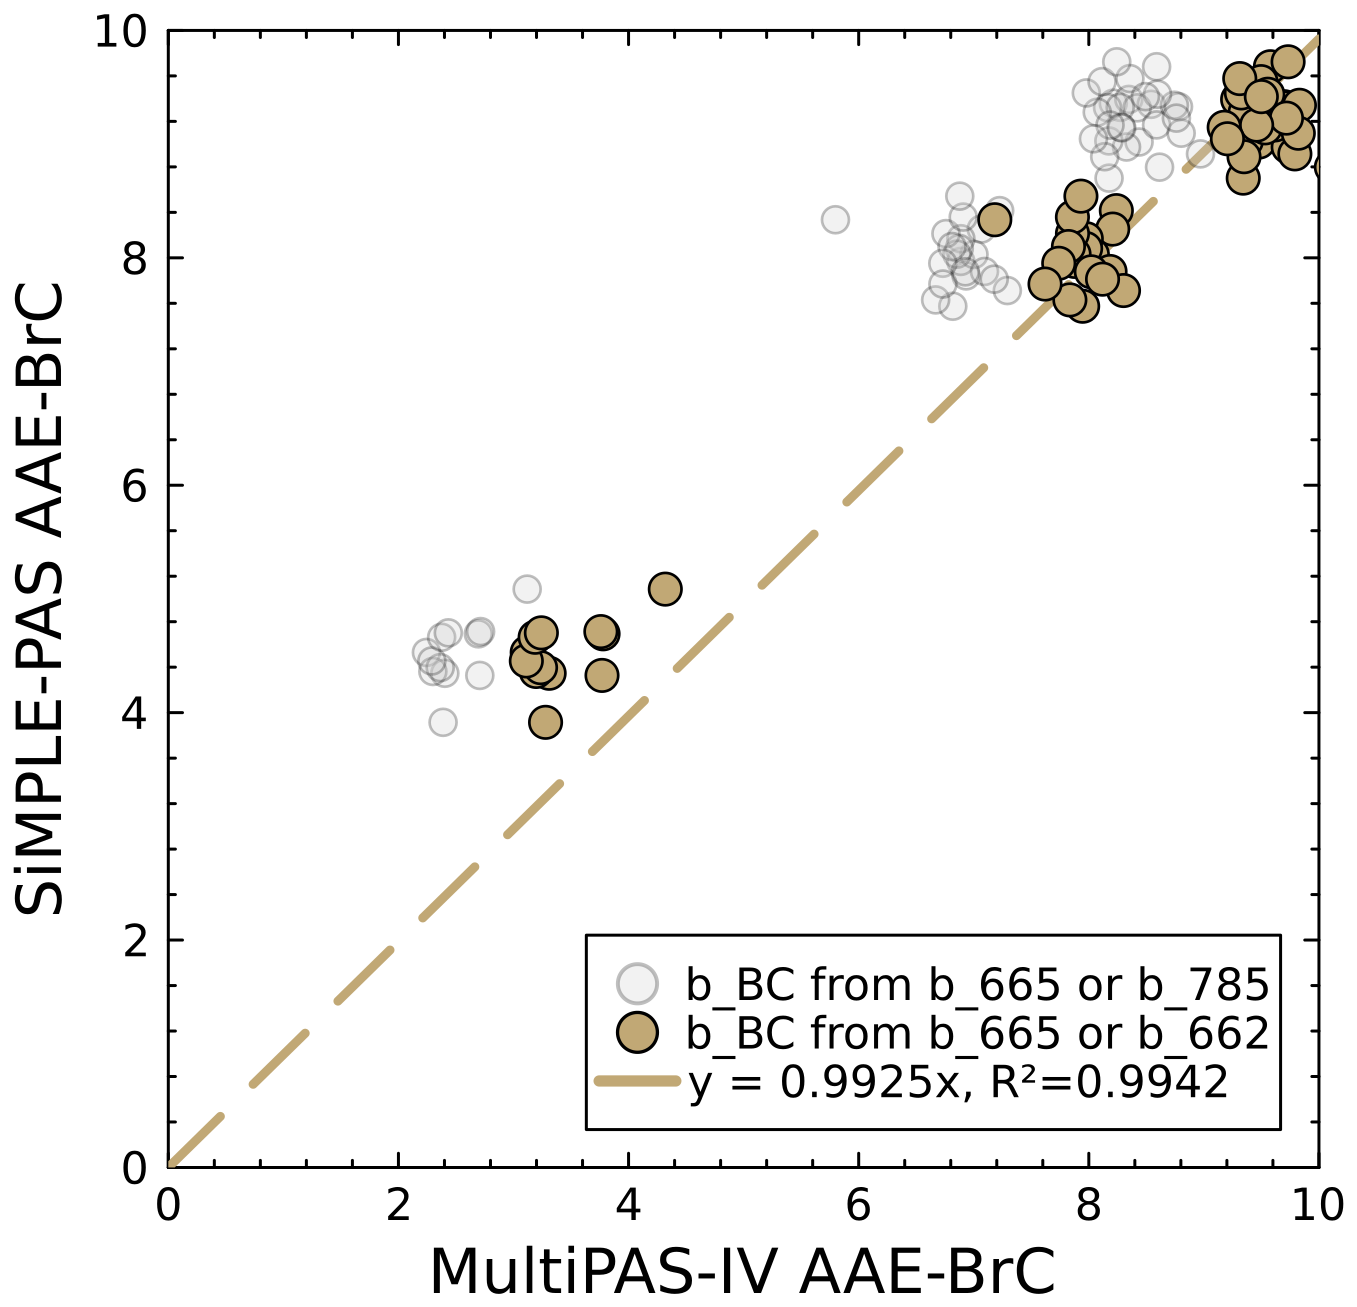
Figure 9Comparison of SiMPLE-PAS AAEBrC values to those from the MultiPAS-IV for the wavelength pairs 450–515 nm (SiMPLE-PAS) and 405–532 nm (MultiPAS-IV). Gold points show values calculated using the red wavelength from both instruments for determination of bBC (Eq. 3), while gray points use the red wavelength for the SiMPLE-PAS and NIR for the MultiPAS-IV.
The goal of this work was to put forth a design for a PAS that could be built with low-cost, readily accessible components; has detection limits suitable for the measurement of both ambient aerosols and lab-generated aerosols; uses multiple wavelengths to determine AAE values; and has a total bill-of-materials cost on the order of hundreds of dollars. To that end, Fig. S6 shows a full bill of materials for the SiMPLE-PAS with costs for each component as of the time of this writing. The total cost is roughly USD 500, which appears to be below the cost of any PAS instrument published to date. We give suggestions to reduce the cost further, to under USD 200, noting that the two precision windows used in the SiMPLE-PAS account for almost half the cost of the instrument and are likely to be overkill for most situations. To the best of our knowledge, this is the first low-cost, multi-wavelength PAS and the first field-deployable PAS built with FDM 3D printing. While it was anticipated that some sensitivity would be given up to achieve our goals, the hope was that it would be possible to construct an instrument capable of both field deployment for ambient aerosol measurements and deployment in laboratory campaigns. And, despite its low cost, the SiMPLE-PAS has detection limits approaching those of the most sensitive instruments in the aerosol literature (we refer readers to the text above for a comparison to low-cost instruments and to Table S1 from Fischer and Smith (2018a) for a more complete comparison to all aerosol PAS instruments) and outperforms other low-cost instruments in terms of detection limits. In addition to presenting low-cost hardware, we have further developed an open-source GUI for the instrument, using Julia and the Julia package Pluto, which is a novel use of these tools that are typically used only for data analysis.
Although we feel we met the design goals laid out for this project, we still see room for continued improvement. Since the work described herein, we have developed a low-cost power supply system to eliminate the need for the costly bench supplies used here and to make the instrument more compact and portable. Likewise, this instrument makes no effort to monitor laser power in real time, as many instruments do in the literature. Although this seems to have little effect on accuracy due to the stable nature of the single-pass cell, it is still desirable to eliminate this potential source of error. Therefore, we plan to develop a low-cost photodiode-based power meter to be placed at the rear of the PAS cell; this device will again utilize custom electronics and a low-cost microcontroller for data acquisition. Finally, we recognize that there are inherent limitations and risks involved in using 3D-printed cells for gas-phase measurements, and we note that making them gas-tight requires a not-insignificant amount of time investment; therefore, we plan to explore future designs that incorporate a simple and therefore low-cost machined metal resonator with 3D-printed plastic parts for mounting windows, the preamp, etc. Such a design could eliminate the bulk of the machining operations and, especially with the recent rise in low-cost online machine shops, potentially provide a more traditional machined PAS cell with little additional cost over plastic parts, especially when the cost of researcher time is factored in.
As part of this work, we compared measurements from the SiMPLE-PAS to measurements from the previously described MultiPAS-IV instrument, such that an additional outcome is to highlight the effects of wavelength choice for aerosol PAS instruments. For example, the SiMPLE-PAS has a lower wavelength limit of 450 nm, which is dictated by the low-cost laser module used in this study. In comparison, the MultiPAS-IV has a lower wavelength limit of 406 nm. This seemingly small difference has outcomes for both the measurement methods and results. The 450 nm wavelength has the advantage that it can be calibrated directly using either NO2 or O3, although this may come at the expense of greater susceptibility to interference from O3, more sensitivity to nitroaromatic compounds (Fig. 9) that may affect AAE measurements, and higher uncertainty regarding AAEBrC due to extrapolation to UV wavelengths (Fig. 8). Conversely, the 406 nm wavelength is much less susceptible to interference from O3 but may ignore absorption from nitroaromatic aerosols and also cannot be calibrated directly with common gas-phase calibrants and must rely on either calibration to aerosols or indirect calibration using the ratio of powers or other wavelengths (Fischer and Smith, 2018a). In a similar fashion, the MultiPAS-IV has an upper wavelength limit of 782 nm, while the SiMPLE-PAS has a limit of 665 nm, again imposed by the low-cost laser module. The effects of this are evident in measurements of AAE (Fig. 9), wherein the SiMPLE-PAS likely overestimates contributions from BC absorption to the overall spectrum. These results reflect on all aerosol PAS instruments, not just the SiMPLE-PAS, and such factors should be considered when interpreting PAS data. Taken together, these results suggests that it would be desirable to target PAS instruments with dense wavelength coverage in the UV–visible spectrum and measurements of bBC far into the NIR since there may be not-insignificant BrC absorption, even near 785 nm.
In sum, we have developed a low-cost, multi-wavelength photoacoustic spectrometer that accurately measures aerosol absorption and the aerosol AAE, as demonstrated with comparison measurements of biomass aerosols with the MultiPAS-IV instrument. In this paper, we have attempted to discuss the strengths and weaknesses of working with such a low-cost instrument, and we find that the primary weakness here is the limited wavelength coverage of the low-cost lasers used but that performance is very good overall. We hope that this instrument may lower the barrier to entry for those wishing to begin PAS measurements and further realize that it may allow widespread deployment of many PAS instruments across a study area, as has been done with other low-cost sensors like the PurpleAir-II sensors. This latter point could then allow for much larger datasets than those that are currently available that may be useful for, e.g., machine learning applications and understanding hyper-local aerosol characteristics.
The data used in the plots, code, and CAD models are available at https://codeberg.org/alphonse/SiMPLE-PAS (last access: 19 February 2026).
The supplement related to this article is available online at https://doi.org/10.5194/ar-4-103-2026-supplement.
DAF conceived of and designed the SiMPLE-PAS instrument; wrote the software; contributed to the instrument assembly, data collection, and data processing; and wrote the paper. AMS contributed to the instrument assembly and SiMPLE-PAS data collection. CAW constructed the CRD used for the calibration and contributed to the PCB design and 3D printing. RPP operated the SiMPLE-PAS and MultiPAS-IV at G-WISE 2 and completed the data processing for MultiPAS-IV data. ADJ conducted ozone measurements with the CRD.
The contact author has declared that none of the authors has any competing interests.
Publisher's note: Copernicus Publications remains neutral with regard to jurisdictional claims made in the text, published maps, institutional affiliations, or any other geographical representation in this paper. The authors bear the ultimate responsibility for providing appropriate place names. Views expressed in the text are those of the authors and do not necessarily reflect the views of the publisher.
The authors express their sincere gratitude to Rawad Saleh (University of Georgia College of Engineering), Joe O'Brien (US Forest Service), and Geoff Smith (University of Georgia Department of Chemistry) for facilitating the measurements during G-WISE 2 and further thank Geoff Smith for sharing the MultiPAS-IV data and providing feedback on the paper. DAF, AMS, CAW, and ADJ received funding from Western Carolina University. RPP received funding from the National Science Foundation, Division of Atmospheric and Geospace Sciences under grant no. AGS-2134617. G-WISE 2 was funded by the Department of Defense Strategic Environmental Research and Development Program under contract no. RC 24-4132 and the National Science Foundation Division of Atmospheric and Geospace Sciences under grant no. AGS-2144062.
This research has been supported by the Division of Atmospheric and Geospace Sciences (grant nos. AGS-2134617 and AGS-2144062), the Strategic Environmental Research and Development Program (grant no. RC 24-4132), and the Western Carolina University.
This paper was edited by Hilkka Timonen and reviewed by Joel Kuula and one anonymous referee.
Ajtai, T., Filep, Á., Schnaiter, M., Linke, C., Vragel, M., Bozóki, Z., Szabó, G., and Leisner, T.: A Novel Multi-wavelength Photoacoustic Spectrometer for the Measurement of the UV–Vis-NIR Spectral Absorption Coefficient of Atmospheric Aerosols, J. Aerosol Sci., 41, 1020–1029, https://doi.org/10.1016/j.jaerosci.2010.07.008, 2010. a, b
Barreira, L. M., Aurela, M., Saarikoski, S., Li, D., Teinilä, K., Virkkula, A., Niemi, J. V., Manninen, H., Pirjola, L., Petäjä, T., Rönkkö, T., and Timonen, H.: Characterizing Winter-Time Brown Carbon: Insights into Chemical and Light-Absorption Properties in Residential and Traffic Environments, Science of The Total Environment, 955, 177089, https://doi.org/10.1016/j.scitotenv.2024.177089, 2024. a
Bell, A. G.: On the Production and Reproduction of Sound by Light, American Journal of Science, 20, https://doi.org/10.2475/ajs.s3-20.118.305, 1880. a
Bezanson, J., Edelman, A., Karpinski, S., and Shah, V. B.: Julia: A Fresh Approach to Numerical Computing, SIAM Review, 59, 65–98, https://doi.org/10.1137/141000671, 2017. a
Bogumil, K., Orphal, J., Homann, T., Voigt, S., Spietz, P., Fleischmann, O., Vogel, A., Hartmann, M., Kromminga, H., Bovensmann, H., Frerick, J., and Burrows, J.: Measurements of Molecular Absorption Spectra with the SCIAMACHY Pre-Flight Model: Instrument Characterization and Reference Data for Atmospheric Remote-Sensing in the 230–2380 Nm Region, Journal of Photochemistry and Photobiology A: Chemistry, 157, 167–184, https://doi.org/10.1016/S1010-6030(03)00062-5, 2003. a, b, c, d, e
Bond, T. C. and Bergstrom, R. W.: Light Absorption by Carbonaceous Particles: An Investigative Review, Aerosol Science and Technology, 40, 27–67, https://doi.org/10.1080/02786820500421521, 2006. a, b
Bozóki, Z., Pogány, A., and Szabó, G.: Photoacoustic Instruments for Practical Applications: Present, Potentials, and Future Challenges, Applied Spectroscopy Reviews, 46, 1–37, https://doi.org/10.1080/05704928.2010.520178, 2011. a
Burkholder, J., Abbatt, J., Cappa, C., Dibble, T., Kolb, C., Orkin, V., Wilmouth, D., Sander, S., Barker, J., Crounse, J., Huie, R., Kurylo, M., Percival, C., and Wine, P.: JPL Publication 19-5: Chemical Kinetics and Photochemical Data for Use in Atmospheric Studies (Evaluation Number 19), Tech. rep., NASA Jet Propulsion Laboratory, https://doi.org/2014/49199, 2020. a, b
Cheng, Z., Atwi, K., Hajj, O. E., Ijeli, I., Fischer, D. A., Smith, G., and Saleh, R.: Discrepancies between Brown Carbon Light-Absorption Properties Retrieved from Online and Offline Measurements, Aerosol Science and Technology, 55, 92–103, https://doi.org/10.1080/02786826.2020.1820940, 2021. a
Cotterell, M. I., Orr-Ewing, A. J., Szpek, K., Haywood, J. M., and Langridge, J. M.: The impact of bath gas composition on the calibration of photoacoustic spectrometers with ozone at discrete visible wavelengths spanning the Chappuis band, Atmos. Meas. Tech., 12, 2371–2385, https://doi.org/10.5194/amt-12-2371-2019, 2019. a, b
Cotterell, M. I., Szpek, K., Tiddeman, D. A., Haywood, J. M., and Langridge, J. M.: Photoacoustic Studies of Energy Transfer from Ozone Photoproducts to Bath Gases Following Chappuis Band Photoexcitation, Physical Chemistry Chemical Physics, 23, 536–553, https://doi.org/10.1039/D0CP05056C, 2021. a, b
Cui, R., Yuan, Y., Qui, S., Han, W., Huang, J., Wang, L., Wu, H., Chen, W., and Dong, L.: Miniaturized 3D-Printed Multipass Helmholtz Photoacoustic Sensors for High-Sensitivity CO2 Detection with Near-Infrared (NIR) Diode Lasers, Anal. Chem., 97, 13095–13102, https://doi.org/10.1021/acs.analchem.5c00484, 2025. a, b
Davies, N. W., Cotterell, M. I., Fox, C., Szpek, K., Haywood, J. M., and Langridge, J. M.: On the accuracy of aerosol photoacoustic spectrometer calibrations using absorption by ozone, Atmos. Meas. Tech., 11, 2313–2324, https://doi.org/10.5194/amt-11-2313-2018, 2018. a, b
Dumitras, D. C., Dutu, D. C., Matei, C., Magureanu, A. M., Petrus, M., and Popa, C.: Laser Photoacoustic Spectroscopy: Principles, Instrumentation, and Characterization, Journal of Optoelectronics and Advanced Materials, 2097736, https://hero.epa.gov/reference/2097736/ (last access: 19 February 2026), 2007. a
Fischer, D. A. and Smith, G. D.: A Portable, Four-Wavelength, Single-Cell Photoacoustic Spectrometer for Ambient Aerosol Absorption, Aerosol Science and Technology, 52, 393–406, https://doi.org/10.1080/02786826.2017.1413231, 2018a. a, b, c, d, e, f, g, h, i, j, k, l, m, n
Fischer, D. A. and Smith, G. D.: Can ozone be used to calibrate aerosol photoacoustic spectrometers?, Atmos. Meas. Tech., 11, 6419–6427, https://doi.org/10.5194/amt-11-6419-2018, 2018b. a, b, c, d
Fu, L., Wang, F., Zhang, J., Han, Z., Pang, S., and Wang, Q.: Miniaturization Study on Helmholtz-Based Photoacoustic Cell for PAS-based Trace Gas Detection, Measurement, 236, 115154, https://doi.org/10.1016/j.measurement.2024.115154, 2024. a
Giglio, M., Patimisco, P., Sampaolo, A., Scamarcio, G., Tittel, F. K., and Spagnolo, V.: Allan Deviation Plot as a Tool for Quartz-Enhanced Photoacoustic Sensors Noise Analysis, IEEE Transactions on Ultrasonics, Ferroelectrics, and Frequency Control, 63, 555–560, https://doi.org/10.1109/TUFFC.2015.2495013, 2016. a
Haedrich, L., Kousias, N., Raptis, I., Li, D., Stahl, U., Ntziachristos, L., and Ntziachristos, V.: An Optoacoustic Black Carbon Sensor for Ship Emission Monitoring, Aerosol Science and Technology,1–13, https://doi.org/10.1080/02786826.2025.2490642, 2025. a, b, c
Kaiser, J. and Chalk, S. J. (Eds.): The IUPAC Compendium of Chemical Terminology: The Gold Book, International Union of Pure and Applied Chemistry (IUPAC), Research Triangle Park, NC, 4th edn., https://doi.org/10.1351/goldbook, 2019. a
Kapp, J., Weber, C., Schmitt, K., Pernau, H.-F., and Wöllenstein, J.: Resonant Photoacoustic Spectroscopy of NO2 with a UV-LED Based Sensor, Sensors, 19, 724, https://doi.org/10.3390/s19030724, 2019. a, b, c, d, e, f
Karhu, J., Kuula, J., Virkkula, A., Timonen, H., Vainio, M., and Hieta, T.: Cantilever-Enhanced Photoacoustic Measurement of Light-Absorbing Aerosols, Aerosol Science and Technology, 56, 92–100, https://doi.org/10.1080/02786826.2021.1998338, 2022. a
Karhu, J., Mikkonen, T., Kuula, J., Virkkula, A., Ikonen, E., Vainio, M., Timonen, H., and Hieta, T.: Field-deployable cantilever-enhanced photoacoustic instrument for aerosol light absorption measurement at three wavelengths, Aerosol Research, 3, 113–124, https://doi.org/10.5194/ar-3-113-2025, 2025. a
Keeratirawee, K., Furter, J. S., and Hauser, P. C.: Low-Cost Electronic Circuitry for Photoacoustic Gas Sensing, HardwareX, 11, e00280, https://doi.org/10.1016/j.ohx.2022.e00280, 2022. a, b, c, d
Krzempek, K.: A Review of Photothermal Detection Techniques for Gas Sensing Applications, Applied Sciences, 9, 2826, https://doi.org/10.3390/app9142826, 2019. a
Lack, D. A., Lovejoy, E. R., Baynard, T., Pettersson, A., and Ravishankara, A. R.: Aerosol Absorption Measurement Using Photoacoustic Spectroscopy: Sensitivity, Calibration, and Uncertainty Developments, Aerosol Science and Technology, 40, 697–708, https://doi.org/10.1080/02786820600803917, 2006. a, b
Langridge, J. M., Ball, S. M., Shillings, A. J. L., and Jones, R. L.: A Broadband Absorption Spectrometer Using Light Emitting Diodes for Ultrasensitive, in Situ Trace Gas Detection, Review of Scientific Instruments, 79, 123110, https://doi.org/10.1063/1.3046282, 2008. a
Li, J., Carlson, B. E., Yung, Y. L., Lv, D., Hansen, J., Penner, J. E., Liao, H., Ramaswamy, V., Kahn, R. A., Zhang, P., Dubovik, O., Ding, A., Lacis, A. A., Zhang, L., and Dong, Y.: Scattering and Absorbing Aerosols in the Climate System, Nature Reviews Earth & Environment, 3, 363–379, https://doi.org/10.1038/s43017-022-00296-7, 2022. a
Linke, C., Ibrahim, I., Schleicher, N., Hitzenberger, R., Andreae, M. O., Leisner, T., and Schnaiter, M.: A novel single-cavity three-wavelength photoacoustic spectrometer for atmospheric aerosol research, Atmos. Meas. Tech., 9, 5331–5346, https://doi.org/10.5194/amt-9-5331-2016, 2016. a, b
Miklós, A., Hess, P., and Bozóki, Z.: Application of Acoustic Resonators in Photoacoustic Trace Gas Analysis and Metrology, Review of Scientific Instruments, 72, 1937–1955, https://doi.org/10.1063/1.1353198, 2001. a, b
Moosmüller, H., Chakrabarty, R., and Arnott, W.: Aerosol Light Absorption and Its Measurement: A Review, Journal of Quantitative Spectroscopy and Radiative Transfer, 110, 844–878, https://doi.org/10.1016/j.jqsrt.2009.02.035, 2009. a, b
Moosmüller, H., Chakrabarty, R. K., Ehlers, K. M., and Arnott, W. P.: Absorption Ångström coefficient, brown carbon, and aerosols: basic concepts, bulk matter, and spherical particles, Atmos. Chem. Phys., 11, 1217–1225, https://doi.org/10.5194/acp-11-1217-2011, 2011. a, b
Nakayama, T., Suzuki, H., Kagamitani, S., Ikeda, Y., Uchiyama, A., and Matsumi, Y.: Characterization of a Three Wavelength Photoacoustic Soot Spectrometer (PASS-3) and a Photoacoustic Extinctiometer (PAX), Journal of the Meteorological Society of Japan. Ser. II, 93, 285–308, https://doi.org/10.2151/jmsj.2015-016, 2015. a, b, c, d
Palzer, S.: Photoacoustic-Based Gas Sensing: A Review, Sensors, 20, 2745, https://doi.org/10.3390/s20092745, 2020. a
Saleh, R. and O'Brien, J.: Overview of the Georgia Wildland-fire Simulation Experiment (G-WISE), ACS ES&T Air, 2, 979–981, https://doi.org/10.1021/acsestair.5c00122, 2025. a
Saleh, R., Cheng, Z., and Atwi, K.: The Brown–Black Continuum of Light-Absorbing Combustion Aerosols, Environmental Science & Technology Letters, 5, 508–513, https://doi.org/10.1021/acs.estlett.8b00305, 2018. a
Schnaiter, F. M., Linke, C., Asmi, E., Servomaa, H., Hyvärinen, A.-P., Ohata, S., Kondo, Y., and Järvinen, E.: The four-wavelength Photoacoustic Aerosol Absorption Spectrometer (PAAS-4λ), Atmos. Meas. Tech., 16, 2753–2769, https://doi.org/10.5194/amt-16-2753-2023, 2023. a, b, c, d, e, f, g, h, i, j
Singh, A., Rastogi, N., Kumar, V., Slowik, J. G., Satish, R., Lalchandani, V., Thamban, N. M., Rai, P., Bhattu, D., Vats, P., Ganguly, D., Tripathi, S., and Prévôt, A. S.: Sources and Characteristics of Light-Absorbing Fine Particulates over Delhi through the Synergy of Real-Time Optical and Chemical Measurements, Atmos. Environ., 252, 118338, https://doi.org/10.1016/j.atmosenv.2021.118338, 2021. a
Stylogiannis, A., Kousias, N., Kontses, A., Ntziachristos, L., and Ntziachristos, V.: A Low-Cost Optoacoustic Sensor for Environmental Monitoring, Sensors, 21, 1379, https://doi.org/10.3390/s21041379, 2021. a
Upadhyay, P., Sumlin, B. J., Kapoor, T. S., Yang, L., and Chakrabarty, R. K.: Tutorial: A Photoacoustic Spectrometer to Measure Aerosol Light Absorption, J. Aerosol Sci., 185, 106518, https://doi.org/10.1016/j.jaerosci.2024.106518, 2025. a, b
van der Plas, F., Dral, M., Berg, P., et al.: Fonsp/Pluto.Jl: V0.20.13, Zenodo [code], https://doi.org/10.5281/zenodo.4792401, 2025. a
Wada, R. and Orr-Ewing, A. J.: Continuous Wave Cavity Ring-down Spectroscopy Measurement of NO2 Mixing Ratios in Ambient Air, The Analyst, 130, 1595, https://doi.org/10.1039/b511115c, 2005. a
Yu, Z., Magoon, G., Assif, J., Brown, W., and Miake-Lye, R.: A Single-Pass RGB Differential Photoacoustic Spectrometer (RGB-DPAS) for Aerosol Absorption Measurement at 473, 532, and 671 Nm, Aerosol Science and Technology, 53, 94–105, https://doi.org/10.1080/02786826.2018.1551611, 2019. a, b, c
Yu, Z., Cheng, Z., Magoon, G. R., Hajj, O. E., and Saleh, R.: Characterization of Light-Absorbing Aerosols from a Laboratory Combustion Source with Two Different Photoacoustic Techniques, Aerosol Science and Technology, 55, 387–397, https://doi.org/10.1080/02786826.2020.1849537, 2021. a
Yus-Díez, J., Bernardoni, V., Močnik, G., Alastuey, A., Ciniglia, D., Ivančič, M., Querol, X., Perez, N., Reche, C., Rigler, M., Vecchi, R., Valentini, S., and Pandolfi, M.: Determination of the multiple-scattering correction factor and its cross-sensitivity to scattering and wavelength dependence for different AE33 Aethalometer filter tapes: a multi-instrumental approach, Atmos. Meas. Tech., 14, 6335–6355, https://doi.org/10.5194/amt-14-6335-2021, 2021. a
Yus-Díez, J., Drinovec, L., Alados-Arboledas, L., Titos, G., Bazo, E., Casans, A., Patrón, D., Querol, X., Gonzalez-Romero, A., Perez García-Pando, C., and Močnik, G.: Characterization of filter photometer artifacts in soot and dust measurements – laboratory and ambient experiments using a traceably calibrated aerosol absorption reference, Atmos. Meas. Tech., 18, 3073–3093, https://doi.org/10.5194/amt-18-3073-2025, 2025. a
Zhang, C., He, Y., Qiao, S., Liu, Y., and Ma, Y.: High-Sensitivity Trace Gas Detection Based on Differential Helmholtz Photoacoustic Cell with Dense Spot Pattern, Photoacoustics, 38, 100634, https://doi.org/10.1016/j.pacs.2024.100634, 2024. a
Zhang, X., Kim, H., Parworth, C. L., Young, D. E., Zhang, Q., Metcalf, A. R., and Cappa, C. D.: Optical Properties of Wintertime Aerosols from Residential Wood Burning in Fresno, CA: Results from DISCOVER-AQ 2013, Environmental Science & Technology, 50, 1681–1690, https://doi.org/10.1021/acs.est.5b04134, 2016. a, b