the Creative Commons Attribution 4.0 License.
the Creative Commons Attribution 4.0 License.
 | 06 Jul 2026
Soot growth by monodisperse particle dynamics coupled with computational fluid dynamics
Arash Fakharnezhad
Joseph D. Berry
Eirini Goudeli
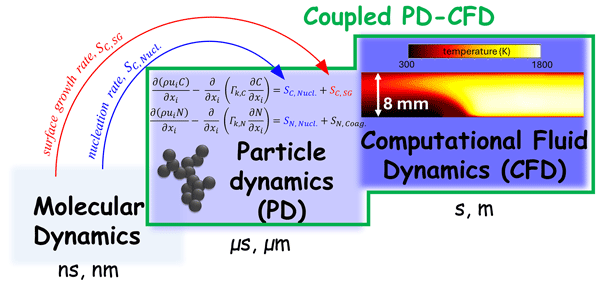
A multiscale modeling framework, integrating MD (molecular dynamics)-derived soot nucleation and surface growth rates into a coupled computational fluid dynamics (CFD)–monodisperse particle dynamics (PD) model, is implemented and benchmarked for a premixed ethylene burner-stabilized stagnation (BSS) flame. The proposed coupled model is validated by comparing the soot number density, volume fraction, and particle size with measurements across the BSS flame, as well as with the results obtained by CFD-PD using a semi-empirical nucleation rate by Moss–Brookes and the hydrogen abstraction-carbon addition (HACA) surface growth rate. Incorporation of the MD-derived nucleation rate is in excellent agreement with both experimental data and a detailed sectional model from the literature, especially in the post-flame region. The proposed MD-informed CFD-PD model is computationally efficient compared to detailed population balance equation models as it does not rely on reaction kinetic modeling. To the best of our knowledge, this work is the first systematic assessment of the potential of MD-derived nucleation and surface growth rate constants for soot modeling. In addition, the proposed CFD-coupled monodisperse PD framework can serve as a predictive tool for soot modeling and design-oriented simulations of practical combustion and aerosol systems.
- Article
(5198 KB) - Full-text XML
-
Supplement
(588 KB) - BibTeX
- EndNote


Soot formation in combustors and flames is inherently multiscale, involving coupled chemical and physical processes (Michelsen, 2017) that span several orders of magnitude in length and time. At the molecular zone, soot formation begins with reactions of small radicals and hydrocarbon fragments, only a few Angstroms in size, that form polycyclic aromatic hydrocarbons (PAHs), the main precursors of soot (Frenklach, 2002) as shown by atomic force microscopy (Schulz et al., 2019). These PAHs evolve into sub-2 nm soot nuclei through physical or chemical nucleation, which grow by surface reactions into primary particles (Mitchell and Frenklach, 2003). The primary particles coagulate by aggregation and/or agglomeration to form large (>100 nm) aggregates within microseconds to milliseconds (Michelsen, 2017). Reactive flow in combustors and flames extends over dimensions on the order of meters and particle residence times on the order of seconds, which strongly influence soot evolution (Trivanovic and Pratsinis, 2024; Kelesidis et al., 2017).
Hierarchical modeling provides a pathway to address the multiscale nature of soot formation and growth by linking information across different length and timescales (Goudeli, 2019). Molecular dynamics (MD) simulations can capture the onset and early stages of soot nucleation (Mao et al., 2017), as well as surface growth (Chen and Luo, 2020) and coalescence (Sharma et al., 2021), but remain limited to a few nanometers and hundreds of nanoseconds. Traditionally, soot nucleation has been modeled using physical PAH–PAH interactions, such as with the POLIMI soot nucleation sub-model (Saggese et al., 2015), whereas more recent approaches adopt hybrid (physical–chemical) reactive PAH dimerization models (Kholghy et al., 2018). More recently, reactive molecular dynamics (MD) has been employed to determine the critical nucleus size and nucleation rate of carbonaceous nanoparticles (Fakharnezhad et al., 2025). Particle-scale models, such as event-driven simulations (Patterson and Kraft, 2007; Goudeli et al., 2015; Kelesidis et al., 2017), can resolve particle interactions, while continuum models, such as population balance equations (PBEs) and computational fluid dynamics (CFD) can track particle growth and transport (Saggese et al., 2016), respectively, reaching length and timescales of micrometers and seconds. For example, event-driven mesoscale simulations of soot nanoparticles have been used to determine the coagulation rate in the transition regime, yielding an enhancement of 82 % over the harmonic mean interpolation between the theoretical kernels of the free molecular and continuum regime (Kelesidis and Goudeli, 2021). Such corrections have been implemented into monodisperse particle dynamics simulations (Fakharnezhad et al., 2026) to account for the primary particle and aggregate polydispersity. A similar hierarchical modeling framework has also been applied for TiO2 nanoparticle synthesis, where fractal dimension and coagulation rate equations derived from Langevin dynamics (Chen et al., 2023) were incorporated into a CFD-PBE model (Chen et al., 2023), along with sintering rates obtained by MD simulations (Buesser et al., 2011), linking molecular-, particle- and continuum-scale simulations.
The evolution of soot particle population can be described by the general dynamic equation, a partial integro-differential equation, requiring the implementation of numerical methods. One highly accurate numerical approach relies on the sectional method, where the particle population is divided into size bins and transport equations are solved for each class (Saggese et al., 2015), but its computational cost increases with the number of sections, making it impractical for multidimensional CFD simulations (Saggese et al., 2016; Kholghy and Kelesidis, 2021). A computationally less demanding alternative is the method of moments (MOM) (Hulburt and Katz, 1964), which tracks only a few statistical moments of the distribution (e.g., number, mass, surface area). However, MOM relies on closure assumptions (Kholghy and Kelesidis, 2021), limiting accuracy when soot distributions deviate from the assumed shape.
The particle dynamics equation can be greatly simplified when assuming monodisperse particles or aggregates at a given location (Kruis et al., 1993). So, the soot population can be represented by a single average size, requiring tracking of the evolution of only the number density, surface area, and volume (Kholghy and Kelesidis, 2021). Even though PDs neglect the spread of soot size distribution, this simplification typically results in deviations of up to 30 % (Kholghy and Kelesidis, 2021) in the predicted evolution of soot volume fraction, number density, and average particle diameters compared to polydisperse PBEs, owing to the rapid attainment of the self-preserving size distribution (Kholghy and Kelesidis, 2021) and an asymptotic collision frequency function therein, regardless of the primary particle polydispersity (Goudeli et al., 2016). Therefore, monodisperse PD models can provide average aggregate characteristics reasonably well at a much lower computational cost than sectional methods or MOM, making them attractive for coupling with multidimensional CFD simulations in realistic geometries.
Another challenge in soot kinetic models, such as POLIMI (Saggese et al., 2015), is that nucleation and surface growth rates are derived directly from detailed gas-phase chemistry. For example, nucleation is typically described through PAH–PAH interactions, which requires prior calculation of PAH concentrations using large kinetic mechanisms that involve many species and reactions (Ranzi et al., 2012). Similarly, surface growth is governed by detailed chemistry, proceeding either through radical-driven pathways or via condensation of PAHs and their fragments onto soot particles (Saggese et al., 2015). As such, both pathways are tied to extensive gas-phase mechanisms, which can be computationally prohibitive for multidimensional CFD simulations in realistic geometries. Traditionally, however, soot formation was described using semi-empirical models, in which nucleation and surface growth were correlated directly to acetylene rather than PAH concentrations (Brookes and Moss, 1999). While far more efficient and straightforward to implement, these correlations were developed for specific flame conditions and lack generalizability across different fuels and operating conditions (Johnson et al., 2021; Fakharnezhad et al., 2026). Thus, both detailed PAH-based and semi-empirical acetylene-based models face critical limitations when applied to practical design applications.
Here, lumped, acetylene-concentration-dependent nucleation (Fakharnezhad et al., 2026) and surface growth (Goudeli et al., 2026) rates derived from reactive MD are implemented into an easy-to-use monodisperse PD model (Fakharnezhad et al., 2026), which accounts for simultaneous nucleation, surface growth, and coagulation. The PD model is coupled with two-dimensional CFD to account for the flame geometry and fluid flow. These MD-derived rates, obtained without assumptions about the contributing reaction pathways or precursor species (Fakharnezhad et al., 2025), do not require simultaneous implementation or use of detailed gas-phase reaction mechanisms. The performance of these MD-derived rates is systematically assessed against established nucleation and surface growth rates from the literature implemented in the developed CFD–monodisperse framework, and the results are benchmarked against a detailed sectional model (Saggese et al., 2015, 2016) and experiments from a burner-stabilized stagnation (BSS) flame (Camacho et al., 2015). The results are also compared to those obtained from the standard semi-empirical Moss–Brookes model for spherical soot nanoparticles implemented in Fluent, which is also based on a monodisperse particle dynamics formulation but assumes coagulation only by full coalescence.
2.1 CFD model
ANSYS Fluent (V 2023 R1) was applied to model soot formation in a BSS laminar ethylene flame, with an unburned mixture consisting of 16.3 mol % ethylene and 23.7 mol % oxygen diluted in argon (Camacho et al., 2015).
2.1.1 Geometry and mesh
This flame was chosen for its well-defined flame geometry, consisting of a porous plug burner and featuring nitrogen shielding for isolation from ambient air and an adjustable cooled stagnation plate with an embedded orifice, facing the incoming flow for sampling (Camacho et al., 2015), with dimensions provided in Fig. 1. The flow geometry is axisymmetric, and so the velocity, temperature, and species composition depend solely on the axial and radial directions. Consequently, the computational domain is reduced to a two-dimensional rectangular section, representing a radial–axial slice (Fig. 1: side 6), which is revolved around the axis of symmetry to model the full cylindrical flame geometry. This 2D domain was discretized into 46 400 quadrilateral cells using a non-uniform mesh. The cell size ranges from ∼0.05 mm in the axial direction near the reactant inlet and stagnation plate up to 0.2 mm away from them.
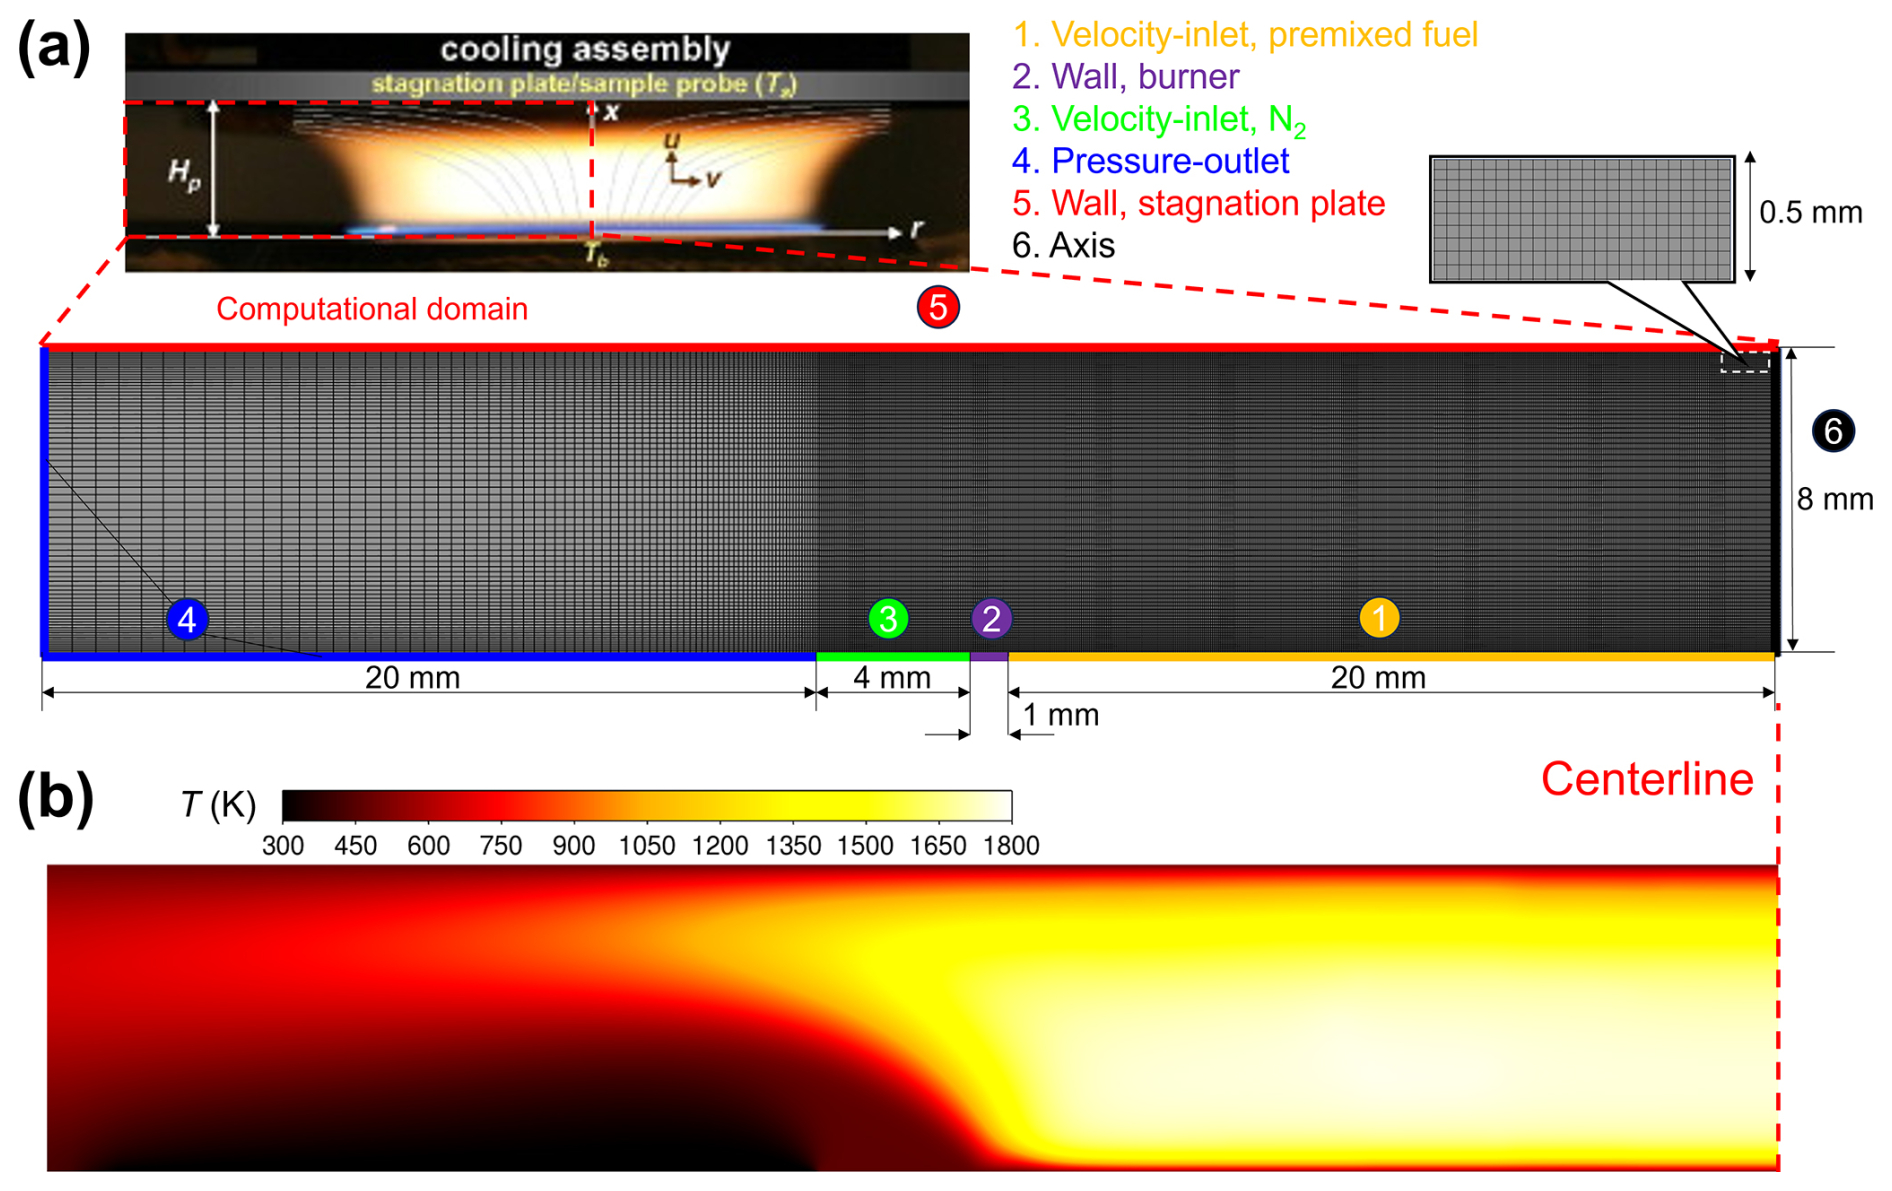
Figure 1(a) Schematic of the computational domain with applied boundary conditions and mesh configuration used in the CFD simulation, along with (b) a representative contour plot of the resulting temperature field.
2.1.2 Governing equations
The steady-state Navier–Stokes equations were solved using a pressure-based solver that ensures mass conservation through a pressure correction equation. The equation for conservation of momentum (Batchelor, 2000) is as follows:
where ρ is the gas density, v is the velocity vector, p is the static pressure, and is the viscous stress tensor. The terms ρg and F represent the gravitational and external body forces, respectively. The energy equation was also included to capture thermal variations:
The e and h on the left-hand side of Eq. (2) denote the internal energy and the enthalpy, respectively. On the right-hand side, keff is the effective thermal conductivity, Jj is the diffusion flux of species j, and Sh accounts for volumetric heat sources including the heat released by chemical reactions.
Species transport was modeled using the volumetric reaction approach (Kee et al., 2003) with the DRM22 reaction mechanism (Kazakov and Frenklach, 1995), including 22 species and 104 reactions. The DRM22 was developed as a reduced form of GRI-Mech 1.2 and has been validated against detailed mechanism predictions of ignition delays and laminar premixed methane-air flame properties over a wide range of conditions, showing deviations typically below 5 % (Kazakov and Frenklach, 1995). This mechanism is further validated here, as discussed in Sect. 3.1.1. The CHEMKIN-CFD chemistry solver was employed, including thermal diffusion effects.
2.1.3 Boundary conditions
At the premixed inlet (Fig. 1: boundary 6), the velocity components, temperature, and species mass fluxes are prescribed. The axial velocity is set to v=0.14 m s−1, and the temperature is fixed at T=473 K (Saggese et al., 2016). The species fluxes account for both convective and diffusive contributions, ensuring mass conservation at the boundary:
where ρ is the gas density, Yk is the mass fraction of species k, and Vk is the diffusion velocity. The species balance fluxes that account for both convective and diffusive contributions were obtained from Chemkin-Pro under identical conditions and were imposed as the inlet boundary condition in the Fluent solver. A pure nitrogen inlet (Fig. 1: boundary 3) is defined with an inlet velocity of 0.4 m s−1 and temperature of 473 K (Saggese et al., 2016). The stagnation surface (Fig. 1: boundary 5) is treated as a no-slip wall with a fixed temperature of 500 K (Saggese et al., 2016). At the outlet (Fig. 1: boundary 4), an atmospheric pressure condition is applied, allowing the flow to exit the domain naturally.
2.1.4 Initial conditions
All simulations were first initialized using the Hybrid Initialization method used to generate a physically representative initial flow field through boundary-based interpolation. Then, Fluent simulations were performed under cold-flow conditions (no combustion chemistry considered) until the flow reached steady state. Upon convergence of the cold-flow solution, the volumetric reactions were activated, and a temperature of 2000 K was imposed in the whole region above the burner surface. This temperature patch acts as an ignition source to initiate flame formation in the combustion zone. This two-step procedure ensured numerical stability and provided a physically realistic initial condition for the reacting flow simulations.
2.2 Soot dynamics
The evolution of soot was described using a monodisperse PD framework coupled to the CFD solver in ANSYS Fluent through user-defined functions. Specifically, the evolution of total particle number density N and the total carbon molar concentration C of carbon contained in soot particles (obtained by the soot mass concentration using the molar mass of carbon, MWc=12 g mol−1) was modeled using CFD transport equations, with nucleation, surface growth, and coagulation rates incorporated as custom source terms through user-defined functions in Fluent. In this implementation, the transport of total particle number density N is described by
and the transport of carbon molar concentration C is defined by
The terms on the left-hand side of Eqs. (3) and (4) represent convection and diffusion in the flow, where ui denotes the velocity, and Γk,N and Γk,C are the effective diffusion coefficients for number density and carbon concentration, respectively. The right-hand side of Eq. (4) includes the nucleation term, , which describes the formation of new particles, and the coagulation term, , which describes the reduction in the number of particles due to agglomeration. In Eq. (3), the source terms correspond to carbon addition due to particles newly formed by nucleation, , which can be obtained by
where n∗ is the number of carbon atoms within the soot critical nucleus, and NAv is Avogadro's number. SC, SG is the accumulation of carbon on existing particles due to surface growth.
The total soot surface area concentration, A, is not explicitly solved in this implementation. Instead, it is reconstructed from N and C using a morphological relationship (Xiong and Pratsinis, 1993):
where a0 and v0 denote the surface area and volume of a primary soot particle, is the total soot volume concentration of the whole particle population, MWc=12 g mol−1, and Ds is the surface fractal dimension. For spherical particles, Ds=2, while for agglomerates and aggregates, Ds is between 2 and 3. The Ds correlation and the coagulation kernel employed in this study, are detailed in Fakharnezhad et al. (2026).
The source terms for nucleation and surface growth follow established literature models in the baseline framework (as listed in Table 1), where the Moss–Brookes acetylene-based nucleation rate (Brookes and Moss, 1999) is combined with the hydrogen abstraction-carbon addition (HACA) surface growth mechanism (Appel et al., 2000) (Model I). To assess the impact of molecular-level rate expressions, three additional cases were considered: in Model II, the Moss–Brookes nucleation rate was replaced with the MD-derived nucleation rate (Fakharnezhad et al., 2026) while keeping HACA unchanged; in Model III, nucleation is described by the Moss–Brookes equation, while surface growth was substituted with an MD-derived rate (Goudeli et al., 2026); and, in Model IV, both nucleation and surface growth were described using MD-derived expressions. The MD-derived nucleation rate (Model II) was developed from MD simulations of isothermal acetylene pyrolysis at temperatures of 1200–1800 K and high pressures of 189–568 atm in Fakharnezhad et al. (2026). The nucleation rate was determined by monitoring the temporal evolution of the number of incipient soot clusters for various initial acetylene concentrations using a single lumped-rate expression (Table 1: of Model II). This MD-derived rate equation corresponds to the overall nucleation rate and does not require the identification of specific intermediates or tracking their concentration. As such, in contrast to traditional approaches where existing kinetic models are interfaced with CFD, here, a detailed PAH-based mechanism does not need to be employed.
Similarly, the MD-derived surface growth rate, kMD, SG (Goudeli et al., 2026), in Model III was obtained during isothermal surface growth of incipient soot nanoparticles by acetylene pyrolysis at a comparable temperature (1350–1800 K) and pressure range (106–568 atm). The steady-state particle mass growth rate, , was obtained by distinct simulations with different initial acetylene concentrations [C2H2] and particle sizes (or surface areas, a), and the rate constant kMD, SG was determined by the following (Goudeli et al., 2026):
resulting in an Arrhenius dependence with temperature (Goudeli et al., 2026),
Equation (8) originates from the HACA equation (Frenklach and Wang, 1991), where has been replaced by the MD-derived lumped-rate constant, kMD, SG (Goudeli et al., 2026).
For comparison, the Moss–Brookes soot model (Brookes and Moss, 1999), an early model developed in 1999, implemented in Fluent (Model V), is also considered as it is widely used in design applications (Wang, 2020). The latter is a semi-empirical, monodisperse formulation coupled with CFD, assuming full coalescence of spherical particles during coagulation in the free-molecular regime. Additionally, a detailed sectional CFD-PBE model from the literature (Saggese et al., 2015, 2016) (Model VI) is included, representing 1D and 2D simulations with full gas-phase chemistry and soot dynamics. The results of this model reported in the literature (Saggese et al., 2015; Saggese et al., 2016) are used to benchmark the proposed reduced framework against detailed sectional simulations. Overall, these six models (see Table 1) encompass a range of physical assumptions. For example, the MD-derived nucleation (Fakharnezhad et al., 2026) and surface growth rates (Goudeli et al., 2026) have been obtained at high pressures and within a narrow temperature range of approximately 1200–1800 K. All are systematically benchmarked against experiments in Sect. 3.
3.1 Validation
3.1.1 Reaction mechanism
The reduced DRM22 mechanism (Kazakov and Frenklach, 1995) was first benchmarked in one-dimensional Chemkin-Pro simulations against a well-characterized premixed ethylene flame (Φ≈1.7) (Gerasimov et al., 2012), where detailed experimental measurements are available, providing a suitable reference for validation under conditions comparable to the flame under investigation. Figure 2 shows the mole fraction profiles of major and intermediate species as a function of the height above the burner (HAB), including (a) H2O, H2, and O2; (b) CO, CO2, and C2H4; and (c) C2H2 and CH4. The predictions are in excellent agreement with measurements (Gerasimov et al., 2012) of O2 and C2H4 consumption and H2O, CO, H2, and CO2 formation (Fig. 2a and b), validating the employed chemical reaction scheme for oxidation. The mechanism also captures the trend and order of magnitude of the mole fraction of C2H2 and CH4 intermediates (Fig. 2c), validating further the DRM22 mechanism for the chemistry of the present premixed ethylene flame.
Table 1Summary of soot nucleation and surface growth models employed in this study.
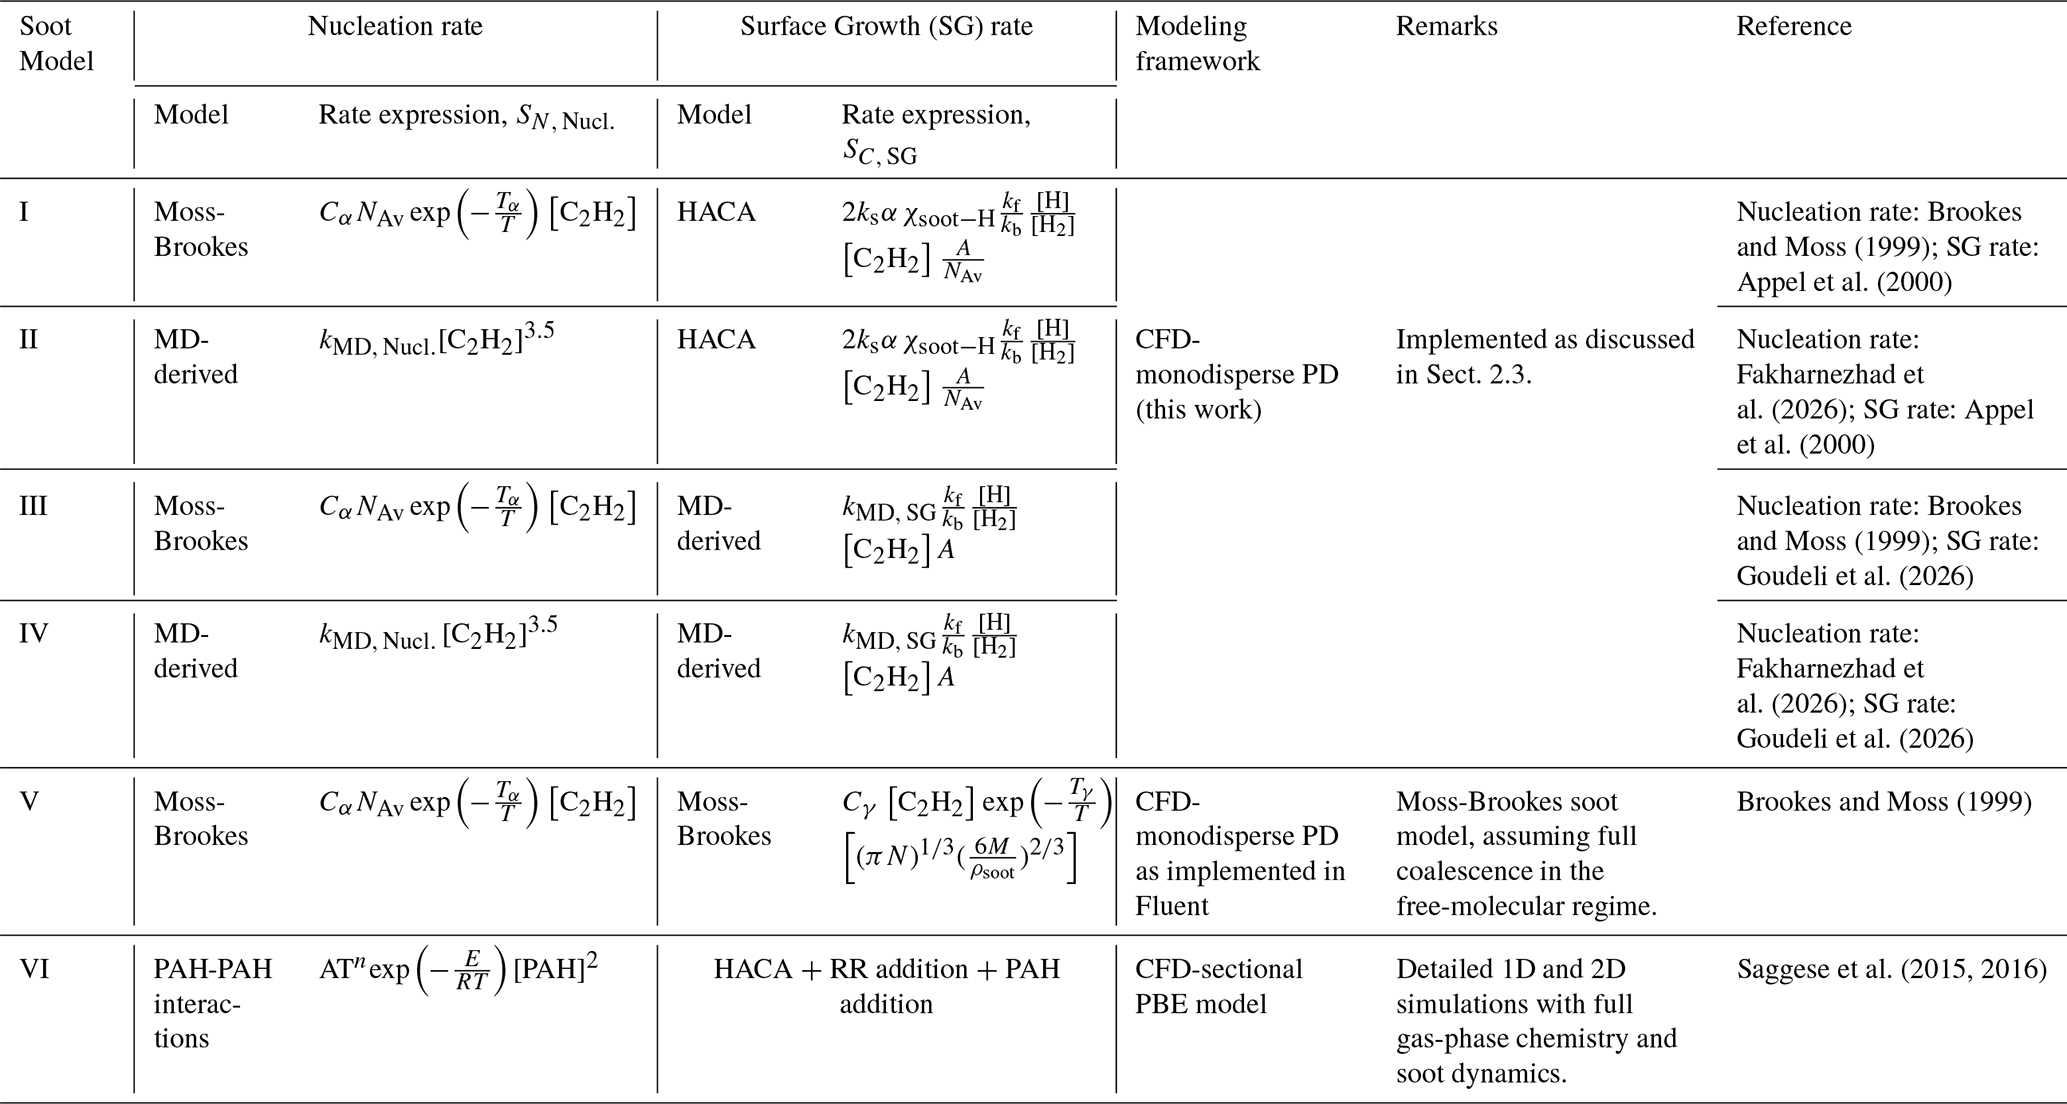
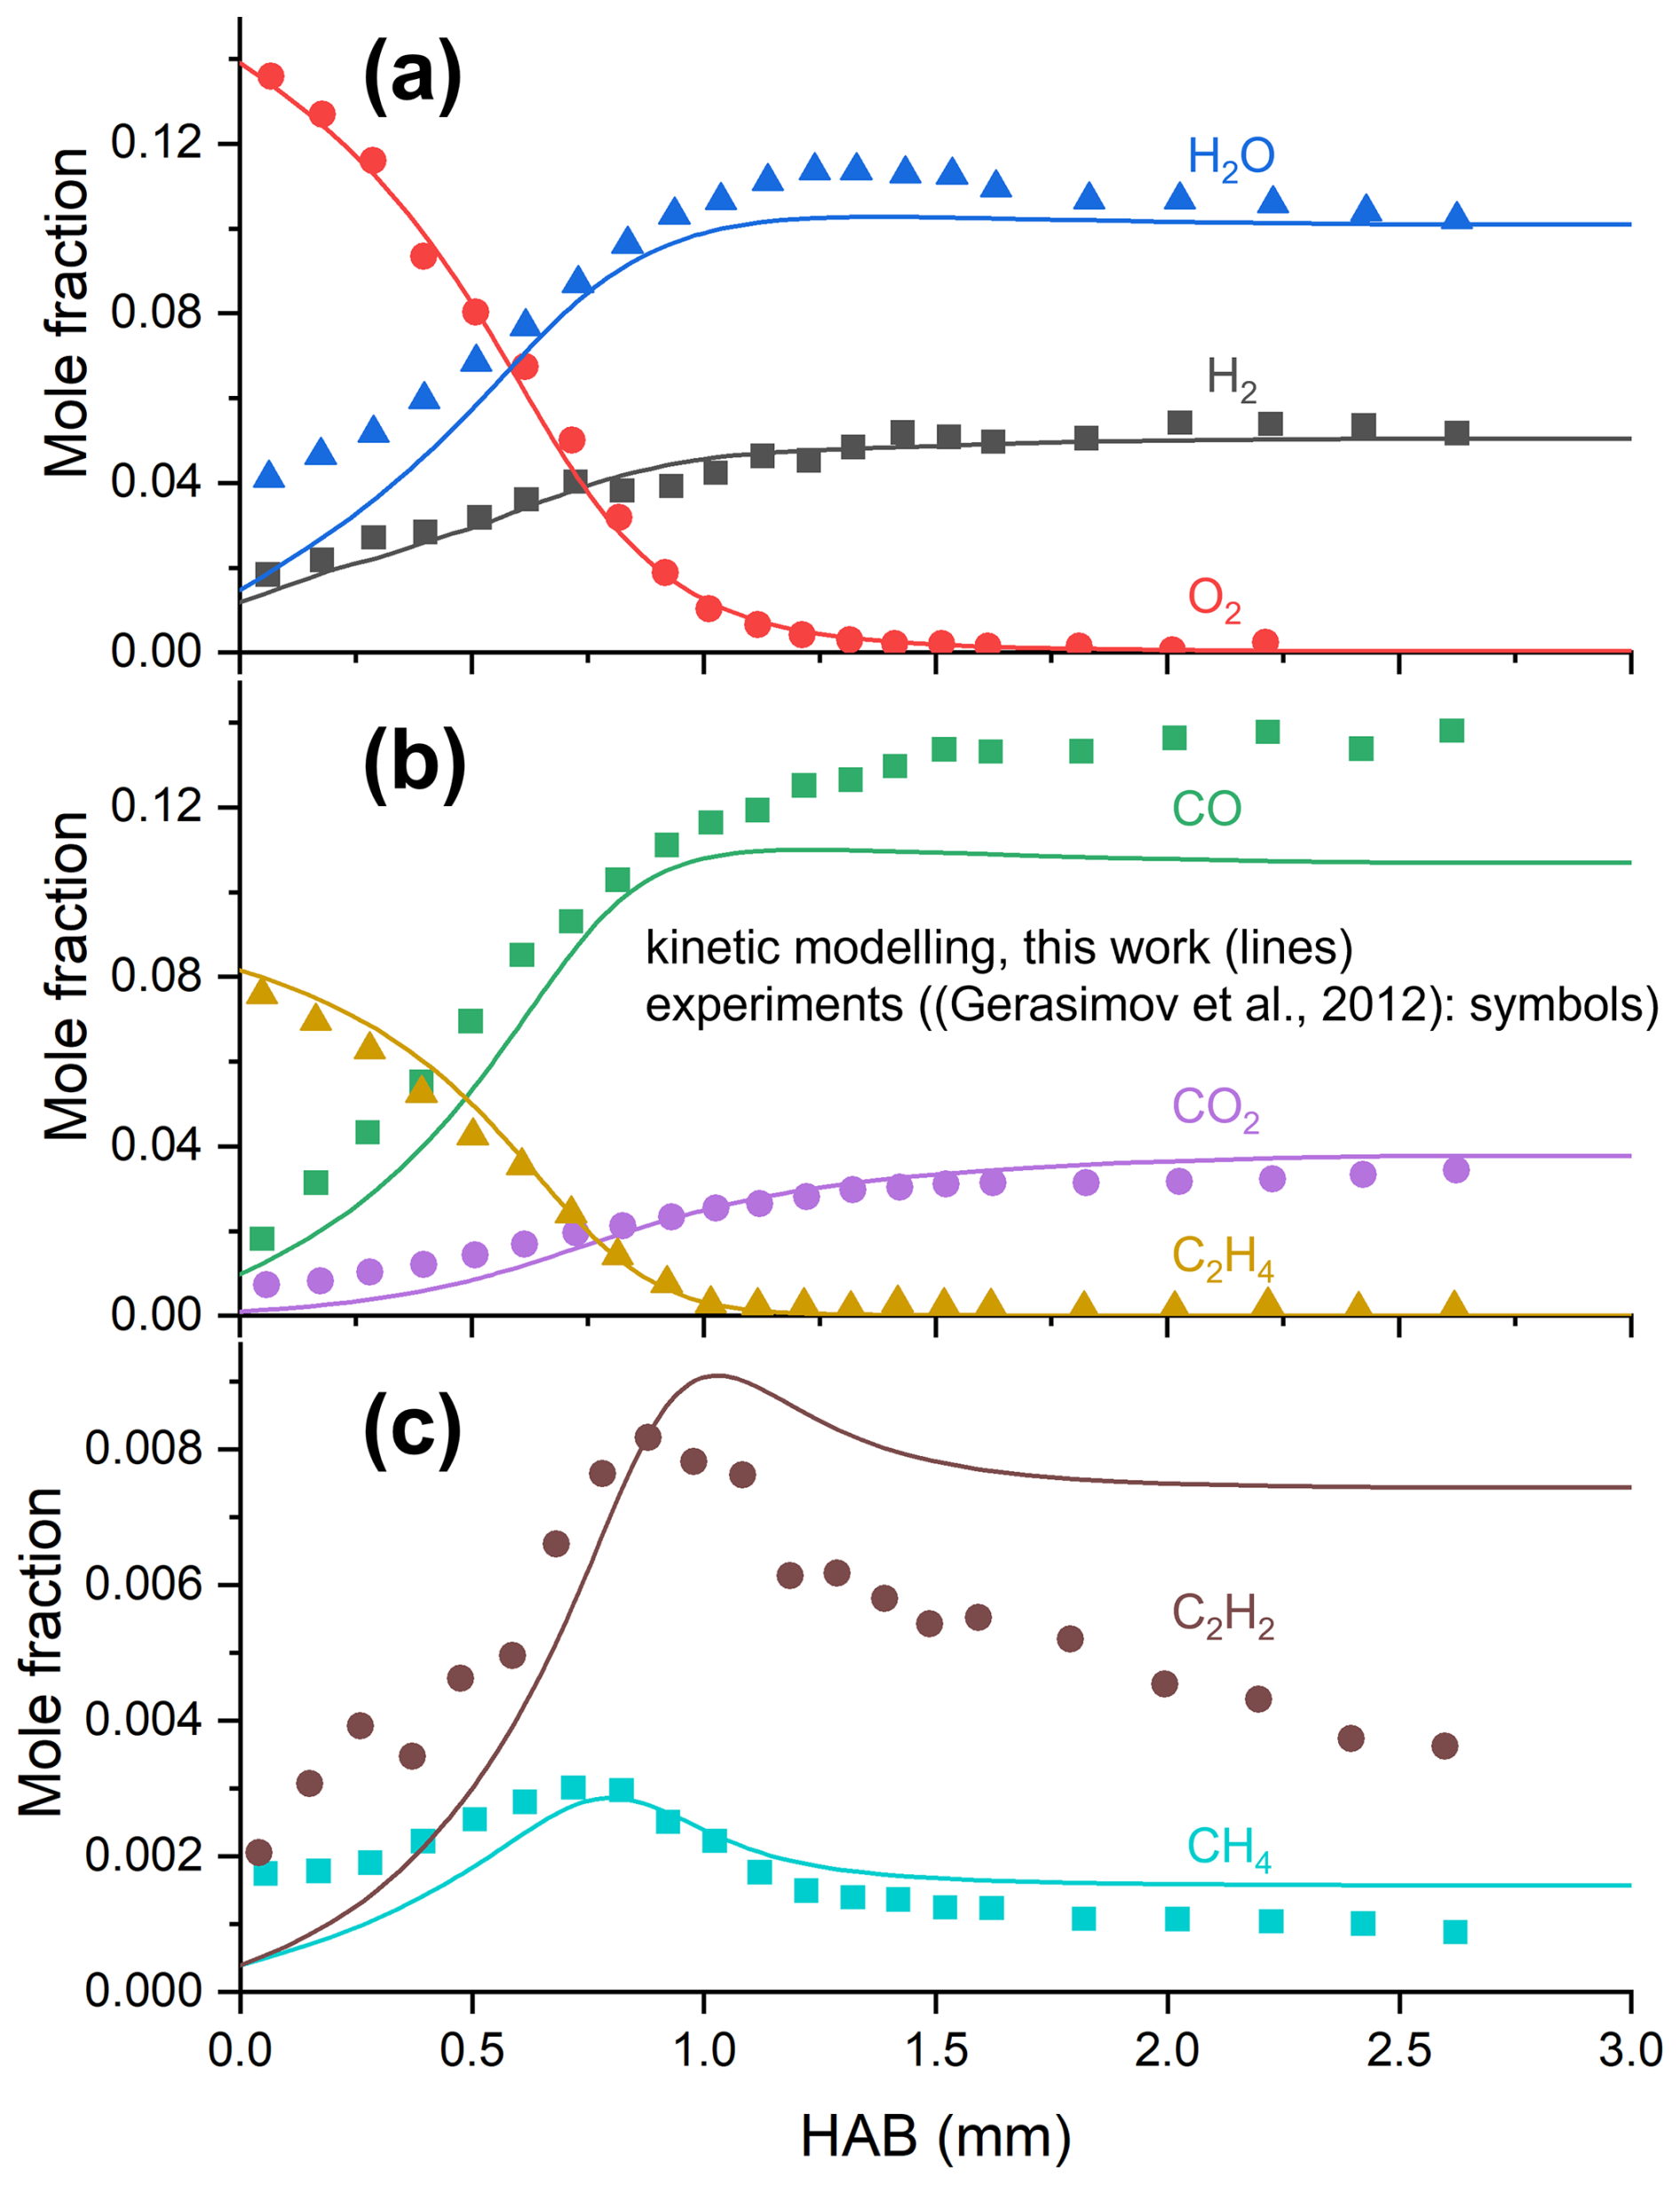
Figure 2Species profiles as a function of the height above the burner, HAB, in the premixed sooting flame (equivalence ratio, Φ=1.7) obtained by experiments (Gerasimov et al., 2012: symbols) and kinetic modeling (lines).
3.1.2 Computational fluid dynamics (CFD) model
Figure 3 shows the CFD-predicted centerline temperature profile (line) as a function of HAB, showing excellent agreement with temperature measurements in BSS flames (Camacho et al., 2015: symbols). The temperature increases abruptly with HAB up to 1 mm and reaches a maximum of approximately 1700 K between HAB = 1–4 mm, before it drops downstream in the flame (HAB > 4 mm) as it approaches the stagnation plate at HAB = 8 mm. The CFD-obtained temperature contour (Fig. 1b) also nicely reproduces the overall shape of the real flame by experiments (Fig. 1a), confirming that the thermal field is described reliably.
3.2 Soot growth by coupled CFD-PD simulations
The coupled CFD-PD model (Eqs. 4–7) tracks the soot number density, carbon concentration, and surface area evolution, accounting for nucleation, surface growth, and coagulation, as described in Sect. 2.3. Figure 4 shows contours of the soot number density, N (Fig. 4a), and volume fraction, fv (Fig. 4b), in the sooting flame for burner-to-stagnation plate separation, Hp, of 8 mm, obtained using the Moss–Brookes nucleation rate and HACA surface growth rate (Model I: baseline model). Although a 2D axisymmetric domain was used, the analysis focuses on the flame centerline, consistently with the 1D approximation of BSS flames (Saggese et al., 2016). Near the burner exit (HAB = 0–1 mm), where the temperature of fresh premixed gas starts to increase as it combusts and intermediate species (such as C2H2) form, limited soot nucleation may occur. However, the soot precursors still form, and nucleation is not yet dominant. Downstream in the flame, at HAB = 1–5 mm, the temperature reaches its maximum, and ethylene decomposes to acetylene and other soot precursors that result in pronounced nucleation and subsequent particle growth.
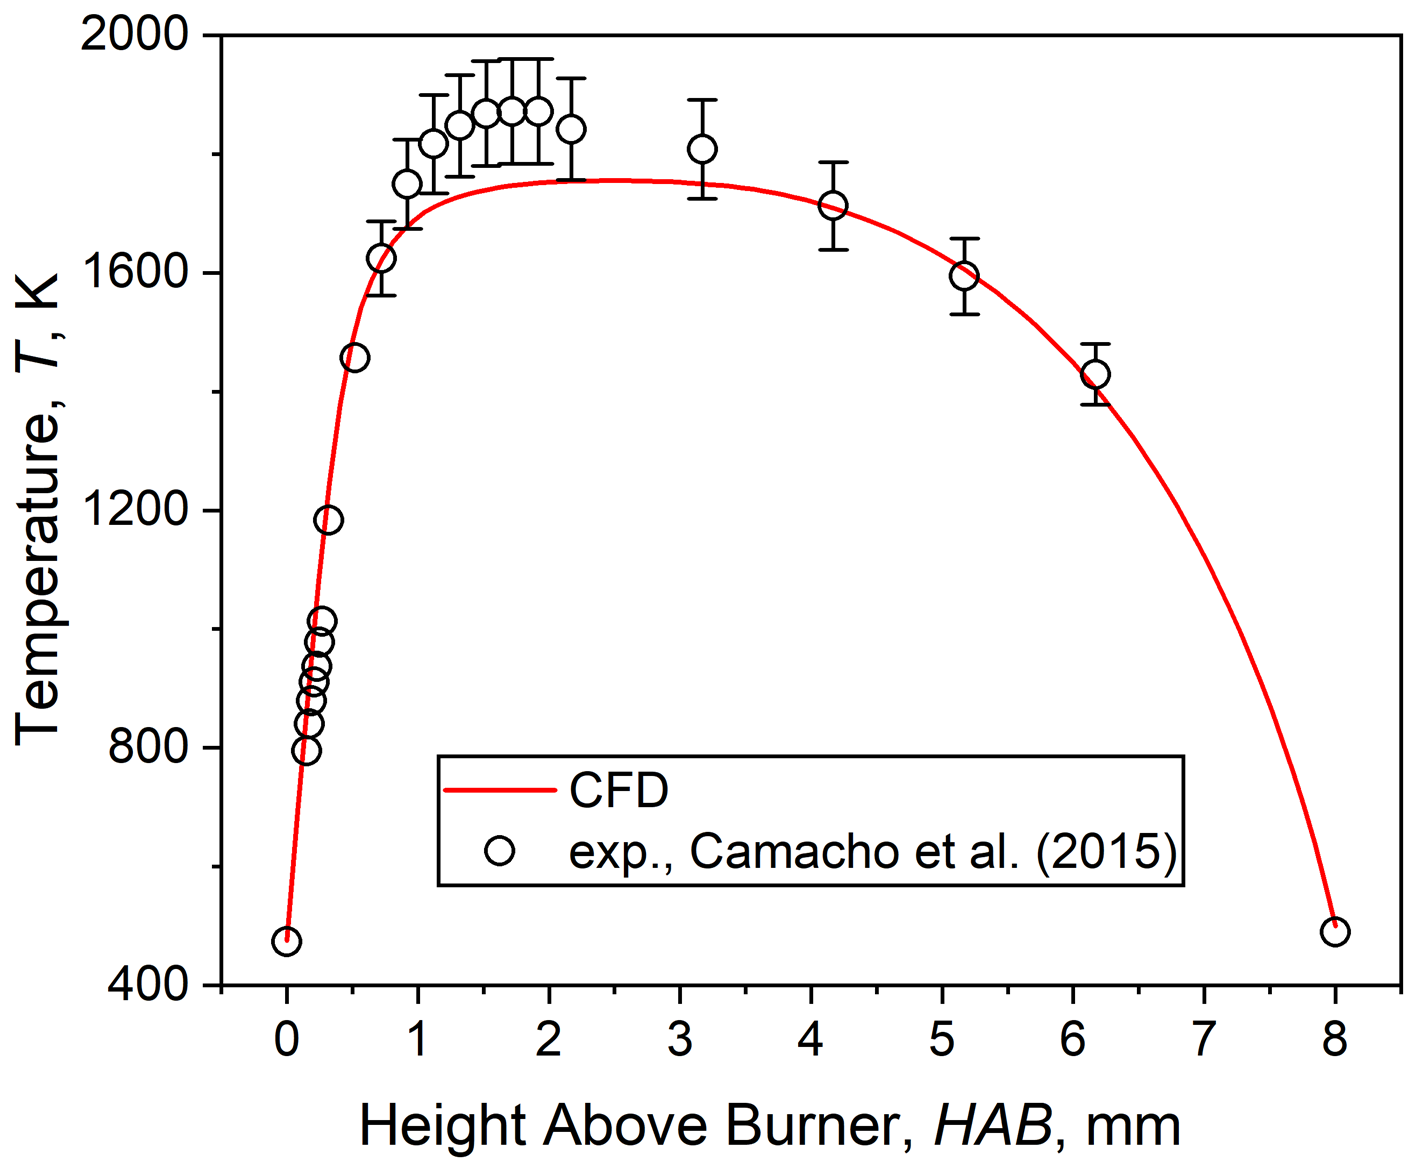
Figure 3Centerline temperature profile as a function of HAB obtained by CFD (line) and experiments (Camacho et al., 2015).
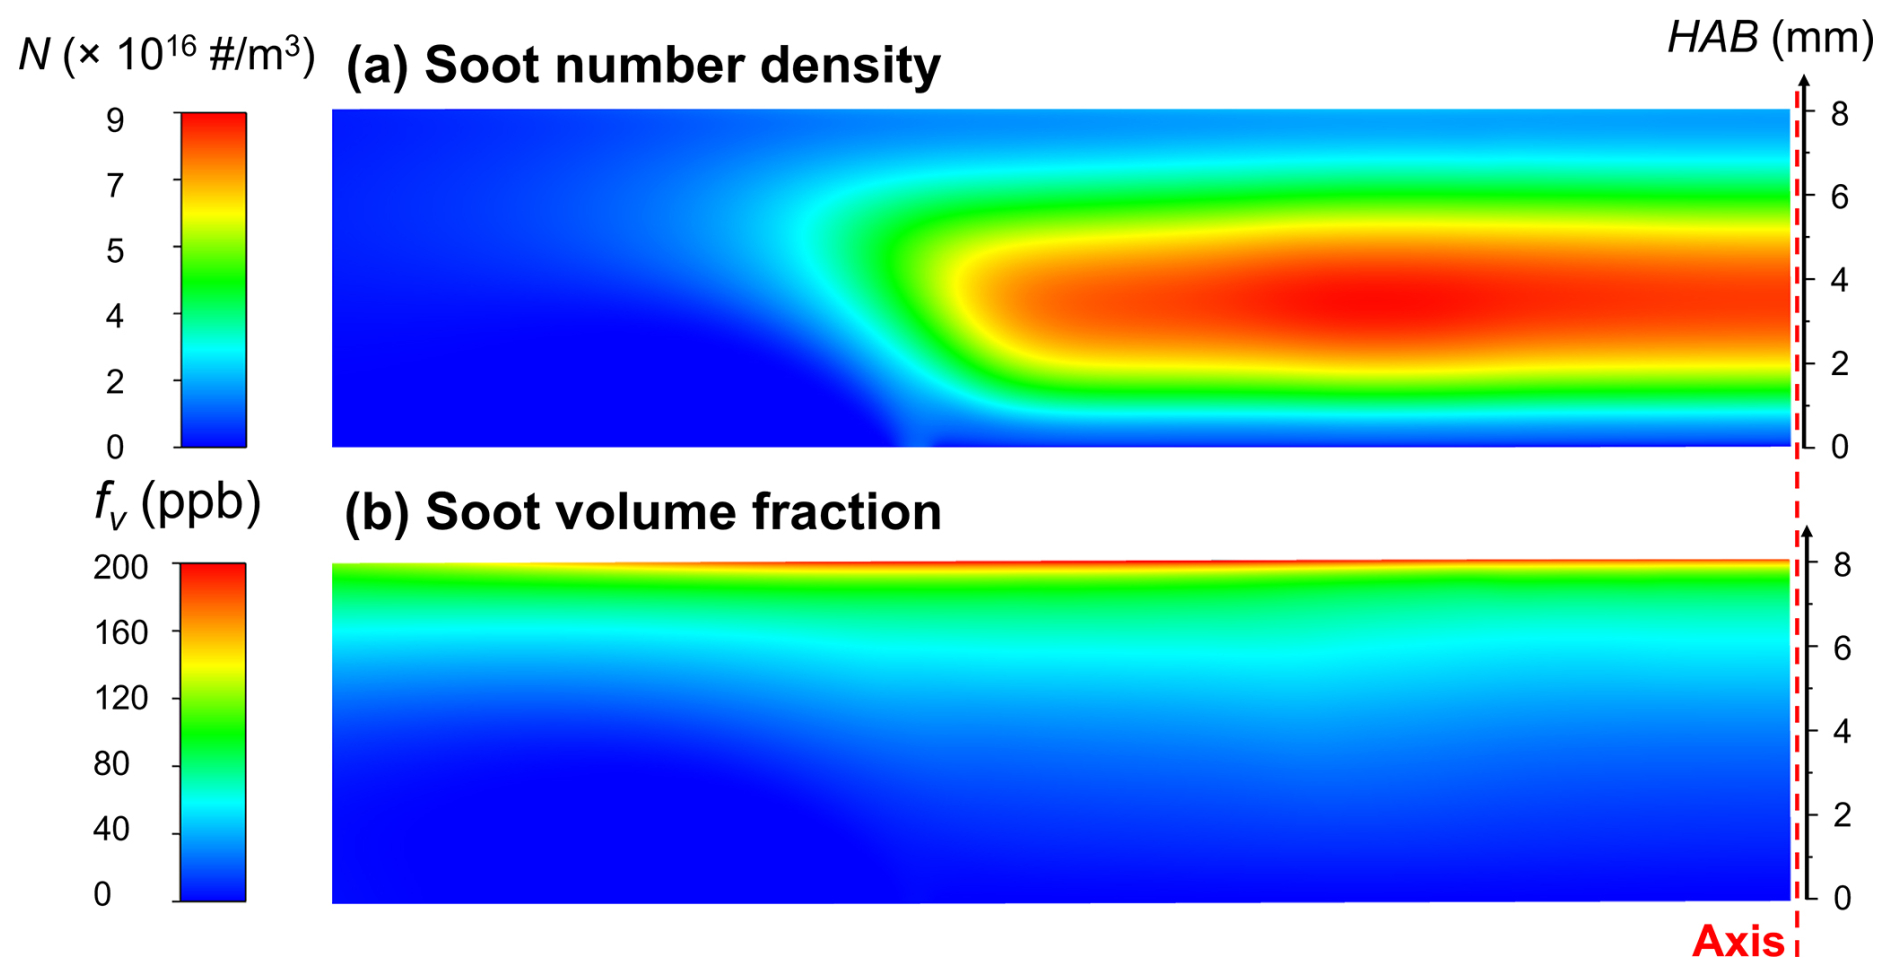
Figure 4Contours of soot (a) number density, N, and (b) volume fraction, fv, in the sooting flame with burner-to-stagnation plate separation of Hp=8 mm (predicted using Model I: Moss–Brookes nucleation and HACA surface growth rates).
The soot number density increases rapidly after the onset of nucleation, reaching a maximum of # m−3 at HAB ≈3.6 mm, while, at HAB > 3.6 mm, it decreases as coagulation takes over (Fig. 4a). In contrast, the soot volume fraction increases continuously downstream in the flame as particle mass grows through reactions of gaseous reactive species with the soot particle surface, even though their number density decreases by coagulation. The highest soot loading is observed close to the stagnation plate (Fig. 4b). Since the probe was positioned along the centerline but not explicitly included in the 2D simulation, its effect was accounted for by shifting the sampling position upstream along the axial direction following the correction of Saggese et al. (2016). The required spatial shift ranges from 1 to 1.6 mm, depending on the burner-to-plate separation, as obtained from the probe effect analysis (Saggese et al., 2016). For this case, the highest soot loading is ∼100 ppm after applying a 1.5 mm shift. This correction was applied to all results to ensure consistency with experiments.
Figure 5 shows the soot number density and soot volume fraction predicted by the CFD-coupled monodisperse PD model using different nucleation and surface growth rates (Table 1: Models I–IV), as well as by the Moss–Brookes soot model implemented in Fluent (Model V) at probe locations, Hp, of 8 and 4 mm above the burner. The results are compared to a 2D CFD–sectional PBE model by Saggese et al. (2016; Table 1: Model VI), who reported N and fv in these two probe locations, and to experiments (Camacho et al., 2015) at the same Hp of the BSS ethylene flame.
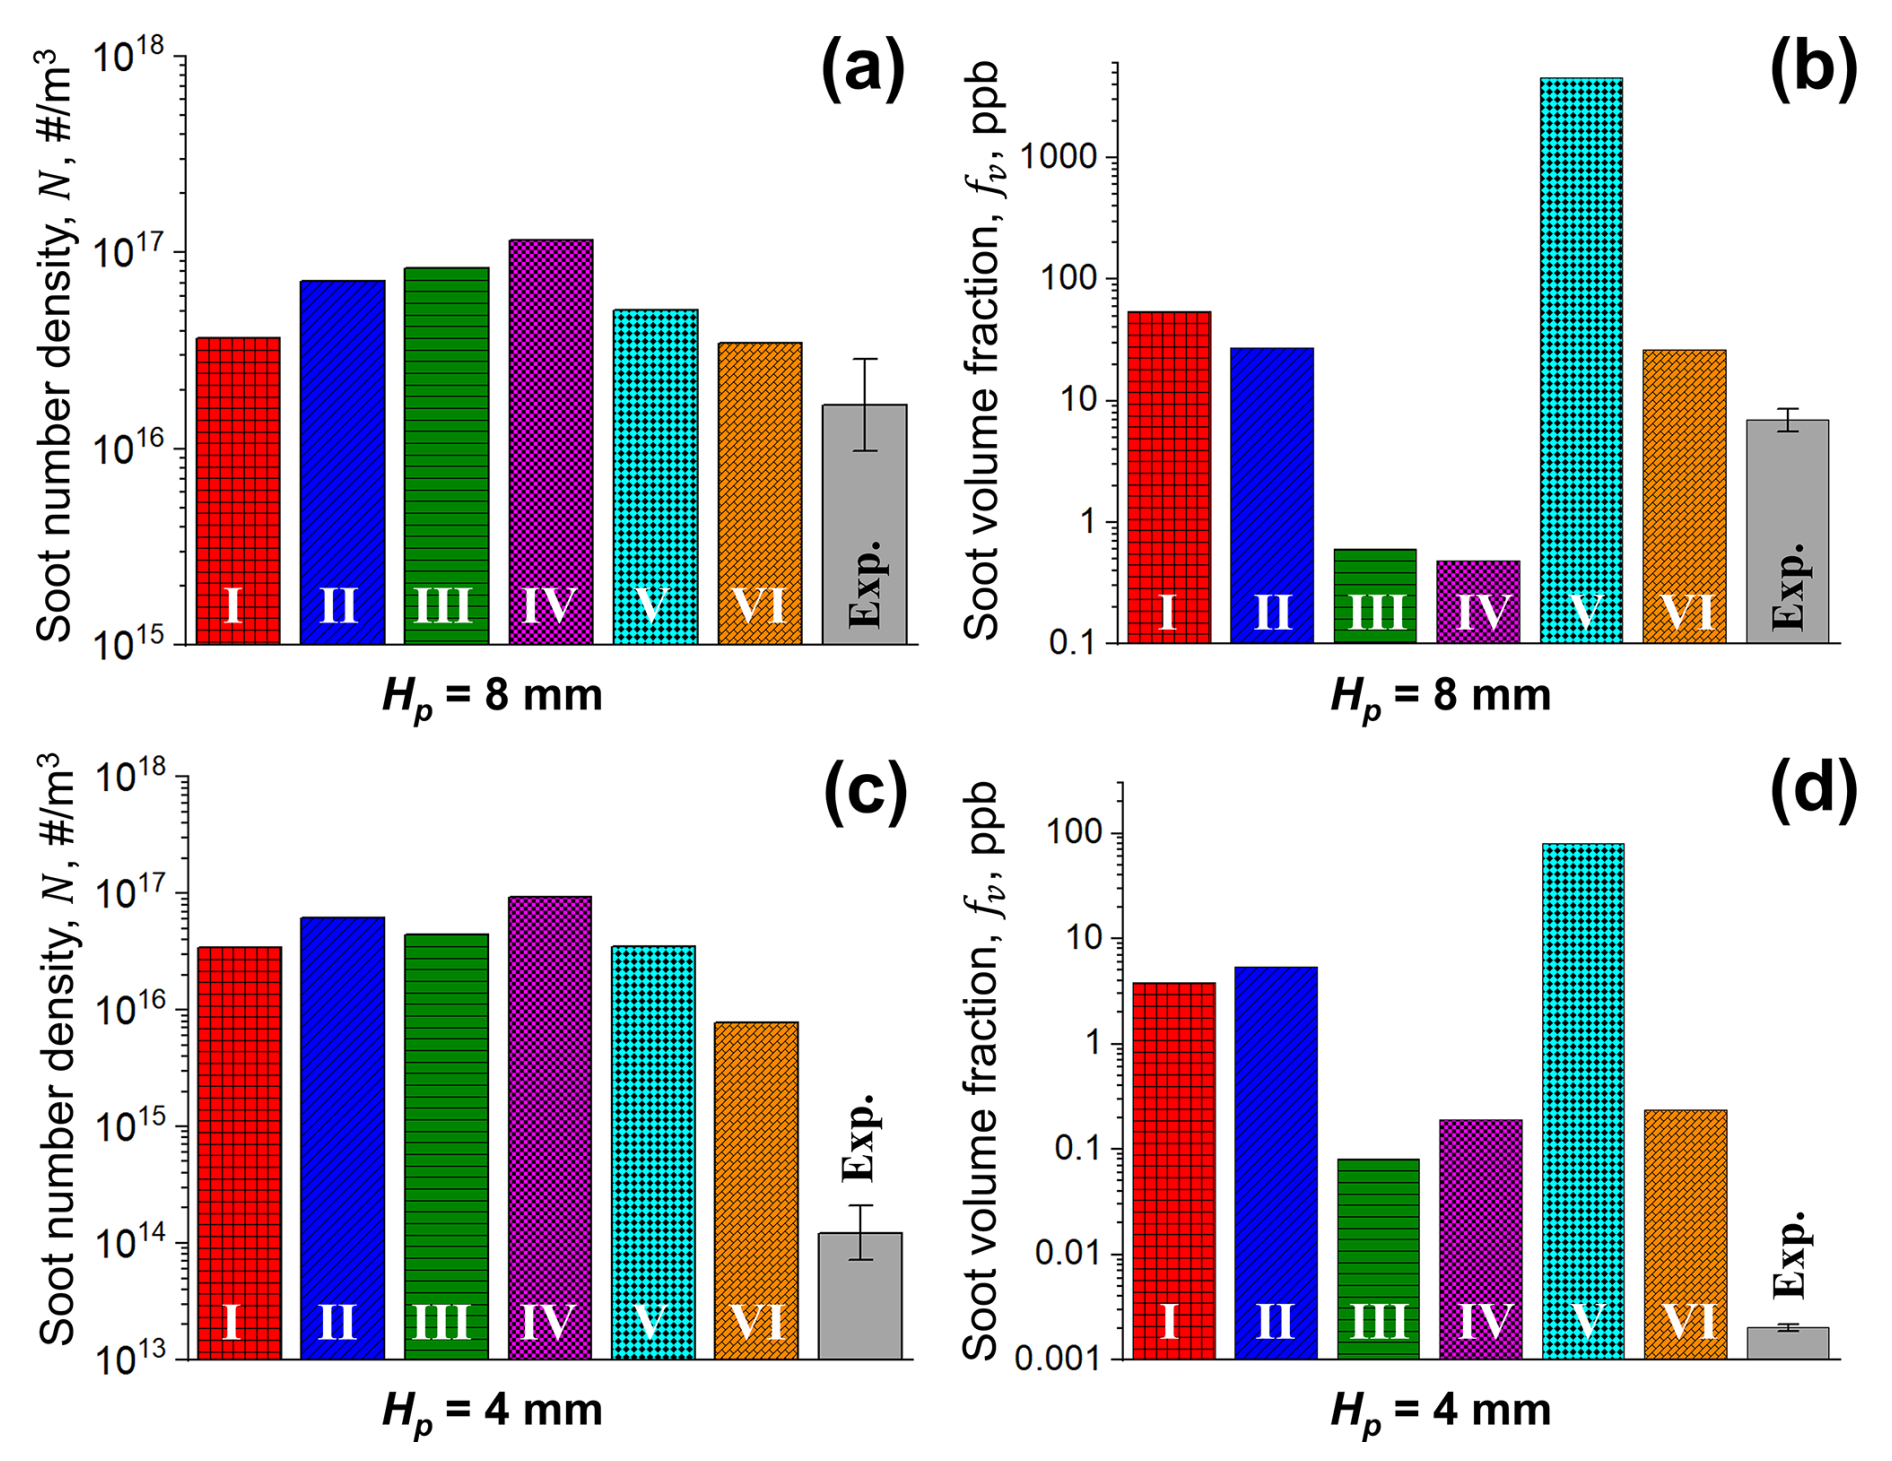
Figure 5(a, c) Soot number density (N) and (b, d) volume fraction (fv) at (a, b) Hp=8 and (c, d) 4 mm obtained by CFD-coupled monodisperse PD with various nucleation and surface growth rates (Models I to IV) and by the Moss–Brookes soot model implemented in Fluent (Model V). The results are compared to a 2D sectional model (Saggese et al., 2016): Model VI) and experiments (Camacho et al., 2015) in the same BSS ethylene flame.
At Hp=8 mm (Fig. 5a), the CFD-coupled monodisperse PD model with the Moss–Brookes nucleation rate and HACA surface growth rate (Model I, baseline) yields # m−3, overpredicting the experimental value of 1.66×10¹⁶ # m−3. However, the prediction is comparable (within ∼6 %) to that reported by Saggese et al. (2016) (Model VI; # m−3). Replacing the nucleation and/or surface growth rates with the MD-derived expressions (Models II–IV) results in higher N values (up to about a factor of 3) relative to Model I, while the differences among all models, including Model V, remain within the experimental uncertainty at this Hp.
The baseline model (Model I) predicts fv=54 ppb (Fig. 5b), which is about twice that obtained from the sectional model (Model VI; fv=26.1 ppb; Saggese et al., 2016) but within 1 order of magnitude of the measured fv of 7 ppb. This indicates that the present framework reproduces soot mass loading with an accuracy comparable to that of detailed sectional modeling. When nucleation is described by the MD-derived rate (Model II), fv decreases down to 28.4 ppb, matching the sectional model prediction within ∼4 % and improving agreement with the measured fv by ∼57 % compared to Model I. Accounting for the MD-derived surface growth rate (Models III and IV) decreases the fv down to 5.7 (Model III) and 3.8 ppb (Model IV), below the measured soot mass loading. The underprediction of fv in Models III and IV, which incorporate the MD-derived surface growth rate, can be attributed to their substantially lower surface growth contribution compared to the baseline model using the HACA mechanism. The carbon addition rate from surface growth, , in these models is almost 2 orders of magnitude lower than in Model I (Fig. S1 in the Supplement), especially across the main soot-forming region (1–7 mm). This reduction in carbon addition explains the lower soot mass predicted by the MD-derived surface growth models.
The Moss–Brookes soot model (Model V) yields # m−3 (Fig. 5a), which is comparable to all of the other models (Models I–IV) considered, yet the corresponding fv (4572 ppb) is nearly 3 orders of magnitude higher than the measured fv and the highest among all models. This overprediction stems from the excessive surface growth contribution (Fig. S1), which is nearly 3 orders of magnitude larger than in the baseline case. These results confirm that surface growth dominates soot mass formation and strongly influences fv predictions, consistently with the literature (Harris and Weiner, 1985).
At Hp=4 mm (Fig. 5c, d), the baseline model yields # m−3 and fv=3.43 ppb, about 1 order of magnitude higher than those obtained by the sectional model ( # m−3 and fv=0.24 ppb) and 2 and 3 orders of magnitude higher than the experimentally measured N of 1.22×10¹⁴ # m−3 and fv of 0.002 ppb. Models II to V show comparable trends for both soot number density and volume fraction, as also observed at Hp=8 mm (Fig. 5a, b). Overall, all models substantially overpredict the experimental data at Hp=4 mm, with deviations of approximately 2 to 3 orders of magnitude for both N and fv.
The performance of the reduced models is assessed across a broader range of burner-to-stagnation plate separations investigated experimentally, as shown in Fig. 6. The results are now compared against the 1D sectional model of Saggese et al. (2015), which employed the same soot sub-model as in 2D simulations (Fig. 5) but covers a wider range of Hp values from 4 to 12 mm. Figure 6 shows (a) the soot number density and (b) soot volume fraction as a function of Hp, as predicted by Models I–V, the 1D sectional model (Model VI: Saggese et al., 2015), and experiments (Camacho et al., 2015). The sectional model (Model V) shows the best agreement with number density and soot volume fraction measurements, outperforming all reduced models, as expected. The soot number density predicted by Models II–V is practically constant across all Hp values. Model I suggests a slight decrease in the soot number concentration with Hp, which is qualitatively consistent with the detail sectional model and in reasonable agreement with measurements (circles) for Hp≥6 mm. At Hp=4 mm, however, all models overpredict N by 2–3 orders of magnitude. This discrepancy has been partially attributed to simplifications made in employed nucleation mechanisms (Hou et al., 2019), even though it may also stem from the presence of sub-2 nm soot nuclei (Fakharnezhad et al., 2026) undetected during measurements by standard butanol- or water-based condensation particle counters (Camacho et al., 2015).
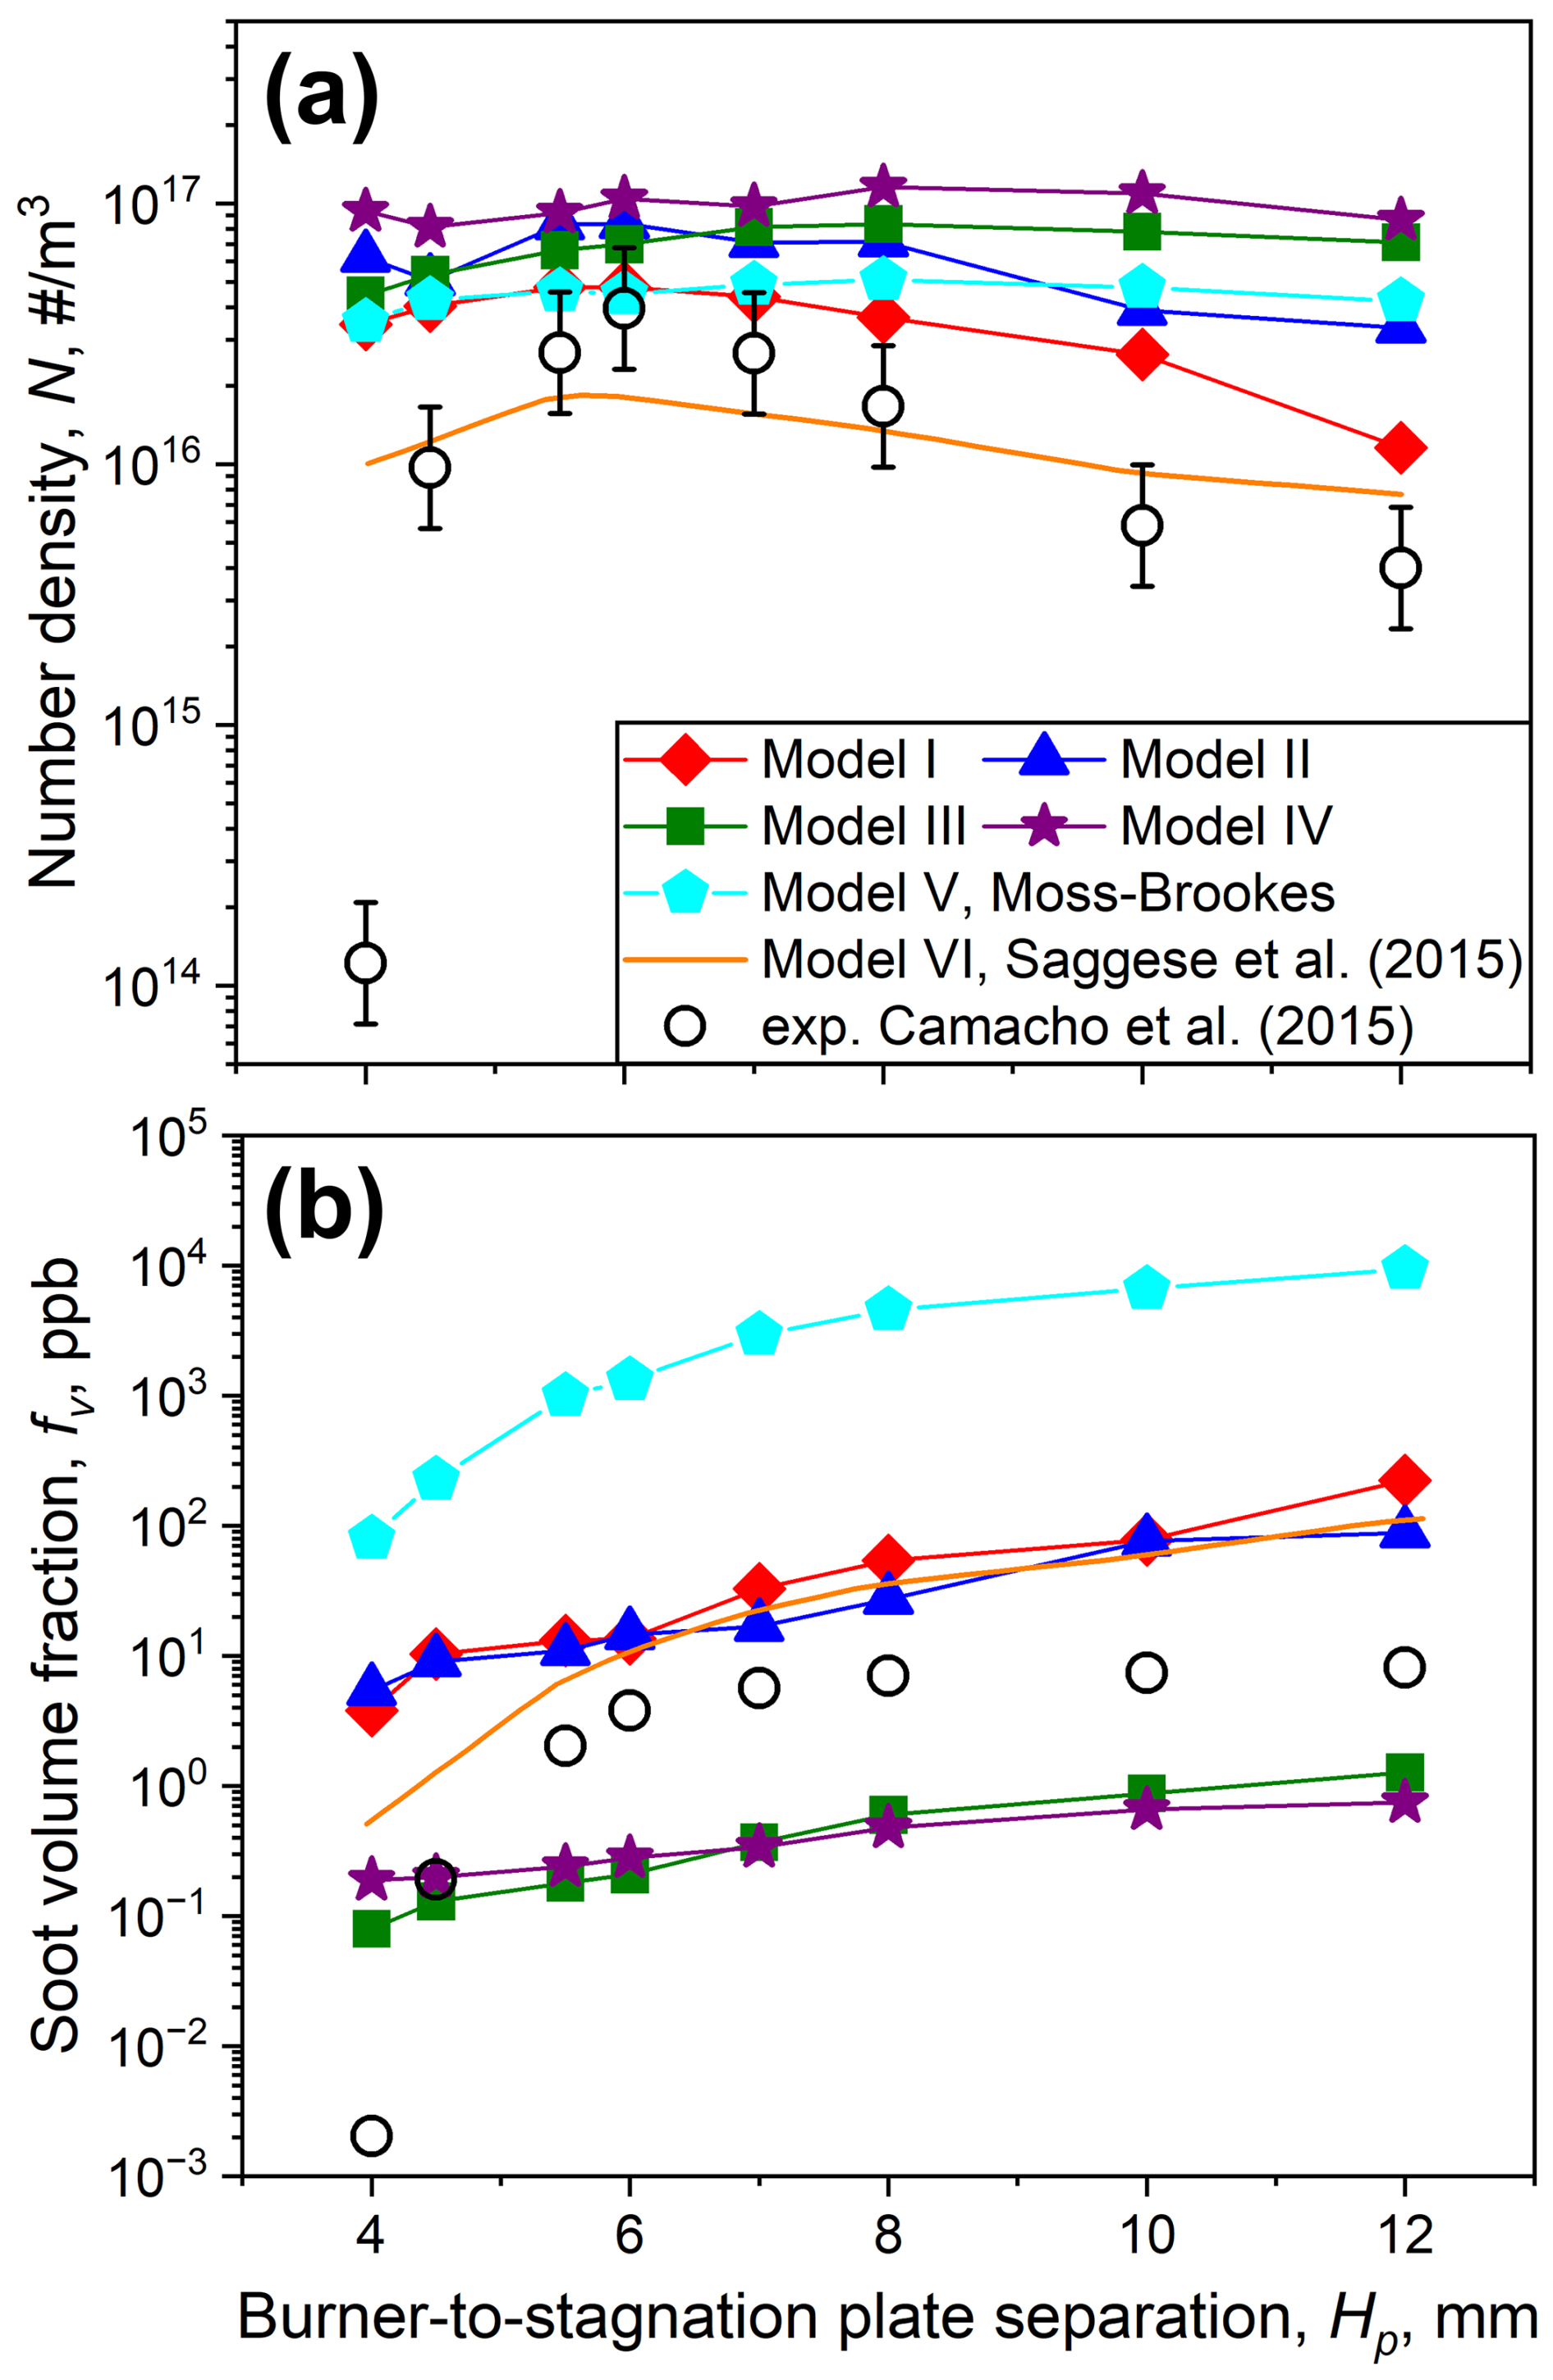
Figure 6(a) Soot number density, N, and (b) volume fraction, fv, as a function of Hp as obtained by CFD-coupled monodisperse PD with various nucleation and surface growth rates (Models I to IV) and by the Moss–Brookes soot model implemented in Fluent (Model V) (filled symbols). The results are compared to 1D sectional model (Model VI: orange line; Saggese et al., 2015) and soot measurements (circles) in ethylene premixed flames (Camacho et al., 2015). The error bars for the measured fv (not shown) are within the symbol size.
Even though all models suggest soot number concentrations comparable to each other (within 1 order of magnitude), they result in distinct soot volume fractions that span over up to 5 orders of magnitude (Fig. 6b). Both Models I and II yield comparable fv predictions, in good agreement with the sectional model (Saggese et al., 2015) and measurements (Camacho et al., 2015) within up to 1 order of magnitude for Hp≥6 mm. In contrast, the Moss–Brookes soot model (Model V) overpredicts the soot volume fraction by nearly 3 orders of magnitude, whereas Models III and IV underpredict the measurements by about 2 orders of magnitude. As previously shown at Hp=8 mm (Fig. S1), this underprediction is caused by the lower carbon addition rate from surface growth, which primarily arises from the fact that the MD-derived effective surface growth rate constant (Goudeli et al., 2026) is approximately 3 times lower than that predicted by the HACA-based correlation of Appel et al. (2000). This slower surface growth rate limits carbon accumulation in the soot phase, resulting in lower soot volume fractions. At Hp=4 mm, all reduced models overpredict the measurements by 2–5 orders of magnitude. Such a significant overprediction is not unique to the low-order modeling framework (Models I–V) as it is observed even with detailed sectional models (Model VI), which has been attributed to incomplete description of soot nucleation PAH chemistry or the assumption of a non-variable density for nascent soot (Hou et al., 2019).
Figure 7 shows the soot mobility diameter, dm, predicted by Models I–IV using the CFD-coupled monodisperse PD framework developed in this study. The volume-equivalent diameter, dv, is also shown as predicted by the Moss–Brookes soot model (Model V), which assumes coagulation by full coalescence, neglecting the formation of particles with fractal-like structure (i.e., ). The model predictions are compared with the average dm from the detailed 1D sectional model (Model VI: orange line) derived from the reported mobility size distributions in Saggese et al. (2015: Fig. 11), as well as with the average dm obtained by scanning mobility particle sizer (SMPS) measurements in premixed ethylene flames (Camacho et al., 2015: symbols). Even though the present PD model does not account for the agglomerate and/or aggregate polydispersity, the mobility-based self-preserving size distribution can be derived based on the average dm (Fig. 7) and the mobility-based self-preserving geometric standard deviation of soot (), obtained by discrete element method simulations (Kelesidis and Goudeli, 2021: Fig. 2). All models capture the expected increase in particle size with increasing burner-to-stagnation plate separation. Similarly to soot volume fraction and number concentration (Fig. 6), the 1D sectional model predicts most accurately the mobility diameter measurements. Among the reduced models, the MD-informed nucleation model (Model II) shows the best agreement with the measured mobility diameters and with the 1D sectional model (Model VI) predictions, especially for Hp≥6 mm, followed by the baseline Model I, which predicts slightly larger diameters at all Hp values. Both Models I and II predict the formation of fractal-like agglomerates (as shown in Fig. S2 for Model II) with , capturing the fractal-like morphology of soot aggregates produced in flames. Models III and IV, which employ the MD-derived surface growth rate, suggest limited particle growth (<3 nm) and nearly spherical particle formation (Ds=2, based on the Ds correlation used in Fakharnezhad et al., 2026) even at large separation distances (Hp≥8 mm). In contrast, Model V overestimates particle size substantially due to the much higher carbon addition during surface growth compared to HACA-based or MD-derived correlations. This model inherently predicts spherical particles as it explicitly assumes coagulation by full coalescence (Brookes and Moss, 1999).
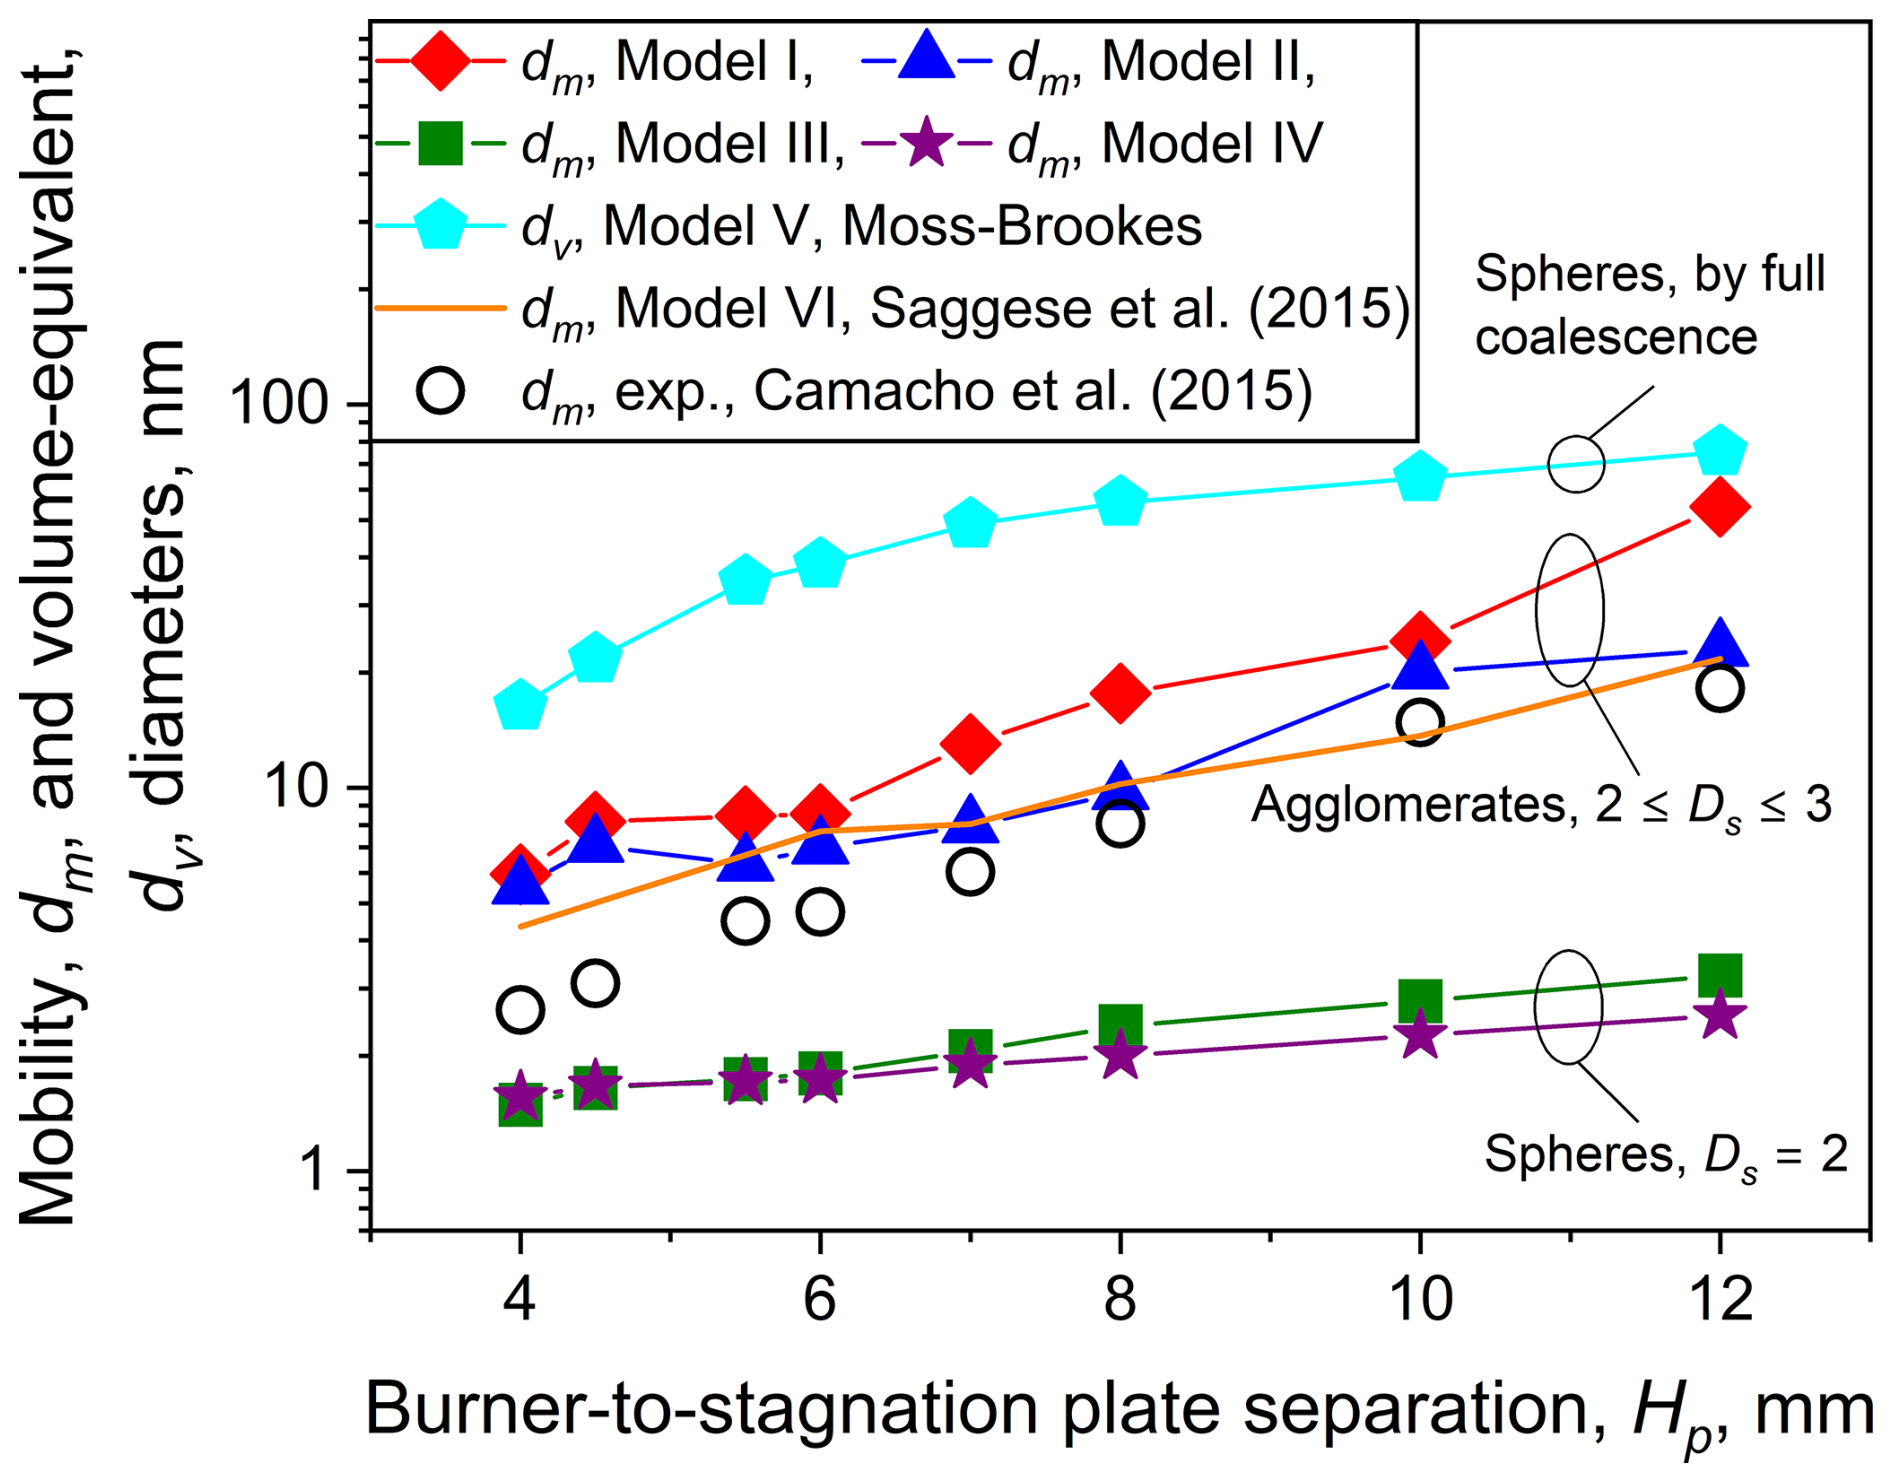
Figure 7Soot mobility diameter (dm) predicted by the CFD-coupled monodisperse PD framework (Models I–IV) and volume-equivalent diameter (dv) predicted by the Moss–Brookes soot model (Model V; full coalescence) (filled symbols). The model predictions are compared to the 1D sectional model (Model VI, Saggese et al., 2015: orange line) and to the average dm from SMPS measurements in premixed ethylene flames (Camacho et al., 2015).
Among the reduced models (Models I–IV), the baseline framework (Model I), accounting for the semi-empirical nucleation rate and the HACA surface growth rate, captures the overall trend of the soot number density (Fig. 6a), volume fraction (Fig. 6b), and particle size (Fig. 7). Accounting for the MD-derived nucleation rate, Model II improves the dm predictions and nicely matches the soot volume fraction and SMPS measurements in this flame. Model II predicts comparable N (within 1 order of magnitude) with the detailed sectional model across all Hp but is outperformed by Models I (Moss–Brookes nucleation rate and HACA-predicted surface growth rate) and V (Moss–Brookes nucleation and surface growth rates). It should be noted that, even though the Moss–Brookes nucleation rate in Model I and the lumped MD-derived nucleation rate employed in Model II cannot capture the level of chemical detail accounted for in sectional models interfaced with chemical kinetic reaction mechanisms, they do capture fv and dm measurements with reasonable accuracy, especially at HAB > 5 mm, at significantly lower computational cost.
A multiscale modeling framework was developed that couples a monodisperse particle dynamics (PD) model with computational fluid dynamics (CFD), describing soot formation and growth in a premixed ethylene burner-stabilized stagnation (BSS) flame. The coupled PD-CFD model, accounting for simultaneous nucleation, surface growth, and coagulation, is used to evaluate the effect of nucleation and surface growth rate equations developed semi-empirically or by molecular dynamics (MD) on the soot number density, volume fraction, and soot mobility diameter. Accounting for the semi-empirical Moss–Brookes nucleation rate and the hydrogen abstraction-carbon addition (HACA) surface growth rate, Model I (baseline) reproduces the soot number density, volume fraction, and particle size measurements reasonably well across the BSS flame. Incorporating the MD-derived nucleation rate and the HACA surface growth model (Model II) further improved soot volume fraction and mobility diameter predictions compared to those obtained by semi-empirical rates, nicely matching measurements and a sectional model with the detailed chemical kinetic mechanism (Saggese et al., 2015) in the post-flame region (Hp≥6 mm). Model II, encompassing the MD-informed nucleation rate, reproduced mobility diameter measurements most accurately among all reduced models and yielded soot volume fractions within 1 order of magnitude from experimental data, outperforming reduced models employing the MD-derived or Moss–Brookes surface growth rates. Even though the developed MD-informed CFD-PD framework does not include the detail accounted for in chemical kinetic mechanisms, it captures the measured fv and dm reasonably well, resulting in even comparable predictions to those by a detailed sectional model in the post-nucleation flame region at significantly lower computational cost. Even though this framework is benchmarked in a premixed ethylene BSS flame where the centerline temperature is mostly within the range in which the MD rate constants were derived, it provides a promising foundation for predictive, design-oriented simulations of combustion and aerosol synthesis systems. Additional benchmarking would be necessary before application to different flame configurations.
| A | Total soot surface area concentration |
| Ap | Pre-exponential factor |
| a | Surface area of a soot particle |
| a0 | Surface area of a primary soot particle |
| C | Total carbon molar concentration |
| Cα | Model constant for soot inception rate |
| Cγ | Model constant for surface growth rate |
| dm | Soot mobility diameter |
| dp | Soot primary particle diameter |
| dv | Soot volume-equivalent diameter |
| Ds | Surface fractal dimension |
| e | Internal energy |
| E | Activation energy |
| F | External body force |
| fv | Soot volume fraction |
| g | Gravitational acceleration vector |
| h | Enthalpy |
| HAB | Height above burner |
| Hp | Burner-to-stagnation plate separation |
| Jj | Diffusion flux of species j |
| keff | Effective thermal conductivity |
| kf | Forward reaction rates of soot with H |
| kb | Backward reaction rates of soot with H |
| MD-derived nucleation rate constant | |
| kMD, SG | MD-derived SG rate constant |
| ks | Surface reaction rate coefficient |
| M | Soot mass fraction |
| MWc | Molar mass of carbon |
| n | Temperature exponent |
| n∗ | Number of carbon atoms within |
| critical nucleus of soot | |
| N | Total particle number density |
| NAv | Avogadro number |
| p | Static pressure |
| R | Universal gas constant |
| Sh | Volumetric heat sources |
| T | Temperature |
| Tα | Activation temperature of soot inception |
| Tγ | Activation temperature of soot surface growth rate |
| v | Axial velocity |
| v | Velocity vector |
| v0 | Volume of a primary soot particle |
| Vk | Diffusion velocity |
| Yk | Mass fraction of species k |
| Greek Letter | |
| α | Fraction of available sites |
| Γk | Effective diffusion coefficient |
| χsoot−H | Total number of available surface sites |
| ρ | Gas density |
| ρsoot | Soot density |
| Viscous stress tensor | |
| σg,m | Mobility-diameter-based geometric |
| standard deviation | |
The data will be made available upon request.
The simulations in this work were carried out using the computational fluid dynamics (CFD) software ANSYS Fluent (Ansys Inc., USA), a proprietary solver available at: https://www.ansys.com/products/fluids/ansys-fluent (last access: 1 July 2026). A physics-based soot population balance model was implemented within the CFD framework via a custom User-Defined Function (UDF). The corresponding UDF source code is openly available at the following GitHub repository: https://doi.org/10.5281/zenodo.21102903 (arashfakharnezhad, 2026).
Figures showing the variation of the carbon addition rate due to surface growth as a function of height above the burner and the evolution of soot particle sizes (primary and mobility diameters) with burner-to-stagnation plate separation can be found in the Supplement. The supplement related to this article is available online at https://doi.org/10.5194/ar-4-279-2026-supplement.
AF: writing (original draft), visualization, validation, software, methodology, formal analysis, data curation, conceptualization. JDB: writing (review and editing), methodology, supervision. EG: writing (review and editing), supervision, software, resources, methodology, conceptualization.
At least one of the (co-)authors is a member of the editorial board of Aerosol Research. The peer-review process was guided by an independent editor, and the authors also have no other competing interests to declare.
Publisher's note: Copernicus Publications remains neutral with regard to jurisdictional claims made in the text, published maps, institutional affiliations, or any other geographical representation in this paper. The authors bear the ultimate responsibility for providing appropriate place names. Views expressed in the text are those of the authors and do not necessarily reflect the views of the publisher.
We thank Benedetta Franzelli for the insightful discussions that contributed to this work. This work was supported by the University of Melbourne Computing Services and the National Computational Infrastructure (NCI Australia).
This research has been supported by the University of Melbourne through Melbourne Research Scholarship.
This paper was edited by Jonas Elm and reviewed by two anonymous referees.
Appel, J., Bockhorn, H., and Frenklach, M.: Kinetic modeling of soot formation with detailed chemistry and physics: laminar premixed flames of C2 hydrocarbons, Combust. Flame, 121, 122–136, https://doi.org/10.1016/S0010-2180(99)00135-2, 2000.
arashfakharnezhad: arashfakharnezhad/soot-udf-fluent: soot-udf-fluent (soot-udf-fluent), Zenodo [code], https://doi.org/10.5281/zenodo.21102904, 2026.
Batchelor, G. K.: An introduction to fluid dynamics, Cambridge university press, https://doi.org/10.1017/CBO9780511800955, 2000.
Brookes, S. J. and Moss, J. B.: Predictions of soot and thermal radiation properties in confined turbulent jet diffusion flames, Combust. Flame, 116, 486–503, https://doi.org/10.1016/S0010-2180(98)00056-X, 1999.
Buesser, B., Grohn, A. J., and Pratsinis, S. E.: Sintering Rate and Mechanism of TiO(2) Nanoparticles by Molecular Dynamics, J. Phys. Chem. C Nanomater Interfaces, 115, 11030–11035, https://doi.org/10.1021/jp2032302, 2011.
Camacho, J., Liu, C., Gu, C., Lin, H., Huang, Z., Tang, Q., You, X., Saggese, C., Li, Y., Jung, H., Deng, L., Wlokas, I., and Wang, H.: Mobility size and mass of nascent soot particles in a benchmark premixed ethylene flame, Combust. Flame, 162, 3810–3822, https://doi.org/10.1016/j.combustflame.2015.07.018, 2015.
Chen, B., Liu, D., and Liu, M.: Combining Langevin dynamics and CFD-PBM model to predict TiO2 nanoparticle evolution during aerosol synthesis, Appl. Therm. Eng., 230, https://doi.org/10.1016/j.applthermaleng.2023.120702, 2023.
Chen, D. and Luo, K. H.: Reactive sites on the surface of polycyclic aromatic hydrocarbon clusters: A numerical study, Combust. Flame, 211, 362–373, https://doi.org/10.1016/j.combustflame.2019.09.034, 2020.
Fakharnezhad, A., Kelesidis, G. A., Berry, J. D., and Goudeli, E.: Nucleation, surface growth and coagulation of soot by hierarchical modeling, Powder Technol., 469, https://doi.org/10.1016/j.powtec.2025.121747, 2026.
Fakharnezhad, A., Saad, D. M., Kelesidis, G. A., and Goudeli, E.: Nucleation rate of carbonaceous nanoparticles by n-heptane pyrolysis at high pressure and temperature via molecular dynamics simulations, Aerosol Sci. Technol., 59, 1137–1150, https://doi.org/10.1080/02786826.2025.2480625, 2025.
Frenklach, M.: Reaction mechanism of soot formation in flames, Phys. Chem. Chem. Phys., 4, 2028–2037, https://doi.org/10.1039/b110045a, 2002.
Frenklach, M. and Wang, H.: Detailed modeling of soot particle nucleation and growth, Symposium (International) on Combustion, 23, 1559–1566, https://doi.org/10.1016/s0082-0784(06)80426-1, 1991.
Gerasimov, I. E., Knyazkov, D. A., Yakimov, S. A., Bolshova, T. A., Shmakov, A. G., and Korobeinichev, O. P.: Structure of atmospheric-pressure fuel-rich premixed ethylene flame with and without ethanol, Combust. Flame, 159, 1840–1850, https://doi.org/10.1016/j.combustflame.2011.12.022, 2012.
Goudeli, E.: Nanoparticle growth, coalescence, and phase change in the gas-phase by molecular dynamics, Curr. Opin. Chem. Eng., 23, 155–163, https://doi.org/10.1016/j.coche.2019.04.001, 2019.
Goudeli, E., Eggersdorfer, M. L., and Pratsinis, S. E.: Coagulation-agglomeration of fractal-like particles: structure and self-preserving size distribution, Langmuir, 31, 1320–1327, https://doi.org/10.1021/la504296z, 2015.
Goudeli, E., Eggersdorfer, M. L., and Pratsinis, S. E.: Coagulation of Agglomerates Consisting of Polydisperse Primary Particles, Langmuir, 32, 9276–9285, https://doi.org/10.1021/acs.langmuir.6b02455, 2016.
Goudeli, E., Ganguly, A., Kelesidis, G., Fakharnezhad, A., and Roy, S.: Surface growth rate of soot by reactive Molecular Dynamics, SSRN Electronic J., https://doi.org/10.2139/ssrn.6348218, 2026.
Harris, S. J. and Weiner, A. M.: Chemical-Kinetics of Soot Particle Growth, Annu. Rev. Phys. Chem., 36, 31–52, https://doi.org/10.1146/annurev.physchem.36.1.31, 1985.
Hou, D., Lindberg, C. S., Manuputty, M. Y., You, X., and Kraft, M.: Modelling soot formation in a benchmark ethylene stagnation flame with a new detailed population balance model, Combust. Flame, 203, 56–71, https://doi.org/10.1016/j.combustflame.2019.01.035, 2019.
Hulburt, H. M. and Katz, S.: Some problems in particle technology: A statistical mechanical formulation, Chem. Eng. Sci., 19, 555–574, https://doi.org/10.1016/0009-2509(64)85047-8, 1964.
Johnson, P. R., Chakrabarty, R. K., and Kumfer, B. M.: A modeling approach for soot formation in non-premixed flames with elevated stoichiometric mixture fraction, Combust. Flame, 229, 111383, https://doi.org/10.1016/j.combustflame.2021.02.029, 2021.
Kazakov, A. and Frenklach, M.: Reduced Reaction Sets based on GRI-Mech 1.2 (DRM19 and DRM22), University of California, Berkeley [code], http://combustion.berkeley.edu/drm/ (last access: 20 May 2026), 1995.
Kee, R. J., Coltrin, M. E., and Glarborg, P.: Chemically reacting flow: theory and practice, John Wiley & Sons, https://doi.org/10.1002/0471461296, 2003.
Kelesidis, G. A. and Goudeli, E.: Self-preserving size distribution and collision frequency of flame-made nanoparticles in the transition regime, P. Combust. Inst., 38, 1233–1240, https://doi.org/10.1016/j.proci.2020.07.147, 2021.
Kelesidis, G. A., Goudeli, E., and Pratsinis, S. E.: Flame synthesis of functional nanostructured materials and devices: Surface growth and aggregation, P. Combust. Inst., 36, 29–50, https://doi.org/10.1016/j.proci.2016.08.078, 2017.
Kholghy, M. R. and Kelesidis, G. A.: Surface growth, coagulation and oxidation of soot by a monodisperse population balance model, Combust. Flame, 227, 456–463, https://doi.org/10.1016/j.combustflame.2021.01.010, 2021.
Kholghy, M. R., Kelesidis, G. A., and Pratsinis, S. E.: Reactive polycyclic aromatic hydrocarbon dimerization drives soot nucleation, Phys. Chem. Chem. Phys., 20, 10926–10938, https://doi.org/10.1039/c7cp07803j, 2018.
Kruis, F. E., Kusters, K. A., Pratsinis, S. E., and Scarlett, B.: A Simple Model for the Evolution of the Characteristics of Aggregate Particles Undergoing Coagulation and Sintering, Aerosol Sci. Technol., 19, 514–526, https://doi.org/10.1080/02786829308959656, 1993.
Mao, Q., van Duin, A. C. T., and Luo, K. H.: Formation of incipient soot particles from polycyclic aromatic hydrocarbons: A ReaxFF molecular dynamics study, Carbon, 121, 380–388, https://doi.org/10.1016/j.carbon.2017.06.009, 2017.
Michelsen, H. A.: Probing soot formation, chemical and physical evolution, and oxidation: A review of in situ diagnostic techniques and needs, P. Combust. Inst., 36, 717–735, https://doi.org/10.1016/j.proci.2016.08.027, 2017.
Mitchell, P. and Frenklach, M.: Particle aggregation with simultaneous surface growth, Phys. Rev. E, 67, 061407, https://doi.org/10.1103/PhysRevE.67.061407, 2003.
Patterson, R. I. A. and Kraft, M.: Models for the aggregate structure of soot particles, Combust. Flame, 151, https://doi.org/10.1016/j.combustflame.2007.04.012, 2007.
Ranzi, E., Frassoldati, A., Grana, R., Cuoci, A., Faravelli, T., Kelley, A. P., and Law, C. K.: Hierarchical and comparative kinetic modeling of laminar flame speeds of hydrocarbon and oxygenated fuels, Prog. Energ. Combust., 38, 468–501, https://doi.org/10.1016/j.pecs.2012.03.004, 2012.
Saggese, C., Cuoci, A., Frassoldati, A., Ferrario, S., Camacho, J., Wang, H., and Faravelli, T.: Probe effects in soot sampling from a burner-stabilized stagnation flame, Combust. Flame, 167, 184–197, 10.1016/j.combustflame.2016.02.013, 2016.
Saggese, C., Ferrario, S., Camacho, J., Cuoci, A., Frassoldati, A., Ranzi, E., Wang, H., and Faravelli, T.: Kinetic modeling of particle size distribution of soot in a premixed burner-stabilized stagnation ethylene flame, Combust. Flame, 162, 3356–3369, https://doi.org/10.1016/j.combustflame.2015.06.002, 2015.
Schulz, F., Commodo, M., Kaiser, K., De Falco, G., Minutolo, P., Meyer, G., Andrea, D., and Gross, L.: Insights into incipient soot formation by atomic force microscopy, P. Combust. Inst., 37, 885–892, 2019.
Sharma, A., Mukut, K. M., Roy, S. P., and Goudeli, E.: The coalescence of incipient soot clusters, Carbon, 180, 215–225, https://doi.org/10.1016/j.carbon.2021.04.065, 2021.
Trivanovic, U. and Pratsinis, S. E.: Opinion: Eliminating aircraft soot emissions, Aerosol Research, 2, 207–223, https://doi.org/10.5194/ar-2-207-2024, 2024.
Wang, C.: The Development and Implementation of a Population Balance Method-Based Soot Model in Diffusion Flames, UNSW Sydney, https://doi.org/10.26190/unsworks/22045, 2020.
Xiong, Y. and Pratsinis, S. E.: Formation of agglomerate particles by coagulation and sintering – Part I. A two-dimensional solution of the population balance equation, J. Aerosol Scie., 24, https://doi.org/10.1016/0021-8502(93)90003-R, 1993.