the Creative Commons Attribution 4.0 License.
the Creative Commons Attribution 4.0 License.
 | 20 Feb 2026
UFP, BC, and PM2.5 measurements and the effect of dispersion conditions on concentration levels in a residential area affected by wood smoke pollution from domestic heating during the winter months
Frederik Weis
Sebastian Kohler
Achim Dittler
The monitoring of ultrafine particle concentrations in ambient air is gaining relevance within the revision of the EU Ambient Air Quality Directive. A prominent source of ultrafine particles (UFPs) is combustion processes (e.g., within the scope of wood-fired domestic heating), where the particle emission is typically led unfiltered into the environment, contributing significantly to local air pollution. In this study, ultrafine particle concentrations were measured in a residential area affected by wood smoke pollution during the winter months (20 November 2024–30 March 2025) using a diffusion-charge-based UFP monitor (AQ Guard Smart 2000 from Palas®). The measurements show a diurnal trend, where concentrations are significantly increased (e.g., > 10 000 cm−3) above the background level (approx. 5000 cm−3) during the morning (approx. 08:00 CET) and evening hours (approx. 19:00–22:00 CET), whereby the source is wood smoke from the surrounding neighborhood. The dispersion conditions significantly affect the measured concentrations as, in the case of low (or zero) wind speeds only, increased UFP concentrations are obtained, demonstrating the relevance of local sources (wood stove operations) in relation to air quality. In the context of “good-practice statements” offered by the World Health Organization's Air Quality guidelines, the maximum daily 1 h mean concentration of 20 000 cm−3 is exceeded on approx. 33.6 % of days during the measurement period. This significant peak exposure on smaller timescales requires monitoring at a high temporal resolution as longer averaging periods (e.g., daily or annual mean concentrations) do not reflect temporal peak concentrations that can be especially dangerous for high-risk groups. There is no direct link between legally relevant particulate matter (e.g., PM2.5) and ultrafine particle concentrations as the size distribution of the wood smoke emission is in the nanometer region and does not contribute significantly to mass-based particulate matter concentrations.
- Article
(5569 KB) - Full-text XML
-
Supplement
(1140 KB) - BibTeX
- EndNote


While there has been significant progress towards improving air quality and implementing air quality monitoring across the globe, air pollution is still a major factor in relation to health issues and premature deaths (WHO, 2021). Especially in developing countries, smog in cities and traffic hotspots is a regular occurrence significantly impacting the life of the corresponding population (Amin et al., 2024; Le Huong et al., 2024; Mohan et al., 2024; Moreno Camacho et al., 2025). When it comes to the European Union, measures to improve air quality have shown a positive effect over the last few decades; however, there is still room for improvement, and recommendations regarding particulate matter concentrations proposed by the World Health Organization (WHO) in 2021 are not necessarily being met universally across the European Union. Only recently was the Ambient Air Quality Directive revised in order to approach past recommendations set by the World Health Organization in 2005 (European Union, 2024; WHO, 2005). In the context of particulate pollutants, the limits for PM10 and PM2.5 mean annual concentrations, as well as maximum mean daily concentrations and the number of exceedance days, have been lowered for the year 2030 according to Table 1. Furthermore, a new focus is set on “pollutants of emerging concern”, which are only rarely monitored by official government monitoring stations, such as ultrafine particles (UFPs) and black carbon (BC). Ultrafine particles are suspected to be especially hazardous due to their ability to penetrate deep into the human body, yet the direct evidence of many studies remains inconclusive (Ohlwein et al., 2019). These pollutants (among others, for example, the size distribution of UFPs and oxidative potential) now have to be monitored by so called “supersites” to gather more data and to better evaluate health effects. While the monitoring of UFPs and BC is becoming mandatory, there are no specified limits for these pollutants in the directive.
Table 1Limits and recommendations for particulate pollutants by the WHO (2021) and the European Union (2024). The values in italics are the values valid for 11 December 2026.
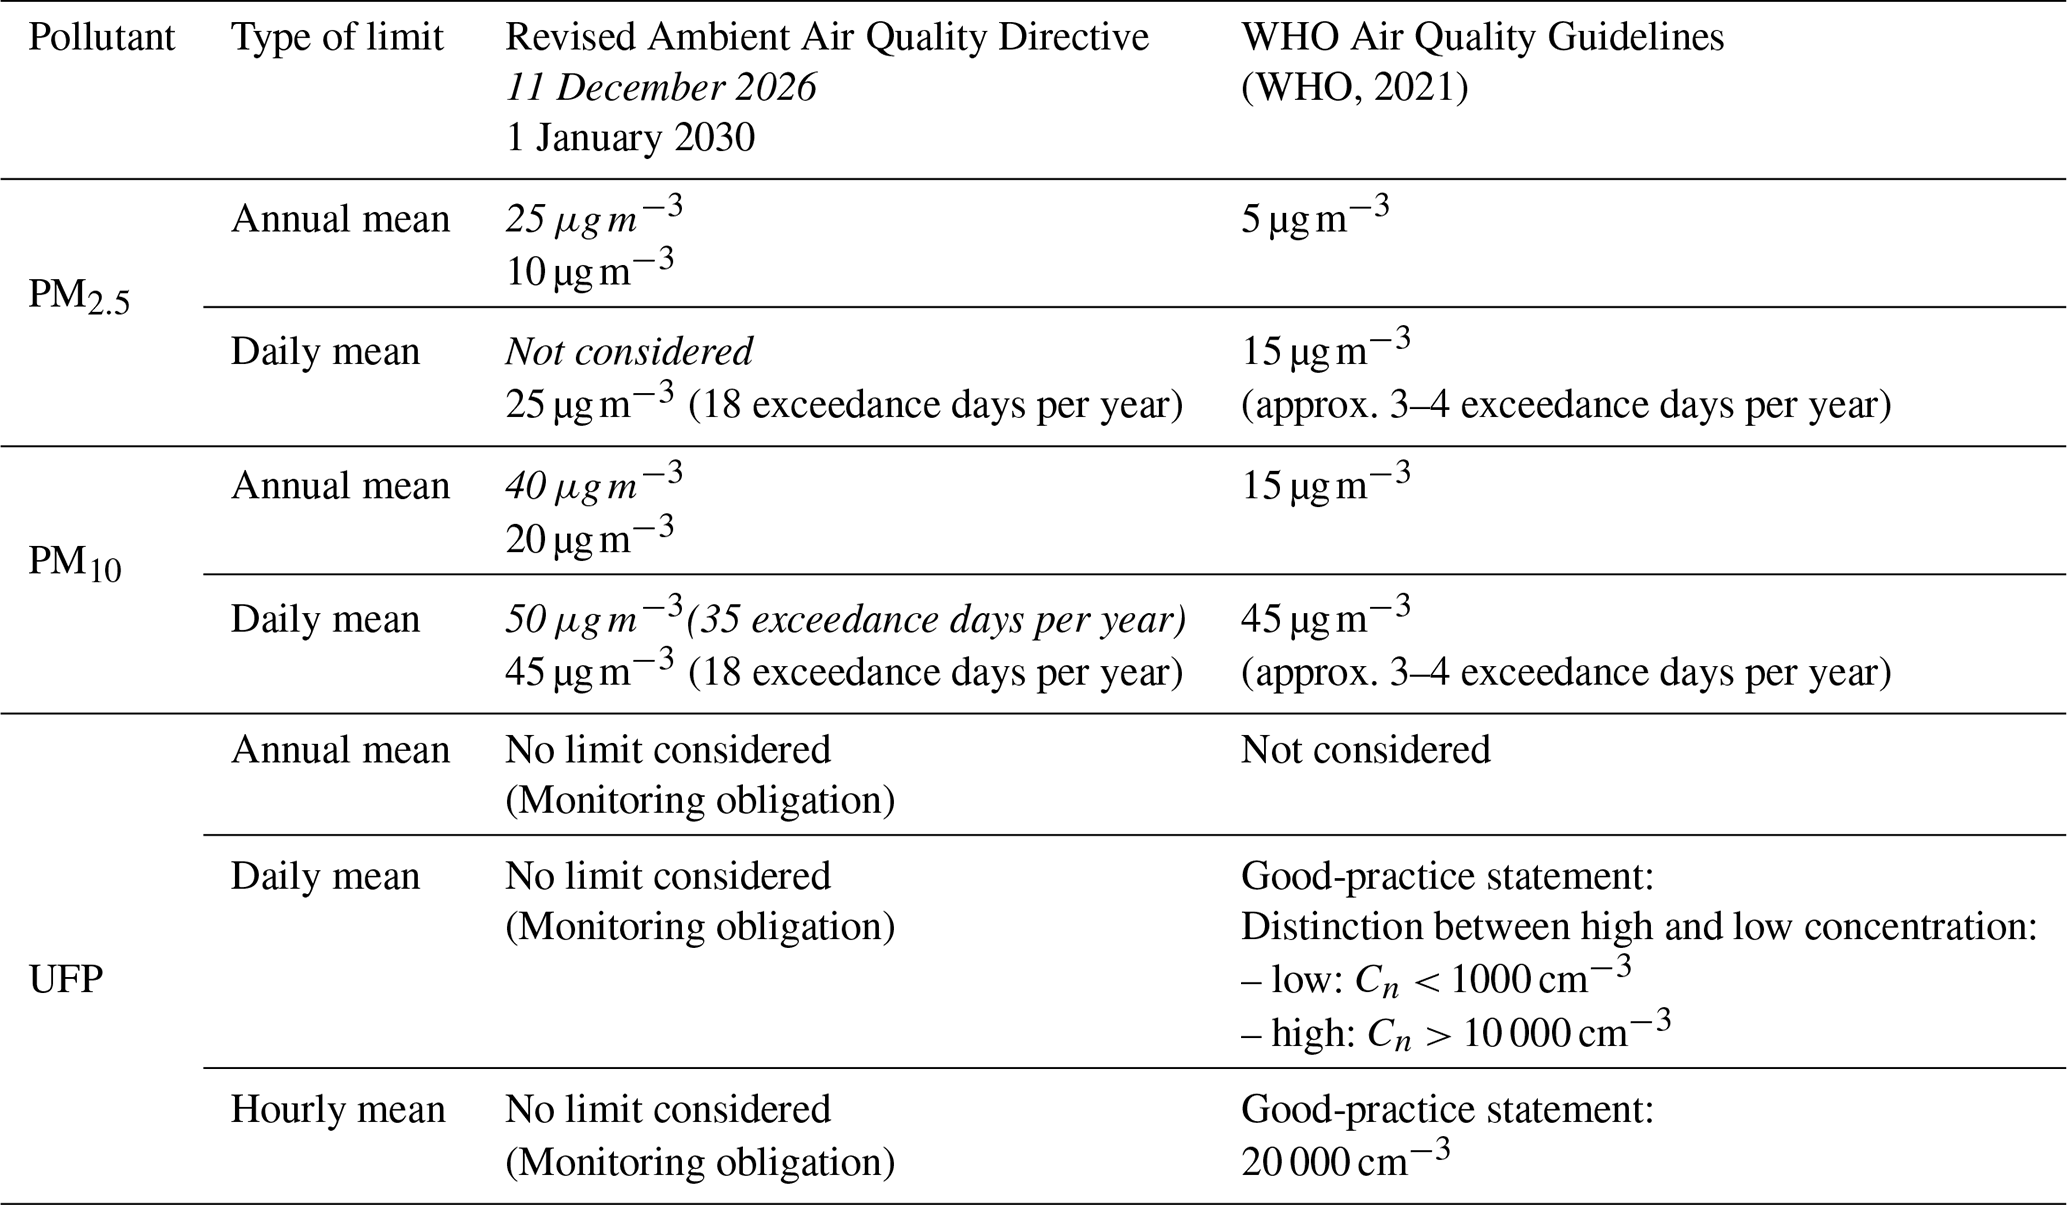
A universal limit for UFP would be difficult to implement as there is no wide-spread measurement (yet), and the natural formation of UFPs due to atmosphere chemistry can vary for different locations and result in different background levels and temporal behavior (e.g., particle growth; new particle formation) that would have to be considered in the context of quantitative UFP limits (e.g., Bianchi et al., 2016; Dunne et al., 2016; Marten et al., 2022; Pierce and Adams, 2007; Shrivastava et al., 2024). Nonetheless, the World Health Organization does offer some “good-practice statements” when it comes to ultrafine particle concentrations (Table 1). It can be assumed that the specified concentrations relate to hazardous substances (e.g., black carbon, anthropogenic UFPs) due to the possibility of non-hazardous high “background” concentrations as a result of the specified atmospheric processes.
Two different 24 h mean concentration levels are specified, whereby concentrations of up to 1000 cm−3 are considered to be “low” and concentration levels exceeding 10 000 cm−3 are considered to be “high” and should therefore be avoided to prevent long-term health effects. In addition to these daily means, a 1 h maximum mean concentration of 20 000 cm−3 is specified in the good-practice statements that reflects short-term exposure to UFPs. This averaging period (1 h) is rather unconventional for particulate pollutants, where the shortest averaging period (PMx fine-dust limit) is 24 h. For short averaging periods, concentration spikes that occur within limited time frames are much more significant and require measurement technologies and data evaluation with sufficient temporal resolution (Thieringer et al., 2022). This is especially relevant due to the fluctuating nature of ultrafine particles that are easily carried by wind and can occur due to secondary organic aerosol formation and coagulation.
In general (though unique regulation, e.g., for small member states, may apply), each member state has to provide one supersite at an urban/suburban background location for every 1×10⁶ inhabitants of the country and one supersite at a rural background location for each 100 000 km2 area. The spatial resolution of these measurements is therefore limited, and only several important sources of ultrafine particles and black carbon of ambient air quality (e.g., traffic, industry) may be covered by the supersites. A supersite should be located downwind of the main wind direction of a relevant pollution source. There are many prominent anthropogenic sources for ultrafine particles that are considerably more harmful compared to the natural formation of UFPs due to atmosphere chemistry. In the literature, many studies focus on air pollution with UFPs in urban environments and traffic (e.g., Dall'Osto et al., 2013; Garcia-Marlès et al., 2024a, b; Kumar et al., 2023; Samad et al., 2022; Trechera et al., 2023; Wang et al., 2011; Zhu et al., 2002).
One major source is combustion processes, where solid or liquid fuels can cause the release of large amounts of soot, ash, and other toxic substances (e.g., secondary organic aerosols) into the atmosphere (Nyarku et al., 2021). Indoor sources linked to human activity are commonly studied in exposure assessments (Jeong et al., 2019; Turner et al., 2024). The penetration of particles from outdoor into indoor spaces can dictate the indoor background level and have a major impact on long-term exposure to pollutants (Matson, 2005). In many industrial sites (e.g., during metalworking processes), worker protection from UFPs is an important aspect (Elihn and Berg, 2009; Brouwer et al., 2004). In the automotive and industrial sector, waste gas cleaning (e.g., (fabric) filters, electrostatic precipitators, diesel and gasoline particle filters) can be applied to lower the particle emission of these processes significantly so that they do not contribute to air pollution as significantly (Bächler et al., 2024a; Hammer et al., 2024). Due to the efficiency of waste-gas-cleaning technologies and the introduction of EURO norms for vehicles, the impact of traffic-related exhaust emissions on ambient air quality has decreased (Garcia-Marlès et al., 2024b; German National Academy of Sciences Leopoldina, 2019). As a consequence, non-exhaust emissions like brake and tire wear are gaining relevance in the automotive sector (Beddows et al., 2023). Air traffic and airports are additional prominent sources or hotspots for ultrafine particles typically featured in the literature, whereby the transport of the pollutants plays a major role (Chen et al., 2010; Dröge et al., 2024; Ridolfo et al., 2024; Stacey, 2019; Trebs et al., 2023; Tremper et al., 2022; Yin et al., 2024). The role of aerosol transport has also been demonstrated by Junkermann and Vogel (2022) during aerial measurements, in which plumes emitted from industrial firing plants at large heights were transported over long distances.
Areas that are comparably rarely featured in official measurements are residential areas in rural or suburban background locations (Dada et al., 2025). The role of wood-fired domestic heating in ambient air quality was shown in a past study for the heating period of 2022–2023 in a German town (Bächler et al., 2024b). Bari et al. (2009) investigated the relevance of wood smoke pollution in relation to PM10 in a residential area, and Thieringer et al. (2022) highlighted the relevance of short-term concentration peaks in the context of wood smoke pollution from domestic heating. Particularly during the evening hours, wood stoves are used for heating in individual homes, and the resulting exhaust negatively impacts ambient air quality. The exposure relevance of residential areas is important since high-risk groups (e.g., children, elderly) often stay in close proximity to their homes, and wood stove operation and the corresponding pollution fall into the evening hours, where people are spending time at home. Furthermore, ultrafine particles or aerosols from domestic heating are suspected to have a higher toxicity compared to, e.g., traffic sources (Utinger et al., 2025), though this, of course, depends on the exact origin of the particles (e.g., exhaust vs. non-exhaust emissions of cars). As an example, brake wear can cause the emission of and exposure to heavy metals (Neukirchen et al., 2025) that are very harmful to human health. In any case, the exposure to wood smoke can show damaging health effects due to a large variety of potential gaseous and solid organic substances (Dilger et al., 2023).
The significance of domestic heating in relation air quality is also addressed in the revision of the EU Ambient Air Quality Directive as, e.g., if certain fine-dust limits cannot be reached before the specified deadline of 2030 without replacing significant fractions of existing (wood-fired or fossil-fuel-related) domestic heating systems, it is possible to postpone the deadline until compliance with the new limits becomes mandatory. While this procedure is reasonable since the replacement of heating systems can be a large financial investment for individual people, the impact of domestic heating on air quality is still an important issue, and studies of such are not featured as visibly compared to studies relating to more prominent pollution sources (e.g., traffic or air traffic). Gravimetrical fine-dust limits (compare Table 1) are known to not properly reflect air pollution with ultrafine particles, which are predominantly emitted by wood fires and the corresponding wood stoves (Trojanowski and Fthenakis, 2019; Wang et al., 2020). Thus, there is a dissonance with regard to the particle emission (as well as particle emission limits for wood stoves that also relate to gravimetric concentrations) and particle size of the air pollutants. For smaller firing plants, e.g., for domestic heating, waste gas cleaning is not mandatory, and the exhaust aerosol is led unfiltered into the environment as the cost of gas-cleaning technologies (here, primarily electrostatic precipitators) and the lack of regulation do not promote wide-spread application. Blauer Engel, the German ecolabel, identifies “clean” wood stoves and sets voluntary limits for mass- (15 mg m−3) and number-based (3 000 000 cm−3) particle emissions (Blauer Engel, 2025). Within German regulations, such number-based limits are not considered, and only gravimetrical concentrations are relevant, whereby the concentrations are higher compared to the ecolabel (e.g., 40 mg m−3 for most types of wood stoves; 20 mg m−3 for pellet stoves with water compartments, 30 mg m−3 for pellet stoves without water compartments; values obtained from Bundesministerium für Justiz und Verbraucherschutz, Bundesamt für Justiz, 2010, for installations after the year 2014).
While the step towards number-based concentrations as limits for the emissions of combustion processes addresses the dissonance between the emission limit and the actual emitted size distribution, the number concentration limit to be awarded the Blauer Engel label is still high considering the mitigation potential that would be achievable with sophisticated waste-gas-cleaning technology such as proper filtration systems (Mylläri et al., 2026; Bächler et al., 2024a; Schiller and Schmid, 2015; Matthes et al., 2016). The efficiencies of electrostatic precipitators are comparably low considering the high particle number concentrations from the combustion process. Cornette et al. (2024) reported number-based collection efficiencies of an electrostatic precipitator for wood stoves of 83 %–92 %. Mukherjee et al. (2024) reported mass-based removal efficiencies of approx. 70 % that were linked to an increase in ultrafine particle emissions. Bürger and Riebel (2022) reported separation efficiencies of electrostatic precipitators in similar ranges for high-temperature processes.
As such, the effect on ambient air quality from wood smoke emissions can be significant and is subject to many external factors such as the dispersion conditions (e.g., wind speed and direction), as well as the geometry of the surrounding buildings in the residential area (Blocken et al., 2011; Teutscher et al., 2025). The relevance of strong local sources in relation to ambient air quality was demonstrated by Norra et al. (2023) during (indicative) air quality measurements using a bicycle in an urban environment that was heavily influenced by local sources outside the scope of official ambient air quality monitoring. A similar situation exists in residential areas, where many temporal local sources (in the case of this study, wood smoke) can contribute to air pollution.
This publication presents measurements of the concentration of ultrafine particles in a residential area for a large fraction of the heating period of the years 2024–2025, where wood smoke from domestic heating significantly affects ambient air quality. A diffusion-charge-based measurement device is used; this type of devices has shown great potential for indicative stationary and mobile measurements (Asbach et al., 2024). The data are evaluated at a high temporal resolution and are discussed in the context of the good-practice statements offered by the World Health Organization. In addition to UFP concentration measurements, the effect of pollutant dispersion on the measured particle concentration is characterized.
2.1 Description of residential area and measurement setup
The measurements were performed in the rural German town of Stutensee (approx. 25 000 inhabitants split among several districts; 45.68 km2 area) close to the city of Karlsruhe. Figure 1 gives an overview of the residential area, as well as of the measurement setup, which was expanded (e.g., addition of BC and wind measurement) compared to a previous publication featuring exploratory measurements for the heating period of 2022–2023 (Bächler et al., 2024b). The measurement devices were installed on the first-floor balcony of a garage of one of the buildings at a height of approx. 4 m. There was some obstruction (e.g., wall on the east side) that could influence the wind measurement to some degree; however, no explicit wind shielding was employed, and there was no significant surrounding vegetation.
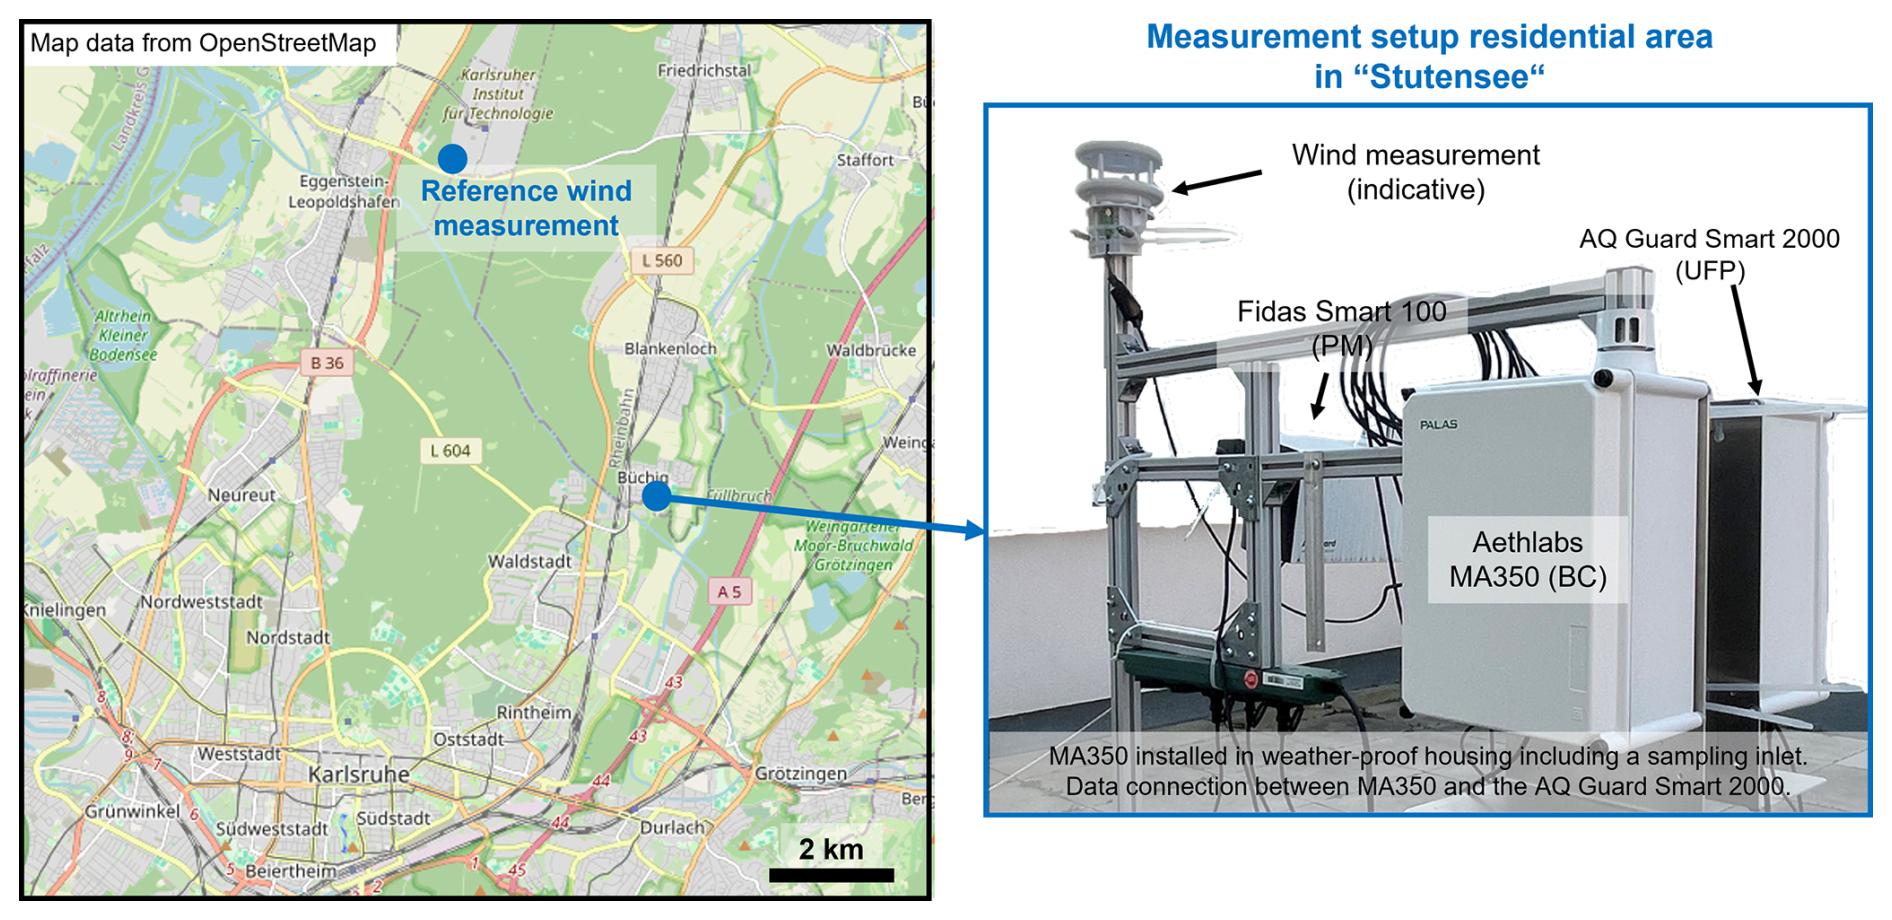
Figure 1Measurement location in the residential area of Stutensee, close to the German city of Karlsruhe; reference wind measurement at KIT Campus North; and picture of the measurement setup, including the aerosol measurement technology. © OpenStreetMap contributors 2025. Distributed under the Open Data Commons Open Database License (ODbL) v1.0.
The measurement devices shown in Fig. 1 are the AQ Guard Smart 2000 (diffusion-charge-based UFP monitor; manufacturer: Palas®; see Sect. 2.2), a Fidas Smart 100 (aerosol spectrometer; manufacturer: Palas®), and an MA350 (BC measurement; manufacturer: Aethlabs). The wind measurement serves only as an indication of the local wind speed and wind direction and is not necessarily representative of the meteorological wind situation for the entire area. In the map in Fig. 1, the position of KITmast, a 200 m high tower for accurate meteorological wind measurements, is shown, serving as a reference in relation to the locally measured wind speed and direction (compare Sect. 2.3). This publication focuses on UFP measurements in the context of pollutant dispersion during the majority of the heating season of 2024–2025 (data from 20 November 2024 up to 30 March 2025; the timezone for all times stated throughout the paper is Central European Time (CET) and corresponds to the actual local time for the measurements). Explorative black-carbon measurements (MA350) will be presented in Sect. 3.1 to offer further context regarding source apportionment. A follow-up publication for further analysis of the temporal behavior and the correlation between UFPs, PMx, and BC is planned to analyze the MA350 data in detail. Further data on relative humidity, ambient temperature, and pressure from the Fidas Smart 100 can be found in the Supplement.
2.2 Description of diffusion-charge-based UFP monitor
The UFP particle number concentration was measured using an AQ Guard Smart 2000 from the manufacturer Palas®. The specifications of the measurement device are summarized in Table 2.
Table 2Specifications of AQ Guard Smart 2000 according to the manufacturer (Palas GmbH, 2025).
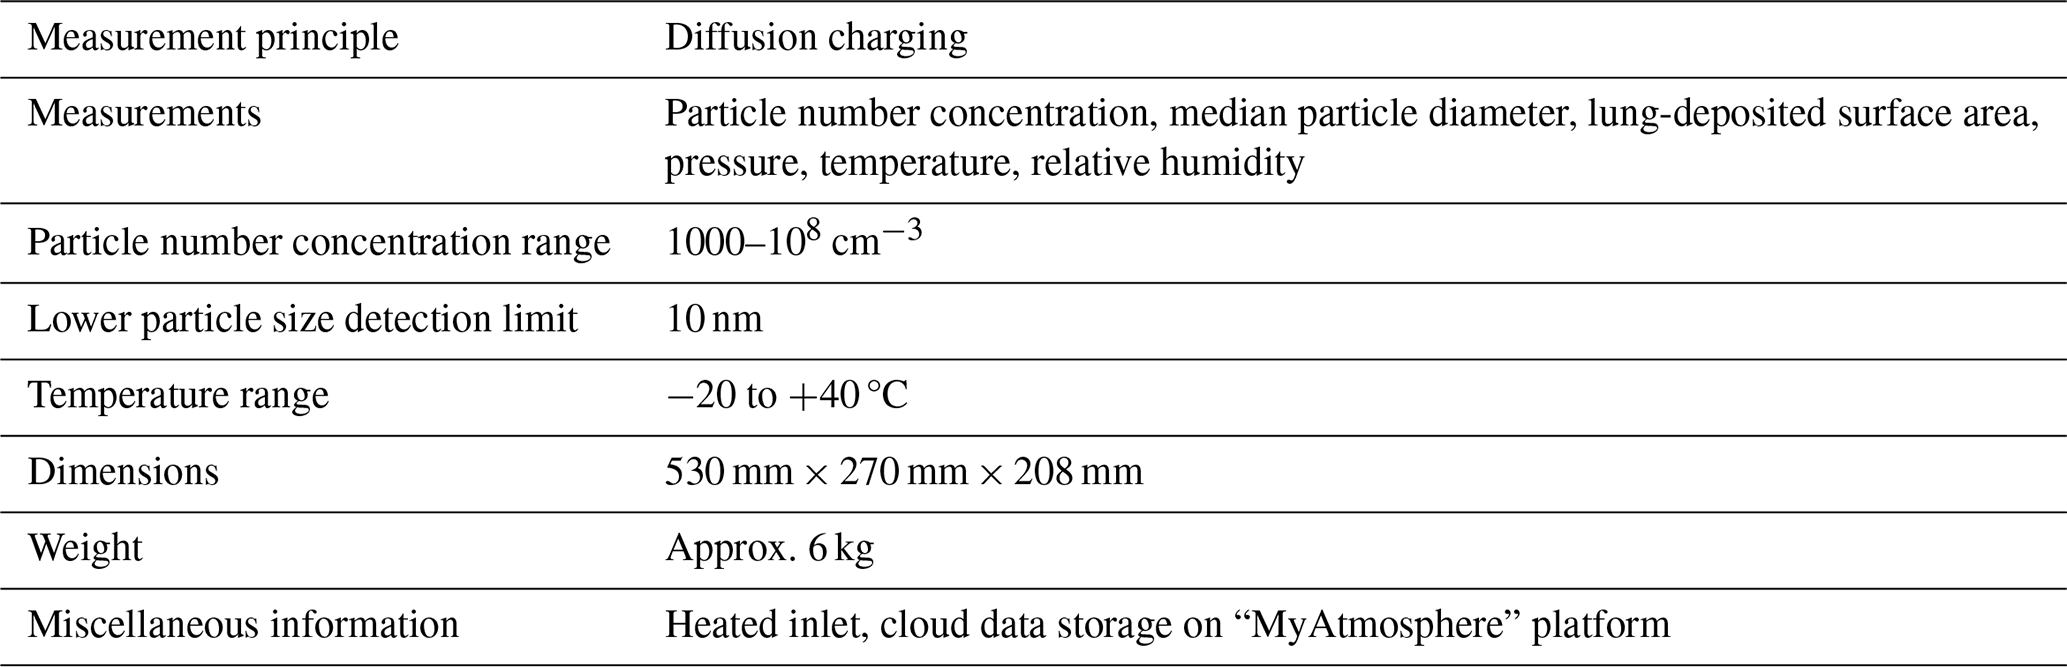
The working principle is based on unipolar diffusion charging of the sample aerosol. At the inlet the sample aerosol is heated to avoid any humidity or condensation effects. Ionized sheath air (filtered by HEPA and activated carbon filters) is generated through unipolar corona discharge. The ambient aerosol is mixed with the ionized sheath air in an ejector/dilutor system at a fixed ratio. Thus, the aerosol is charged by coagulation and excess ions are removed in an ion trap before the charged aerosol (known charge distribution) passes a faraday cup electrometer and the generated current is measured. A mobility analyzer with varying voltage serves as a classifier and generates information on particle size.
The data are collected on the cloud database “MyAtmosphere” (https://my-atmosphere.net/, last access: 17 February 2026) provided by the manufacturer and can be accessed at varying temporal resolutions (1 min, 15 min, 1 h, 24 h). The wind measurement was linked to the cloud as well, enabling a direct allocation of UFP concentration, wind speed, and wind direction with a high temporal resolution. The data were post-processed with regard to incorrect concentration measurements (e.g., implausibly high or negative concentration readings). This affected only a negligible fraction of the data. The (raw) dataset is freely available and published under an open-access license in accordance with the “Data availability” section at the end of the article (Bächler et al., 2025).
2.3 Characterization of the dispersion conditions
Since the wind measurement was located together with the aerosol measurement devices on the first-floor balcony of a garage of one of the buildings in the residential area, the corresponding wind data are influenced by the building geometry of the surrounding neighborhood as, e.g., the flow of wind may be obstructed by the buildings. Nonetheless, the measurement serves as an indicator of pollutant dispersion, where high wind speeds reflect a high degree of pollutant dispersion or dilution, and low (or non-measurable) wind speeds are an indication of a low degree of pollutant dispersion.
In addition to this local wind measurement, data from a meteorological measurement station (see Fig. 1) were provided (Kohler et al., 2018). Figure 2 shows a wind rose comparing the local wind speed and direction at the measurement setup in Stutensee, with the meteorological reference measurement (see Fig. 1) from KITmast (40 m height), as well as the average diurnal wind behavior that was calculated for the entire measurement period. Here, in the case of the reference measurement from KITmast, data from 40 m height and 2 m height are evaluated, with wind direction measured at 40 m height only. The measurement at 40 m height is unobstructed by the vegetation zone of the nearby forest and offers representative data “close” to the ground, while the 2 m measurement is located on a clearing where vegetation has a comparably low impact but still influences the corresponding measurements. Both datasets are presented to offer a holistic comparison to the wind measurement in the residential area. For the data obtained in the residential area, only wind direction data with wind speeds of > 0 km h−1 are evaluated as the device reports 0 ° wind direction for wind speeds of zero. The wind rose shows the probability and fraction of the dataset of different wind speeds (above zero) coming from a corresponding wind direction in percent (%).
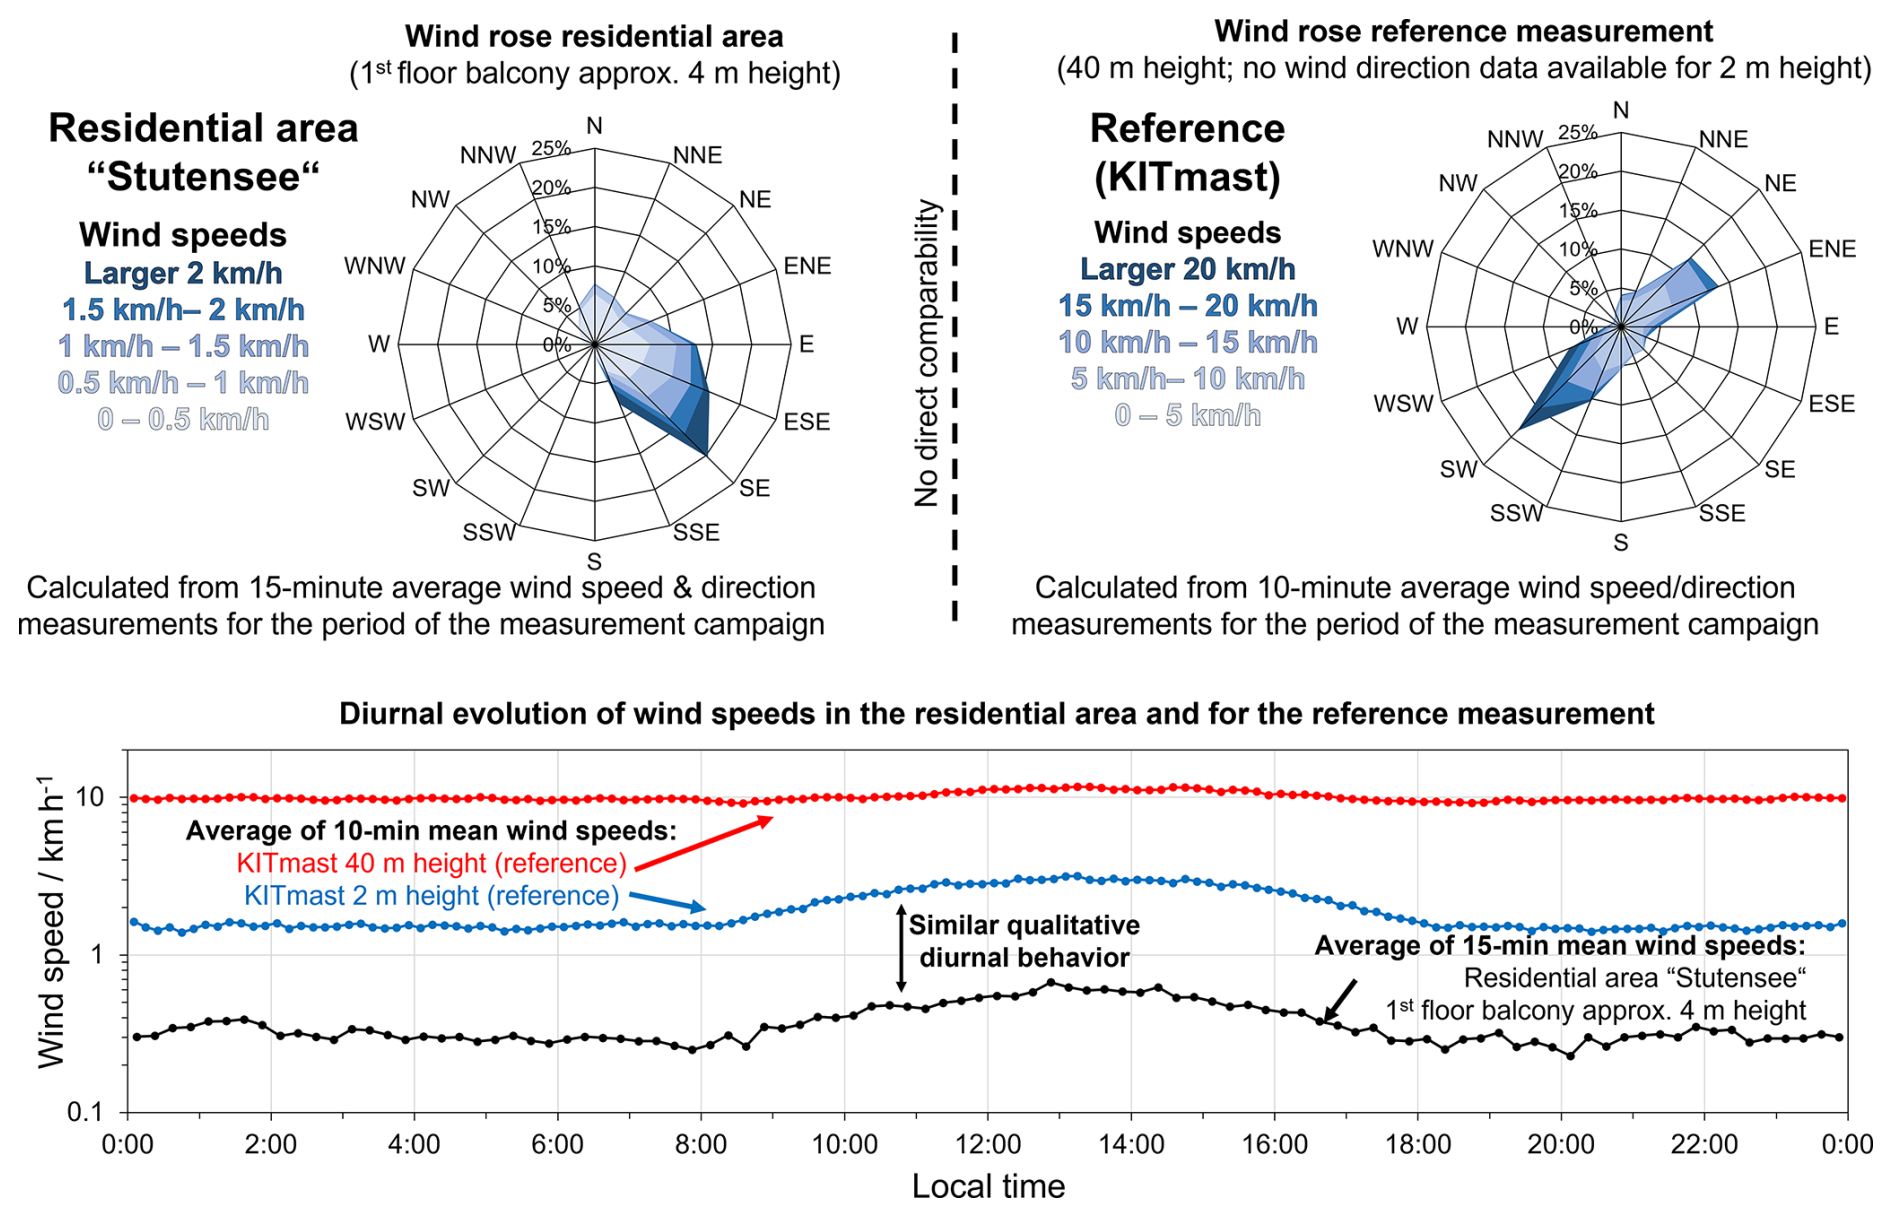
Figure 2Wind rose and the average daily behavior of the wind speed for the residential area and the reference measurement (KITmast) at 2 and 40 m height (Kohler et al., 2018).
The main wind directions for the reference (NE, ENE, and SW) are different from that of the residential area (SE). Note that the building geometry in the residential area can have a significant impact on the measured wind speed and direction. Thus, the absolute wind speeds obtained in the residential area and from the reference at 2 m height differ significantly. At an increased height of 40 m, where there is no impact of the vegetation zone, the measured wind speeds are significantly higher, as is expected. Considering the qualitative behavior of the wind speed, all measurement positions show a similar trend, where average wind speeds are relatively stable, ranging from 18:00 CET in the evening up to approx. 09:00 in the morning. In between 09:00 and 18:00 CET, there is a temporal increase in wind speed (e.g., from 0.25 km h−1 up to 0.6 km h−1 for the residential area). This diurnal behavior has to be considered in the context of aerosol measurements. A similar profile was reported by Kuhlbusch et al. (2001) for another location in Germany. Due to the same trend between the reference and the wind measurement in the residential area, the locally obtained wind speeds are a valid indication of the corresponding pollutant dispersion conditions. Therefore, only the wind speeds at the measurement position in the residential area will be considered for further evaluation. A heatmap showing 15 min average wind speeds for the entire measurement period is provided in the Supplement.
3.1 Temporal evolution of daily UFP concentration for the entire measurement period
Wood stoves are commonly operated during the evening hours within the heating period, causing a characteristic diurnal pattern whereby increased concentrations above the background level are only detected during periods of source activity. Figure 3 shows a heatmap of 15 min average UFP concentrations for the entire measurement period, ranging from 20 November 2024 up to 30 March 2025, resulting in 131 d of complete measurements with 24 h of data availability. Concentrations below the background level of 5000 cm−3 are in blue. This lower threshold concentration corresponds to the common “natural” background level of the residential area – note, however, that the “low” concentration level according to the WHO good-practice statement (Table 1) is lower by comparison, and the color scale aims to highlight exceedances of the background concentration level. The color scale shifts towards yellow, which represents the “high” concentration level of 10 000 cm−3 according to the WHO good-practice statements for exposure within a 24 h mean concentration, and to red for values exceeding a concentration of 20 000 cm−3, which is classified as a daily maximum hourly mean UFP concentration according to the WHO good-practice statements. The actual peak concentrations can significantly exceed this maximum threshold of 20 000 cm−3 in the heatmap. A UFP heatmap with a more detailed scale considering the peak concentrations for December 2024–February 2025 with a higher temporal resolution is shown in the Supplement.
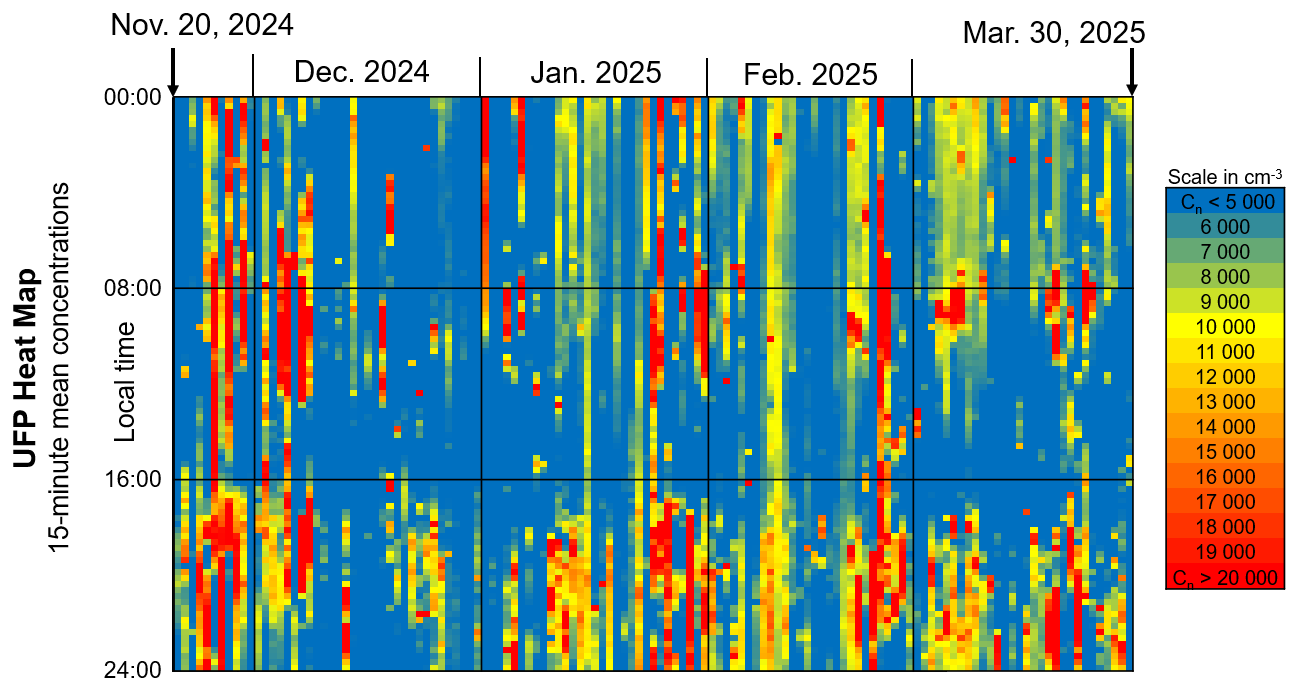
Figure 3Heatmap of 15 min mean UFP concentration for the entire duration of the measurements.
The heatmap illustrates that a significant fraction of the measurement period is subject to air pollution in the morning and evening hours, which is likely linked to human activity.
Further evaluating the data shown in the heatmap in Fig. 3, an “average” diurnal particle concentration dynamic was calculated in Fig. 4 and set into the context of the diurnal wind pattern (Fig. 2). Here, the overall average 15 min mean concentration in a fixed time interval, e.g., from 09:00 to 09:15, is calculated for either the entire measurement period (left) or only the days where the 1 h average concentration of 20 000 cm3 was exceeded (right). To be more specific, in the left panel of Fig. 4, the average concentration for an entire row of the heatmap is calculated for each time interval to gain a “mean” diurnal pattern for the entire measurement period. The black curve represents the average 15 min mean UFP concentration for the entire measurement duration. Here, days with and without increased UFP concentrations during the evening hours are taken into account. Despite days with low concentrations impacting the calculated mean concentrations, the determined concentration profile shows a pronounced trend, where particle concentrations above the background level (reaching up to around 10 000 cm−3) are measured during the morning hours (approx. 08:00–10:00), as well as during the evening hours (approx. 18:00–22:00).
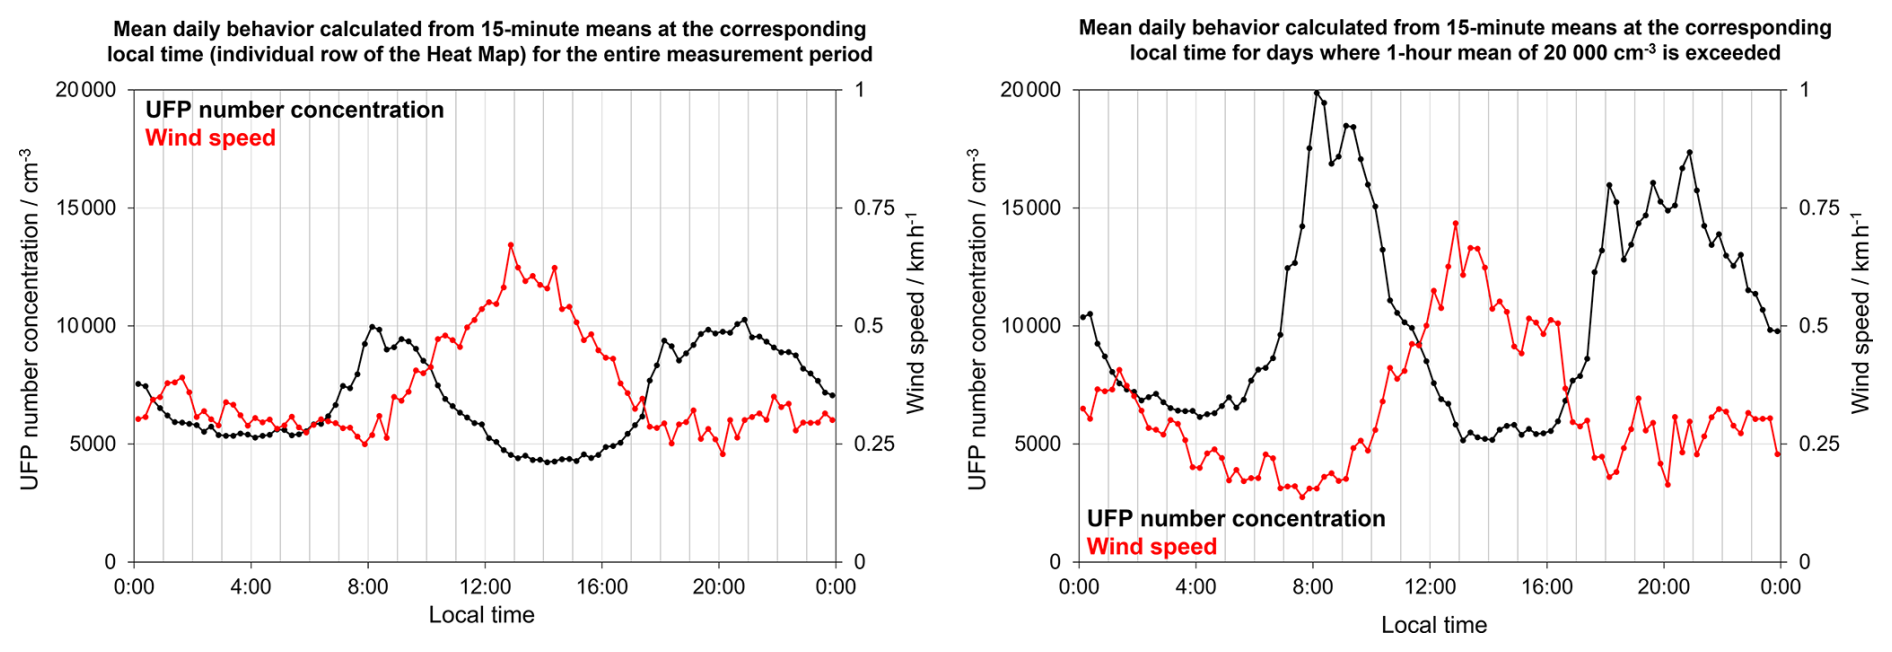
Figure 4Diurnal UFP and wind pattern calculated from 15 min mean concentrations at the corresponding local time for the entire measurement period and for measurement days where the 1 h mean concentration of 20 000 cm−3 is exceeded (compare Fig. 9).
During the daytime, slightly increased wind speeds are measured (see Fig. 2), causing a larger degree of pollutant dispersion. Thus, it is not only the case that the major sources are likely not to be active during the lunch hours; pollutant dispersion also has positive impacts on the particle concentration level. Identifying pollutant sources is not possible based on concentration data alone; however, Sect. 3.1 offers some insights regarding the corresponding source apportionment for the conclusions drawn from Figs. 3 and 4. Considering only measurement days with significant concentration spikes, where 1 h mean concentrations of 20 000 cm−3 were exceeded (compare Fig. 9 and Sect. 3.4), the diurnal pattern is even more pronounced. The wind speed during these days with increased air pollution was in a similar region compared to the entire measurement period and also showed the typical diurnal pattern, with no significant deviation with regard to the higher wind speeds during the daytime. A similar diurnal pattern with corresponding concentration increases was reported by Dada et al. (2025) in rural Switzerland, where, especially during winter and fall, increased concentrations were measured during the morning (approx. 8000 cm−3) and evening hours (6000 cm−3) compared to the background level (4000 cm−3). The source was identified as domestic heating and aerosol transport from rush-hour traffic based on intercomparisons of various different measurements (e.g., scanning mobility particle sizer (SMPS), condensation particle counter (CPC), catalytic stripper, neutral cluster and air ion spectrometer (NAIS), trace gas analysis, aethalometer). Another similar diurnal pattern for moderately traffic-influenced urban and regional background sites regarding black-carbon and aerosol particles in the range of 30–200 nm was reported by Sun et al. (2019), where peak concentrations occurred in the morning and evening hours, allocated to traffic, cooking, and heating. Kuhlbusch et al. (2001) also showed a similar diurnal pattern linked to traffic emissions for PM concentrations. Summarizing, the daily UFP concentration evolution is strongly influenced by local sources (wood stoves), and pollutant dispersion is a significant factor affecting the local concentration level and the measurements.
3.2 Source apportionment in the context of the dispersion conditions
Many different natural (e.g., atmosphere chemistry) and anthropogenic (e.g., wood smoke, abrasion) sources can contribute to increased UFP concentrations. Previous investigations proposed wood stoves as the main source for increased UFP concentration levels in this residential area. Of course, elevated UFP concentrations alone are not sufficient to verify wood smoke from domestic heating as the source – however, there is sufficient evidence to unambiguously identify the wood smoke pollution in the residential area:
-
The smell and visual identification of plumes from the chimneys of the surrounding neighborhood show the emission of wood stove exhaust and are direct evidence, even though this does not constitute quantifiable data.
-
Additional black-carbon measurements also show qualitatively similar concentration spikes in the evening so that the ultrafine particles likely contain soot from (incomplete) combustion. Unfortunately, the data availability for these measurements only covers several days of the measurement period. The focus of this article remains on UFP concentrations and the black-carbon data, and the link between PM, UFPs, and BC on a temporal basis will be analyzed in detail in a follow-up publication. Figure 5 shows the black-carbon concentration obtained from the MA350 device for days with 24 h of data availability to serve as further indicative proof regarding the source of increased UFP and BC concentration levels. Especially during the evening hours, black-carbon concentrations of approx. 5 µg m−3 are reached. For the inversion period including 8 and 9 February (see Sect. 3.2.2), concentrations of up to 10 µg m−3 were measured with regard to 15 min average concentrations (potentially higher concentration spikes – maximum 15 min average concentration of approx. 17 µg m−3).
-
The increased concentrations in the evening occur outside of typical rush hours and often reach their peak after 18:00. While there is indeed a highway (A5 in Fig. 1) located in the main wind direction (according to the indicative wind measurement, which may be influenced by building geometry) that could be a potential source of ultrafine particles from traffic, increased concentrations only occur for low wind speeds close to or below the detection limit of the wind measurement. As such, the transport of pollutants from the highway to the residential area can be ruled out or is at least unlikely to cause concentration spikes of that order of magnitude. As a consequence, increased concentrations in the residential area have to originate from local sources.
-
New-particle formation events would have to coincide with other sources and do not occur in larger numbers. Such events should also be mostly independent of wind speed. Song et al. (2024) did not report a significant occurrence of new-particle formation events at another location at the outskirts of Karlsruhe, within reasonable proximity to the measurement site. However these investigations were performed during the summer months and are not directly comparable.
-
Other prominent UFP sources (e.g., air traffic) can be ruled out.
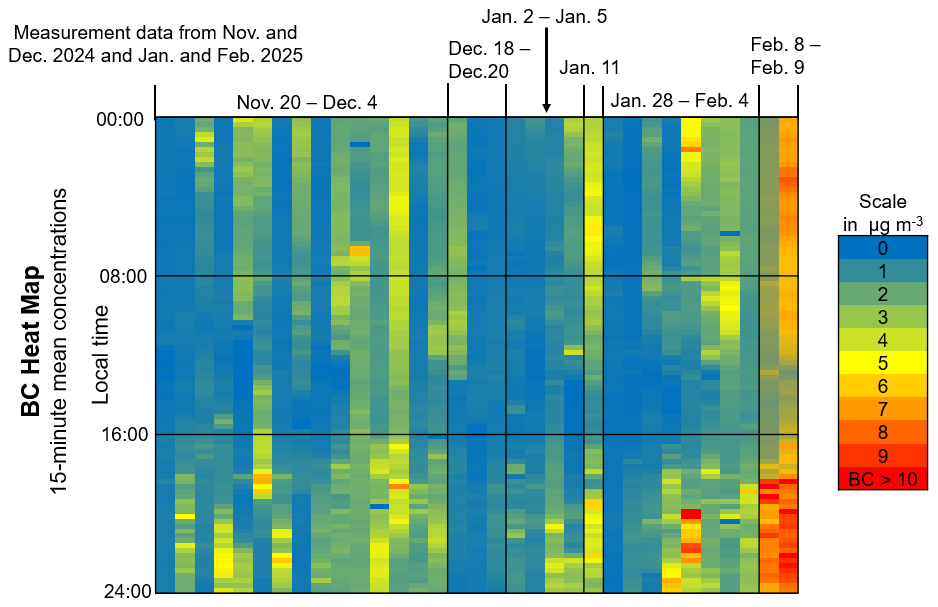
Figure 5Heatmap of 15 min mean BC concentration for several exemplary days (24 h data availability) during the measurement period.
3.3 Effect of pollutant dispersion on short timeframes for several exemplary measurement periods
To further demonstrate the impact of pollutant dispersion on ultrafine particle concentrations, several exemplary days or periods are discussed in this section. Correlations for other ambient conditions such as temperature and pressure can be found in the Supplement, though the impact of these parameters shows no distinctive trend compared to wind speed and/or pollutant dispersion.
3.3.1 New Year's fireworks
A prominent example during the heating period where air pollution is prevalent is the New Year's celebration, where fireworks are launched in large amounts at midnight (00:00). The explosion of fireworks contributes to air pollution and, while only being a temporal occurrence once a year, can demonstrate the dynamic behavior of UFP concentrations. Other authors also featured the impact of firework celebrations on air pollution (Joshi et al., 2016). Figure 6 shows the UFP concentration in the context of wind speed and dispersion conditions for the residential area featured in this publication for the years 2024–2025.
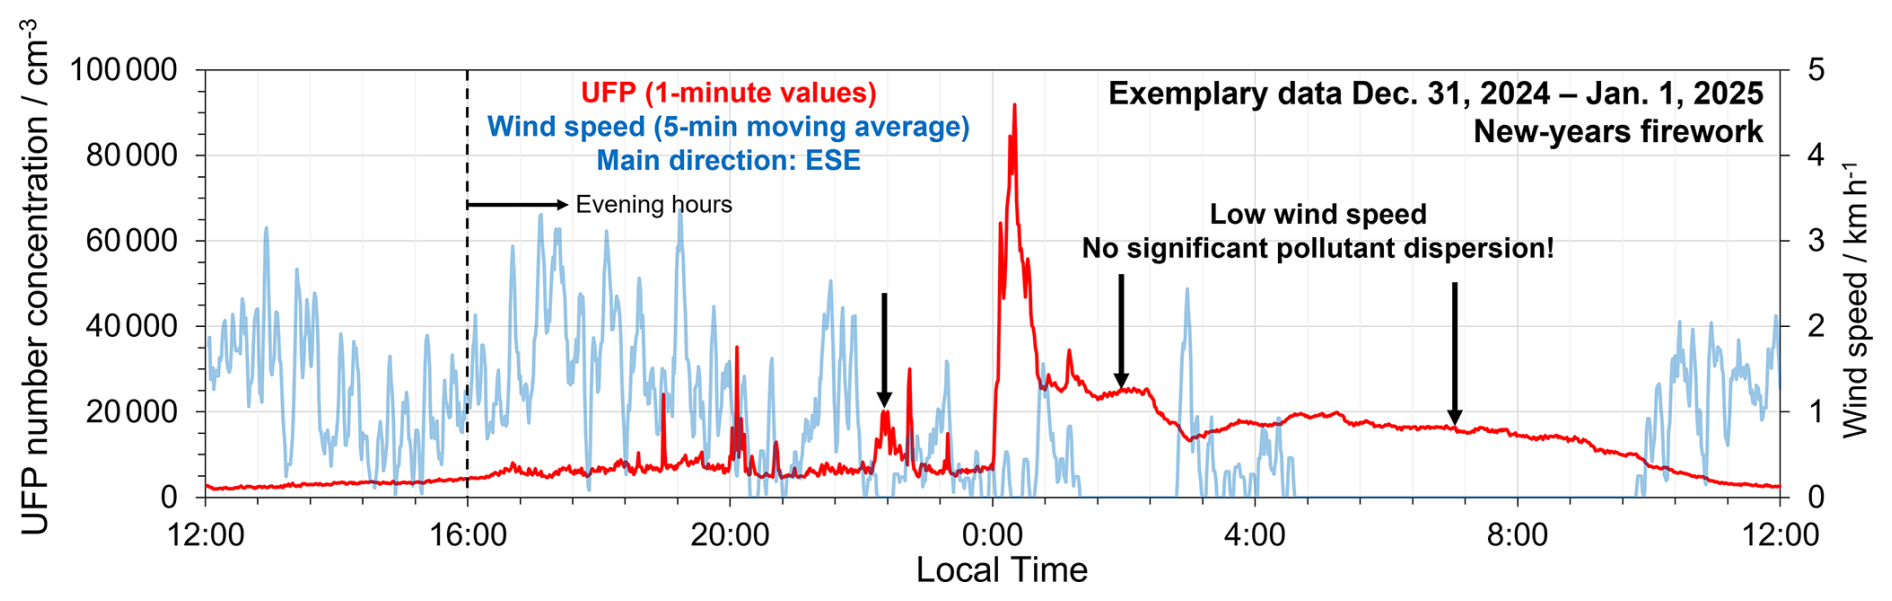
Figure 6UFP number concentration and dispersion conditions during the release of New Year's fireworks.
Over midday and up to the late afternoon at 16:00, UFP concentrations were around a typical background level, and the wind speed was comparably high at the measurement position (compare Fig. 2). In the evening hours from approx. 17:00 until midnight, concentrations fluctuated between 5000 and (mostly) 10 000 cm−3, whereby several short-term peaks reached concentrations exceeding 20 000 cm−3. This noise in the data is an indication for source activity, even though average concentrations are not noticeably high. Reaching 00:00 and the start of the fireworks, concentrations quickly increase, where a peak concentration of 90 000 cm−3 is reached at 00:30. The peak concentration disperses rather quickly until approx. 01:30, during a period where elevated wind speeds were measured. Results from Drewnick et al. (2006) showed larger peak concentrations (up to 150 000 cm−3 – 5 min average concentration) for a German city; however, the measurement position was situated close to the center of firework activity. Dutschke et al. (2011) also report higher peak concentrations for firework festivities of up to 1 600 000 cm−3. After the decay of the main concentration peak, the concentration level remains relatively constant at approx. 21 000 cm−3. From 02:30 up to approx. 05:00, concentrations fluctuate during a period of pollution dispersion. Finally, from 05:00 up to the morning hours of 10:00, no wind speed is detected, and the natural dispersion of the pollutants is comparably slow so that concentrations decrease from 20 000 down to 10 000 cm−3 over a longer period of time before increased wind speeds during lunch bring the UFP concentration to the background level.
3.3.2 Stationary temperature inversions and high-pressure area
An example of a period of the measurement campaign where the dispersion conditions for UFPs and other air pollutants were significantly impaired was during the prevalence of the high-pressure area “Elvira” in February 2025. The high-pressure area and stationary temperature inversion prevented air exchange, which led to the accumulation of air pollutants. This can have a significant impact on air quality, especially for cities located in basins with unfavorable dispersion conditions (Zhang et al., 2024). This effect on air pollution can also be observed on a temporally resolved basis in the residential area with regard to UFP concentrations (Fig. 7) and was prominently featured across different news platforms in Germany. It is also clearly visible within the PM2.5 heatmap shown in the Supplement.
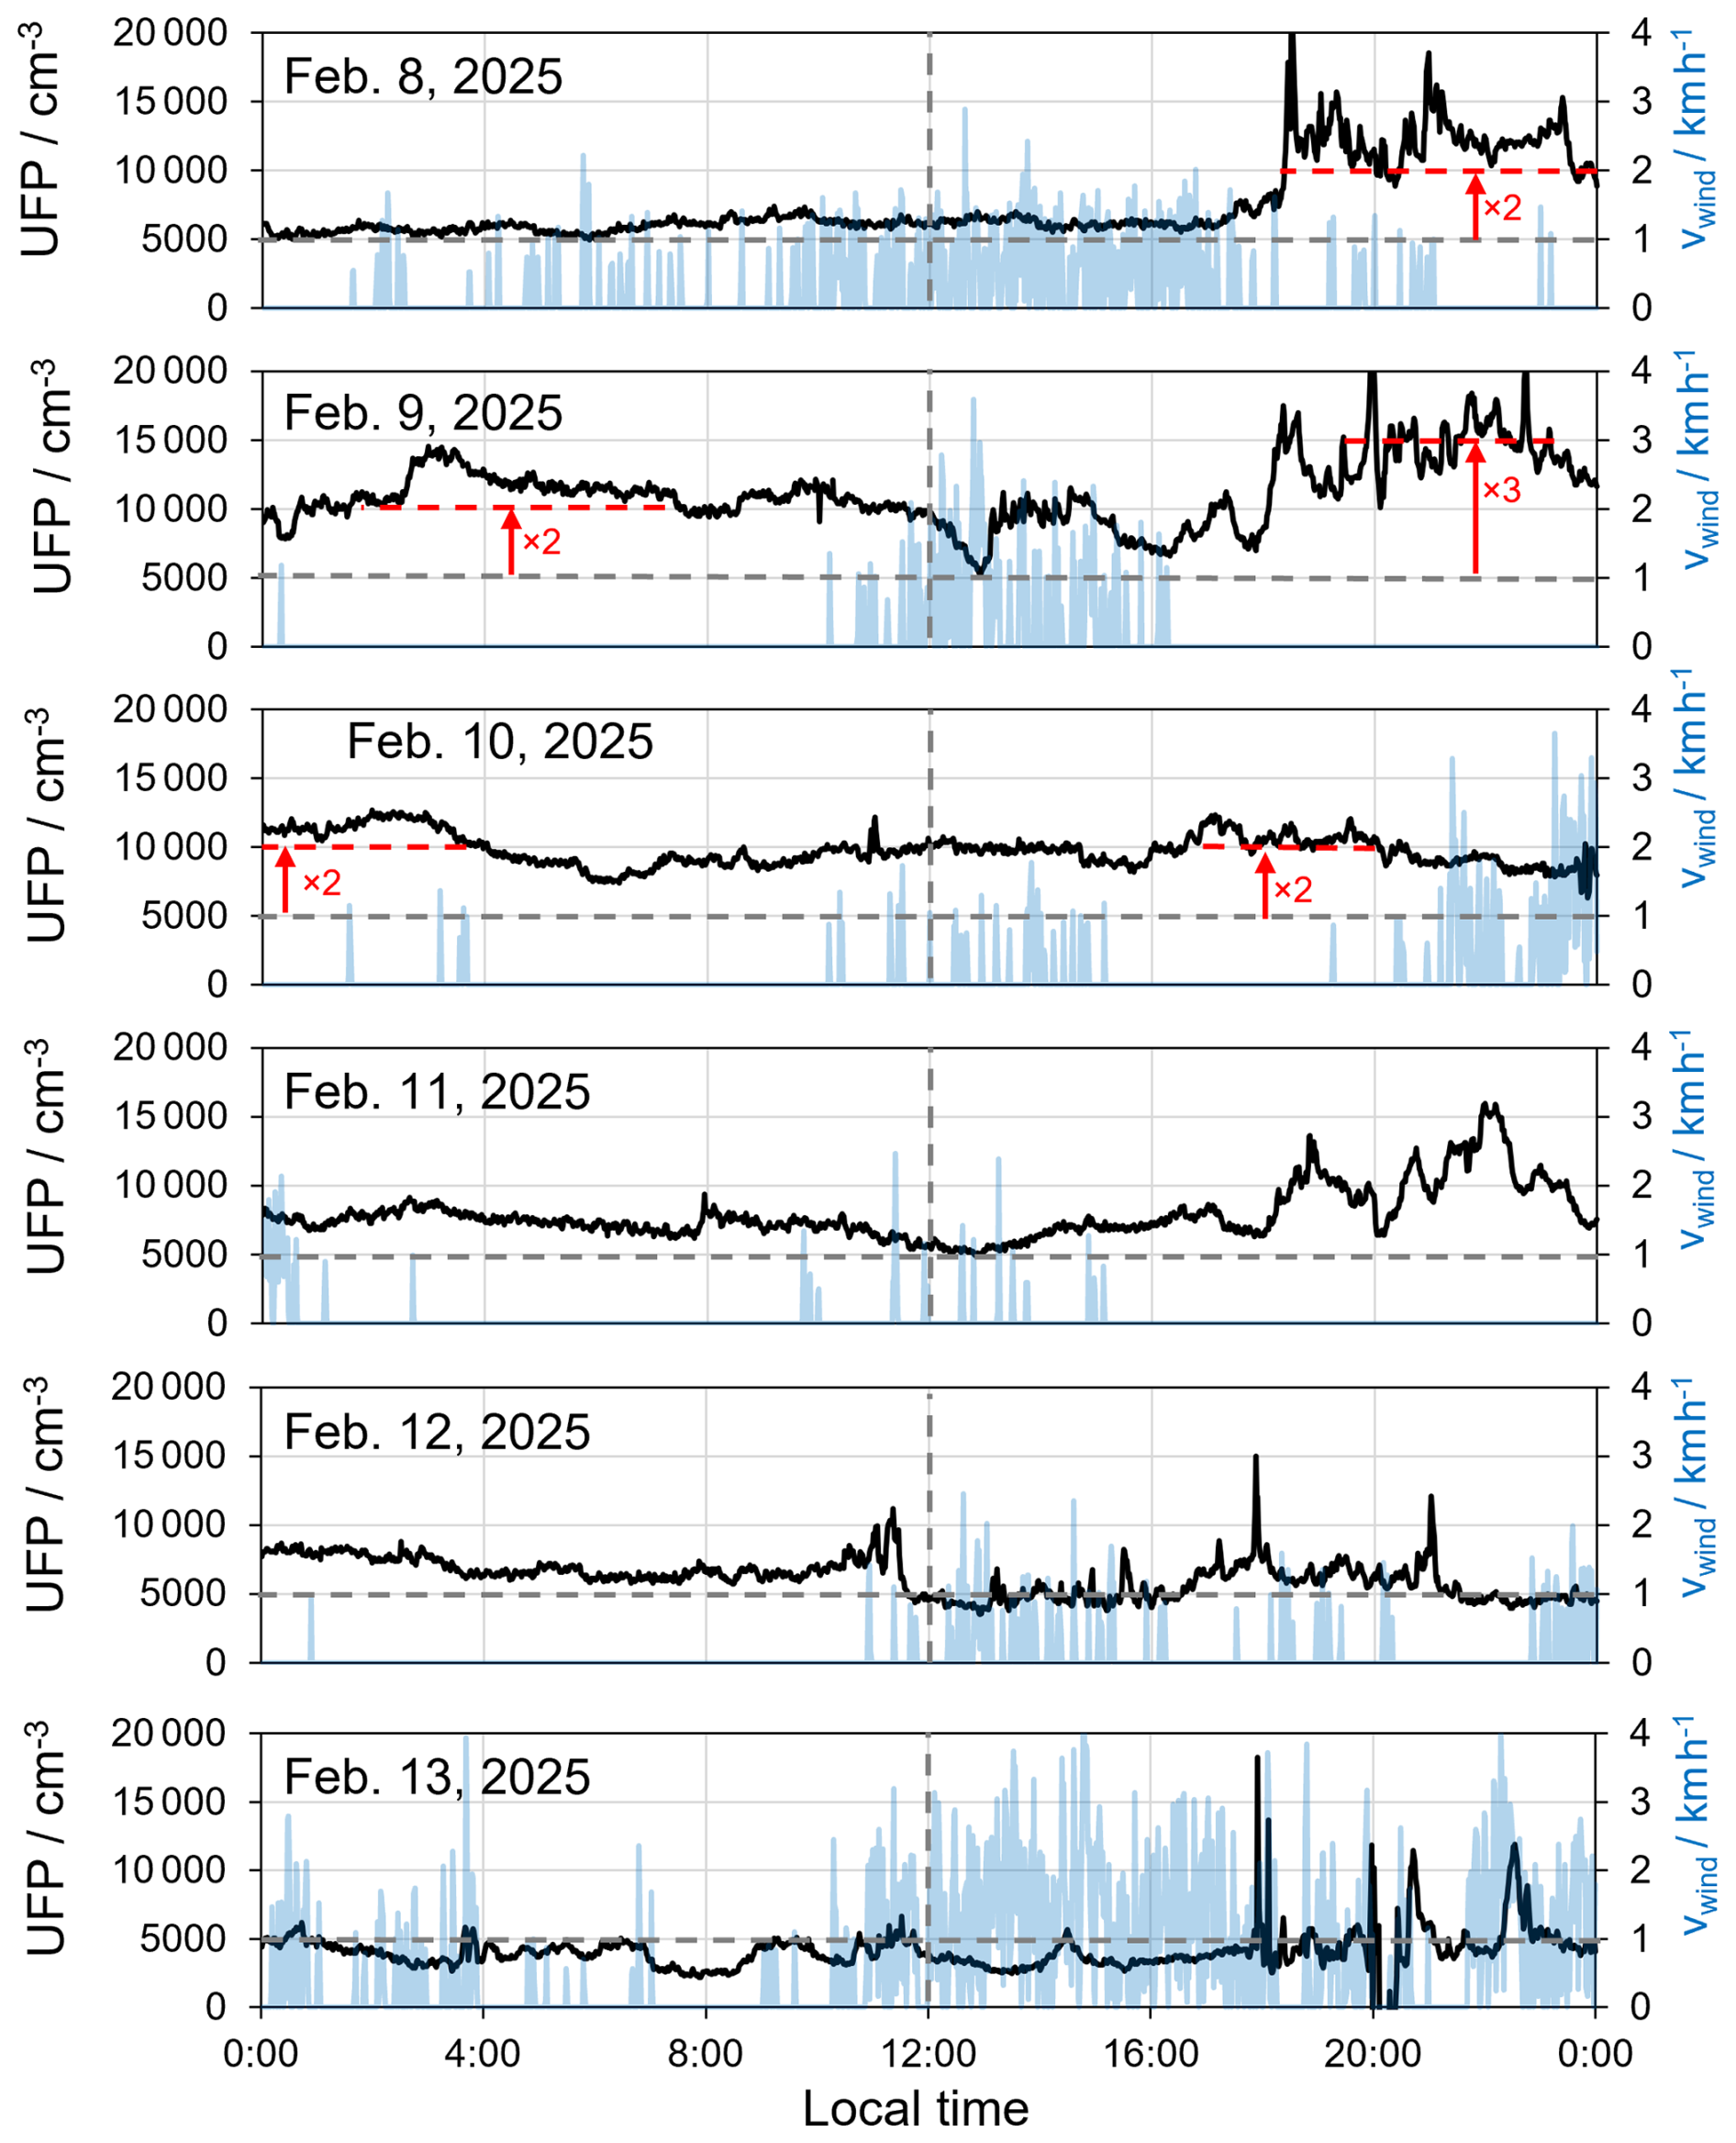
Figure 7UFP number concentration and dispersion conditions during prevalence of a high-pressure area and stationary temperature inversions in February 2025.
Increased wood stove operation led to an increase in UFP concentration during the evening hours of 8 February. Due to poor pollutant dispersion and the beginning of the impact of the high-pressure area, this level remained constant up to the lunch hours of the next day. In the evening of 9 February, concentrations increased again up to 3 times the background concentration and remained at a level of 10 000 cm−3 (high concentration according to WHO good-practice statement) for the entirety of 10 February. On 11 February, the concentration slowly decreased to the background level up to the evening hours, where wood stove operation once again contributed to air pollution. Towards the end of the effective duration of the high-pressure area on 12 and 13 February, the concentration decreased, and, especially on 13 February, the concentration was at or below the background level, and significant wind speeds were measured for the majority of the day. Noise in the data of 13 February is again an indication of source activity and simultaneous dispersion or dilution.
3.4 UFP concentration levels in the context of pollutant dispersion during the entire measurement period
To give a direct correlation between ultrafine particles and wind speed, a scatterplot is drawn for the 15 min average UFP concentrations and the corresponding average wind speed in Fig. 8. Correlations for different ambient conditions can be found in the Supplement, although no clear trends could be derived from this evaluation. In Fig. 8, different sectors can be identified that illustrate the main conclusions drawn from the previously discussed measurements of UFPs in the context of wind speeds and/or pollutant dispersion. Note that a significant fraction of the data is located at wind speeds of 0.
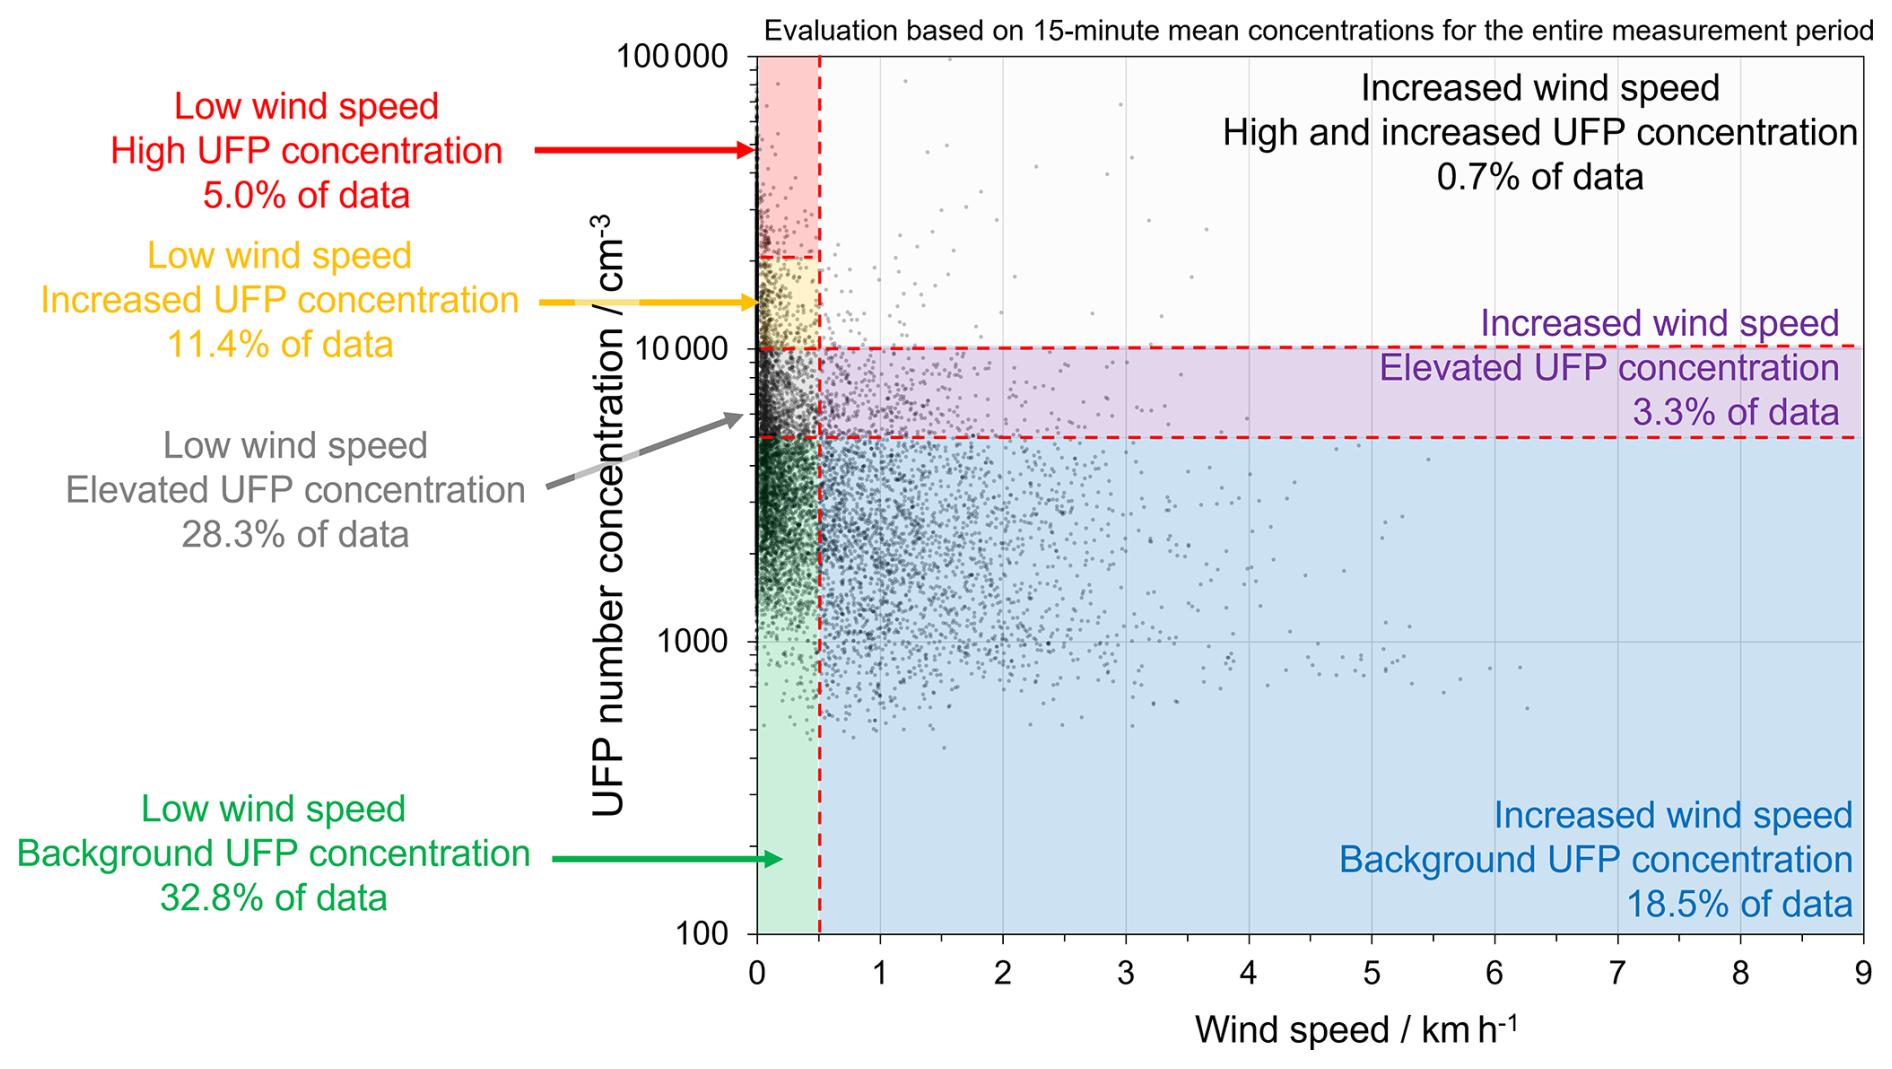
Figure 8Scatterplot of 15 min mean UFP concentrations and wind speeds for the entire measurement period.
The highest UFP concentrations occur under conditions where pollutant dispersion is very low (red and yellow sector). The threshold wind speed was selected to be 0.5 km h−1 as almost no concentrations above 10 000 cm−3 were measured at higher wind speeds. Data above the background level at low wind speeds amount to 44.7 % of the total data and were likely to be caused by source activity and wood smoke pollution.
For wind speeds above 0.5 km h−1 and concentrations above 5000 cm−3, only a very limited amount of data can be found (4 % total) by comparison. With increasing pollutant dispersion, even under conditions with high source activity, the effect on air quality is not as significant.
In the sector including wind speeds above 0.5 km h−1 and concentrations below 5000 cm−3, a total of 18.5 % of the measurement data can be found. Pollutant dispersion dominates the overall particle concentration level so that, even in cases of source activity, the effect on ambient air quality is not measurable, impeding the generation of emission inventories (e.g., climate-damaging black carbon from incomplete combustion from wood stoves). These data are predominantly obtained during the lunch hours with increased wind speeds.
Only for data below the background concentration and at low wind speeds can source activity be ruled out with high certainty. The amount of data in this quadrant amounts to 32.8 %.
Summarizing, the dispersion conditions have a major impact on the measured air quality in the residential area. In the case of low pollutant dispersion, increased concentration levels can persevere across multiple days. For higher wind speeds, pollutant dispersion can dominate the ambient air quality, and low concentrations can be measured despite the possibility of wood smoke emissions.
3.5 Evaluation of average UFP and particulate matter concentrations regarding ambient air quality limits and WHO recommendations
In the previous sections, the measured UFP concentrations were already discussed in the context of particle concentration levels introduced by the World Health Organizations' good-practice statements. Particle concentrations above 10 000 cm−3 (24 h mean) are considered to be high concentrations. Furthermore, a daily maximum 1 h mean concentration of 20 000 cm−3 should not be exceeded. In Fig. 9, the daily mean UFP concentration and the maximum 1 h mean concentration for the entire measurement period ranging from 20 November 2024 up to 30 March 2025 are calculated and set into the context of the WHO good-practice statements.
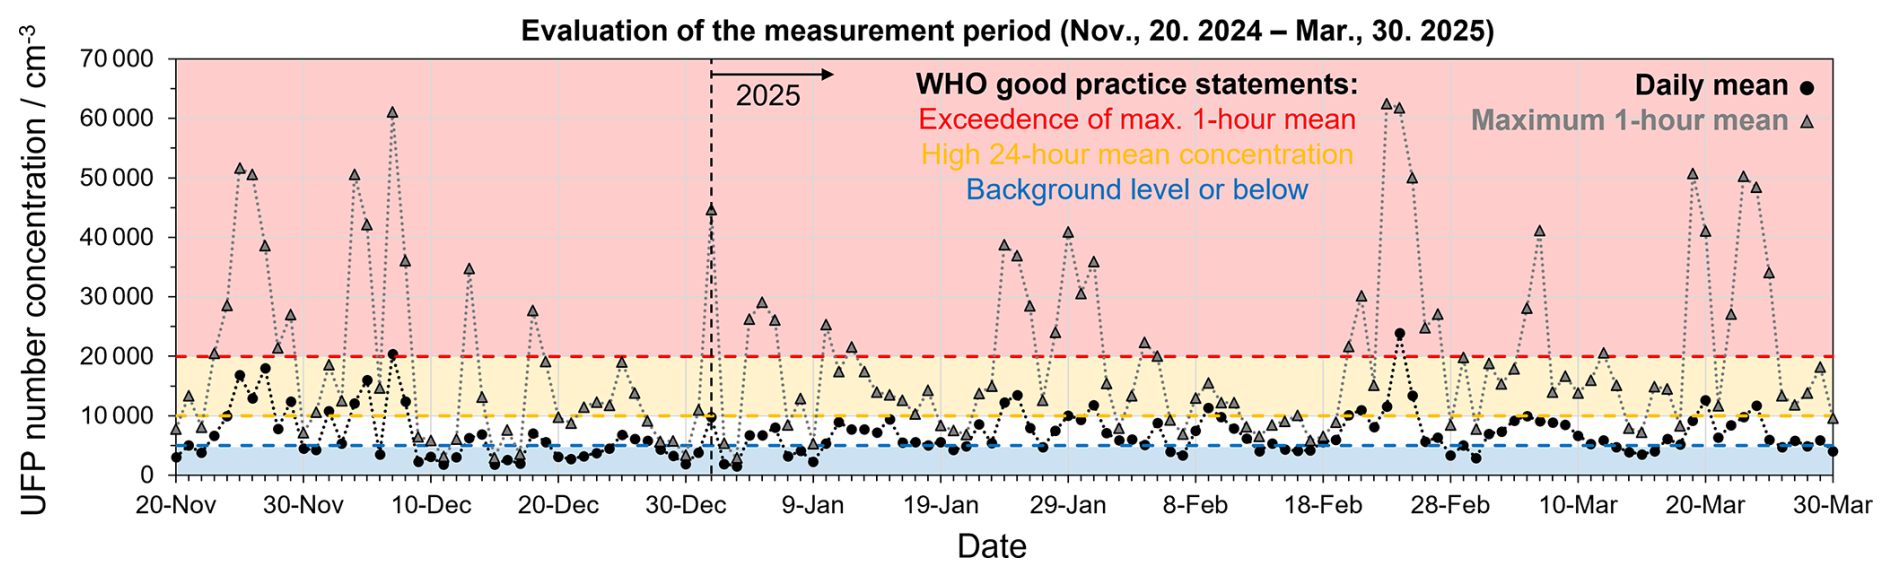
Figure 9Mean daily and maximum 1 h UFP number concentration for the entire measurement period.
Considering the 24 h mean concentrations, only a total of 16 % of measurement days (21 out of 131 d) exceed the 24 h mean UFP concentration of 10 000 cm−3 (black data points within yellow area). This is mainly caused by the diurnal pattern, where increased concentrations are only detected during the morning and evening hours so that these concentration spikes are not as significant in the context of 24 h mean concentrations.
However, considering increased short-term exposure to high concentrations above 20 000 cm−3, a total of 33.6 % of measurement days (44 out of 131 d) exceed the daily maximum 1 h mean concentration at least once during the day. Considering a total of 24 h for each measurement day, the number of hours exceeding the 20 000 cm−3 threshold is 154 out of 3144, which corresponds to 4.9 % of hours during the measurement period. These increased concentration levels are very likely to be hazardous due to their origin from wood combustion and can contribute to long-term health effects and endanger high-risk groups such as children and the elderly with regard to short-term health effects.
3.6 UFP concentrations in the context of PM2.5 measurements
To add further context to the increased UFP peak concentrations (Fig. 9), the mean daily PM2.5 concentrations obtained from scattered-light-based measurements using the Fidas Smart 100 (see Fig. 1) are displayed in Fig. 10. These measurements were indicative measurements and not government-official. For further information on the temporally resolved PM2.5 behavior, a heatmap similar to that shown in Fig. 3 can be accessed in the Supplement.
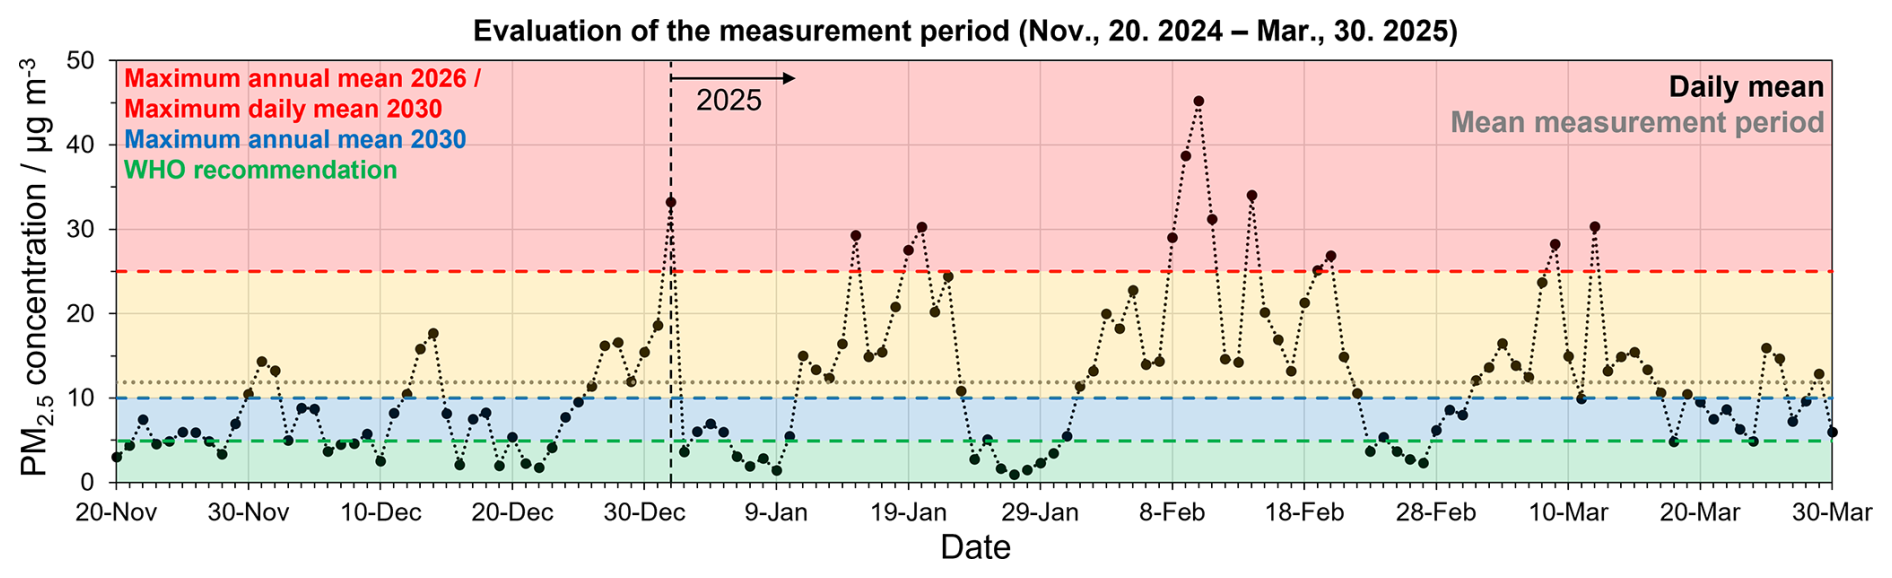
Figure 10Mean daily PM2.5 concentration for the entire measurement period within the scope of the limits specified in the revised Ambient Air Quality Directive (indicative measurement – no government-official data).
The average PM2.5 concentration of the measurement period (11.9 µg m−3) is close to the future annual limit values for the year 2030. Therefore, the current mean annual concentration limit of 25 µg m−3 is easily kept. As the measurement period was performed during the heating season, where higher PM concentrations are expected, there will likely be no (or no significant) exceedance of the future 10 µg m−3 limit in the case of the year 2025. When it comes to the future number of 18 exceedance days with a concentration of 25 µg m−3, which will be relevant starting in 2030, there were a total of 13 exceedance days during the measurement period (all of which occurred in 2025). Several of these exceedance days were obtained during the impact of the high-pressure area discussed in Sect. 3.2.2 so that the concentration itself is not directly linked to the emission of pollutants but rather to the dispersion conditions that may dictate whether or not the number of exceedance days can be complied with.
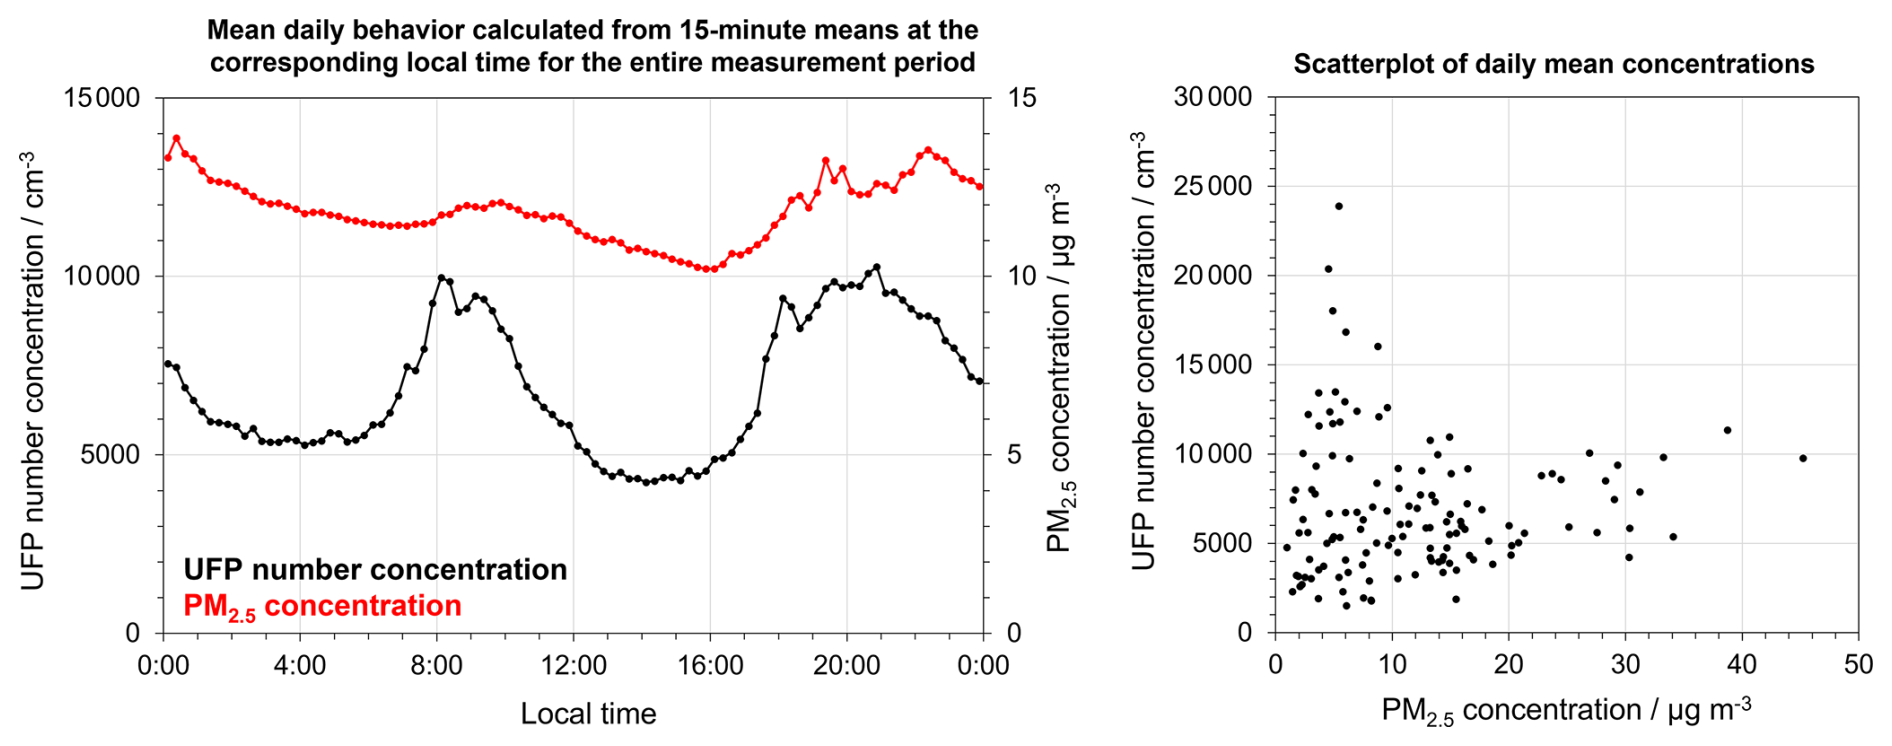
Figure 11The 15 min mean diurnal UFP (see Fig. 4 for UFP concentrations) and PM2.5 pattern for the entire measurement period and scatterplot of UFP and PM2.5 concentrations (compare Fig. 9 and Fig. 10).
In this case, the actual pollution with hazardous nanoparticles from wood combustion is not properly represented by “conventional” air quality monitoring (Fig. 11). There is no direct correlation between the PM2.5 and UFP measurements as UFPs are below the detectable size range of the Fidas Smart 100 device and remain undetected (additionally, their contribution to mass concentrations is very small – see also the scatterplot of the 15 min average UFP and PM2.5 concentrations in the Supplement). While there is also a slight diurnal pattern considering average PM2.5 concentrations compared to the large differences during peak exposure times in the morning and evening hours for UFP concentrations (e.g., factor of 2 compared to background level), the absolute difference in PM is comparably low (factor of 1.3–1.4). The (also mass-based but non-size-resolved) BC concentrations often increased from a close-to-zero background level up to 5 µg m−3 during the evening hours by comparison (Fig. 5).
Short-term exposures (e.g., covered by good-practice statements for UFPs in the form of 1 h maximum concentration) are not considered in the limits of the Ambient Air Quality Directive due to the daily and annual averaging periods of particle concentrations.
These results demonstrate that UFP monitoring is especially relevant for regions where domestic heating using wood as a combustion resource is employed. While significant UFP concentrations were measured in the residential area, the PM concentrations (mostly) comply with (or do not show a significant exceedance of) current and future PM concentration limits. For areas where measurement stations do indeed register an exceedance of PM concentration limits due to the emissions from wood-combustion for domestic heating as a main source, it has to be assumed that ambient air quality is likely to be affected by especially hazardous (black-carbon) nanoparticles.
Measurements of ultrafine particle concentrations applying a diffusion-charge-based UFP monitor were performed in a residential area in a small German town during a large fraction of the heating period of 2024–2025. The major source for air pollution in the residential area during this time was wood stove exhaust for domestic heating. Especially during the morning and evening hours, significant UFP concentration spikes were measured, causing a characteristic diurnal pattern. Here, average concentrations of approx. 10 000 cm−3 (corresponding to twice the typical background level) were measured when averaging the entire measurement period. The dispersion conditions have a large impact on the measured concentrations as, during the daytime, increased wind speeds occur and were measured at a reference wind measurement site and in the residential area. Higher wind speeds are linked to lower and/or decreasing UFP concentrations, and, for only low (or non-detectable) wind speeds, large UFP concentrations (e.g., exceeding 10 000 cm−3) were measured. On approx. 33.6 % of days during the measurement period, a maximum daily 1 h mean concentration of 20 000 cm−3 was exceeded according to the WHO good-practice statements regarding ultrafine particles. During these periods with increased wood smoke pollution (morning and evening hours), people are more likely to spend time at their homes (indoors). Depending on ventilation and/or air exchange between interiors and exteriors, they may or may not be exposed to this outdoor air pollution. Thus, how much individual homes are affected can vary significantly. Due to the small particle size, these UFPs from wood smoke do not contribute significantly to legally relevant PM concentrations, where a less pronounced diurnal pattern was shown with a scattered-light-based Fidas Smart 100. This research highlights the dissonance between the size distribution of wood smoke particle emissions from domestic heating (nanometer region) and conventional air quality measurements (mass-based PM concentrations). A follow-up publication will further discuss explorative (temporally resolved) black-carbon measurements and the link to UFP and PM concentration dynamics during this measurement period. Further research will aim to expand the setup to perform further characterization of the air pollutants measured in the residential area.
The data that support the findings of this study are openly available in the KITOpen Repository under the following DOI: https://doi.org/10.35097/2aab6yjdyfg4nr69 (Bächler et al., 2025).
The supplement related to this article is available online at https://doi.org/10.5194/ar-4-63-2026-supplement.
PB: conceptualization, methodology, investigation, resources, writing (original draft, review and editing). FW: conceptualization, validation, resources, data curation, writing (review and editing). SK: validation, data curation, writing (review and editing). AD: conceptualization, methodology, validation, resources, supervision, writing (review and editing).
The authors have the following competing interests: Frederik Weis and Sebastian Kohler are currently employed by Palas GmbH and worked on the development of the AQ Guard Smart 2000 measurement device. The peer-review process was guided by an independent editor, and the authors also have no other competing interests to declare.
Publisher's note: Copernicus Publications remains neutral with regard to jurisdictional claims made in the text, published maps, institutional affiliations, or any other geographical representation in this paper. The authors bear the ultimate responsibility for providing appropriate place names. Views expressed in the text are those of the authors and do not necessarily reflect the views of the publisher.
We kindly acknowledge the collaboration of Martin Kohler from the Institute of Meteorology and Climate Research at Karlsruhe Institute of Technology for providing the wind data from KITmast.
We kindly acknowledge the collaboration of Jeffrey Blair from Aethlabs for providing the MA350 measurement device.
This paper was edited by Evangelia Diapouli and reviewed by two anonymous referees.
Amin, M., Aun, S., Hang, L., Hata, M., Phairuang, W., and Masami, F.: Investigation into personal exposure to ultrafine particle (UFP) in Phnom Penh, Cambodia: A pilot study, Atmos. Pollut. Res., 12, 102307, https://doi.org/10.1016/j.apr.2024.102307, 2024.
Asbach, C., Todea, A. M., and Kaminski, H.: Evaluation of a Partector Pro for atmospheric particle number size distribution and number concentration measurements at an urban background site, Aerosol Research, 2, 1–12, https://doi.org/10.5194/ar-2-1-2024, 2024.
Bari, M. A., Baumbach, G., Kuch, B., and Scheffknecht, G.: Wood smoke as a source of particle-phase organic compounds in residential areas, Atmos. Environ., 31, 4722–4732, https://doi.org/10.1016/j.atmosenv.2008.09.006, 2009.
Bächler, P., Meyer, J., Ligotski, R., Krug, P., and Dittler, A.: Measurement of transient nanoparticle emissions of a municipal biomass incineration plant equipped with pulse-jet cleaned filters, Process Saf. Environ., 184, 601–614, https://doi.org/10.1016/j.psep.2024.02.013, 2024a.
Bächler, P., Weis, F., Kohler, S., and Dittler, A.: Exploratory measurements of ambient air quality in a residential area applying a diffusion charge based UFP monitor/Orientierende Messungen der Luftqualität in einem Wohngebiet mit einem auf Diffusionsaufladung basierten UFP-Monitor, GrdL, 01-02, 15–22, https://doi.org/10.37544/0949-8036-2024-01-02-17, 2024b.
Bächler, P., Weis, F., Kohler, S., and Dittler, A.: Measurement data of UFP-concentrations and PM2.5-concentrations during the winter months (Nov. 20, 2024 - Mar. 30, 2025) in a residential area near Karlsruhe, KITOpen Repository [data set], https://doi.org/10.35097/2aab6yjdyfg4nr69, 2025.
Beddows, D. C. S., Harrison, R. M., Gonet, T., Maher, B. A., and Odling, N.: Measurement of road traffic brake and tyre dust emissions using both particle composition and size distribution data, Environ. Pollut., 331, 121830, https://doi.org/10.1016/j.envpol.2023.121830, 2023.
Bianchi, F., Tröstl, J., Junninen, H., Frege, C., Henne, S., Hoyle, C. R., Molteni, U., Herrmann, E., Adamov, A., Bukowiecki, N., Chen, X., Duplissy, J., Gysel, M., Hutterli, M., Kangasluoma, J., Kontkanen, J., Kürten, A., Manninen, H. E., Münch, S., Peräkylä, O., Petäjä, T., Rondo, L., Williamson, C., Weingartner, E., Curtius, J., Worsnop, D. R., Kulmala, M., Dommen, J., and Baltensperger, U.: New particle formation in the free troposphere: A question of chemistry and timing, Science, 6289, 1109–1112, https://doi.org/10.1126/science.aad5456, 2016.
Blauer Engel: Kaminöfen für Holz, https://www.blauer-engel.de/de/zertifizierung/vergabekriterien#UZ212-2020, last access: 7 August 2025.
Blocken, B., Stathopoulos, T., Carmeliet, J., and Hensen, J. L. M.: Application of computational fluid dynamics in building performance simulation for the outdoor environment: an overview, J. Build. Perform. Simu., 2, 157–184, https://doi.org/10.1080/19401493.2010.513740, 2011.
Brouwer, D. H., Gijsbers, J. H. J., and Lurvink, M. W. M.: Personal exposure to ultrafine particles in the workplace: exploring sampling techniques and strategies, Ann. Occup. Hyg., 5, 439–453, https://doi.org/10.1093/annhyg/meh040, 2004.
Bundesministerium für Justiz und Verbraucherschutz, Bundesamt für Justiz: Erste Verordnung zur Durchführung des Bundes-Immissionsschutzgesetzes, Bundesministerium für Justiz und für Verbraucherschutz, https://www.gesetze-im-internet.de/bimschv_1_2010/ (last access: 7 August 2025), 2010.
Bürger, P. and Riebel, U.: Feasibility of high-temperature electrostatic precipitation for the removal of nanoparticles: A case study on iron oxide separation at up to 800 °C, J. Electrostat., 120, 103754, https://doi.org/10.1016/j.elstat.2022.103754, 2022.
Chen, S.-C., Tsai, C.-J., Chou, C. C.-K., Roam, G.-D., Cheng, S.-S., and Wang, Y.-N.: Ultrafine particles at three different sampling locations in Taiwan, Atmos. Environ., 4, 533–540, https://doi.org/10.1016/j.atmosenv.2009.10.044, 2010.
Cornette, J. F. P., Dyakov, I. V., Plissart, P., Bram, S., and Blondeau, J.: In-situ evaluation of a commercial electrostatic precipitator integrated in a small-scale wood chip boiler, J. Electrostat., 128, 103897, https://doi.org/10.1016/j.elstat.2024.103897, 2024.
Dada, L., Brem, B. T., Amarandi-Netedu, L.-M., Collaud Coen, M., Evangeliou, N., Hueglin, C., Nowak, N., Modini, R., Steinbacher, M., and Gysel-Beer, M.: Sources of ultrafine particles at a rural midland site in Switzerland, Aerosol Research, 3, 315–336, https://doi.org/10.5194/ar-3-315-2025, 2025.
Dall'Osto, M., Querol, X., Alastuey, A., O'Dowd, C., Harrison, R. M., Wenger, J., and Gómez-Moreno, F. J.: On the spatial distribution and evolution of ultrafine particles in Barcelona, Atmos. Chem. Phys., 13, 741–759, https://doi.org/10.5194/acp-13-741-2013, 2013.
Dilger, M., Armant, O., Ramme, L., Mülhopt, S., Sapcariu, S. C., Schlager, C., Dilger, E., Reda, A., Orasche, J., Schnelle-Kreis, J., Conlon, T. M., Yildirim, A. Önder, Hartwig, A., Zimmermann, R., Hiller, K., Diabaté, S., Paur, H.-R., and Weiss, C.: Systems toxicology of complex wood combustion aerosol reveals gaseous carbonyl compounds as critical constituents, Environ. Int., 179, 108169, https://doi.org/10.1016/j.envint.2023.108169, 2023.
Drewnick, F., Hings, S. S., Curtius, J., Eerdekens, G., and Williams, J.: Measurement of fine particulate and gas-phase species during the New Year's fireworks 2005 in Mainz, Germany, Atmos. Environ., 23, 4316–4327, https://doi.org/10.1016/j.atmosenv.2006.03.040, 2006.
Dröge, J., Klingelhöfer, D., Braun, M., and Groneberg, D. A.: Influence of a large commercial airport on the ultrafine particle number concentration in a distant residential area under different wind conditions and the impact of the COVID-19 pandemic, Environ. Pollut., 345, 123390, https://doi.org/10.1016/j.envpol.2024.123390, 2024.
Dunne, E. M., Gordon, H., Kürten, A., Almeida, J., Duplissy, J., Williamson, C., Ortega, I. K., Pringle, K. J., Adamov, A., Baltensperger, U., Barmet, P., Benduhn, F., Bianchi, F., Breitenlechner, M., Clarke, A., Curtius, J., Dommen, J., Donahue, N. M., Ehrhart, S., Flagan, R. C., Franchin, A., Guida, R., Hakala, J., Hansel, A., Heinritzi, M., Jokinen, T., Kangasluoma, J., Kirkby, J., Kulmala, M., Kupc, A., Lawler, M. J., Lehtipalo, K., Makhmutov, V., Mann, G., Mathot, S., Merikanto, J., Miettinen, P., Nenes, A., Onnela, A., Rap, A., Reddington, C. L. S., Riccobono, F., Richards, N. A. D., Rissanen, M. P., Rondo, L., Sarnela, N., Schobesberger, S., Sengupta, K., Simon, M., Sipilä, M., Smith, J. N., Stozkhov, Y., Tomé, A., Tröstl, J., Wagner, P. E., Wimmer, D., Winkler, P. M., Worsnop, D. R., and Carslaw, K. S.: Global atmospheric particle formation from CERN CLOUD measurements, Science, 6316, 1119–1124, https://doi.org/10.1126/science.aaf2649, 2016.
Dutschke, A., Lohrer, C., Kurth, L., Seeger, S., Barthel, M., and Panne, U.: Aerosol Emissions from Outdoor Firework Displays, Chem. Eng. Technol., 12, 2044–2050, https://doi.org/10.1002/ceat.201100080, 2011.
Elihn, K. and Berg, P.: Ultrafine particle characteristics in seven industrial plants, Ann. Occup. Hyg., 5, 475–484, https://doi.org/10.1093/annhyg/mep033, 2009.
European Union: Directive (EU) 2024/2881 of the European Parliament and of the Council of 23 October 2024 on ambient air quality and cleaner air for Europe (recast), https://eur-lex.europa.eu/eli/dir/2024/2881/oj (last access: 7 August 2025), 2024.
Garcia-Marlès, M., Lara, R., Reche, C., Pérez, N., Tobías, A., Savadkoohi, M., Beddows, D., Salma, I., Vörösmarty, M., Weidinger, T., Hueglin, C., Mihalopoulos, N., Grivas, G., Kalkavouras, P,. Ondráček, J., Zíková, N., Niemi, J. V., Manninen, H. E., Green, D. C., Tremper, A. H., Norman, M., Vratolis, S., Eleftheriadis, K., Gómez-Moreno, F. J., Alonso-Blanco, E., Wiedensohler, A., Weinhold, K., Merkel, M., Bastian, S., Hoffmann, B., Altug, H., Petit, J.-E., Favez, O., Dos Santos, S. M., Putaud, J.-P., Dinoi, A., Contini, D., Timonen, H., Lampilahti, J., Petäjä, T., Pandolfi, M., Hopke, P. K., Harrison, R. M., Alastuey, A., and Querol, X.: Inter-annual trends of ultrafine particles in urban Europe, Environ. Int., 185, 108510, https://doi.org/10.1016/j.envint.2024.108510, 2024a.
Garcia-Marlès, M., Lara, R., Reche, C., Pérez, N., Tobías, A., Savadkoohi, M., Beddows, D., Salma, I., Vörösmarty, M., Weidinger, T., Hueglin, C., Mihalopoulos, N., Grivas, G., Kalkavouras, P,. Ondráček, J., Zíková, N., Niemi, J. V., Manninen, H. E., Green, D. C., Tremper, A. H., Norman, M., Vratolis, S., Eleftheriadis, K., Gómez-Moreno, F. J., Alonso-Blanco, E., Wiedensohler, A., Weinhold, K., Merkel, M., Bastian, S., Hoffmann, B., Altug, H., Petit, J.-E., Favez, O., Dos Santos, S. M., Putaud, J.-P., Dinoi, A., Contini, D., Timonen, H., Lampilahti, J., Petäjä, T., Pandolfi, M., Hopke, P. K., Harrison, R. M., Alastuey, A., and Querol, X.: Source apportionment of ultrafine particles in urban Europe, Environ. Int., 194, 109149, https://doi.org/10.1016/j.envint.2024.109149, 2024b.
Hammer, T., Roos, D., Giechaskiel, B., Melas, A., and Vasilatou, K.: Influence of soot aerosol properties on the counting efficiency of instruments used for the periodic technical inspection of diesel vehicles, Aerosol Research, 2, 261–270, https://doi.org/10.5194/ar-2-261-2024, 2024.
Jeong, C.-H., Salehi, S., Wu, J., North, M. L., Kim, J. Sung, Chow, C.-W., and Evans, G. J.: Indoor measurements of air pollutants in residential houses in urban and suburban areas: Indoor versus ambient concentrations, Sci. Total Environ., 693, 133446, https://doi.org/10.1016/j.scitotenv.2019.07.252, 2019.
Joshi, M., Khan, A., Anand, S., and Sapra, B. K.: Size evolution of ultrafine particles: Differential signatures of normal and episodic events, Environ. Pollut., 208, 354–360, https://doi.org/10.1016/j.envpol.2015.10.001, 2016.
Junkermann, W. and Vogel, B.: Ultrafine particles over Germany – an aerial survey, Tellus B, 68, 29250, https://doi.org/10.3402/tellusb.v68.29250, 2022.
Kohler, M., Metzger, J., and Kalthoff, N.: Trends in temperature and wind speed from 40 years of observations at a 200-m high meteorological tower in Southwest Germany, Int. J. Climatol., 38, 23–34, https://doi.org/10.1002/joc.5157, 2018.
Kuhlbusch, T. A. J., John, A. C., and Fissan, H.: Diurnal variations of aerosol characteristics at a rural measuring site close to the Ruhr-Area, Germany, Atmos. Environ., 35, 13–21, https://doi.org/10.1016/S1352-2310(00)00489-1, 2001.
Kumar, P., Zavala-Reyes, J. C., Kalaiarasan, G., Abubakar-Waziri, H., Young, G., Mudway, I., Dilliway, C., Lakhdar, R., Mumby, S., Kłosowski, M. M., Pain, C. C., Adcock, I. M., Watson, J. S., Sephton, M. A., Chung, K. F., and Porter, A. E.: Characteristics of fine and ultrafine aerosols in the London underground, Sci. Total Environ., 858, 159315, https://doi.org/10.1016/j.scitotenv.2022.159315, 2023.
Le Huong, T., Tuan, V. A., and Vinh Man, N. D.: Commuter exposure to ultrafine particles (UFPs), lung deposited surface area (LDSA), and noise in Ho Chi Minh City, Vietnam, J. Transp. Health, 38, 101896, https://doi.org/10.1016/j.jth.2024.101896, 2024.
German National Academy of Sciences Leopoldina: Clean air – Nitrogen oxides and particulate matter in ambient air: Basic principles and recommendations, 1st edn., Deutsche Akademie der Naturforscher Leopoldina, Halle (Saale), ISBN (eng) 978-3-8047-4013-6, ISBN (ger) 978-3-8047-4012-9, 2019.
Marten, R., Xiao, M., Rörup, B., Wang, M., Kong, W., He, X.-C., Stolzenburg, D., Pfeifer, J., Marie, G., Wang, D. S., Scholz, W., Baccarini, A., Lee, C. Ping, Amorim, A., Baalbaki, R., Bell, D. M., Bertozzi, B., Caudillo, L., Chu, B., Dada, L., Duplissy, J., Finkenzeller, H., Carracedo, L. Gonzalez, Granzin, M., Hansel, A., Heinritzi, M., Hofbauer, V., Kemppainen, D., Kürten, A., Lampimäki, M., Lehtipalo, K., Makhmutov, V., Manninen, H. E., Mentler, B., Petäjä, T., Philippov, M., Shen, J., Simon, M., Stozhkov, Y., Tomé, A., Wagner, A. C., Wang, Y., Weber, S. K., Wu, Y., Zauner-Wieczorek, M., Curtius, J., Kulmala, M., Möhler, O., Volkamer, R., Winkler, P. M., Worsnop, D. R., Dommen, J., Flagan, R. C., Kirkby, J., Donahue, N. M., Lamkaddam, H., Baltensperger, U., and El Haddad, I.: Survival of newly formed particles in haze conditions, Environ. Sci. Atmos., 3, 491–499, https://doi.org/10.1039/d2ea00007e, 2022.
Matthes, M., Hartmann, I., Groll, A., and Riebel, U.: Investigation on application and performance of emission reduction measures at a pellet boiler, Biomass Conv. Bioref., 3, 301–313, https://doi.org/10.1007/s13399-015-0187-1, 2016.
Matson, U.: Indoor and outdoor concentrations of ultrafine particles in some Scandinavian rural and urban areas, Sci. Total Environ., 343, 169–176, https://doi.org/10.1016/j.scitotenv.2004.10.002, 2005.
Mohan, V., Kumar Soni, V., and Kumar Mishra, R.: Analysing the impact of day-night road traffic variation on ultrafine particle number size distribution and concentration at an urban site in the megacity Delhi, Atmos. Pollut. Res., 4, 102065, https://doi.org/10.1016/j.apr.2024.102065, 2024.
Moreno Camacho, F. L., Bustos Quevedo, D., Archila-Peña, D., Pachón, J. E., Rojas, N. Y., Mateus-Fontecha and Blanco, K.: Number Concentration, Size Distribution, and Lung-Deposited Surface Area of Airborne Particles in Three Urban Areas of Colombia, Atmosphere, 5, 558, https://doi.org/10.3390/atmos16050558, 2025.
Mukherjee, A., Hartikainen, A., Joutsensaari, J., Basnet, S., Mesceriakovas, A., Ihalainen, M., Yli-Pirilä, P., Leskinen, J., Somero, M., Louhisalmi, J., Fang, Z., Kalberer, M., Rudich, Y., Tissari, J., Czech, H., Zimmermann, R., and Sippula, O.: Black carbon and particle lung-deposited surface area in residential wood combustion emissions: Effects of an electrostatic precipitator and photochemical aging, Sci. Total Environ., 952, 175840, https://doi.org/10.1016/j.scitotenv.2024.175840, 2024.
Mylläri, F., Kuittinen, N., Aurela, M., Lepistö, T., Heikkilä, P., Salo, L., Markkula, L., Karjalainen, P., Kuula, J., Harni, S., Kyllönen, K., Similä, S., Kirvelä, K., Autio, J., Palonen, M., Valtatie, J., Häyrinen, A., Timonen, H., and Rönkkö, T.: Primary particle emissions and atmospheric secondary aerosol formation potential from a large-scale wood-pellet-fired heating plant, Aerosol Research, 4, 23–35, https://doi.org/10.5194/ar-4-23-2026, 2026.
Neukirchen, C., Saraji-Bozorgzad, M. Reza, Mäder, M., Mudan, A. Paul, Czasch, P., Becker, J., Di Bucchianico, S., Trapp, C., Zimmermann, R., and Adam, T.: Comprehensive elemental and physical characterization of vehicle brake wear emissions from two different brake pads following the Global Technical Regulation methodology, J. Hazard Mater., 136609, https://doi.org/10.1016/j.jhazmat.2024.136609, 2025.
Norra, S., Song, J., Gebhardt, R., Bauer, J., Broß, M., Fuchs, M., Huber, T., Mack, D., and Saathoff, H.: Spatio-temporal dynamics of aerosol distribution in an urban environment recorded in situ by means of a bike based monitoring system, Front. Environ. Sci., 11, https://doi.org/10.3389/fenvs.2023.749477, 2023.
Nyarku, M., Buonanno, G., Ofosu, F., Jayaratne, R., Mazaheri, M., and Morawska, L.: Ultrafine particles in key microenvironments in rural and urban areas of Ghana, Atmos. Pollut. Res., 11, 101212, https://doi.org/10.1016/j.apr.2021.101212, 2021.
Ohlwein, S., Kappeler, R., Kutlar Joss, M., Künzli, N., and Hoffmann, B.: Health effects of ultrafine particles: a systematic literature review update of epidemiological evidence, Int. J. Public Health, 64, 547–559, https://doi.org/10.1007/s00038-019-01202-7, 2019.
Palas GmbH: Product information of AQGuard Smart 2000, https://www.palas.de/en/product/aq-guard-smart2000, last access: 25 November 2025.
Pierce, J. R. and Adams, P. J.: Efficiency of cloud condensation nuclei formation from ultrafine particles, Atmos. Chem. Phys., 7, 1367–1379, https://doi.org/10.5194/acp-7-1367-2007, 2007.
Ridolfo, S., Querol, X., Karanasiou, A., Rodríguez-Luque, A., Pérez, N., Alastuey, A., Jaén, C., van Drooge, B. L., Pandolfi, M., Pedrero, M., and Amato, F.: Size distribution, sources and chemistry of ultrafine particles at Barcelona-El Prat Airport, Spain, Environ. Int., 194, 109057, https://doi.org/10.1016/j.envint.2024.109057, 2024.
Samad, A., Arango, K., Alvarez Florez, D., Chourdakis, I., and Vogt, U.: Assessment of Coarse, Fine, and Ultrafine Particles in S-Bahn Trains and Underground Stations in Stuttgart, Atmosphere, 11, 1875, https://doi.org/10.3390/atmos13111875, 2022.
Schiller, S. and Schmid, H.-J.: Highly efficient filtration of ultrafine dust in baghouse filters using precoat materials, Powder Technol., 279, 96–105, https://doi.org/10.1016/j.powtec.2015.03.048, 2015.
Shrivastava, M., Fan, J., Zhang, Y., Rasool, Q. Z., Zhao, B., Shen, J., Pierce, J. R., Jathar, S. H., Akherati, A., Zhang, J., Zaveri, R. A., Gaudet, B., Liu, Y., Andreae, M. O., Pöhlker, M. L., Donahue, N. M., Wang, Y., and Seinfeld, J. H.: Intense formation of secondary ultrafine particles from Amazonian vegetation fires and their invigoration of deep clouds and precipitation, One Earth, 6, 1029–1043, https://doi.org/10.1016/j.oneear.2024.05.015, 2024.
Song, J., Saathoff, H., Jiang, F., Gao, L., Zhang, H., and Leisner, T.: Sources of organic gases and aerosol particles and their roles in nighttime particle growth at a rural forested site in southwest Germany, Atmos. Chem. Phys., 24, 6699–6717, https://doi.org/10.5194/acp-24-6699-2024, 2024.
Stacey, B.: Measurement of ultrafine particles at airports: A review, Atmos. Environ., 463–477, https://doi.org/10.1016/j.atmosenv.2018.10.041, 2019.
Sun, J., Birmili, W., Hermann, M., Tuch, T., Weinhold, K., Spindler, G., Schladitz, A., Bastian, S., Löschau, G., Cyrys, J., Gu, J., Flentje, H., Briel, B., Asbach, C., Kaminski, H., Ries, L., Sohmer, R., Gerwig, H., Wirtz, K., Meinhardt, F., Schwerin, A., Bath, O., Ma, N., and Wiedensohler, A.: Variability of black carbon mass concentrations, sub-micrometer particle number concentrations and size distributions: results of the German Ultrafine Aerosol Network ranging from city street to High Alpine locations, Atmos. Environ., 256–268, https://doi.org/10.1016/j.atmosenv.2018.12.029, 2019.
Teutscher, D., Bukreev, F., Kummerländer, A., Simonis, S., Bächler, P., Rezaee, A., Hermansdorfer, M., and Krause, M. J.: A digital urban twin enabling interactive pollution predictions and enhanced planning, Build. Environ., 113093, https://doi.org/10.1016/j.buildenv.2025.113093, 2025.
Thieringer, J. R. D., Szabadi, J., Meyer, J., and Dittler, A.: Impact of Residential Real-World Wood Stove Operation on Air Quality concerning PM2.5 Immission, Processes, 3, 545, https://doi.org/10.3390/pr10030545, 2022.
Trebs, I., Lett, C., Krein, A., and Junk, J.: Air quality impacts of aviation activities at a mid-sized airport in central Europe, Atmos. Pollut. Res., 3, 101696, https://doi.org/10.1016/j.apr.2023.101696, 2023.
Trechera, P., Garcia-Marlès, M., Liu, X., Reche, C., Pérez, N., Savadkoohi, M., Beddows, D., Salma, I., Vörösmarty, M., Casans, A., Casquero-Vera, J. Andrés, Hueglin, C., Marchand, N., Chazeau, B., Gille, G., Kalkavouras, P., Mihalopoulos, N., Ondracek, J., Zikova, N., Niemi, J. V., Manninen, H. E., Green, D. C., Tremper, A. H., Norman, M., Vratolis, S., Eleftheriadis, K., Gómez-Moreno, F. J., Alonso-Blanco, E., Gerwig, H., Wiedensohler, A., Weinhold, K., Merkel, M., Bastian, S., Petit, J.-E., Favez, O., Crumeyrolle, S., Ferlay, N., Martins Dos Santos, S., Putaud, J.-P., Timonen, H., Lampilahti, J., Asbach, C., Wolf, C., Kaminski, H., Altug, H., Hoffmann, B., Rich, D. Q., Pandolfi, M., Harrison, R. M., Hopke, P. K., Petäjä, T., Alastuey, A., and Querol, X.: Phenomenology of ultrafine particle concentrations and size distribution across urban Europe, Environ. Int., 172, 107744, https://doi.org/10.1016/j.envint.2023.107744, 2023.
Tremper, A. H., Jephcote, C., Gulliver, J., Hibbs, L., Green, D. C., Font, A., Priestman, M., Hansell, A. L., and Fuller, G. W.: Sources of particle number concentration and noise near London Gatwick Airport, Environ. Int., 161, 107092, https://doi.org/10.1016/j.envint.2022.107092, 2022.
Trojanowski, R. and Fthenakis, V.: Nanoparticle emissions from residential wood combustion: A critical literature review, characterization, and recommendations, Renew. Sust. Energ. Rev., 103, 515–528, https://doi.org/10.1016/j.rser.2019.01.007, 2019.
Turner, A., Wolfe, C., and Ryan, P. H.: Personal exposure to ultrafine particles in multiple microenvironments among adolescents, J. Expo. Sci. Env. Epid., 5, 878–885, https://doi.org/10.1038/s41370-023-00638-7, 2024.
Utinger, B., Barth, A., Paul, A., Mukherjee, A., Campbell, S. J., Müller, C.-M., Ihalainen, M., Yli-Pirilä, P., Kortelainen, M., Fang, Z., Martens, P., Somero, M., Louhisalmi, J., Hohaus, T., Czech, H., Sippula, O., Rudich, Y., Zimmermann, R., and Kalberer, M.: Emission dynamics of reactive oxygen species and oxidative potential in particles from a petrol car and wood stove, Aerosol Research, 3, 205–218, https://doi.org/10.5194/ar-3-205-2025, 2025.
Wang, D., Li, Q., Shen, G., Deng, J., Zhou, W., Hao, J., and Jiang, J.: Significant ultrafine particle emissions from residential solid fuel combustion, Sci. Total Environ., 715, 136992, https://doi.org/10.1016/j.scitotenv.2020.136992, 2020.
Wang, Y., Hopke, P. K., Chalupa, D. C., and Utell, M. J.: Long-term study of urban ultrafine particles and other pollutants, Atmos. Environ., 45, 7672–7680, https://doi.org/10.1016/j.atmosenv.2010.08.022, 2011.
WHO (World Health Organization): WHO global air quality guidelines: particulate matter (PM2.5 and PM10), ozone, nitrogen dioxide, sulfur dioxide and carbon monoxide, https://www.who.int/publications/i/item/9789240034228 (last access: 7 August 2025), 2021.
WHO (World Health Organization): Air quality guidelines global update 2005, https://www.who.int/publications/i/item/WHO-SDE-PHE-OEH-06.02 (last access: 7 August 2025), 2005.
Yin, S., Lu, Z., Zhang, Y., Song, L., Bi, S., Luo, X., Yao, L., Bi, X., Bo, H., and Feng, Y.: Characteristics of number concentration, size distribution and components of particulate matter emitted from a typical large civil airport, Sci. Total Environ., 927, 172040, https://doi.org/10.1016/j.scitotenv.2024.172040, 2024.
Zhang, H., Huang, W., Shen, X., Ramisetty, R., Song, J., Kiseleva, O., Holst, C. C., Khan, B., Leisner, T., and Saathoff, H.: Aerosol composition, air quality, and boundary layer dynamics in the urban background of Stuttgart in winter, Atmos. Chem. Phys., 24, 10617–10637, https://doi.org/10.5194/acp-24-10617-2024, 2024.
Zhu, Y., Hinds, W. C., Kim, S., and Sioutas, C.: Concentration and size distribution of ultrafine particles near a major highway, J. Air Waste. Manag. Assoc., 9, 1032–1042, https://doi.org/10.1080/10473289.2002.10470842, 2002.