the Creative Commons Attribution 4.0 License.
the Creative Commons Attribution 4.0 License.
 | 27 Jan 2025
Performance evaluation of four cascade impactors for airborne ultrafine-particle (UFP) collection: the influence of particle type, concentration, mass, and chemical nature
Elisabeth Eckenberger
Andreas Mittereder
Nadine Gawlitta
Jürgen Schnelle-Kreis
Martin Sklorz
Dieter Brüggemann
Ralf Zimmermann
Anke C. Nölscher
Ultrafine particles (UFPs) have aerodynamic diameters of 100 nm or less. As UFPs potentially impact human and environmental health, their chemical composition is of interest. However, their small mass presents challenges for sampling and chemical characterization methods. Therefore, we conducted a comprehensive characterization and comparison of four cascade impactors suitable for separating and collecting UFPs – namely, the 120R Micro-Orifice Uniform Deposit Impactor (120R MOUDI-II), ultraMOUDI, electrical low-pressure impactor (ELPI), and personal nanoparticle sampler (PENS) – under controlled laboratory conditions and in a field application.
In the laboratory, we evaluated pressure drops, cutoff diameters, the steepness of the cutoff curve, losses, particle bounce, and transmitted particle mass. We observed that the performance of the impactors varied between 59 and 116 nm in cutoff diameter (electromobility diameter), depending on the impactor's design and the type of test aerosol mixture – salt particles (NaCl), simulated secondary organic aerosol (SimSOA), or soot. All impactors separated UFPs, with the best agreement in cutoff diameters for SimSOA, which showed maximum deviations of about 4 nm. The cutoff curve was steeper for soot compared to SimSOA and NaCl. Pressure drops were measured at 260 ± 1 hPa (PENS), 420 ± 2 hPa (ultraMOUDI), 600 ± 3 hPa (120R MOUDI-II), and 690 ± 3 hPa (ELPI). Losses were assessed as maximum transmissions in the ultrafine fraction at 30 nm, yielding 83 ± 8 % for the PENS, 77 ± 8 % for the ultraMOUDI, 75 ± 8 % for the 120R MOUDI-II, and 69 ± 7 % for the ELPI. We compared two additional impactor-specific factors crucial for mass-based analyses of organic marker compounds: the evaporation of semi-volatile compounds due to a high-pressure drop across the impactor and material addition from larger particles bouncing off upper stages. “Bounce-off” was influenced by the particle number concentration in the sampled air and could be partially mitigated by applying a coating to the upper impaction plates.
In the field application, we deployed the four cascade impactors side by side under environmental conditions to sample urban air. We analyzed six markers representing typical UFP sources and various molecular properties using HPLC-MS/FLD (high-performance liquid chromatography with mass spectrometry and fluorescence detection). These markers comprised benzo[a]pyrene (BaP), benzo[b]fluoranthene (BbF), levoglucosan (Levo), pinic acid (PA), terpenylic acid (TA), and N-(1,3-dimethylbutyl)-N'-phenyl-p-phenylenediamine (6PPD). The impactors showed the best agreement for BaP and BbF. BaP had an average mass concentration of 175 ± 25 pg m−3 across all impactors and sampling days. However, concentrations were about 29 % higher when sampled with the PENS and 30 % lower when sampled with the 120R MOUDI-II, indicating a maximum disagreement of nearly 60 %.
The mass concentrations of the semi-volatile markers (PA, TA, and Levo) decreased on average from the PENS to the ultraMOUDI, then to the 120R MOUDI-II, and finally to the ELPI. We attributed this tendency to the following two effects. (1) Evaporation losses of these markers were likely driven by the pressure drop within the impactor, which increased from the PENS to the ELPI. (2) Despite the applied coating, bounce-off might have affected the smallest impactors (i.e., the PENS and ultraMOUDI) the most as they have fewer stages for retaining larger particles and fragments.
- Article
(2057 KB) - Full-text XML
-
Supplement
(607 KB) - BibTeX
- EndNote


The characterization of ultrafine particles (UFPs) in the atmosphere is key to understanding the causes and impacts of air pollution. UFPs are defined as particulate matter with aerodynamic diameters of 100 nm or less. They have gained considerable attention due to their potential impacts on human health and the environment (Kumar et al., 2014, 2021; Schwarz et al., 2023. Furthermore, airborne UFPs are naturally linked to weather and climate as they might alter the Earth's radiative budget directly or indirectly when growing and activating to form cloud droplets (Junkermann et al., 2022). The size and chemical composition of UFPs are thus crucial properties for assessing their sources and atmospheric fate, as well as potential adverse effects.
Information about the size and chemical composition of airborne particulate matter can be collected via impactors. Impactors allow for the separation of particles in an air sample based on their aerodynamic diameter (da). The physical separation of particles within an impactor is based on the particles' inertia, which causes smaller particles to continue moving when the airflow bends sharply – for example, when forced through nozzles, orifices, or slits (Baron and Willeke, 2011). Upon separation, the particles can be collected on impaction plates or downstream of the impactor by using filter substrates, such as aluminum foil, PTFE, or quartz fiber filters. Particles caught on the substrate can be extracted and undergo chemical analysis to determine their composition (Bein and Wexler, 2014; Canepari et al., 2010; Daher et al., 2011). To describe the separation and collection efficiency, dp50 – the diameter at which particles are collected with 50 % efficiency – is used. Indeed, the dp50 value, or cutoff diameter, for a given impactor design will depend on the nozzle diameter and the flow rate.
A stack of impactors, consisting of impactor-plate–nozzle-plate pairs, forms a cascade impactor. Within the cascade impactor, the nozzles or slits become increasingly smaller, causing the air to move faster through these orifices. Large particles impact earlier, while smaller particles travel further through the impactor and are collected at later stages. Cascade impactors were first employed in the 1860s to study the relationship between airborne particles and diseases (Marple, 2004). Later models enabled size classification in the sub-micrometer range (May, 1945; Berner et al., 1979; Brink, 1958; Mitchell and Pilcher, 1959). Examples include the Berner and Anderson impactors (Hata et al., 2012; Hillamo and Kauppinen, 1991); the electrical low-pressure impactor (ELPI), which can be used for real-time size distribution measurements (Keskinen et al., 1992; Marjamäki et al., 2000; Held et al., 2008); the Micro-Orifice Uniform Deposit Impactor (MOUDI), which is capable of capturing particles as small as 0.056 µm (Marple et al., 1991); miniaturized impactors, such as the personal nanoparticle sampler (PENS) (Tsai et al., 2012); and the novel development of small samplers for ultrafine particles (Thongyen et al., 2015; Kumsanlas et al., 2019; Gong et al., 2023).
Several recent studies have focused on airborne UFP chemical analyses using cascade impactor sampling. For example, the MOUDI has been used at Frankfurt Airport to analyze size-resolved UFP emissions from aircraft, identifying organic compounds such as esters from jet engine oils (Ungeheuer et al., 2021). In Rio de Janeiro, the MOUDI was used to collect ultrafine and coarser particles from vehicular emissions in an urban area, and the trace element composition was analyzed across various particle sizes, detecting cadmium, nickel, lead, chromium, and iron, particularly in the UFP ranges (de Souza et al., 2021). The ELPI can be used for the simultaneous real-time sampling of particle size distributions and offline chemical analysis, as demonstrated, for example, by Kim et al. (2013), who classified and characterized airborne particulate matter from a rubber manufacturing plant. In the surroundings of a former electronic waste recycling facility, the ELPI was used to detect real-time airborne particles in the size range of 0.03–10 µm (Guo et al., 2023). Moreover, a size-resolved chemical characterization of airborne particles from indoor sources, such as candles, mosquito coils, and cooking activities, highlighted heavy metals and polycyclic aromatic hydrocarbons (PAHs) in the ultrafine fraction (Caracci et al., 2024). Similarly, other working environments were characterized in terms of personal exposure via the application of a portable PENS (e.g., Pomata et al., 2023; Young et al., 2013). The PENS has also been employed in air quality studies, such as those conducted in rural and urban China during winter, for the chemical analysis of biomass-burning tracers (e.g., levoglucosan) (Zhu et al., 2017). While not exhaustive, these examples underscore the growing number of applications of, as well as the increasing interest in, diverse types of target analytes. This raises the question of comparability between cascade impactor applications for the chemical analysis of atmospheric ultrafine particles.
The challenge, particularly when it comes to the separation and collection of UFPs from the atmosphere using cascade impactors, is unequivocally associated with the remarkably small mass of UFPs. This small mass, as opposed to fine particulate matter (PM2.5), presents a substantial hurdle in conducting gravimetric or chemical analyses. Specifically, UFP collection with cascade impactors is sensitive to the following aspects:
-
The cutoff diameter for UFPs from the last impactor stage (dp50 = 100 nm, referring to aerodynamic diameter) depends on the impactor's design and operational characteristics, such as the diameter, nozzle size, flow rate, distances between plates, and shape. Moreover, real atmospheric particles, with various shapes and densities, will vary in impaction behavior and thus potentially influence the separation.
-
The loss of UFPs on walls or in earlier stages could result in the retention of particulate material.
-
During collection, either larger particles bounce or break into fragments and experience re-entrainment, adding mass to the filter substrate dedicated to UFPs, or target UFPs bounce off the collection substrate and are lost from the analysis.
-
Semi-volatile particle-bound components may evaporate from already collected particulate surfaces during ongoing sampling due to reduced pressure within the impactor and continuous ventilation. This can result in alterations in the chemical composition due to interactions with the gaseous phase.
Therefore, in this study, we explored cutoff diameters, potential losses, artifacts due to “bounce-off”, and evaporation with respect to four different cascade impactors capable of separating and sampling UFPs. Our overall aim was to identify and quantify organic marker compounds in the collected UFPs. The four cascade impactors differed in terms of design, flow rate, the number of stages, and other factors. We expected that these differences would significantly impact the abovementioned aspects and, therefore, lead to different results for the analyzed mass concentrations of the selected organic marker compounds within the collected UFPs.
2.1 Impactors for UFP sampling
Today, several cascade impactors exist that are either commercially available or newly developed (Crazzolara and Held, 2024; Ngagine et al., 2022; Järvinen et al., 2014; Romay and García-Ruiz, 2023; Marple et al., 2014; Tsai et al., 2012). For our comparison, we selected four commercially available models for sampling atmospheric UFPs that have different designs, flow rates, and stage numbers. Additionally, we aimed to sample all particles ≤100 nm on one substrate without further separation. Moreover, we envisioned the use of an automated filter changer in future applications, which is possible with all selected models. Some of these selected impactors required minor adjustments to make them suitable for achieving the final cutoff diameter of 100 nm. Aside from these adjustments, which are outlined in the following, the cascade impactors were operated as described by the manufacturers.
For each impactor and measurement, the aerosol flow was regulated between the impactor and its pump. The flow rate was determined at the impactor's inlet with a Gilibrator-2 bubble flow meter and rechecked following each collection interval.
Rotating 10-stage 120R MOUDI-II. The MOUDI utilizes numerous micro-orifice nozzles to reduce jet velocity, pressure drop, particle bounce, and re-entrainment while enhancing collection efficiency and enabling a uniform deposition on the impaction plate (Marple et al., 1991). Each pair of nozzle and impaction plates is called a stage. The uniform deposition prevents particle buildup and allows for a greater collection mass without overloading. It is further supported by rotating the impaction plates relative to the nozzles while distributing the sampled particles over the sampling substrates. Earlier MOUDI models (Models 110 and 115) achieve relative rotation between the impaction and nozzle plates by rotating alternate impactor stages using external gears and hooks that mesh with an external drive shaft powered by an electric gear motor. In contrast, the newest model (120R MOUDI-II, MSP Corp., Shoreview, MN, USA) has impaction plates that are directly mounted onto miniature stepper motors, which are housed within a chamber situated in the center of each stage. Therefore, the 120R MOUDI-II model offers an undisturbed flow path from the impaction plate to the following stage's nozzle plate. This design is expected to show relatively low particle losses compared to previous models (Marple et al., 2014).
In this study, we modified the 120R MOUDI-II by removing the 0.56 nm stage (including the nozzle and impaction plates) located below the 100 nm cutoff diameter stage. This modification allowed us to collect all particles ≤100 nm in the original “after-filter” holder mounted at the impactor outlet. As recommended, we operated the 120R MOUDI-II model at a flow rate of 30 L min−1. It separated airborne particulate matter into nine fractions with nominal cutoff diameter (dp50) values of 0.10, 0.18, 0.32, 0.56, 1.0, 1.8, 3.2, 5.6, and 10 µm. We equipped all upper stages with pieces of aluminum foil with a 47 mm diameter, which were greased at a later stage of the experiments. We placed a 47 mm quartz fiber filter (QFF; Whatman QM-H) in the after-filter holder for the collection of UFPs.
Non-rotating three-stage MOUDI (ultraMOUDI). In contrast to the 10-stage 120R MOUDI-II model, this compact MOUDI model has three non-rotating stages (MOUDI 100-2.5-1-0.1, MSP Corp., Shoreview, MN, USA). The internal construction of these stages is similar to that of Models 110 and 115 and shares the same inlet and outlet design. We asked the manufacturer for three stages with cutoff diameters of 0.1, 1, and 2.5 µm. Here, we employed the ultraMOUDI with pieces of aluminum foil (47 mm diameter) on the impaction plates. The after-filter holder was equipped with a 47 mm quartz fiber filter (Whatman QM-H). The flow rate through the impactor was 30 L min−1. Due to its reduced size and weight, this impactor could be integrated into an automated sampler for independent long-term observations of UFPs.
ELPI. The ELPI (Dekati Ltd., Tampere, Finland; Keskinen et al., 1992) separates and counts particles simultaneously in the respective stages while sampling. In this way, the ELPI determines particle size distributions ranging from 30 nm to 10 µm. Sampled particles are first charged to a predetermined level. These charged particles are then classified by aerodynamic diameter within the cascade impactor. Lastly, a multichannel electrometer simultaneously measures the charges carried by the collected particles to each stage, providing a measurement for the particle number concentration. The particle classification is achieved using a multi-jet impactor, where stage 1 has the smallest cutoff diameter and stage 13 has the largest (diameters: 0.03, 0.06, 0.09, 0.17, 0.26, 0.40, 0.65, 1.0, 1.6, 2.5, 4.4, 6.8, and 10 µm). The jet orifices are symmetrically drilled in rings around the center of each stage. Stage 1 of the impactor serves as a critical orifice, regulating the flow rate to 30 L min−1 and creating a low pressure, which is thought to ensure the impaction of even the smallest particles (Marjamäki et al., 2000).
For this study, we extracted the cascade impactor component from the ELPI and treated it as a standalone impactor, excluding the charger and electrometer. For the collection of UFPs, we removed the stages with cutoff diameters of 0.03 and 0.06 µm to achieve a final cutoff size of 0.09 µm for stage 3. To maintain the flow characteristics, secure the impaction plates in the built-in tensioner, and ensure appropriate spacing between the nozzle and collection plates, placeholders were inserted. The flow was adjusted with a valve. On the upper stages, aluminum foil filters (25 mm, Dekati Ltd.) were installed. For the collection of UFPs, a 37 mm QFF was installed in the after-filter holder provided by the manufacturer.
PENS. The PENS (Haze Control System Inc., Taiwan) was recently designed by Tsai et al. (2012) as a three-part system for the collection of airborne particles. The first part is a respirable cyclone that separates particles larger than 4 µm in aerodynamic diameter. The second part is a micro-orifice impactor, where particles sized from 0.1 to 4 µm impact on an impaction plate. The final part consists of a filter holder containing a 37 mm quartz fiber filter, which collects UFPs. Compared to the previously described devices, the PENS is compact, with dimensions of 107 mm in length and 44 mm in width, as well as a total weight of 240 g. This makes the PENS portable and useful for personal exposure studies (Young et al., 2013). The manufacturer modified the PENS used in this study to separate the particles into fractions of 2.5 and 0.1 µm and to operate at a sampling flow rate of 4 L min−1. The impaction plate itself is not suitable for installing a filter. For the collection of UFPs within the after-filter, we utilized a 37 mm quartz fiber filter (Whatman QM-H).
2.2 Overview of laboratory tests for evaluating the performance of the four impactors for UFP separation and collection
To test the four cascade impactors under controlled conditions, we conducted a series of laboratory tests. Our objective was to determine the pressure drop, transmission, UFP cutoff diameter, and potential artifacts of each impactor. Therefore, we generated three types of test aerosols and used reference instrumentation to quantify UFPs. In this way, we detected the particle number size distribution before and after the test aerosol passed through the impactors.
2.2.1 Detection of particle number size distributions
We monitored the particle number size distributions for the four cascade impactors with two complementary instruments. For accurate and sensitive observations, a mobility particle size spectrometer (MPSS) was deployed. However, the analysis of cutoff performance for impactors with a pressure drop of several hundred hectopascals (hPa) posed a challenge to the MPSS flow regulation. Thus, for fast and repetitive measurements recorded under low pressure, a real-time differential mobility spectrometer (DMS) was used. However, this instrument has comparatively low sensitivity.
MPSS
The MPSS (manufactured by TROPOS, Leibniz Institute for Tropospheric Research) classifies and quantifies airborne particles based on the principle of the mobility of charged particles in an electric field (Wiedensohler et al., 2012, 2018). Sampled particles are neutralized to achieve a Fuchs equilibrium charge distribution and then classified by a differential mobility analyzer (DMA) based on electrical mobility and detected with a condensation particle counter (CPC). The particle number size distribution is obtained by scanning the voltage applied to the DMA, typically covering a range of 10 to 800 nm. The MPSS is capable of detecting down to 10 particles per cm3 per scan (Wiedensohler et al., 2012). The MPSS data were processed following the protocol by Wiedensohler et al. (2012), including corrections for particle losses and CPC counting efficiency. The MPSS measurements had an uncertainty of ± 10 %.
DMS500
The DMS500 (Cambustion) uses a corona diffusion charger and a classification column with electrometers to detect particle concentrations across a size range of 5 nm to 2.5 µm, with a time resolution on the order of milliseconds (Symonds et al., 2007). The air sample is diluted twice before classification, leading to a comparatively low sensitivity of 170 cm−3 for 80 nm particles. The DMS500 was calibrated using polystyrene latex spheres (3320A/3495A, Thermo Scientific, National Institute of Standards and Technology (NIST)), and data were processed using DMS software (DMS 6.09 complemented by DMS Excel Utilities 7.49). The overall uncertainty in the instrument was ± 23 %, calculated based on the relative standard deviation for the test particle mixtures (Cambustion Ltd., 2019; Symonds et al., 2004; see Sect. 2.2.2).
2.2.2 Test particle generation
To determine the cutoff characteristics of the individual impactors under controlled conditions, we used a laboratory test bed consisting of a defined particle source, the test impactor, and a reference instrument (such as the MPSS or DMS500), which determined the particle number size distributions. If needed, the impactors were modified to have a cutoff diameter of 100 nm at the last stage (see Sect. 2.1.). Furthermore, we removed the after-filter holder in order to directly assess the transmitted particles with the online reference instruments. Instead, following the impactor, a “Y” piece made of stainless steel (inner diameter: 15 mm) was installed, directing the airflow to the detector and a pump. The pump was adjusted to achieve the correct overall sampling flow for the impactor. The test impactor was then connected to one of three different particle sources. The setup is presented in Fig. 1.
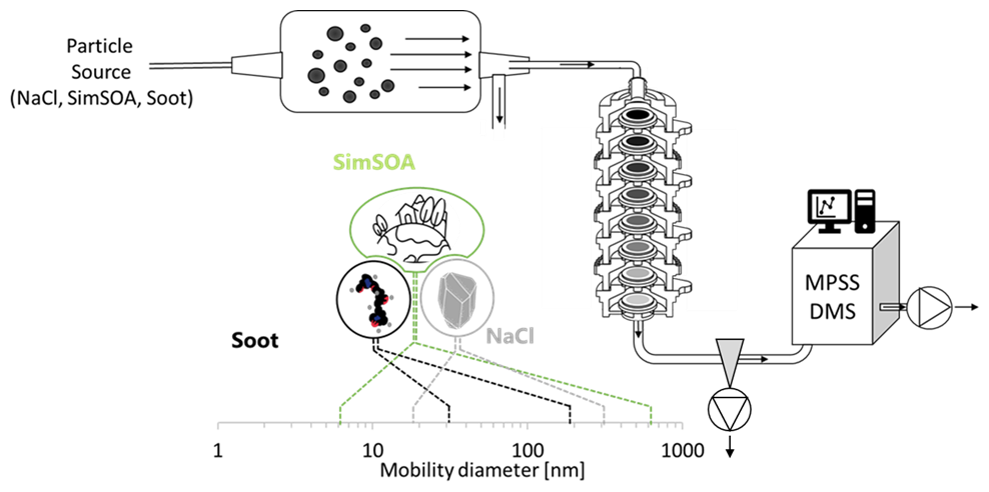
Figure 1Schematic experimental setup used to evaluate the cutoff characteristics of various impactors: the 120R MOUDI-II, ELPI, PENS, and ultraMOUDI. Three different types of particles were generated: (1) NaCl (produced by spraying a saline solution), (2) simulated secondary organic aerosol (SimSOA) (generated through a chamber experiment involving particle formation from α-pinene and ozone, including seed particles), and (3) soot (produced by a diesel engine) (Sect. 2.2.2).
NaCl particles
First, we generated salt particles from sodium chloride (NaCl). The particles were generated using a commercially available nebulizer, i.e., PARI LC SPRINT (Type 023). The nebulizer was filled with a saturated solution of NaCl in Millipore water. We connected synthetic compressed air from the house line to the nebulizer and regulated it with a needle valve to 4 L min−1. This aerosol flow was directed into a 30.5 L quartz glass flow tube for dilution, mixing, aging, and drying. Since the majority of the impactors have a flow rate of 30 L min−1, an additional 40 L min−1 of synthetic air was fed into the flow tube for dilution. At the flow tube outlet, the test impactor was connected in line with the reference instrument and the pump. This setup allowed us to run tests for a time period of about 6–8 h with a stable and relatively broad test particle number size distribution (Fig. 2).
With estimates of the density (ρp=2.16 g cm−3) and shape (χ=1) of the NaCl particles, we converted the electrical mobility diameter (dm) given by the reference instruments to an aerodynamic diameter (da) (Baron and Willeke, 2011). The aerodynamic diameter is the basis for the size-based separation of particles in the impactors and thus the critical value for evaluation and comparison.
Soot particles
Secondly, we tested the four impactors with diesel exhaust particles containing soot, following the experimental setup previously described by Mühlbauer et al. (2016). For our investigation, we employed a contemporary four-cylinder diesel engine supplied by Daimler AG (OM651, Mercedes-Benz, Germany). This engine is equipped with a common-rail system and features direct-acting piezoelectric injectors from Delphi Automotive PLC (United Kingdom). This production engine, equipped with a particle filter, complies with the European exhaust emission standard Euro 5. The engine was run at a speed of 1200 rpm (revolutions per minute), with an injection pressure of 7×10⁷ Pa, using a throttle position maintained at 15 %, and at an exhaust gas recirculation (EGR) rate of 45 %. The engine emissions were directly channeled from the exhaust pipe to the impactor to achieve a stable particle number size distribution around the 100 nm diameter range (Fig. 2).
Simulated secondary organic aerosol (SimSOA)
Thirdly, we tested the impactors' performances with atmospherically simulated secondary organic aerosol (SimSOA). In order to conduct our tests with a stable mixture for several hours, we used a chamber from the Bayreuth ATmospheric simulation CHambers (BATCH) infrastructure (Ofner et al., 2011). Before each measurement, a 700 L cylindrical glass chamber was flushed with outdoor air to introduce real environmental particles and trace gases. Subsequently, 0.05 mL of α-pinene was injected into the airflow, while a nebulizer delivered seed particles (saturated ammonium sulfate solution) into the chamber at a flow rate of 3 L min−1 for 3 min. After an additional 5 min, the pump supplying outdoor air was switched off, and a UV solar simulator (HMI 4000 W, Osram (filtered with a water-cooled glass plate); Ofner et al., 2011; Zhao et al., 2008) was turned on for 15 min to stimulate ozone production and the subsequent formation of SimSOA. Prior to commencing the impactor measurements, the reference instruments were directly connected to the chamber to ensure suitable particle concentrations and number size distributions (Fig. 2).
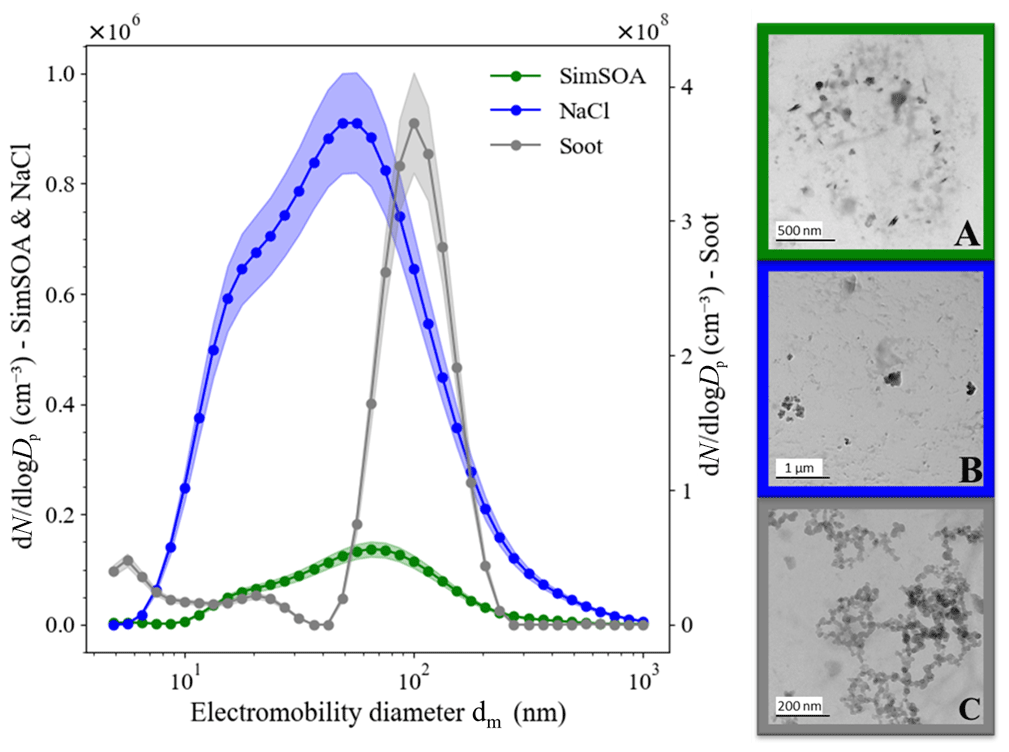
Figure 2Particle number size distributions of three particle types for physical impactor testing, averaged over the duration of the experiments and displayed with standard deviations for each particle type. The data for SimSOA (green) and NaCl (blue) correspond to the left axis, while the soot data (black) correspond to the right axis. The particle size distribution is expressed as the number of particles (dN) per logarithmic diameter interval (dlogDp). SEM (scanning electron microscopy) images of the test particles are displayed in plots A (SimSOA), B (NaCl), and C (soot).
2.2.3 Determining physical parameters as evaluation criteria
To comprehensively characterize the four cascade impactors for UFP sampling, we focused on determining the pressure drop and cutoff properties, evaluating potential particle losses, and identifying any measurement artifacts that may arise. For each impactor, we followed the same protocol: determine the particle number size distribution of the test particles (step 1), insert the (modified) impactor and monitor the transmitted particles as described (step 2), and conduct an empty measurement (step 3). For the empty measurements, all nozzle stages and impaction plates were removed, meaning that no size classification occurred, and the inlet and outlet of the impactor were connected as in step 2. Step 3 allowed for baseline measurements without the influence of impaction stages while maintaining a setup comparable to that of the transmission measurements in step 2.
Pressure drop assessment. The pressure drop across each impactor was measured using a differential pressure gauge. This measurement encompassed the total pressure loss through the impactor, including the quartz fiber after-filter that was integrated into the system. For this measurement, T-junctions were installed at both the inlet and outlet of the impactor. Branches from these junctions were connected to the differential pressure gauge (26 PCCFA6D (differential pressure sensor, relative, ± 15 psi), Honeywell) to record the pressure drop across the entire impactor and the quartz fiber filter on which the UFPs were collected. The pressure drop was determined at the same flow rate as that used for each impactor under operating conditions.
Cutoff diameter determination. To derive the transmission of particles through the impactor as a function of the particles' diameter, the ratio of the number concentration between the impactor (step 2) and the empty measurement (step 3) was calculated for each size bin. The resulting transmission curve was subsequently normalized for each impactor to the maximum transmission. From this, the dp50 values were deduced from a linear regression in the range of nm for NaCl and SimSOA particles and from a linear regression in the range of nm for soot. Additionally, we determined the steepness of the cutoff curve, as well as the dp90 and dp10 values, which describe the diameters at which 90 % and 10 % of particles are deposited and not transmitted, respectively.
Evaluation of losses. We analyzed the transmission curves for the ultrafine section of the particle size distribution to evaluate the losses of each impactor. Due to the larger uncertainties in the reference instruments for very small diameters, i.e., dm<20 nm, we decided to evaluate the particle number concentration at 30 nm to determine the losses in the ultrafine fraction. At this size, all impactors showed a peak in the transmission curve, which we used as a reference for determining the losses, calculated as 1 minus the derived transmission.
Observation of other artifacts. We also evaluated the transmission curves for other possible artifacts, such as the transmission of larger particles, which could potentially occur as a result of particle bounce.
2.3 Overview of the field application of the four cascade impactors for the chemical analysis of organic markers in UFPs
To assess the performance of the impactors under real environmental conditions, we operated all impactors simultaneously at the same location for the same duration in a side-by-side comparison. We took three samples of ambient aerosol on 24, 25, and 30 January 2023 in Bayreuth, Germany, with each sample collected over a 24 h period. The impactors and their respective pumps were positioned indoors in the laboratories of the Bayreuth Center of Ecology and Environmental Research (BayCEER; 49.9305° N, 11.5881° E). The location is characterized by nearby manufacturing industries, road traffic, and proximity to a highway but is also adjacent to residential areas of the city of Bayreuth, which has around 75 000 inhabitants (Bayerisches Landesamt für Statistik, 2022). Ambient air was drawn into each impactor through antistatic inlet lines, each 1.2 m long (9.525 mm, TSI). The lines, impactors, and pumps were maintained at a constant temperature of about 21 °C. Each inlet line was equipped with honeycomb ceramic bodies measuring 25.4 × 50 mm (620 000 cells m−2, Rauschert, Germany), coated with sodium thiosulfate (ReagentPlus® (99 %), Merck), positioned right in front of the impactor's inlet. The coated ceramic body was contained inside a stainless-steel housing and served as an ozone denuder, preventing potential oxidation reactions on the already collected particles during sampling. The ozone scrubbers had been previously evaluated for their capacity to scrub ozone from the sampling air and for potential losses (≤6 % for particles with diameters smaller than dm=200 nm and ≤11 % for particles with diameters larger than dm=200 nm). Thus, up to an ozone concentration of 250 ppb over 72 h, ozone levels were reduced to below 5 ppb behind the ozone denuder. The flow rate was adjusted before each measurement for each impactor.
All upper stages of the impactors were coated with a thin layer of vacuum grease (Apiezon L Grease, M&I Materials Ltd., Manchester, England) to ensure the adherence of deposited particles and minimize bounce. To achieve this, we first dissolved the vacuum grease in n-hexane (ReagentPlus® (≥ 99 %), Merck) and applied approximately 0.05 mL of this solution onto aluminum foil using a syringe. We allowed the solvent to evaporate for a minimum of 12 h before mounting the treated foils onto all existing stages of the 120R MOUDI-II, ultraMOUDI, and ELPI. For the PENS, which does not have an impaction plate suitable for filter installation, the grease was applied directly to the plate following the evaporation process. After each 24 h sampling period, all impactor and nozzle plates were cleaned using an ethanol–water mixture, dried with synthetic compressed air, and recoated before the next measurement. For the collection of UFPs, we inserted pre-baked quartz fiber filters (Whatman QM-H (47 or 37 mm)) into the after-filter holder of each impactor, which had been pre-baked at 300 °C for 24 h. These were stored at −20 °C immediately after collection.
To compare the results of the chemical analysis of the sampled UFPs between the four impactors, we selected six organic marker components to represent a mixture of anthropogenic sources (benzo[a]pyrene (BaP) and benzo[b]fluoranthene (BbF)) (Hussain et al., 2018) and biogenic sources (pinic acid (PA) and terpenylic acid (TA)) (Vestenius et al., 2014)). Furthermore, we analyzed levoglucosan (Levo) as a marker for biomass burning (Simoneit et al., 1999) and N-(1,3-dimethylbutyl)-N'-phenyl-p-phenylenediamine (6PPD) as a marker for tire wear material (Klöckner et al., 2021). The marker components were selected to provide a diverse range of molar masses, volatilities, and mass abundances.
2.3.1 Extraction of samples
We extracted the selected marker components from the filters using a soft, solvent-based, and optimized protocol. (1) The filter loaded with particles was divided into two equal parts. One part was extracted, while the other was used as a backup. (2) The filter half used for extraction was spiked with 50 µL of each internal standard, namely 3-methylcholanthrene (3-MC; 0.4 µM) and nicotinic acid (NA; 10 µM), and cut into small fragments. (3) These filter fragments were then transferred into a glass container with a screw cap, and 2 mL of extraction solvent (e.g., analytical-grade dichloromethane (DCM; 99.8 %, Fisher Chemical) and methanol (MeOH; ≥ 99.9 %, Carl Roth)) was introduced. (4) The samples underwent extraction through agitation in a closed flask for a duration of 15 min using a vortex shaker (2000 rpm). (5) The filter residues were kept in a glass container. The extracts were filtered using specially designed glass frits with a diameter of 1 cm and a pore size of 20 µm to eliminate any potential filter residue.
Steps 3 to 5 were repeated three times, each time using a different extraction solvent. The solvents were used sequentially in the following order: pure MeOH, 50 : 50 MeOH : DCM, and pure DCM. Subsequently, the solvent from the combined extracts was evaporated under a gentle flow of nitrogen (N2; 99.99 %) while cooled with ice to prevent the loss of semi-volatile compounds. A droplet, approximately 0.5 µL in volume, was kept as residue and dissolved in 1 mL of a 60 : 40 solution of acetonitrile (ACN; 99.95 %, Carl Roth) and water (H2O; obtained from a Seralpur PRO 90 CN system with an electronics-grade Supor DCF filter (0.2 µm)). This was transferred into a separate vial for subsequent analysis. Throughout the entire sample preparation process, the samples were stored in an ice-cooled environment.
2.3.2 High-performance liquid chromatography (HPLC) analysis for chemical marker profiling
The analysis of the sample extracts was performed using two high-performance liquid chromatography (HPLC) systems. For the detection of PA, TA, Levo, and 6PPD, an Agilent 1100 Series chromatograph equipped with an electrospray ionization mass spectrometer (ESI-MS; Agilent 6130 Single Quadrupole) was utilized. To determine the concentration of the polycyclic aromatic hydrocarbons (PAHs), BaP and BbF, an Agilent 1260 Infinity system coupled with a fluorescence detector (FLD; Agilent 1100 Series) was employed. For the mobile phase, HPLC-grade acetonitrile, water, and formic acid (HCOOH; p.a. ≥98 %, Carl Roth) were used as a buffer. We applied three different methods, which are summarized in Table S1 in the Supplement.
To assess the efficacy of the sample preparation, including the extraction method, recovery experiments were conducted in triplicate. Half of the preheated quartz fiber filter (47 mm, Whatman QM-H) was spiked with 10 µL of a 10 µM standard solution encompassing all markers. Subsequently, the spiked filter was extracted as outlined previously. Each recovery (Rec) was ascertained utilizing external standard (ESTD) calibration and calculated by dividing the measured concentration of each marker by the expected (spiked) concentration.
The obtained recoveries were as follows: 78 ± 7 % (BaP), 74 ± 7 % (BbF), 79 ± 7 % (Levo), 84 ± 8 % (PA), 85 ± 8 % (TA), and 75 ± 7 % (6PPD). As these recovery rates describe the average systematic loss of the marker compounds during extraction, we corrected our data using the following equation:
The recovery-corrected results were then validated against the NIST Standard Reference Material (SRM) 2786 (< 4 µm), which was applied to a filter, extracted, and analyzed according to the methods described herein for validation. The results showed agreement within the uncertainty of the measurement, even in the presence of a particulate matrix. The limit of detection (LOD) was determined based on the standard deviation (σ) of the response from a modified calibration solution, targeting a signal-to-noise ratio of approximately 3 for each analyte, as well as the response factor (RF) from the ESTD calibration.
The LOD was calculated across four replicates. Furthermore, the LOD for airborne concentrations (LODAir; pg m−3) was calculated by dividing the LOD by the sampling volume. For the MOUDI and ELPI devices, sampling for 24 h at 30 L min−1 resulted in a sampling volume of 43.2 m−3. For the PENS, which has a sampling flow of 4 L min−1, the sampling volume was 5.76 m3. The LOD values ranged from around 1–2 and 40–186 pg m3 for target markers measured using high-performance liquid chromatography with fluorescence detection (HPLC-FLD) and mass spectrometry (HPLC-MS), respectively. The LOD increased by a factor of 7.5 when sampling a smaller volume, as was the case with the PENS, compared to all other impactors (Table S2 in the Supplement). Additionally, we estimated impactor-specific overall measurement uncertainties using Gaussian error propagation, with uncertainties ranging from 13.8 % to 17.8 % (Sect. 1.1 in the Supplement). This uncertainty estimate includes the instrumental variability for repeated analysis (2 %), reference material uncertainty (0.5 %), preparation of stock solutions (5 %), dilution errors (5 %), and inaccuracies in volume determination (1 %). Additionally, it accounts for impactor-specific factors, including flow adjustment errors (3 %–10 %) and handling errors (10 %–15 %).
3.1 Physical characterization I: pressure drops, cutoff diameters, and the steepness of the cutoff curve
The pressure drop across an impactor, including the quartz fiber filter, can significantly influence collection efficiency and the chemical composition of the captured particles. The greater the pressure drop across the impactor and quartz fiber filter, the higher the rate of potential evaporation of semi-volatile compounds. For the four tested impactors, the pressure drops corresponded to 260 ± 1 hPa (PENS), 420 ± 2 hPa (ultraMOUDI), 600 ± 3 hPa (120R MOUDI-II), and 690 ± 3 hPa (ELPI).
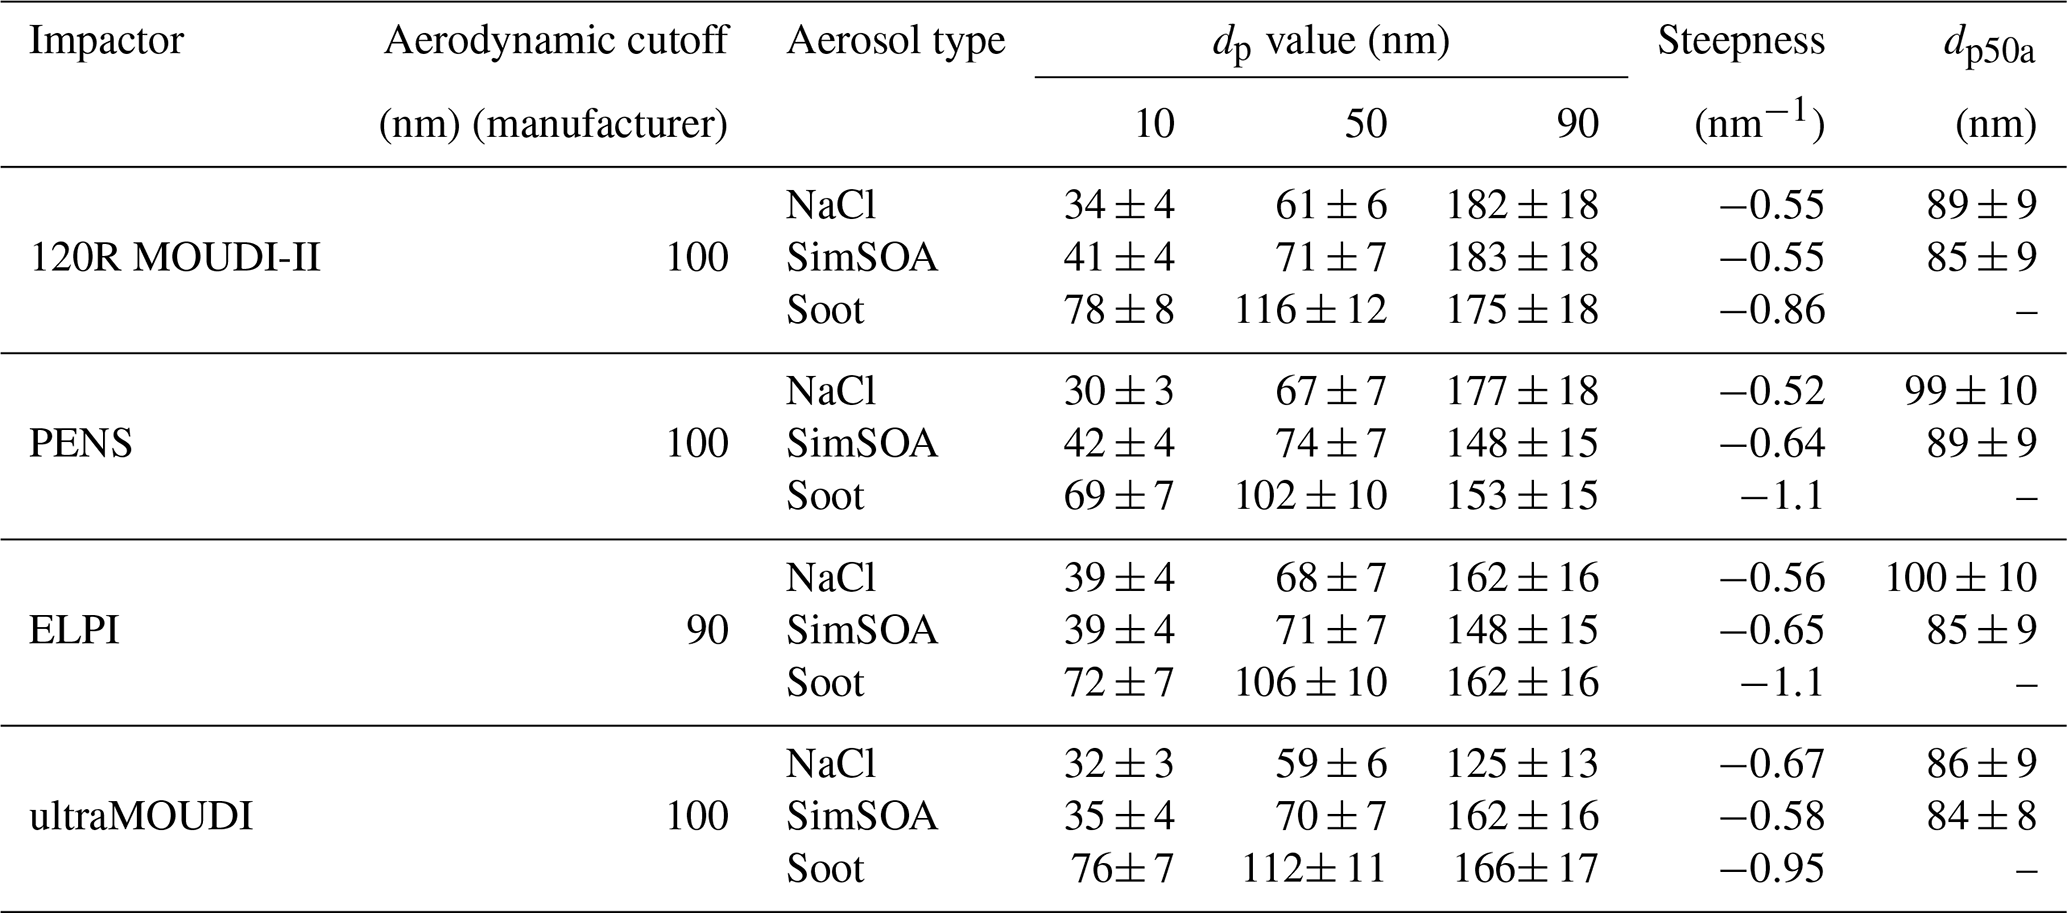
Figure 3 shows the normalized transmission curves obtained from testing the four impactors with the three test particle mixtures. Cutoff diameters were calculated as dp50 values for the electromobility diameter. They increased consistently for all impactors – from NaCl particles to SimSOA to soot particles (59–68 < 70–74 < 102–116 nm). The best agreement between the individual impactors' cutoff diameters was found for SimSOA. For SimSOA, the ultraMOUDI and 120R MOUDI-II had the smallest cutoff diameters, with electromobility diameters of 71 ± 7 and 70 ± 7 nm, respectively. Contrastingly, for soot, the largest deviations among the impactors' cutoff diameters were observed, showing that the devices deviated by about 14 nm at most. Here, the two MOUDI models had the highest cutoff diameters, while the PENS had the smallest one (102 ± 10 nm). For NaCl and SimSOA particles, we compared the aerodynamic cutoff diameters, which were 86 ± 9 and 84 ± 8 nm (ultraMOUDI), 89 ± 9 and 85 ± 9 nm (120R MOUDI-II), 99 ± 10 and 89 ± 9 nm (PENS), and 100 ± 10 and 85 ± 9 nm, respectively. For these calculations, a shape factor of 1.0 and a density of 2.165 g cm−3 were used for NaCl, while a shape factor of 1.2 and a density of 1.21 g cm−3 were applied for SimSOA.
Generally, the transmission curves were steeper for soot than for SimSOA and steeper for SimSOA than for NaCl particles. This trend is strongest for the ELPI and PENS, which have the greatest steepness for soot, with transmission curve slopes of −1.1 nm−1, and the least sharp cutoff curves for NaCl, corresponding to −0.52 and −0.56 1 nm−1, respectively. The sharpness of the cutoff curves for the 120R MOUDI-II and ultraMOUDI seems to be less sensitive to the type of test particle as the steepness of the transmission curves varied by about 9 % at most between the different test particles. The four impactors showed the best agreement regarding the steepness of the transmission curve for SimSOA, with a relative difference between the maximum and minimum slopes of about 26 %.
The dp10 and dp90 values represent the diameters at which 10 % and 90 % of the test particles, respectively, were deposited on the impaction plates of the impactor. An impactor with closely spaced dp10 and dp90 values would have a steeper transmission curve, indicating more precise segregation of particles by size. For all impactors, the lowest dp10 values were observed for NaCl particles (dp10ave=34 nm, averaged across all impactors). The dp90 values did not vary systematically between the test particles and impactors, ranging from 125 ± 13 nm (for NaCl particles collected with the ultraMOUDI) to 183 ± 18 nm (for SimSOA collected with the 120R MOUDI-II). As this general trend might be driven by the relatively sticky nature of NaCl particles and SimSOA, leading to a relatively smeared cutoff curve, it is interesting to observe the sharpest cutoff curve for the soot particles, which exhibits the most complex shape among the curves of the three tested particle types. This can also be seen from the difference between the dp90 and dp10 values, which was smallest for soot particles across all four impactors.
SimSOA is likely the most representative type of test particle for environments ranging from urban to suburban to rural, provided they are not coastal, curbside, or subject to nearby combustion sources. For the tests with SimSOA, the four impactors performed comparably in terms of cutoff diameter, transmission curve steepness, and dp10 and dp90 values (Table 1). We observed a tendency for a sharper separation of UFPs with the PENS and ELPI compared to the two MOUDI models. However, larger deviations between the four impactors were observed for soot particles, both in terms of cutoff diameter and steepness. The estimated aerodynamic cutoff diameters for SimSOA and NaCl overlap for all the impactors within their uncertainties and in the range of 84–100 nm. Typically, the UFP range includes the nucleation mode and marks the “shoulder” of the accumulation mode. From the perspective of a mass-based analysis, the particle composition of these two modes would be reflected in the results. However, as the mass of particles around 100 nm is small, the observed variations in cutoff diameters likely do not diminish their comparability.
Table 1Summary of the performance test results for the four impactors and the three test aerosol mixtures. The particle diameter (dp) values are provided in terms of electromobility diameter (nanometers). The steepness describes the slope of the transmission curve at particle diameters of around 100 nm. Values of dp50a (the aerodynamic particle diameter at 50 % collection efficiency) are calculated as aerodynamic cutoff diameters, derived from the salt particle tests.
3.2 Physical characterization II: losses and particle bounce
To determine potential losses within the impactors, we compared the transmission curves for SimSOA generated in the atmospheric simulation chamber (Fig. 4). The maximum transmission in the ultrafine fraction at 30 nm was 84 ± 8 % for the PENS, 77 ± 8 % for the ultraMOUDI, 75 ± 8 % for the 120R MOUDI-II, and 69 ± 7 % for the ELPI. These results indicate that the ELPI had the highest losses of SimSOA UFPs during sampling compared to the other tested impactors. However, considering the overlap of the uncertainties, these differences are not significant. Losses can be either wall losses or interstage losses, which retain particles on surfaces other than the impaction plate. In addition, losses can also occur through the evaporation of (semi-)volatile particles, especially under a high-pressure drop during “flow-through” (Marple and Willeke, 1976; Won Kim, 2010).
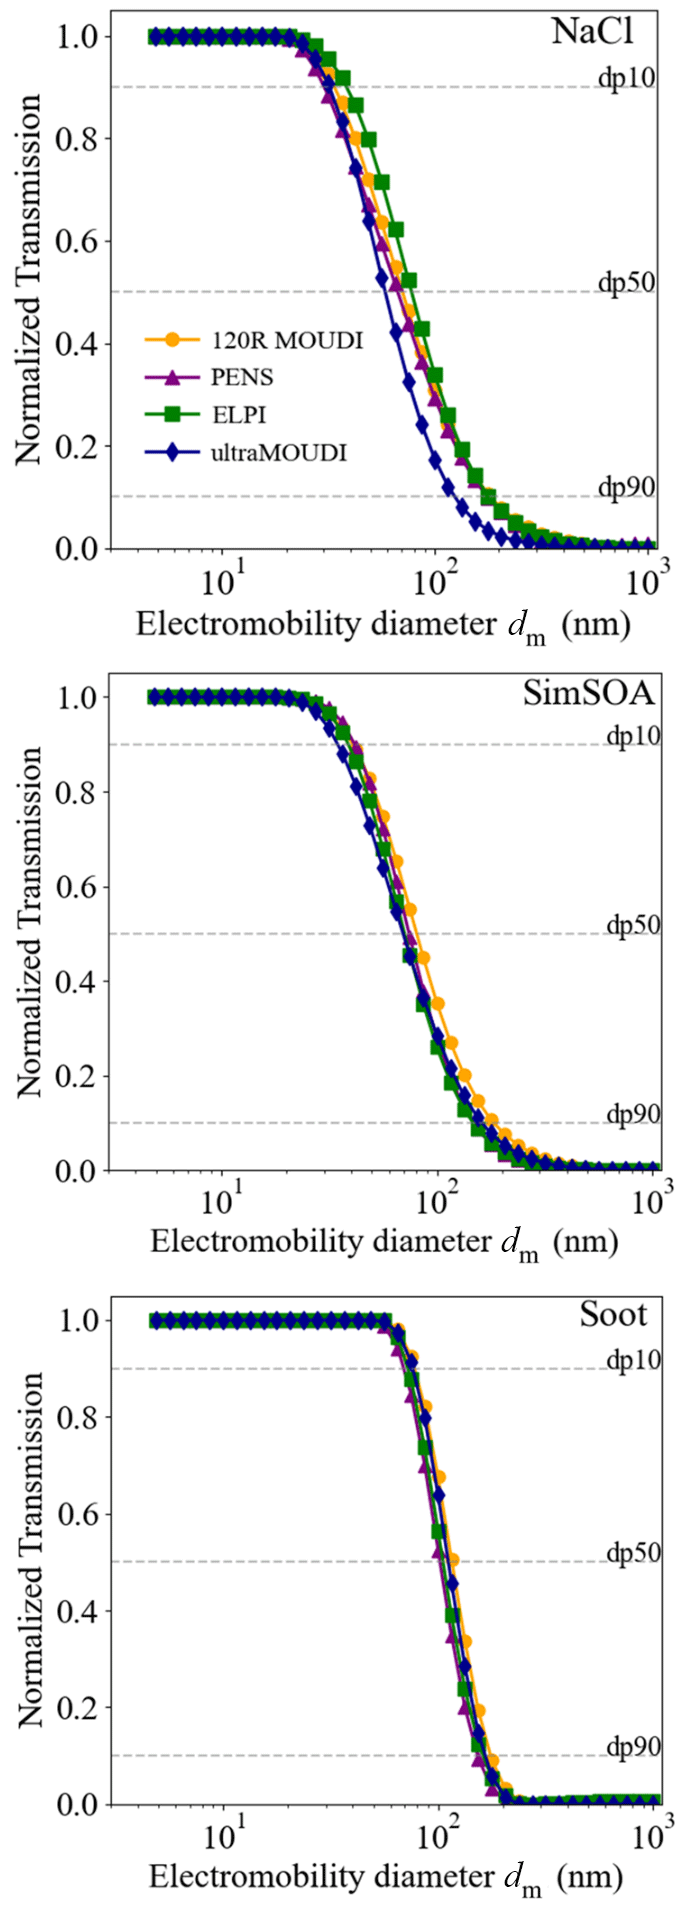
Figure 3Normalized transmission curves for three test particle types (NaCl, SimSOA, and soot), as captured by different impactors: the 120R MOUDI-II (orange circles), PENS (purple triangles), ELPI (green squares), and ultraMOUDI (blue diamond-shaped markers). Each plot displays the transmission versus the electromobility diameter (nanometers) on a logarithmic scale. Lines are included to guide the eye.
Figure 4Transmission curves for the four tested impactors collecting SimSOA generated within the atmospheric simulation chamber. Note that all tests were performed without applying any coating. The four impactors are labeled follows: 120R MOUDI-II (orange circles), PENS (purple triangles), ELPI (green squares), and ultraMOUDI (blue diamond-shaped markers).
Ideally, the transmission should ultimately reach zero for particles with larger diameters as these particles should be retained in the upper stages of the impactor. However, the elevation above zero for diameters between 200 and 1000 nm suggests the occurrence of particle bounce (Fig. 4). The ELPI detected very few particles at the larger diameters, with minimal transmission observed for these particle sizes. Thus, within the uncertainty, no particles with an electromobility diameter larger than 177 nm passed through the last impaction stage. A similar observation was made for the 120R MOUDI-II, where very few particles were detected at larger diameters, with minimal transmission being approached at an electromobility diameter of 562 nm. For larger particles, the transmission remained at zero. This is in line with the comparably flat slope of the transmission curve of the 120R MOUDI-II, indicating a broad separation of particle sizes rather than a sharp cutoff curve (Table 1). However, both the PENS and ultraMOUDI devices exhibited notable bounce effects. For the PENS, the transmission dropped to a local minimum at 133 nm (electromobility diameter) and remained at approximately 38 % for larger particles. For the ultraMOUDI, the local minimum of transmission occurred at an electromobility diameter of 273 nm, amounting to 13 %, but then increased again to about 19 % for larger particle diameters.
Overall, the impactor design seems to critically impact potential losses and particle bounce. The ELPI and 120R MOUDI-II have a higher number of stages and impactor-plate–nozzle-plate pairs before ultimately separating UFPs (stages 13 and 9, respectively) compared to the ultraMOUDI and PENS (stages 3 and 2, respectively). The increased number of stages appears to reduce the bounce effect (Fig. 4). This is likely because particles have more opportunities to impact as they traverse through multiple stages, with each stage being less loaded with particles, reducing the probability of bounce. As both the ELPI and MOUDI devices are modular cascade impactors, they allow us to include different numbers of stages with different cutoff diameters, which, in turn, might result in different sampling characteristics – not only for the ultrafine particles but also for the upper stages. However, including a higher number of upper stages could come at the cost of comparably increased losses in the UFP range.
Here, the losses in the UFP range were similar for the ELPI, 120R MOUDI-II, and ultraMOUDI. This contrasts with the PENS, which had the smallest loss amongst all the tested models (about 6 %), likely due to its design, which features a cyclone pre-separator and only one nozzle plate. We can compare our results to those of a few other studies that experimentally determined the loss rate of the MOUDI. Liu et al. (2013) showed a total loss for a MOUDI device (Model 110) in the range of 2.9 %–26.1 %, which increased with decreasing dp50 values and was attributed mostly to convective diffusion. Similarly, Durand et al. (2014) observed losses due to convective diffusion in cascade impactors featuring stages designed for ultrafine particles with diameters below 100 nm. Ungeheuer et al. (2022) measured losses of 28 % and 40 % in the Nano-MOUDI (Model 110) for particles with aerodynamic diameters of 32–56 nm and 18–32 nm, respectively. It is thought that diffusion deposition becomes increasingly significant for smaller particles, which can lead to substantial particle losses. As high uncertainties are associated with both the MPSS and the DMS when measuring particles with diameters below 20 nm, we could not test this behavior within our setup. However, a mass-based analysis of UFPs might be less affected by such losses than the measurement of number concentration.
It has been reported that particle bounce becomes particularly significant for lower cutoff stages due to the gradual reduction in pressure at each stage, which subsequently leads to a decrease in relative humidity (RH). The reduction in RH, in turn, can intensify the particle bounce effect (Chen et al., 2011). Pressure dropped most drastically throughout the ELPI, which may have been problematic for collecting semi-volatile organic marker compounds (Yao et al., 2022). Knowing that the diameter of the cutoff and the effective sharpness of the separation between fine and ultrafine SimSOA particles were comparable for all tested impactors, the impact of losses and particle bounce on mass-based chemical analyses might be significant and is therefore further investigated below. Considering the mass of UFPs compared to the mass of potential artifacts, we aimed to understand the relative impact of particle bounce. Even a few larger particles or fragments bouncing onto the UFP collection substrate could heavily skew the results, leading to an overestimation of the UFP mass concentration and a misrepresentation of its chemical composition. This is particularly problematic because UFPs can have different chemical properties and health impacts compared to larger particles (Abdillah and Wang, 2023; Müller et al., 2012). Particle bounce-off can be influenced by the impaction surface; the presence, type, and depth of a coating; particle types; particle loading; sampling conditions; and the impaction substrate. Particularly during long-term sampling with heavy particle loads, deposited particles have been found in excessive layers (Kulkarni et al., 2011; Marple et al., 1991; Pak et al., 1992; Turner and Hering, 1987; Chang et al., 1999; Newton et al.;Lai et al., 2008; Rao and Whitby, 1978).
To test whether an increased particle load leads to more severe particle bounce, we varied the particle number concentration in the chamber for SimSOA from a maximum of about 200 000 cm−3 to a more realistic maximum of about 5700 cm−3 (see Fig. 5). As a wide range of number concentrations were covered, we measured the particle number size distributions with both the DMS500 (level 1 in Fig. 5a) and the MPSS (levels 2, 3, and 4 in Fig. 5a). Additionally, Fig. 5b presents an exemplary number size distribution (level 4) for ambient particles, which were collected during a period of environmental sampling when the impactors were deployed side by side (see Sect. 2.3). For each of these levels, Fig. 5b shows the transmission through the PENS impactor as an example. Indeed, reducing the particle number concentration resulted in a decreased bounce effect, although it still remained noticeable. Compared to the highest particle load (level 1), transmission was reduced in level 2 for particles sized 150–200 nm, while particles > 500 nm still exhibited transmission rates of up to 34 %. Level 3a had the lowest particle load, which decreased transmission to about 5 %–9 %, remaining relatively consistent across the diameter range of 170–800 nm.
Furthermore, greasing the upper stages is a method that has previously been suggested and applied to reduce particle bounce (Baron and Willeke, 2011; Ungeheuer et al., 2021). To test this method, we greased the upper stages of the PENS (level 3b in Fig. 5b). Applying a coating on the impactor further reduced the bounce effect, lowering transmission rates to 0 %–6 % within the same particle size range. The duration of these measurements was notably brief (20 min), in contrast to the typical collection times employed with impactors (e.g., 24 h). Thus, we also greased the upper stages of the 120R MOUDI-II and monitored the transmission over 3 consecutive days while sampling ambient air. While greasing improved the sharpness of the cutoff curve, the transmitted fraction of particles around a size of about 200 nm increased over the 3 d from about 0 % to 15 %. These tests highlight the variations in the observed bounce effects over short and extended collection periods, which may be highly dependent on particle load and nature. However, greasing the upper impaction stages generally improved UFP sampling as it reduced the fraction of larger particles being transmitted.
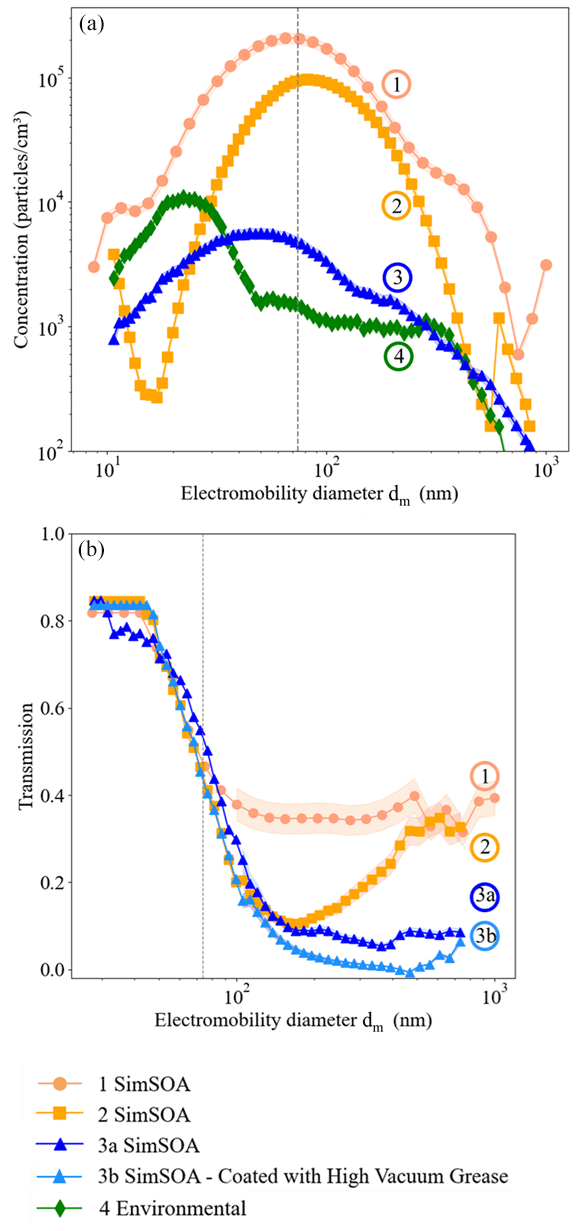
Figure 5Panel (a) illustrates particle number size distributions in units of particles per cubic centimeter for SimSOA (detected at its highest concentrations by the DMS500 (1) and at relatively lower concentrations by the MPSS (2 and 3)) and environmental secondary organic aerosol (SOA) (4). Panel (b) presents the transmission curves of the PENS for the respective particle size distributions. Data labeled with “3a” and “3b” display uncoated measurements and coated measurements using high-vacuum grease, respectively.
3.3 Physical characterization III: transmitted particle mass
Typically, UFP collection using impactors is followed by analyses of chemical composition, which have a mass-based focus. Breakthroughs of coarser particles into the UFP range can significantly distort mass-based analytical results as particle mass increases in cubic proportion to the diameter. As an example, Fig. 6 illustrates the transmission of particles through the PENS based on their respective masses. The density of the α-pinene particles was measured by Zelenyuk et al. (2008) to be 1.20 g cm−3. We used this value to calculate the mass of the particles transmitting through the impactor according to the measured number size distributions, assuming spherical shapes for the SimSOA particles. We separated the data into two size classes (based on the electromobility diameter of the particles): (1) the entire recorded range (10–800 nm) and (2) the UFP range (10–74 nm), which is below the previously determined dp50 value (Sect. 3.1).
The set of measurements includes particle mass as measured directly from the chamber, the empty PENS, the uncoated PENS, and the coated PENS (Fig. 6). The total mass of all particles in the chamber, ranging from 10 to 800 nm, calculated directly from the measured particle number size distribution, was 220.2 µg m−3. Due to losses in the lines and the empty PENS, the mass was reduced to 205.87 µg m−3. Upon separation, 21.4 µg m−3 of the mass was transmitted through the PENS when no coating was applied. Through the coated PENS, a particle mass of 3.3 µg m−3 was transmitted. This highlights the coated impactor's capability to retain over 98.5 % of the test particle mass, whereas the uncoated impactor captured only approximately 90.3 %. The differences are artifacts due to the bounce and fragmentation of larger particles sampled as UFPs. Figure 6 also shows that the transmitted ultrafine fraction, as detected by the MPSS, remained comparable between the coated and uncoated tests. For these tests, we chose a reduced particle number concentration compared to the aforementioned cutoff characterization experiments and SimSOA particles in the context of environmental measurements. Due to the nature of SimSOA, the particles are likely not representative of a worst-case scenario for particle bounce.
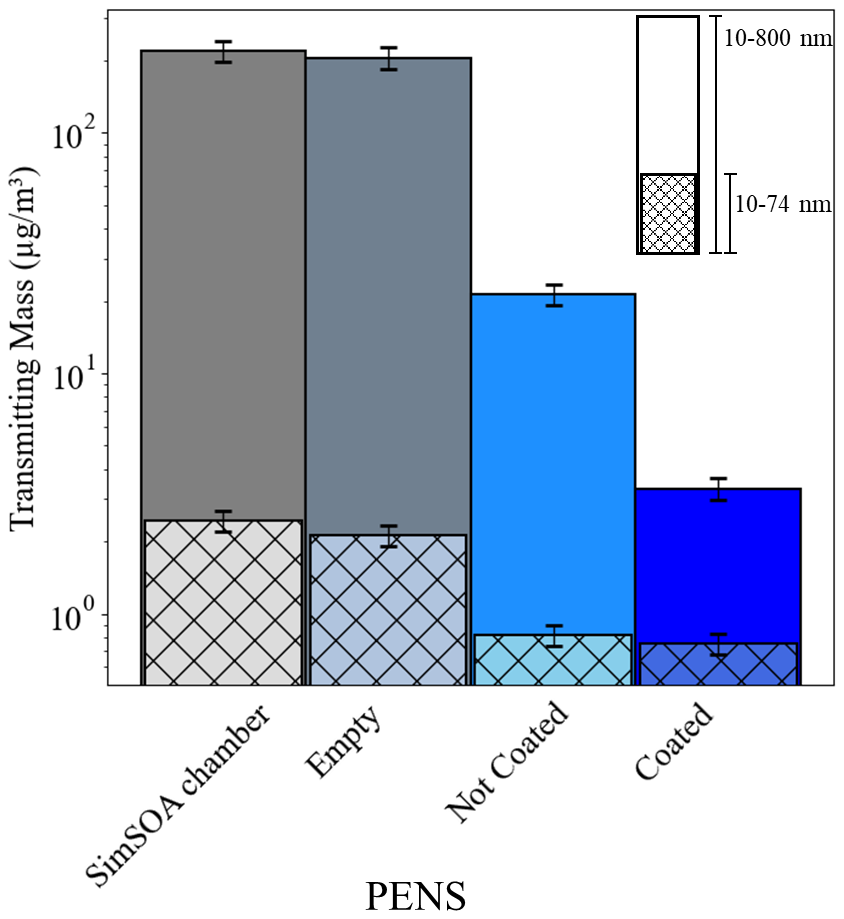
Figure 6Comparative bar chart displaying the masses of transmitting particles in µg m−3 for coated and uncoated PENS tests, compared with the original aerosol mixture (SimSOA) and the empty PENS. The two segments represent the entire observed electromobility diameter range (10, …, 800 nm) and the ultrafine fraction (10, …, 74 nm), respectively. The chart uses a logarithmic scale for the y axis.
3.4 Field application: chemical analysis of organic markers
We evaluated the performance of the four cascade impactors under environmental conditions using six selected markers (see Methods):
-
Polycyclic aromatic hydrocarbons (PAHs). PAHs have a potential impact on human and environmental health (Hussain et al., 2018; Kim et al., 2013; Wang et al., 2006). Benzo[a]pyrene (BaP; M=252.31 g mol−1) and benzo[b]fluoranthene (BbF; M=252.31 g mol−1) are high-molecular-weight PAHs with five aromatic rings and low volatility. They are predominantly found in fine particulate matter originating from incomplete combustion.
-
Levoglucosan (Levo). Levo (M=162.14 g mol−1) is a well-studied tracer for cellulose combustion (Bhattarai et al., 2019; Simoneit et al., 1999). Its presence is indicative of sources such as residential wood burning, agricultural fire practices, and wildfire emissions. Levoglucosan is semi-volatile and can partition between gas and particle phases (Xie et al., 2014).
-
Pinic acid (PA) and terpenylic acid (TA). PA (M=186.21 g mol−1) and TA (M=198.24 g mol−1) are representative of secondary organic aerosols (SOAs) of biogenic origin, produced through the oxidation of terpenes (e.g., α-pinene and β-pinene), which are emitted by vegetation (Claeys et al., 2013; Grieshop et al., 2007).
-
6PPD.N-(1,3-dimethylbutyl)-N'-phenyl-p-phenylenediamine (6PPD; M=268.40 g mol−1) is an additive in tire wear materials and has recently been proposed as a tracer for non-exhaust traffic-related particles (Chen et al., 2023; Hu et al., 2022).
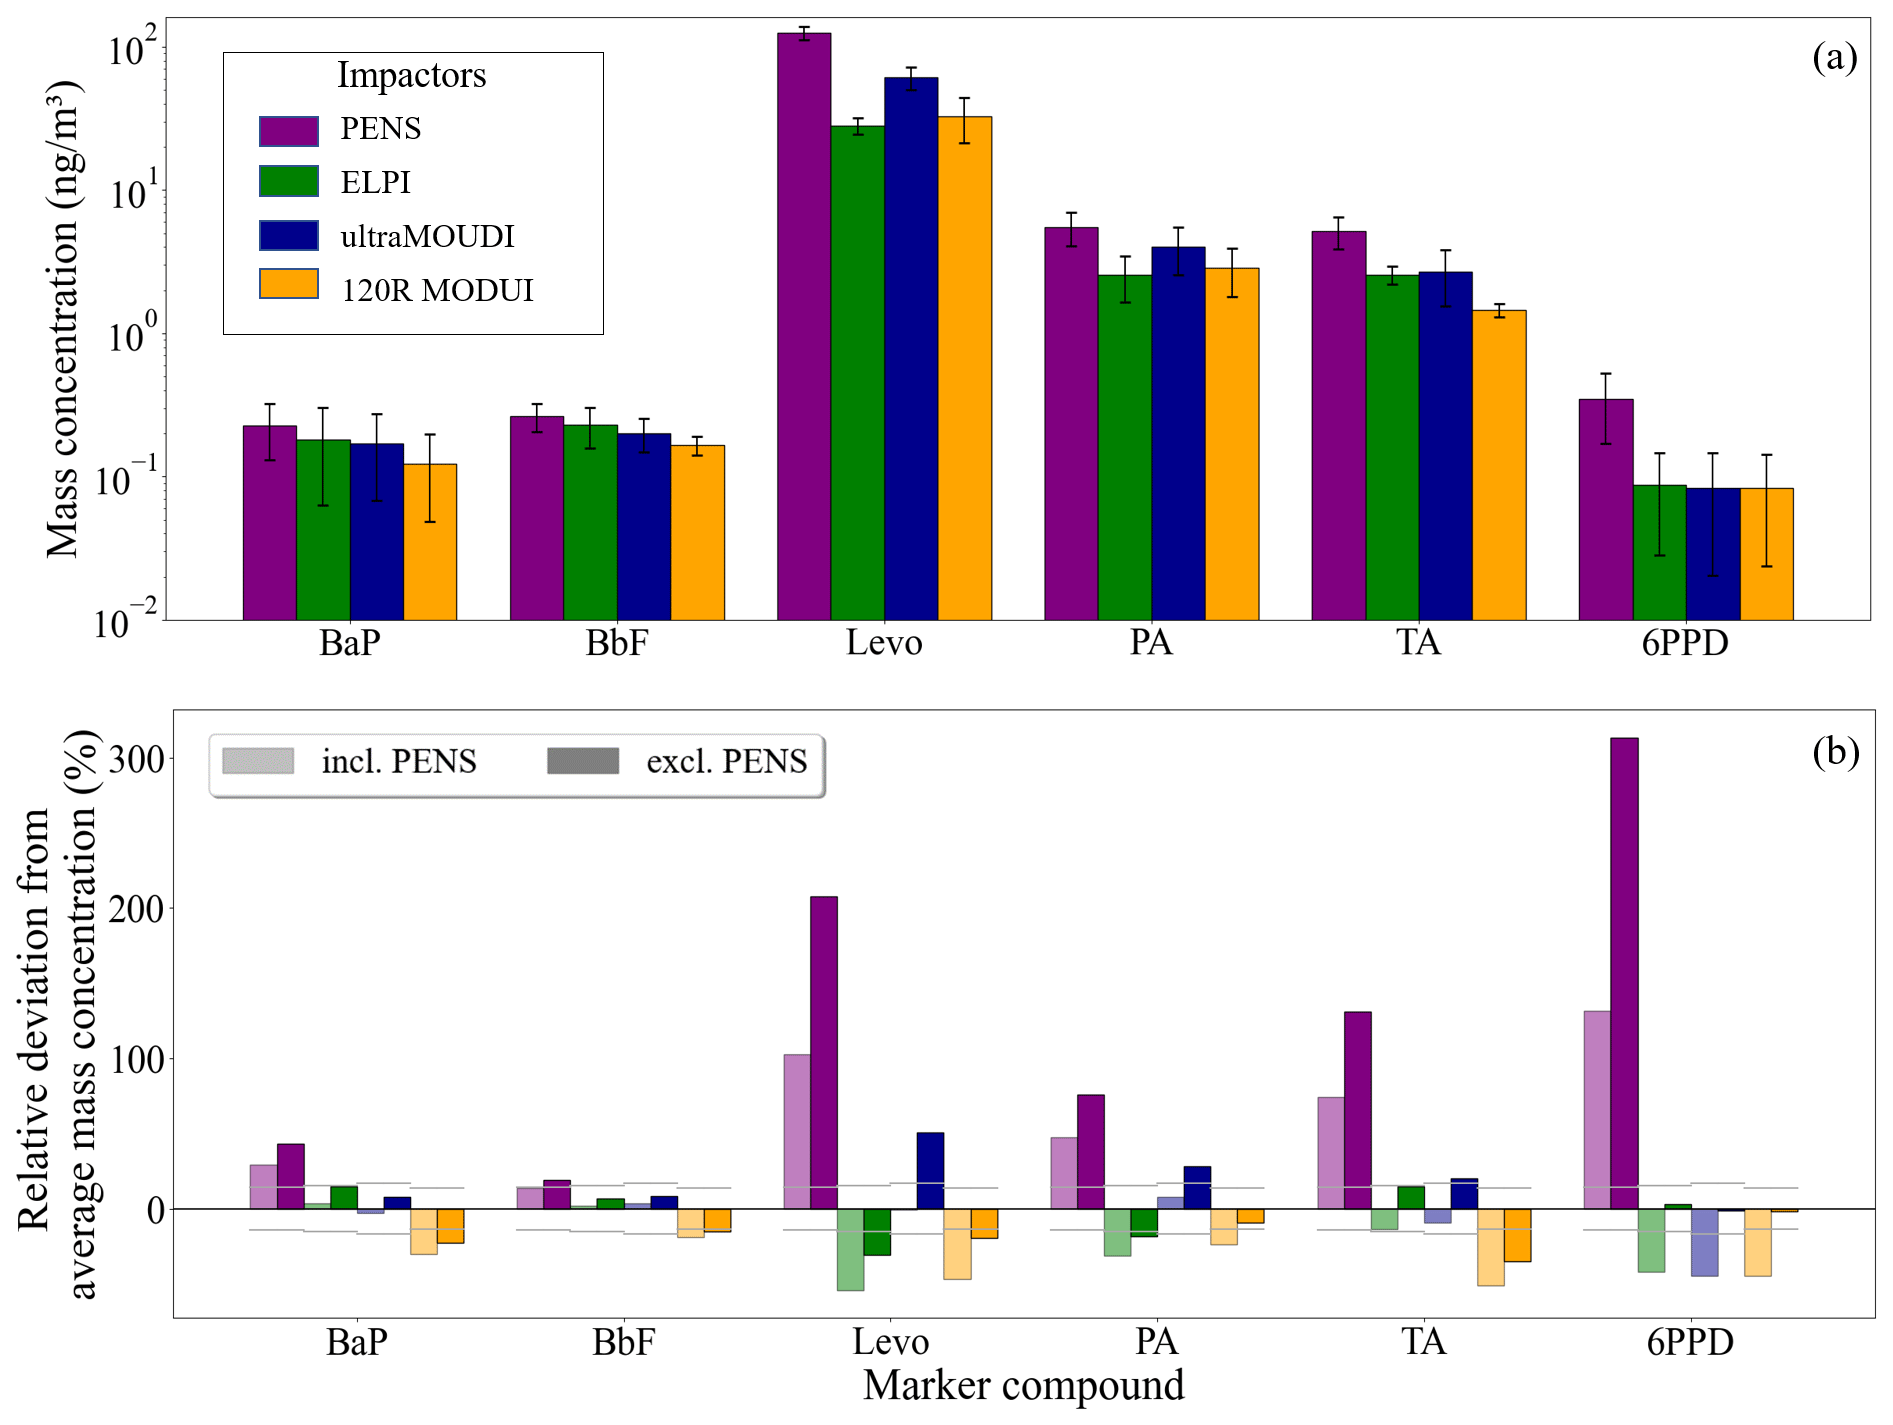
Figure 7(a) Bar chart showing the average mass concentrations of selected organic marker compounds in UFPs collected with the PENS (purple), ELPI (green), ultraMOUDI (dark blue), and 120R MOUDI-II (orange) over 3 d, expressed in units of ng m−1 on a logarithmic scale. The error bars indicate standard deviations. (b) Relative deviations (percentages) in the mass concentrations of BaP, BbF, Levo, PA, TA, and 6PPD in UFPs, calculated using the average of all impactors (incl. PENS; transparent bars) and the average of all impactors minus the PENS (excl. PENS; opaque bars). For comparison, horizontal gray lines represent the estimated overall errors for each marker and impactor (Sect. S1.1 in the Supplement). A logarithmic representation of panel (b) can be found in Fig. S1 in the Supplement.
We analyzed UFPs sampled in an urban, semi-industrial environment. The observed average mass concentrations are presented in Fig. 7a. Furthermore, we evaluated the relative deviation of each impactor compared to the average of all impactor results (Fig. 7b). Overall, the best agreement between all impactors was found for the two PAHs. For BaP, the average mass concentration was highest for the PENS, amounting to 227.2 ± 97 pg m−3 (the average ± the standard deviation over 3 consecutive days), which is 29 % above the average of 175.65 pg m−3 when considering all impactors. The ELPI and ultraMOUDI agreed within approximately 4 % above and 3 % below the average, respectively. The 120R MOUDI-II had the lowest average concentration (122.6 ± 74 pg m−3), which was 30 % below the overall average. For BbF, the tendencies were the same but less pronounced. We can highlight two findings here for the analysis of the two PAHs. Firstly, the maximum disagreement may be as large as 59 % between the PENS and 120R MOUDI-II. Secondly, the two PAHs, originating from the same sources and found in > 90 % of the particle phase, exhibit the same sampling tendencies across the impactor models. This is likely due to their identical molecular weights and very comparable boiling points.
As the results from the PENS seemed to be consistently at the higher end for all marker compounds, we calculated the averages across all impactors, both including and excluding the PENS, and then compared them (Fig. 7b). The PENS exceeded the average of the remaining impactors by a factor of 1.3 for BaP, 1.2 for BbF, 2.0 for Levo, 1.5 for PA, 1.7 for TA, and 2.3 for 6PPD. Our cutoff characteristic tests indicate three potential reasons for this overestimation. Firstly, the PENS had the lowest pressure drop of all the impactors (260 hPa), which might have affected the gas–particle partitioning of semi-volatile compounds in a way that, for example, resulted in Levo, TA, and PA having comparably higher mass concentrations in PENS samples. Secondly, the bounce effect was more pronounced in the PENS and dependent on the particle number concentration of the SimSOA. Possibly, and despite the applied coating, the overestimation in marker mass concentrations by the PENS could be due to a bounce effect, which increases with rising ambient mass concentrations. Thirdly, the physical loss in the UFP range was relatively small in the PENS compared to the other impactors (Fig. 4). The losses, however, were similar across all impactors and likely less impactful from a mass-based viewpoint.
A comparison of the remaining impactors showed the best agreement in the results for 6PPD. Here, in the sampled UFPs, the two MOUDI models measured, on average, 83 ± 30 pg m−3 of 6PPD, and the ELPI measured 86 ± 48 pg m−3 of 6PPD. The differences amongst the 120R MOUDI-II, ELPI, and ultraMOUDI varied for the different markers as follows (presented in increasing order): 6PPD (−2 % to +3 %), PAHs (BaP and BbF; +8 % to −22 %), organic acids (PA and TA; +20 % to −35 %), and Levo (+51 % to −31 %). Thus, the range of deviation increased with the average observed mass concentration: 6PPD (84 ± 30 pg m−3), BaP (158 ± 25 pg m−3), BbF (199 ± 23 pg m−3), PA (3144 ± 620 pg m−3), TA (2231 ± 541 pg m−3), and Levo (40 660 ± 17 148 pg m−3).
It should be noted that the differences among the impactors fall within the same order of magnitude as the overall uncertainty for most markers (BaP, BbF, TA, and PA). Yet, these differences are systematic and seem to depend not only on the impactor design but also on the properties of the analyzed compounds (see Sect. 2.3.2).
3.5 Influence of physical factors on the results of marker mass concentration analyses of UFPs
We systematically analyzed the influence of the previously examined physical factors on the results of marker concentrations in UFPs with respect to the markers' properties. While the cutoff diameter, cutoff curve steepness, and losses do not seem to vary significantly between the four tested impactors, the pressure drop (mass loss) and the effect of particle bounce (mass gain) have the potential to drive the observed differences in the mass-based UFP analysis.
We expected the pressure drop to primarily affect the semi-volatile markers (PA, TA, and Levo) due to evaporation losses during sampling. Figure 8a illustrates the dependency of the absolute deviation of the average mass concentration on the pressure drop for all samples and impactors. The absolute deviation of the average mass concentrations of PA, TA, and Levo decreased with the increasing pressure drop, more so than for the less volatile markers, BaP and BbF. We categorized these two groups of markers – semi-volatile and mostly particle-bound – and compared the change in concentration for the two extremes: the PENS with the smallest pressure drop (260 ± 1 hPa) and the ELPI with the largest pressure drop (690 ± 3 hPa). The lower-volatility markers (BaP and BbF) decreased in average concentration by about 15 %. In contrast, the average mass concentration of the higher-volatility markers (PA and TA) decreased by about 52 %. These findings seem to confirm that a larger pressure drop in the impactors leads to evaporation and, thus, a mass loss of the semi-volatile substances. The evaporative loss likely also depends on the collection substrate. When sampled using a QFF, for example, UFPs are exposed individually and ventilated efficiently. However, QFFs were used in all impactors during UFP sampling. Furthermore, we initially noted differences between the 120R MOUDI-II and ELPI, despite there being a comparable pressure drop. Secondly, mass concentrations of 6PPD were comparable across all impactors except the PENS. These observations indicate that additional influencing factors, beyond the pressure drop alone, could potentially affect the analysis more significantly.
Despite the application of a coating, we suspected particle bounce and thus tested whether the absolute deviation from the impactor average mass concentration was dependent on the ambient marker mass concentration (Fig. 8b). While we expected an increasing effect with higher mass concentrations, the potential dependency became more apparent only at the highest daily average concentrations, particularly above 1 ng m−3. Below this level, the data primarily exhibited scatter, suggesting that any systematic influence of particle bounce may be less pronounced at lower concentrations.
While the nature of the particles may play a role in their efficiency of being captured by the filter substrate – as evident when comparing sticky, spherical SOA particles to combustion particles with complex shapes (Boskovic et al., 2005; Matthew et al., 2008; Huang et al., 2004) – the design of the impactors likely determines the potential for particle bounce. The main differences between the PENS and the other impactors are the cyclone and the number of stages used for separating and impacting larger particles. The larger number of stages – and, thus, the larger number of coated surfaces in the two MOUDI models and the ELPI – is likely beneficial for reducing the impact of particle bounce. The rotating stages of the 120R MOUDI-II potentially played a more significant role in the field study, with longer sampling times, than in the laboratory tests. Over time, the rotation resulted in an even loading of the upper stages, which, in addition to the coating, likely reduced particle bounce. Thus, we observed almost no dependency of the 120R MOUDI-II deviations on average mass concentrations with increasing mass concentration (Fig. 8b). However, as the marker compounds with high observed mass concentrations are, at the same time, semi-volatile, we cannot completely separate the two effects of pressure-drop-driven losses and mass gain due to particle bounce within this study.
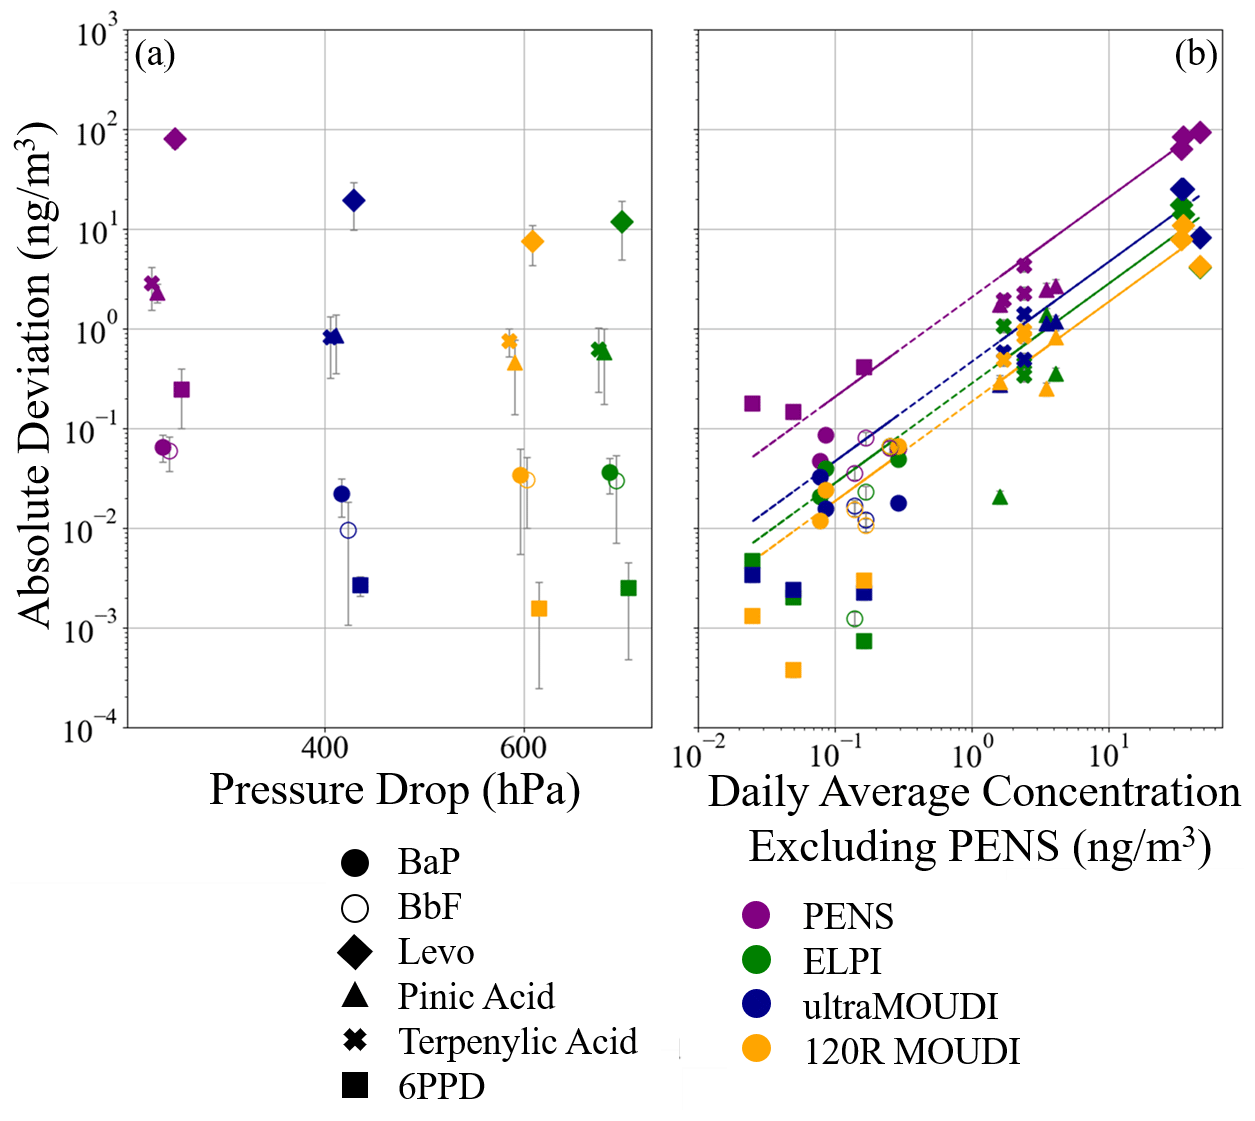
Figure 8(a) Absolute deviations of the average mass concentrations of BaP, BbF, Levo, pinic acid, terpenylic acid, and 6PPD, as determined by the four impactors, are presented as functions of the pressure drop across the impactors. Data points are displaced horizontally around each impactor's nominal pressure drop value for illustrative purposes, allowing for comparison while avoiding overlap. The markers denote different substances: BaP (filled circles), BbF (unfilled circles), Levo (diamonds), pinic acid (triangles), terpenylic acid (crosses), and 6PPD (squares). (b) Absolute deviations from the mass concentration averages for the PENS (purple), ELPI (green), ultraMOUDI (dark blue), and 120R MOUDI-II (orange) with respect to the selected organic marker compounds in UFPs are shown. Linear regressions through the origin are included for each impactor.
This study provides a detailed characterization and comparison of the performance of four impactors: the 120R MOUDI-II, ultraMOUDI, ELPI, and PENS. To understand the impact of the impactors' designs on their ability to collect UFPs, we examined them with respect to pressure drops, cutoff diameters, the steepness of the cutoff curve, losses, and particle bounce. Under controlled conditions using three test particle mixtures, we showed that not only the impactor design but also the nature of the particles contribute to differences in the observed results. This was confirmed when we applied the four impactors to ambient air to examine the mass concentrations of six organic markers in UFPs. In summary, all four impactors were capable of separating and collecting UFPs as they all have a cutoff diameter of about 100 nm. More explicitly, they can be characterized as follows:
-
The PENS is compact and lightweight, making it portable and suitable for field studies or personal exposure studies that require mobility. With a sampling flow rate of 4 L min−1, a smaller air volume is probed compared to other impactors. This affects the detection limits while keeping the pressure drop within the device low (about 260 hPa). Thus, the evaporation and mass loss of semi-volatile compounds are comparably low. The PENS showed an impact from particle bounce, particularly at higher particle concentrations. We showed that the application of a coating largely reduced the transmission of larger particles in the laboratory tests. However, when markers were present at high mass concentrations, we observed a significant deviation from the results of the other impactors in the field comparison. This is likely due to the design of the PENS, which features a cyclone for pre-separation and only one stage for the impaction of larger particles, which could be used for applying a coating. However, for particle-bound BaP and BbF, as well as moderate marker mass concentrations, the PENS compared well with the other impactors.
-
The ELPI was simplified for this study. When operated in its original setup, it offers the advantage of parallel online monitoring of the number size distribution. Here, the ELPI showed a sharp cutoff curve for UFPs and effectively no transmission of larger particles. This is likely due to its design, featuring 13 nozzle–impactor pairs, which can retain larger particles and prevent fragments from cascading through the device. However, this comes with an overall loss in the ultrafine fraction (31 ± 7 %) and a pressure drop of 690 hPa. The reduced pressure on the filter substrate can lead to the evaporative loss of semi-volatile substances during sampling, while non-volatile, particle-bound compounds in UFPs (e.g., metals and plastics) may be unaffected by this effect.
-
The 120R MOUDI-II features a rotating design that distributes particles evenly across the impaction surface, reducing particle buildup and re-entrainment. Indeed, no transmission of particles larger than about 500 nm was observed in our test, and the bounce effect remained comparably small. However, the cutoff curve was relatively broad, as can be seen, for example, from the dp90 value, which was about 180 nm – the highest among the four tested impactors. Interestingly, in our tests, the sharpness of the cutoff curve for the 120R MOUDI-II was not impacted by the particle type. The 120R MOUDI-II features a pressure drop of 600 hPa. Thus, for semi-volatile substances, evaporative losses are likely. In future studies, it would be interesting to determine the long-term efficacy of the rotation in minimizing the bounce effect.
-
The ultraMOUDI is a non-rotating, simplified variant of the 120R MOUDI-II. As it features a pressure drop of 420 hPa, evaporation loss of semi-volatile compounds is less likely compared to the ELPI and 120R MOUDI-II. Due to a reduced number of nozzle–impactor pairs, it showed fewer losses in the ultrafine range compared to the ELPI and 120R MOUDI-II. When compared based on the mass concentrations in ambient UFPs, the ultraMOUDI agreed well within the measurement uncertainty for the mostly particle-bound BaP, BbF, and 6PPD markers, and it found slightly higher concentrations for the semi-volatile TA, PA, and Levo markers. Similar to the PENS, we observed the transmission of larger particles due to potential particle bounce; however, we showed that this effect was reduced with the application of a coating. The ultraMOUDI is smaller and simpler to handle than the 120R MOUDI-II and, thus, can be integrated, for instance, into automated, standalone low-volume samplers.
Our findings indicate that separating and collecting UFPs for mass-based chemical analysis is challenging. Numerous factors affect the separation and collection of UFPs, complicating the comparability of studies. The nuanced performance differences among the impactors underscore the need for careful consideration of the intended application and the potential artifacts that may arise during sampling and analysis. Each impactor offers unique advantages and limitations, making it essential to match the impactor to the specific research goals and the properties of the particles being studied. Furthermore, the variability in the performance of the impactors in the analysis of the six selected organic markers suggests that factors such as chemical composition, particle morphology, and physical interactions with the impactor significantly influence the results as well.
The code and data used in this study are available upon request from the corresponding authors.
The supplement related to this article is available online at: https://doi.org/10.5194/ar-3-45-2025-supplement.
EE: measurements, data analysis, and writing (original draft, review, and editing). AM and DB: DMS500 measurements, data analysis, and writing. NG, JSK, MS, RZ, and ACN: funding acquisition, conceptualization, supervision, writing (review and editing), and funding acquisition.
The contact author has declared that none of the authors has any competing interests.
Publisher’s note: Copernicus Publications remains neutral with regard to jurisdictional claims made in the text, published maps, institutional affiliations, or any other geographical representation in this paper. While Copernicus Publications makes every effort to include appropriate place names, the final responsibility lies with the authors.
We thank Wolf-Ulrich Palm and Klaus Kümmerer from Leuphana University Lüneburg for providing us with the fluorescence detector. Additionally, we extend our gratitude to the KeyLabs at the Bavarian Polymer Institute (BPI), University of Bayreuth, for providing the scanning electron microscopy images.
This research has been financed by the Bayerisches Staatsministerium für Umwelt und Verbraucherschutz (grant no. TLK01L-77229).
This paper was edited by Aladar Czitrovszky and reviewed by two anonymous referees.
Abdillah, S. F. I. and Wang, Y. F.: Ambient ultrafine particle (PM0.1): Sources, characteristics, measurements and exposure implications on human health, https://doi.org/10.1016/j.envres.2022.115061, 1 February 2023.
Baron, P. A. and Willeke, K.: Aerosol Measurement: Principles, Techniques, and Applications, 3rd edn., https://doi.org/10.1002/9781118001684, 2011.
Bayerisches Landesamt für Statistik: Statistik kommunal – Kreisfreie Stadt Bayreuth – 09462, 1–30 pp., https://statistik.bayern.de/mam/produkte/statistik_kommunal/2022/09472.pdf (last access: 15 January 2025), 2022.
Bein, K. J. and Wexler, A. S.: A high-efficiency, low-bias method for extracting particulate matter from filter and impactor substrates, Atmos. Environ., 90, 87–95, 2014.
Berner, A., Luerzer, C. H., Pohl, F., Preining, O., and Wagner, P.: The size distribution of the urban aerosol in Vienna, Sci. Total Environ., 13, 245–261, 1979.
Bhattarai, H., Saikawa, E., Wan, X., Zhu, H., Ram, K., Gao, S., Kang, S., Zhang, Q., Zhang, Y., Wu, G., Wang, X., Kawamura, K., Fu, P., and Cong, Z.: Levoglucosan as a tracer of biomass burning: Recent progress and perspectives, Atmos. Res., 220, 20–33, https://doi.org/10.1016/j.atmosres.2019.01.004, 15 May 2019.
Boskovic, L., Altman, I. S., Agranovski, I. E., Braddock, R. D., Myojo, T., and Choi, M.: Influence of particle shape on filtration processes, Aerosol Sci. Technol., 39, 1184–1190, https://doi.org/10.1080/02786820500442410, 2005.
Brink, J. A.: Cascade Impactor for Adiabatic Measurements, Ind. Eng. Chem., 50, 645–648, 1958.
Cambustion Ltd.: DMS500 fast particulate analyzer brochure, Cambridge, United Kingdom, 1–6 pp., https://www.cambustion.com/products/engine-exhaust-emissions/dms500-particulate-analyser (last access: 14 January 2025), 2019.
Canepari, S., Astolfi, M. L., Moretti, S., and Curini, R.: Comparison of extracting solutions for elemental fractionation in airborne particulate matter, Talanta, 82, 834–844, https://doi.org/10.1016/j.talanta.2010.05.068, 2010.
Caracci, E., Iannone, A., Carriera, F., Notardonato, I., Pili, S., Murru, A., Avino, P., Campagna, M., Buonanno, G., and Stabile, L.: Size-segregated content of heavy metals and polycyclic aromatic hydrocarbons in airborne particles emitted by indoor sources, Sci. Rep., 14, 20739, https://doi.org/10.1038/s41598-024-70978-3, 2024.
Chang, M., Kim, S., and Sioutas, C.: Experimental studies on particle impaction and bounce: effects of substrate design and material, Atmos. Environ., 33, 2313–2322, https://doi.org/10.1016/S1352-2310(99)00082-5, 1999.
Chen, S. C., Tsai, C. J., Chen, H. D., Huang, C. Y., and Roam, G. D.: The influence of relative humidity on nanoparticle concentration and particle mass distribution measurements by the MOUDI, Aerosol Sci. Technol., 45, 596–603, https://doi.org/10.1080/02786826.2010.551557, 2011.
Chen, X., He, T., Yang, X., Gan, Y., Qing, X., Wang, J., and Huang, Y.: Analysis, environmental occurrence, fate and potential toxicity of tire wear compounds 6PPD and 6PPD-quinone, J. Hazard. Mater., 452, 131245, https://doi.org/10.1016/j.jhazmat.2023.131245, 15 June 2023.
Claeys, M., Szmigielski, R., Vermeylen, R., Wang, W., Shalamzari, M. S., and Maenhaut, W.: Tracers for Biogenic Secondary Organic Aerosol from α-Pinene and Related Monoterpenes: An Overview, Springer, https://doi.org/10.1007/978-94-007-5034-0_18, 2013.
Crazzolara, C. and Held, A.: Development of a cascade impactor optimized for size-fractionated analysis of aerosol metal content by total reflection X-ray fluorescence spectroscopy (TXRF), Atmos. Meas. Tech., 17, 2183–2194, https://doi.org/10.5194/amt-17-2183-2024, 2024.
Daher, N., Ning, Z., Cho, A. K., Shafer, M., Schauer, J. J., and Sioutas, C.: Comparison of the chemical and oxidative characteristics of particulate matter (PM) collected by different methods: Filters, impactors, and BioSamplers, Aerosol Sci. Technol., 45, 1294–1304, https://doi.org/10.1080/02786826.2011.590554, 2011.
de Souza, S. L. Q., Martins, E. M., Corrêa, S. M., da Silva, J. L., de Castro, R. R., and de Souza Assed, F.: Determination of trace elements in the nanometer, ultrafine, fine, and coarse particulate matters in an area affected by light vehicular emissions in the city of Rio de Janeiro, Environ. Monit. Assess., 193, 92, https://doi.org/10.1007/s10661-021-08891-9, 1 February 2021.
Durand, T., Bau, S., Morele, Y., Matera, V., Bémer, D., and Rousset, D.: Quantification of low pressure impactor wall deposits during ziuc nanoparticle sampling, Aerosol Air Qual. Res., 14, 1812–1821, https://doi.org/10.4209/aaqr.2013.10.0304, 2014.
Fujitani, Y., Hasegawa, S., Fushimi, A., Kondo, Y., Tanabe, K., Kobayashi, S., and Kobayashi, T.: Collection characteristics of low-pressure impactors with various impaction substrate materials, Atmos. Environ., 40, 3221–3229, https://doi.org/10.1016/j.atmosenv.2006.02.001, 2006.
Gong, W.-C., Jidenko, N., Li, Y.-R., Le, T.-C., Borra, J.-P., and Tsai, C.-J.: PM0.1 non-bouncing impactor (NBI) for ultrafine particle mass and number measurements, J. Aerosol. Sci., 174, 106249, https://doi.org/https://doi.org/10.1016/j.jaerosci.2023.106249, 2023.
Grieshop, A. P., Donahue, N. M., and Robinson, A. L.: Is the gas-particle partitioning in alpha-pinene secondary organic aerosol reversible?, Geophys. Res. Lett., 34, L14810, https://doi.org/10.1029/2007GL029987, 2007.
Guo, J., Ji, A., and Xu, Z.: On-site characteristics of airborne particles at a formal electronic waste recycling plant: size distribution and lung deposited surface area, J. Mater Cy. Waste Manag., 25, 346–358, https://doi.org/10.1007/s10163-022-01536-0, 2023.
Hata, M., Linfa, B., Otani, Y., and Furuuchi, M.: Performance evaluation of an Andersen cascade impactor with an additional stage for nanoparticle sampling, Aerosol Air Qual. Res., 12, 1041–1048, https://doi.org/10.4209/aaqr.2012.08.0204, 2012.
Held, A., Zerrath, A., McKeon, U., Fehrenbach, T., Niessner, R., Plass-Dülmer, C., Kaminski, U., Berresheim, H., and Pöschl, U.: Aerosol size distributions measured in urban, rural and high-alpine air with an electrical low pressure impactor (ELPI), Atmos. Environ., 42, 8502–8512, https://doi.org/10.1016/j.atmosenv.2008.06.015, 2008.
Hillamo, R. E. and Kauppinen, E. I.: On the performance of the berner low pressure impactor, Aerosol Sci. Technol., 14, 33–47, https://doi.org/10.1080/02786829108959469, 1991.
Huang, Z., Harrison, R. M., Allen, A. G., James, J. D., Tilling, R. M., and Yin, J.: Field intercomparison of filter pack and impactor sampling for aerosol nitrate, ammonium, and sulphate at coastal and inland sites, Atmos. Res., 71, 215–232, https://doi.org/10.1016/j.atmosres.2004.05.002, 2004.
Hussain, K., Hoque, R. R., Balachandran, S., Medhi, S., Idris, M. G., Rahman, M., and Hussain, F. L.: Monitoring and Risk Analysis of PAHs in the Environment, in: Handbook of Environmental Materials Management, Springer International Publishing, 1–35, https://doi.org/10.1007/978-3-319-58538-3_29-2, 2018.
Hu, X., Zhao, H. N., Tian, Z., Peter, K. T., Dodd, M. C., and Kolodziej, E. P.: Transformation Product Formation upon Heterogeneous Ozonation of the Tire Rubber Antioxidant 6PPD (N-(1,3-dimethylbutyl)- N′-phenyl- p-phenylenediamine), Environ. Sci. Technol. Lett., 9, 413–419, https://doi.org/10.1021/acs.estlett.2c00187, 2022.
Järvinen, A., Aitomaa, M., Rostedt, A., Keskinen, J., and Yli-Ojanperä, J.: Calibration of the new electrical low pressure impactor (ELPI+), J. Aerosol Sci., 69, 150–159, https://doi.org/10.1016/j.jaerosci.2013.12.006, 2014.
Junkermann, W. and Hacker, J.: Unprecedented levels of ultrafine particles, major sources, and the hydrological cycle, Sci. Rep., 12, 7410, https://doi.org/10.1038/s41598-022-11500-5, 2022.
Keskinen, J., Pietarinen, K., and Lehtim, M.: Electrical Low Pressure Impactor, J. Aerosol Sci, 23, 353–360, https://doi.org/10.1016/0021-8502(92)90004-F, 1992.
Kim, B., Lee, J. S., Choi, B.-S., Park, S.-Y., Yoon, J.-H., and Kim, H.: Ultrafine Particle Characteristics in a Rubber Manufacturing Factory, Ann. Occup. Hyg., 57, 728–739, https://doi.org/10.1093/annhyg/mes102, 2013a.
Kim, K. H., Jahan, S. A., Kabir, E., and Brown, R. J. C.: A review of airborne polycyclic aromatic hydrocarbons (PAHs) and their human health effects, Environ. Int., 66, 71–80, https://doi.org/10.1016/j.envint.2013.07.019, 2013b.
Klöckner, P., Seiwert, B., Wagner, S., and Reemtsma, T.: Organic Markers of Tire and Road Wear Particles in Sediments and Soils: Transformation Products of Major Antiozonants as Promising Candidates, Environ. Sci. Technol., 55, 11723–11732, https://doi.org/10.1021/acs.est.1c02723, 2021.
Kulkarni, P., Baron, P. A., and Willeke, K.: Aerosol Measurment: Principles, Techniques, and Applications, 3rd Edn., https://doi.org/10.1002/9781118001684, 2011.
Kumar, P., Morawska, L., Birmili, W., Paasonen, P., Hu, M., Kulmala, M., Harrison, R. M., Norford, L., and Britter, R.: Ultrafine particles in cities, Environ. Inter., 66, 1–10, https://doi.org/10.1016/j.envint.2014.01.013, 2014.
Kumar, P., Kalaiarasan, G., Porter, A. E., Pinna, A., Kłosowski, M. M., Demokritou, P., Chung, K. F., Pain, C., Arvind, D. K., Arcucci, R., Adcock, I. M., and Dilliway, C.: An overview of methods of fine and ultrafine particle collection for physicochemical characterisation and toxicity assessments, Sci. Total Environ., 756, 143553, https://doi.org/10.1016/j.scitotenv.2020.143553, 20 February 2021.
Kumsanlas, N., Piriyakarnsakul, S., Sok, P., Hongtieab, S., Ikemori, F., Szymanski, W. W., Hata, M., Otani, Y., and Furuuchi, M.: A cascade air sampler with multi-nozzle inertial filters for PM0.1, Aerosol Air Qual. Res., 19, 1666–1677, https://doi.org/10.4209/aaqr.2019.02.0066, 2019.
Lai, C. Y., Huang, S. H., Chang, C. P., and Lin, J. Y.: Reducing particle bounce and loading effect for a multi-hole impactor, Aerosol Sci. Technol., 42, 114–122, https://doi.org/10.1080/02786820701809045, 2008.
Liu, C.-N., Awasthi, A., Hung, Y.-H., and Tsai, C.-J.: Collection efficiency and interstage loss of nanoparticles in micro-orifice-based cascade impactors, Atmos. Environ., 69, 325–333, https://doi.org/https://doi.org/10.1016/j.atmosenv.2012.12.003, 2013.
Maharaj Kumari, K. and Lakhani, A.: PAHs in Gas and Particulate Phases: Measurement and Control, in: Environmental Contaminants: Measurement, Modelling and Control, edited by: Gupta, T., Agarwal, A. K., Agarwal, R. A., and Labhsetwar, N. K., Springer Singapore, Singapore, 43–75, https://doi.org/10.1007/978-981-10-7332-8_3, 2018.
Manoli, E., Kouras, A., Karagkiozidou, O., Argyropoulos, G., Voutsa, D., and Samara, C.: Polycyclic aromatic hydrocarbons (PAHs) at traffic and urban background sites of northern Greece: source apportionment of ambient PAH levels and PAH-induced lung cancer risk, Environ. Sci. Pollut. Res., 23, 3556–3568, https://doi.org/10.1007/s11356-015-5573-5, 2016.
Marjamäki, M., Keskinen, J., Chen, D.-R., and Pui, D. Y. H.: Perfomance Evaluation of the Electrical Low-Pressure Impactor (ELPI), J. Aerosol Sci, 31, 249–261, 2000.
Marple, V., Olson, B., Romay, F., Hudak, G., Geerts, S. M., and Lundgren, D.: Second generation micro-orifice uniform deposit impactor, 120 MOUDI-II: Design, Evaluation, and application to long-term ambient sampling, Aerosol Sci. Technol., 48, 427–433, https://doi.org/10.1080/02786826.2014.884274, 2014.
Marple, V. A. and Willeke, K.: IMPACTOR DESIGN, Pergamon Press, 891–896 pp., https://doi.org/10.1016/0004-6981(76)90144-X, 1976.
Marple, V. A., Rubow, K. L., and Behm, S. M.: A microorifice uniform deposit impactor (moudi): Description, calibration, and use, Aerosol Sci. Technol., 14, 434–436, https://doi.org/10.1080/02786829108959504, 1991.
Matthew, B. M., Middlebrook, A. M., and Onasch, T. B.: Collection efficiencies in an aerodyne aerosol mass spectrometer as a function of particle phase for laboratory generated aerosols, Aerosol Sci. Technol., 42, 884–898, https://doi.org/10.1080/02786820802356797, 2008.
May, K. R.: The Cascade Impactor: An Instrument for Sampling Coarse Aerosols, J. Sci. Instrum, 22, 187–195, 1945.
Mitchell, R. I. and Pilcher, J. M.: Measuring Aerosol Particle Sizes in Air pollutants, Commercial aerosols and Cigarette smoke, Indus. Eng. Chem., 51, 1039–1042, 1959.
Mühlbauer, W., Zöllner, C., Lehmann, S., Lorenz, S., and Brüggemann, D.: Correlations between physicochemical properties of emitted diesel particulate matter and its reactivity, Combust Flame, 167, 39–51, https://doi.org/10.1016/j.combustflame.2016.02.029, 2016.
Müller, K., Spindler, G., Van Pinxteren, D., Gnauk, T., Iinuma, Y., Brüggemann, E., and Herrmann, H.: Ultrafine and fine particles in the atmosphere - Sampling, chemical characterization and sources, Chem Ing. Tech., 84, 1130–1136, https://doi.org/10.1002/cite.201100208, 2012.
Newton, G. J., Cheng, Y. S., Barr, E. B., and Yeh, H. C.: Effects of collection substrates on performance and wall losses in cascade impactors, J. Aerosol Sci., 21, 467–470, https://doi.org/10.1016/0021-8502(90)90075-9, 1990.
Ngagine, S. H., Deboudt, K., Flament, P., Choël, M., Kulinski, P., and Marteel, F.: Development and Characterization of a Time-Sequenced Cascade Impactor: Application to Transient PM2.5 Pollution Events in Urbanized and Industrialized Environments, Atmosphere (Basel), 13, 244, https://doi.org/10.3390/atmos13020244, 2022.
Ofner, J., Krüger, H.-U., Grothe, H., Schmitt-Kopplin, P., Whitmore, K., and Zetzsch, C.: Physico-chemical characterization of SOA derived from catechol and guaiacol – a model substance for the aromatic fraction of atmospheric HULIS, Atmos. Chem. Phys., 11, 1–15, https://doi.org/10.5194/acp-11-1-2011, 2011.
Pak, S. S., Liu, B. Y. H., and Rubow, K. L.: Effect of coating thickness on particle bounce in inertial impactors, Aerosol Sci. Technol., 16, 141–150, https://doi.org/10.1080/02786829208959544, 1992.
Pomata, D., Di Filippo, P., Riccardi, C., Buiarelli, F., Marini, F., Romani, L., Lucarelli, F., Pazzi, G., Galarini, R., and Simonetti, G.: Concentrations and co-occurrence of 101 emerging and legacy organic pollutants in the ultrafine, fine and coarse fractions of airborne particulates associated with treatment of waste from electrical and electronic equipment, Chemosphere, 338, 139443, https://doi.org/10.1016/j.chemosphere.2023.139443, 2023.
Rao, A. K. and Whitby, K. T.: Non-ideal collection characteristics of inertial impactors-i. single-stage impactors and solid particles, J. Aerosol Sci. Pergamon Press, 9, 77–86 pp., https://doi.org/10.1016/0021-8502(78)90069-1, 1978.
Romay, F. J. and García-Ruiz, E.: Design of Round-Nozzle Inertial Impactors Review with Updated Design Parameters, Aerosol Air Qual. Res., 23, 220436, https://doi.org/10.4209/aaqr.220436, 2023.
Schwarz, M., Schneider, A., Cyrys, J., Bastian, S., Breitner, S., and Peters, A.: Impact of Ambient Ultrafine Particles on Cause-Specific Mortality in Three German Cities, Am. J. Respir. Crit. Care Med., 207, 1334–1344, https://doi.org/10.1164/rccm.202209-1837oc, 2023.
Simoneit, B. R. T., Schauer, J. J., Nolte, C. G., Oros, D. R., Elias, V. O., Fraser, M. P., Rogge, W. F., and Cass, G. R.: Levoglucosan, a tracer for cellulose in biomass burning and atmospheric particles, Atmos. Environ., 33, 173–182, https://doi.org/10.1016/S1352-2310(98)00145-9, 1999.
Symonds, J., Collings, N., StJReavell, K., and Kittelson, D.: Evaporation of Volatile Aerosols, ETH Hönggerberg, https://doi.org/10.13140/2.1.3274.7527, 2004.
Symonds, J. P. R., Reavell, K. S. J., Olfert, J. S., Campbell, B. W., and Swift, S. J.: Diesel soot mass calculation in real-time with a differential mobility spectrometer, J. Aerosol Sci., 38, 52–68, https://doi.org/10.1016/j.jaerosci.2006.10.001, 2007.
Thongyen, T., Hata, M., Toriba, A., Ikeda, T., Koyama, H., Otani, Y., and Furuuchi, M.: Development of PM0.1 personal sampler for evaluation of personal exposure to aerosol nanoparticles, Aerosol Air Qual. Res., 15, 180–187, https://doi.org/10.4209/aaqr.2014.05.0102, 2015.
Tsai, C. J., Liu, C. N., Hung, S. M., Chen, S. C., Uang, S. N., Cheng, Y. S., and Zhou, Y.: Novel active personal nanoparticle sampler for the exposure assessment of nanoparticles in workplaces, Environ. Sci. Technol., 46, 4546–4552, https://doi.org/10.1021/es204580f, 2012.
Turner, J. R. and Hering, S. V: GREASED AND OILED SUBSTRATES AS BOUNCE-FREE IMPACTION SURFACES, J. Aerosol Sci., 18, 215–224, https://doi.org/10.1016/0021-8502(87)90057-7, 1987.
Ungeheuer, F., van Pinxteren, D., and Vogel, A. L.: Identification and source attribution of organic compounds in ultrafine particles near Frankfurt International Airport, Atmos. Chem. Phys., 21, 3763–3775, https://doi.org/10.5194/acp-21-3763-2021, 2021.
Vestenius, M., Hellén, H., Levula, J., Kuronen, P., Helminen, K. J., Nieminen, T., Kulmala, M., and Hakola, H.: Acidic reaction products of monoterpenes and sesquiterpenes in atmospheric fine particles in a boreal forest, Atmos. Chem. Phys., 14, 7883–7893, https://doi.org/10.5194/acp-14-7883-2014, 2014.
Wang, G., Huang, L., Xin Zhao, Niu, H., and Dai, Z.: Aliphatic and polycyclic aromatic hydrocarbons of atmospheric aerosols in five locations of Nanjing urban area, China, Atmos. Res., 81, 54–66, https://doi.org/10.1016/j.atmosres.2005.11.004, 2006.
Wiedensohler, A., Birmili, W., Nowak, A., Sonntag, A., Weinhold, K., Merkel, M., Wehner, B., Tuch, T., Pfeifer, S., Fiebig, M., Fjäraa, A. M., Asmi, E., Sellegri, K., Depuy, R., Venzac, H., Villani, P., Laj, P., Aalto, P., Ogren, J. A., Swietlicki, E., Williams, P., Roldin, P., Quincey, P., Hüglin, C., Fierz-Schmidhauser, R., Gysel, M., Weingartner, E., Riccobono, F., Santos, S., Grüning, C., Faloon, K., Beddows, D., Harrison, R., Monahan, C., Jennings, S. G., O'Dowd, C. D., Marinoni, A., Horn, H.-G., Keck, L., Jiang, J., Scheckman, J., McMurry, P. H., Deng, Z., Zhao, C. S., Moerman, M., Henzing, B., de Leeuw, G., Löschau, G., and Bastian, S.: Mobility particle size spectrometers: harmonization of technical standards and data structure to facilitate high quality long-term observations of atmospheric particle number size distributions, Atmos. Meas. Tech., 5, 657–685, https://doi.org/10.5194/amt-5-657-2012, 2012.
Wiedensohler, A., Wiesner, A., Weinhold, K., Birmili, W., Hermann, M., Merkel, M., Müller, T., Pfeifer, S., Schmidt, A., Tuch, T., Velarde, F., Quincey, P., Seeger, S., and Nowak, A.: Mobility particle size spectrometers: Calibration procedures and measurement uncertainties, Aerosol Sci. Technol., 52, 146–164, https://doi.org/10.1080/02786826.2017.1387229, 2018.
Won Kim, S.: Critical Review on Evaporative Loss of Semivolatile Aerosols during Sampling, J. Env. Hlth. Sci., 36, 171–181, https://doi.org/10.5668/JEHS.2010.36.3.171, 2010.
Xie, M., Hannigan, M. P., and Barsanti, K. C.: Gas/particle partitioning of 2-methyltetrols and levoglucosan at an urban site in Denver, Environ. Sci. Technol., 48, 2835–2842, https://doi.org/10.1021/es405356n, 2014.
Yao, Y., Ye, X., Gao, T., Feng, H., Chen, Y., and Chen, J.: Significant impactor sampling artifacts of ammonium, nitrate, and organic acids, Atmos. Environ., 274, 118985, https://doi.org/10.1016/j.atmosenv.2022.118985, 2022.
Young, L. H., Lin, Y. H., Lin, T. H., Tsai, P. J., Wang, Y. F., Hung, S. M., Tsai, C. J., and Chen, C. W.: Field application of a newly developed personal nanoparticle sampler to selected metalworking operations, Aerosol Air Qual. Res., 13, 849–861, https://doi.org/10.4209/aaqr.2012.10.0270, 2013a.
Young, L. H., Lin, Y. H., Lin, T. H., Tsai, P. J., Wang, Y. F., Hung, S. M., Tsai, C. J., and Chen, C. W.: Field application of a newly developed personal nanoparticle sampler to selected metalworking operations, Aerosol Air Qual. Res., 13, 849–861, https://doi.org/10.4209/aaqr.2012.10.0270, 2013b.
Zhao, Z., Hao, J., Li, J., and Wu, S.: Second organic aerosol formation from the ozonolysis of α-pinene in the presence of dry submicron ammonium sulfate aerosol, J. Environ. Sci., 20, 1183–1188, https://doi.org/10.1016/S1001-0742(08)62207-X, 2008.
Zhu, C.-S., Cao, J.-J., Tsai, C.-J., Zhang, Z.-S., and Tao, J.: Biomass burning tracers in rural and urban ultrafine particles in Xi'an, China, Atmos. Pollut. Res., 8, 614–618, https://doi.org/10.1016/j.apr.2016.12.011, 2017.