the Creative Commons Attribution 4.0 License.
the Creative Commons Attribution 4.0 License.
 | 13 Nov 2025
Long-term PM trends at boreal forest site in southern Finland from three different measurement techniques
Ilona Ylivinkka
Helmi-Marja Keskinen
Lauri R. Ahonen
Liine Heikkinen
Pasi P. Aalto
Tuomo Nieminen
Katrianne Lehtipalo
Krista Luoma
Sujai Banerji
Juho Aalto
Janne Levula
Jutta Kesti
Ekaterina Ezhova
Markku Kulmala
Tuukka Petäjä
Three independent particulate matter (PM) mass concentration measurements and their long-term (2005–2020) trends were compared at the Station for Measuring Ecosystem–Atmosphere Relations (SMEAR II, Hyytiälä, Finland). The different methods (a gravimetric method with a cascade impactor, an online method with a Synchronized Hybrid Ambient Real-time Particulate monitor (SHARP; only PM10), and a calculated PM concentration from a combined particle number size distribution data of a differential mobility particle sizer (DMPS) and an aerodynamic particle sizer (APS)) showed good correlation (Pearson's correlation coefficient of approximately 0.8) in all size classes (PM1, PM2.5, and PM10). The mass concentrations in all PM classes were the highest in summer and the lowest in autumn and winter. Statistically significant (Mann–Kendall test) declining annual trends were observed in DMPS+APS and impactor data in all size classes, ranging from −0.021 to −0.036 µg m−3 yr−1. While the DMPS+APS method also indicated a statistically significant decline in all seasons, the decline in impactor data was statistically significant only in spring and winter. SHARP data could not be used for trend estimation due to the change in the inlet heating temperature, affecting the measured PM10 concentrations. Seasonally, the decline was smallest in summer, which follows the trends also observed in SO2 and NOx concentrations. The results underline both the summertime dominance of biogenic sources for the aerosol mass concentration in the rural boreal forest environment and the reduction of anthropogenic pollution due to the EU-level restrictions for improved air quality.
- Article
(3895 KB) - Full-text XML
-
Supplement
(2216 KB) - BibTeX
- EndNote


Particulate matter (PM) concentrations are monitored worldwide, because they are connected to health effects, such as asthma, cardiovascular diseases, and premature deaths (Pope et al., 2003; Shiraiwa et al., 2017; WHO, 2021). The increased knowledge of the relationship between air pollution and mortality has resulted in air pollution regulations, which additionally aim to decrease inequality related to air pollution exposure (Wang et al., 2017; WHO, 2021). Besides the adverse health effects, aerosol particles can also scatter or absorb radiation and participate in cloud formation and processing, thus affecting the Earth's climate (IPCC, 2021). While the overall effect of aerosol particles on climate is considered to be cooling, radiative forcing due to aerosol particles and especially due to aerosol–cloud–radiation interactions is uncertain (IPCC, 2021).
PM measurements are divided into size classes based on the aerodynamic diameter of the particles: PM1, PM2.5, and PM10, with upper maximum diameters of particles 1, 2.5, and 10 µm, respectively. The PM mass concentration in these classes is the total mass of particles below the limiting size. The size of aerosol particles is a critical parameter, both in terms of their climate (e.g., Pöschl, 2005; Dusek et al., 2006) and health effects (Schraufnagel, 2020). In principle, the smaller the particles are, the deeper they can penetrate in the human respiratory system and thus end up in organs other than the lungs (Pope et al., 2003; Maynard and Kuempel, 2005). The smallest particles have only a minor contribution to the aerosol mass concentration, but they dominate the particle number concentration. From the climate perspective, the most relevant particles are larger than about 50–100 nm, since those can act as cloud condensation nuclei as well as scatter or absorb radiation (IPCC, 2021).
Aerosol particles have both natural and anthropogenic sources. Additionally, particles can be transported over hundreds or thousands of kilometers, since the lifetime of PM in the atmosphere is days to weeks, depending on the size, composition, and source region of the particles (Seinfeld and Pandis, 2006; Manavi et al., 2025). Primary aerosol particles consist mostly of particles from traffic and industry (e.g., black carbon (BC)) or from natural sources (e.g., volcanic ash, sea spray, dust, and pollen), and they contribute to all PM classes. Secondary aerosol particles are formed in the atmosphere from gas-phase precursor vapors (e.g., Kulmala et al., 2013). These particles eventually grow to larger sizes, contributing particularly to the accumulation mode and thereby to PM1.
At SMEAR II, organic aerosol (OA) from oxidized biogenic volatile organic compounds (VOCs), most importantly monoterpenes from the surrounding forest (Rinne et al., 2005), is the most abundant PM1 component (Jimenez et al., 2009; Heikkinen et al., 2020). The emission rates of monoterpenes are boosted by warm temperatures (Guenther et al., 1993), which is also observed in the OA mass concentrations (Heikkinen et al., 2021; Yli-Juuti et al., 2021). Sulfate, another key PM1 component at SMEAR II and globally, is formed, e.g., upon oxidation from sulfur dioxide (SO2), mostly emitted by industry (Seinfeld and Pandis, 2006).
Nitrate aerosol mass concentrations, mostly prevalent in agricultural or urban environments, are therefore less abundant at SMEAR II (Makkonen et al., 2014).
The European Union has regulated the exposure to air pollution since 2005 via air quality directives (https://environment.ec.europa.eu/topics/air/air-quality/eu-air-quality-standards_en, last access: 31 July 2025). The air quality directives concern basic pollutants: PM, trace gases (SO2, NO2, O3, CO, benzene, and polyaromatic hydrocarbons), and heavy metals (Pb, As, Ni, and Cd). Originally, legislation on PM concerned only PM10 concentration (the yearly average concentration was limited to 40 µg m−3), but in 2010 the target value was set for PM2.5 concentration (25 µg m−3 and limited to 20 µg m−3 in 2020).
At the end of 2024, the Ambient Air Quality Directive was revised (2024/2881), forcing further reductions for target values of many pollutants, including PM10, PM2.5, O3, SO2, CO, and benzene. Additionally, the new air quality directive introduces advanced measurement parameters, such as aerosol number concentration, aerosol size distribution, BC, and oxidative potential, to address i.a. the harmfulness of small aerosol particles. The air quality supersite concept was implemented as well (Kuula et al., 2022), aiming to compare the health impacts of the ultrafine particles and PM2.5 in urban and rural supersites. In addition, the EU Commission mandates measurements of ultrafine (defined as particles between 10 and 100 nm in diameter) and BC concentrations in the vicinity of air pollution hotspots.
Several studies have already reported declining PM concentrations in Europe (Barmpadimos et al., 2011, 2012; Cusack et al., 2012; Pandolfi et al., 2016), ranging from approximately −0.008 PM2.5 in the Po Valley, Italy (Bigi and Ghermandi, 2016) to −4.11 µg m−3 yr−1 in (sub)urban Germany (Guerreiro et al., 2014). In some cases, increasing trends have also been measured in relation to increased emissions from, for example, household combustion and agriculture (Guerreiro et al., 2014). Declining trends are related to the legislation on air quality as well as improved technology in industry, traffic, and heating (Spindler et al., 2004; Anttila and Tuovinen, 2010; Barmpadimos et al., 2011; Cusack et al., 2012; Keuken et al., 2012). In Finland, the PM concentrations have been declining during the past decades and generally are well below the limit values (Laakso et al., 2003; Anttila, 2020).
Techniques for measuring aerosol mass concentrations have improved remarkably during the last decades (Van Dingenen et al., 2004; Occhipinti and Oluwasanya, 2017; Shukla and Aggarwal, 2022). Most of the PM measurements have traditionally been done by offline gravimetric analyses where particle size classes are separated, e.g., by an impactor (Laakso et al., 2003) or special high-volume samplers (Barmpadimos et al., 2011). The offline methods are quite laborious as their sampling time can take up to a few days and weighing is done manually. Thus, PM concentrations are nowadays more commonly measured with online techniques, such as tapered element oscillating microbalance (TEOM) with the continuous ambient particulate monitor and the Synchronized Hybrid Ambient Real-time Particulate monitor (SHARP; Laakso et al., 2008; Chen et al., 2018; Waldén et al., 2010). Besides the direct mass measurements, the particle mass can be calculated from the particle number size distribution with assumptions regarding particles' shape and density (Neusüß et al., 2000).
The aim of this work is 3-fold. First, we compare the PM concentrations obtained from the gravimetric impactor, the online mass analyzer SHARP, and the particle number size distribution to explore their applicability for continuous PM measurements. Second, we report for the first time the long-term (2005–2020) measurements of PM10, PM2.5, and PM1 at SMEAR II, Finland, and explore the overall concentration levels as well as specific selected episodes. Third, we estimate the trends of the PM concentrations separately for each season and the impact of the EU legislation on the PM trends. Quality controlled data on aerosol particle mass concentration in a boreal background station enable us to explore the role of local, regional, and global phenomena controlling the aerosol mass concentration in the region. This work continues the analysis presented in Keskinen et al. (2020) with updated datasets and revised analysis methods.
2.1 Measurement station
The measurements were performed at SMEAR II, located in Hyytiälä in southern Finland (61°51′ N, 24°17′ E; 181 m a.s.l.; Fig. 1a). Hyytiälä is a rural background measurement site with low local anthropogenic emissions (Hari and Kulmala, 2005). A photo of the homogeneous 60-year-old Scots pine stand surrounding SMEAR II is presented in Fig. 1c. The nearest cities are Tampere (50 km southwest; 249 000 inhabitants) and Jyväskylä (90 km northeast; 146 000 inhabitants).
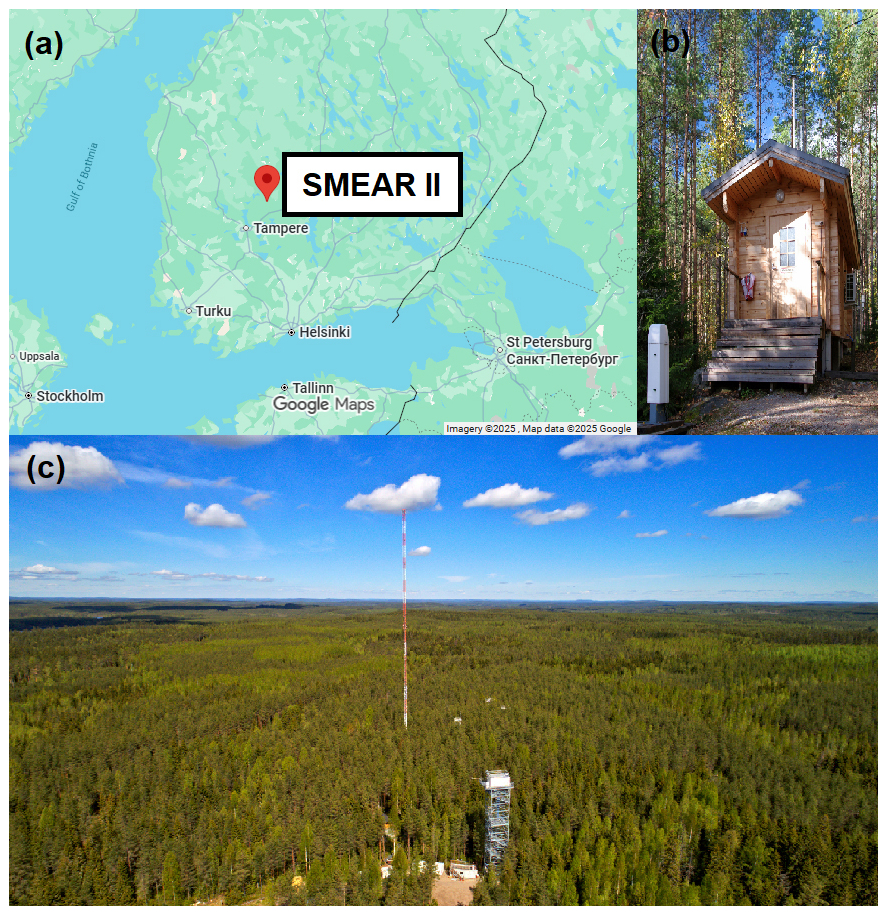
Figure 1(a) The location of SMEAR II (map data © 2025 Google Maps), (b) cottage for aerosol instrumentation (photo by Juho Aalto), and (c) a photo of the surrounding region of SMEAR II (photo by Juho Aalto and Matti Loponen).
The station is equipped with instruments for continuous and comprehensive measurements of interactions between the forest ecosystem and the atmosphere (Hari and Kulmala, 2005). SMEAR II is part of the European Aerosols, Clouds, and Trace gases Research Infrastructure (ACTRIS; Laj et al., 2024; https://www.actris.eu/, last access: 7 August 2025). The presented measurements are conducted inside the canopy with total suspended particulate (TSP) or PM10 design inlets for the different aerosol measurements on the roof of the aerosol cottage (Fig. 1b). Winter at SMEAR II is defined to be from December to February (DJF), spring is from March to May (MAM), summer from June to August (JJA), and autumn from September to November (SON). Note that winter has January and February data from the following year. Due to the data availability, measurements start from spring 2005, and at the end of the measurement period, winter includes only December 2020.
2.2 Weighing-based mass measurements with cascade impactor
PM measurements with a gravimetric cascade impactor started in the late 1990s at SMEAR II. The impactor has an unheated TSP inlet with a stainless steel tube, placed at 5 m height above the ground. The cascade impactor has three stages, with impactor cut points at 10 µm (PM10), 2.5 µm (PM2.5), and 1 µm (PM1) (Dekati PM10 impactor; Berner and Luerzer, 1980). The sample air flow rate during collection is 30 L min−1. Collection substrates are 25 mm polycarbonate membranes (Nuclepore 800 203) without holes. At the last stage, there is a 47 mm Teflon filter with a 2 µm pore size (R2P J047) from Pall Corporation. To prevent the bouncing back of the particles from the collection substrates, the membranes are greased with Apiezon L vacuum grease diluted in toluene. The impactor samples are collected for 2 to 3 d before the filters are taken to a clean laboratory room, where they are dried in a laminar flow hood for at least 2 h before weighing to get the mass distribution. The samples are stored in a freezer for occasional further analyses.
2.3 Online mass measurements with SHARP
The Synchronized Hybrid Ambient Real-time Particulate monitor (SHARP, Thermo Scientific, model 5030) is a real-time particulate monitor measuring at a 1 s time resolution (Goohs et al., 2009). SHARP combines light-scattering photometry and β-ray attenuation for continuous PM10 measurement. In SHARP, the light-scattering signal (nephelometer) is automatically calibrated against the beta attenuation mass sensor. The sample line inlet is placed on the roof of the cottage at 6 m height above the ground level, and its flow rate is 16.7 L min−1. The sample line is heated to reduce the humidity of the sample air. The temperature was fixed at 45 °C until August 2016 and at 35 °C after that. The sensitivity of the instrument was calibrated regularly with a specific foil. Sampling with SHARP at SMEAR II started in 2012.
2.4 Aerosol mass derived from the particle size distribution
The aerosol mass concentration for different size classes of PM10, PM2.5, and PM1 can also be estimated by combining the number size distributions measured with a differential mobility particle sizer (DMPS) and an aerodynamic particle sizer (APS) and calculating the mass by assuming that the particles are spherical and have a constant density. The instrument setups for DMPS and APS are described in detail by Aalto et al. (2001). Briefly, the twin-DMPS consists of a long and a short Vienna-type differential mobility analyzer (DMA) and two condensation particle counters (CPCs; TSI 3025 and TSI 3775). The DMPS inlet is placed on the roof of the cottage at 8 m height and the APS inlet at 5 m above ground level. The DMPS and APS systems provide the aerosol number size distribution with a 10 min time resolution. The APS inlet line is heated to 35 °C, similar to the SHARP inlet line. In the DMPS system, the sheath flow is dried with a silica diffusion dryer. The relative humidity of the sheath flow was kept below 40 %. The calibrations of both instruments are checked regularly using polystyrene latex spheres.
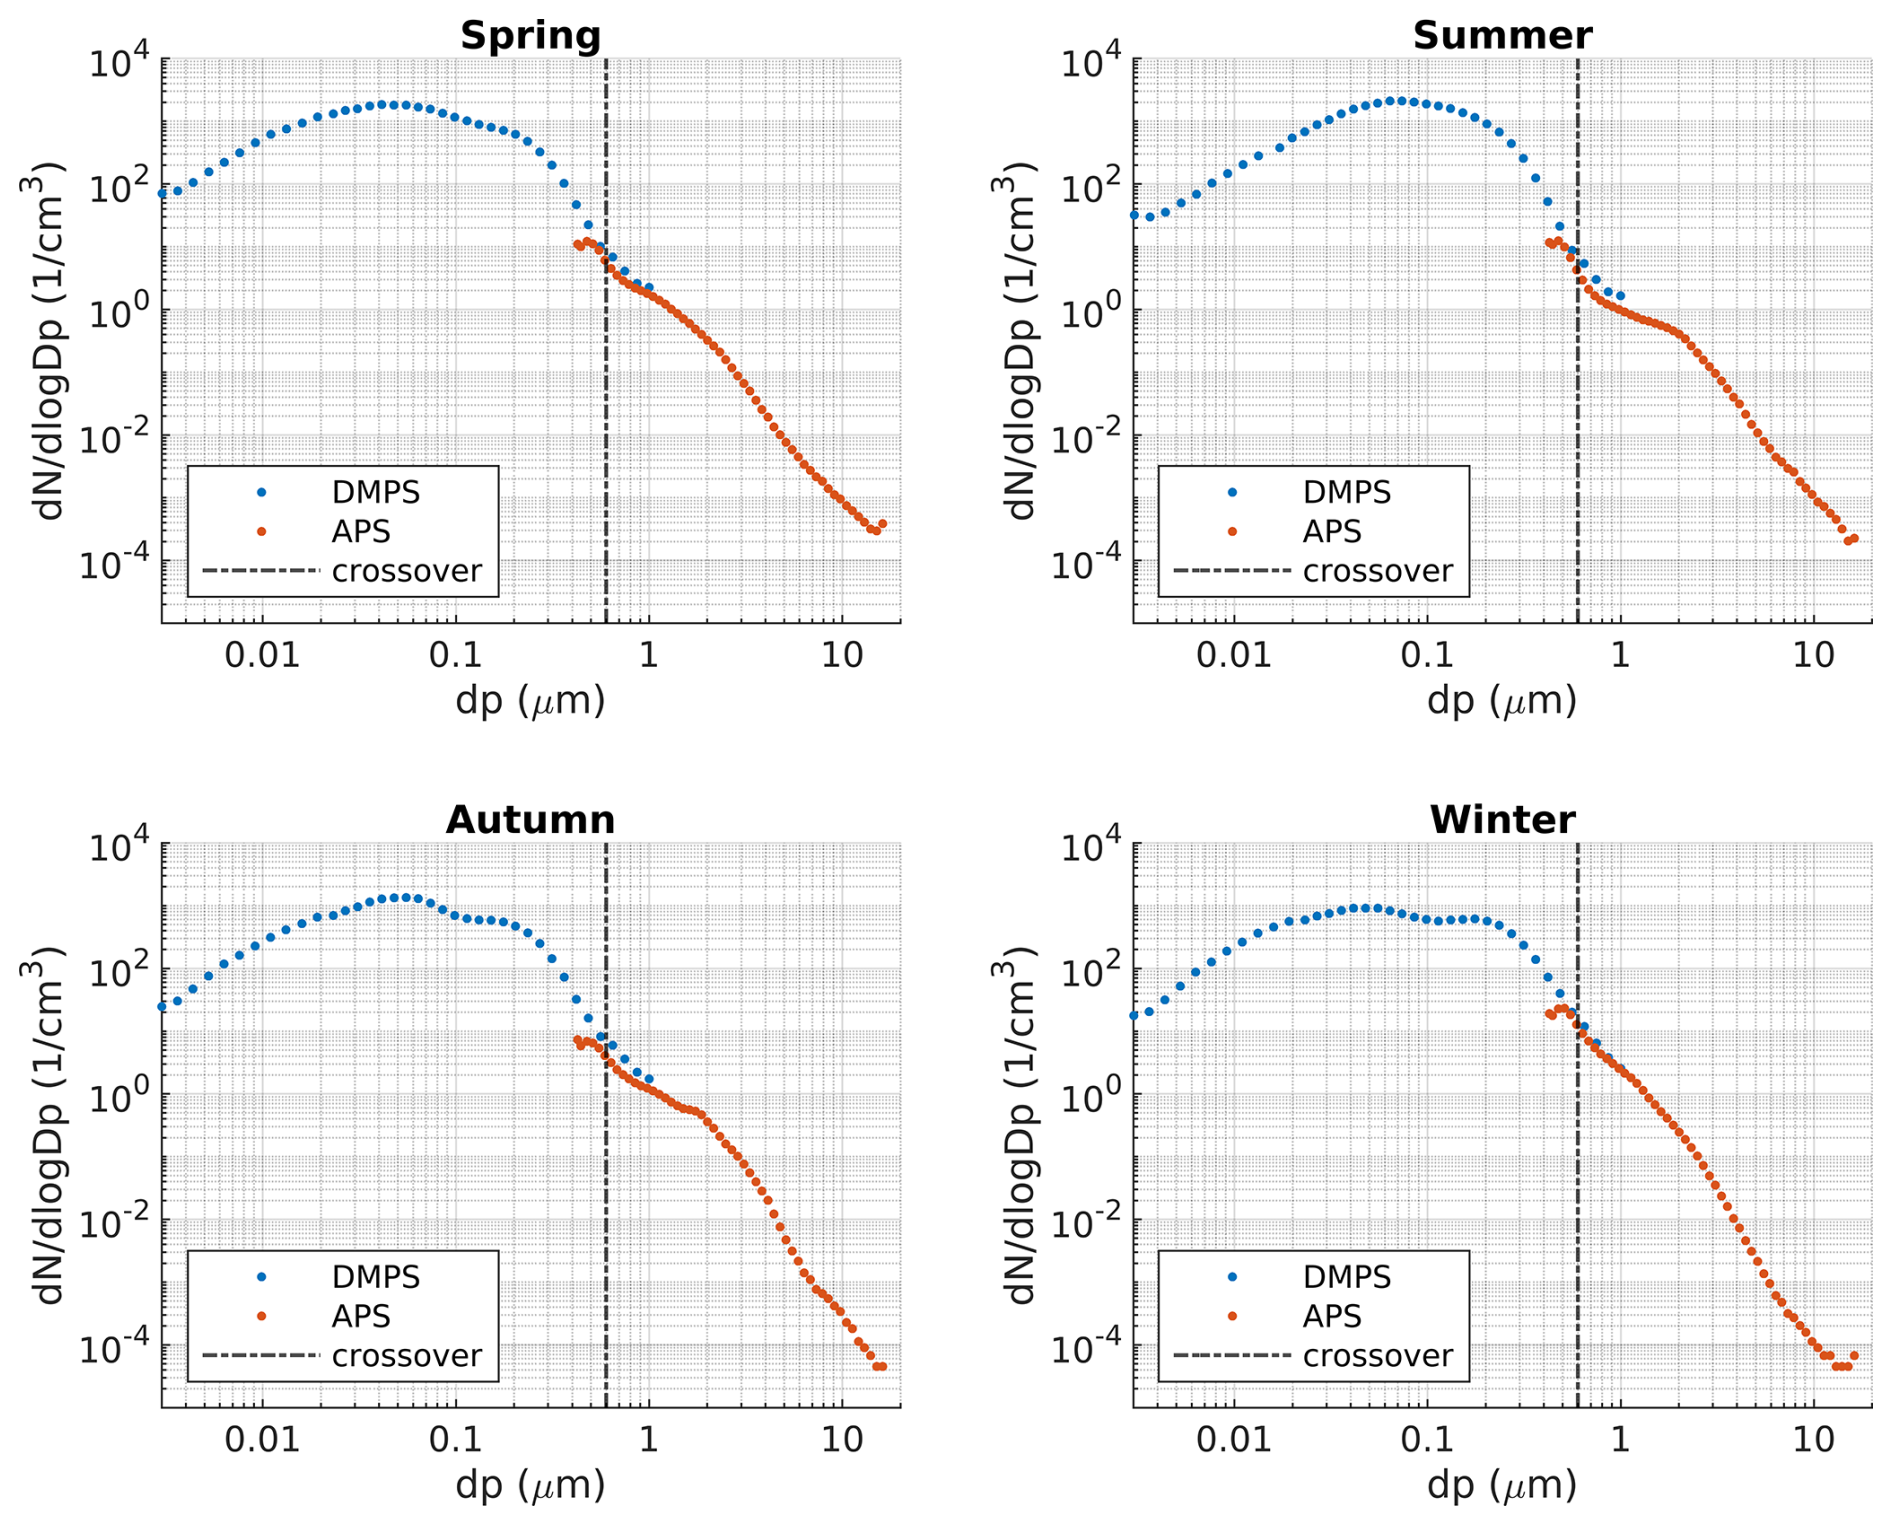
Figure 2Seasonal median number size distributions for 2005–2020 at SMEAR II, measured with a combination of DMPS and APS with a constant density assumption. The dash-dotted line indicates the crossover size between the instrument data to determine integrated mass concentrations.
At SMEAR II, the DMPS measures the aerosol number size distribution in the electrical mobility equivalent diameter range of 3–1000 nm (Aalto et al., 2001). The APS (TSI 3320) measures the aerodynamic particle size distribution of particles with an aerodynamic diameter in the range of 0.5–20 µm (Peters et al., 2006). To have comparable particle size distributions, we converted the aerodynamic diameter (da) of the APS to a mobility equivalent diameter (dm):
where ρp is the density of the particle and ρ0 is the unit density of the particle (1 g cm−3). The density of the particles is assumed to be 1.5 g cm−3 (Saarikoski et al., 2005; Kannosto et al., 2008), but we additionally calculated the mass concentrations using 1.1 and 2.0 g cm−3 densities, which are the minimum and maximum densities of accumulation-mode-sized particles at SMEAR II (Kannosto et al. 2008), in order to understand the importance of constant density assumption to the particle mass. The mass of the particles measured with DMPS+APS is calculated as
The mass concentrations (PM1, PM2.5, and PM10) were then calculated by integrating over the corresponding size range:
In practice, we utilized DMPS data from 0.003 to 0.6 µm and the APS size distribution from 0.6 to 1, 2.5, or 10 µm, depending on the mass fraction in question. Typical size distributions for different seasons are presented in Fig. 2.
2.5 Ancillary data
SO2 and NOx were measured at 16.8 m height above ground level at SMEAR II with gas analyzers from Thermo Fisher Scientific Inc., USA. SO2 was measured with a pulsed fluorescence technique, using model TEI 43CTL until September 2010 and model TEI 43i-TLE after that. The NOx concentration was measured with TEI 42CTL (a molybdenum converter) until February 2007, with TEI 42CTL (a photolytic converter) until April 2011 and after that with TEI 42iTL (a photolytic converter).
The monoterpene concentration was measured with a quadrupole proton-transfer-reaction mass spectrometer (PTR-MS; Ionicon, Austria). We used a concentration measured at 16.8 m height. The measurement setup is described in Taipale et al. (2008) and Rantala et al. (2014).
The equivalent black carbon (eBC) concentration was derived by filter-based optical instruments: an aethalometer (Magee Scientific, model AE31) in years 2006–2017 and a multi-angle absorption photometer (MAAP; Thermo Fisher Scientific, model 5012) in years 2013–2020. The correction procedure for the AE31 data at SMEAR II as well as the measurement setup of AE31 and MAAP are described in detail in Luoma et al. (2021). The AE31 data were corrected using a correction algorithm described in Virkkula et al. (2007) and using a multiple scattering correction factor of 3.14, which was derived by comparing the AE31 to MAAP. To derive the eBC concentration from the measured absorption coefficient, the mass absorption cross-section values of 6.6 and 4.78 m2 g−1 were used for MAAP at wavelength 637 nm and AE31 at wavelength 880 nm, respectively.
Air mass origins were calculated using the Hybrid Single-Particle Lagrangian Integrated Trajectory model (HYSPLIT; Stein et al., 2015). The arrival height of the trajectories was 100 m, and they were calculated 96 h backwards in a 1 h resolution. The trajectories were divided into three sectors, as described in Räty et al. (2023). The clean sector (Fig. S5e in the Supplement) represents an area with a minor anthropogenic contribution, while the European and eastern sectors represent more pollutant air mass source areas (Niemi et al., 2009; Riuttanen et al., 2013). The trajectory was classified into a certain sector when it spent at least 90 % of the time in that sector, otherwise it was classified as mixed.
2.6 Correlations, bivariate fitting, and long-term trend estimation
The Pearson's correlation coefficients between the mass concentrations from different instruments were calculated in Matlab, along with bivariate fitting (Cantrell, 2008). Before the analysis, we removed clear outliers that were further than 6 scaled median absolute deviations (MAD) away from the median using the Matlab built-in function isoutlier. The procedure was done for the whole dataset at once, i.e., without taking into account, for instance, seasonal dynamics, but separately for each instrument and PM size. The limit was determined using visual inspection. About 1.5 % of the data was removed. When comparing DMPS+APS and SHARP with the impactor data, we calculated 2–3 d cumulative aerosol mass concentration to make DMPS+APS and SHARP measurements comparable to the impactor data time resolution.
The statistical significance of long-term trends in linear scale were calculated using the mannkendall function for Matlab (v1.1.0, https://doi.org/10.5281/zenodo.4495589; Collaud Coen and Vogt, 2021). We applied the seasonal 3PW method, which utilizes three pre-whitening methods for the trend estimation (Hirsch et al., 1982). The pre-whitening methods by Kulkarni and von Stroch (1995) and Yue et al. (2002) remove lag-1 autocorrelation and autocorrelation on detrended data, enabling us to determine the statistical significance of the Mann–Kendall test reliably; of these, the one with the higher value is reported. The variance-corrected trend-free pre-whitening method by Wang et al. (2015) is used for the calculation of Sen's slope, which leads to a more accurate trend analysis (Collaud Coen et al., 2020).
3.1 Comparison between the mass measurement methods
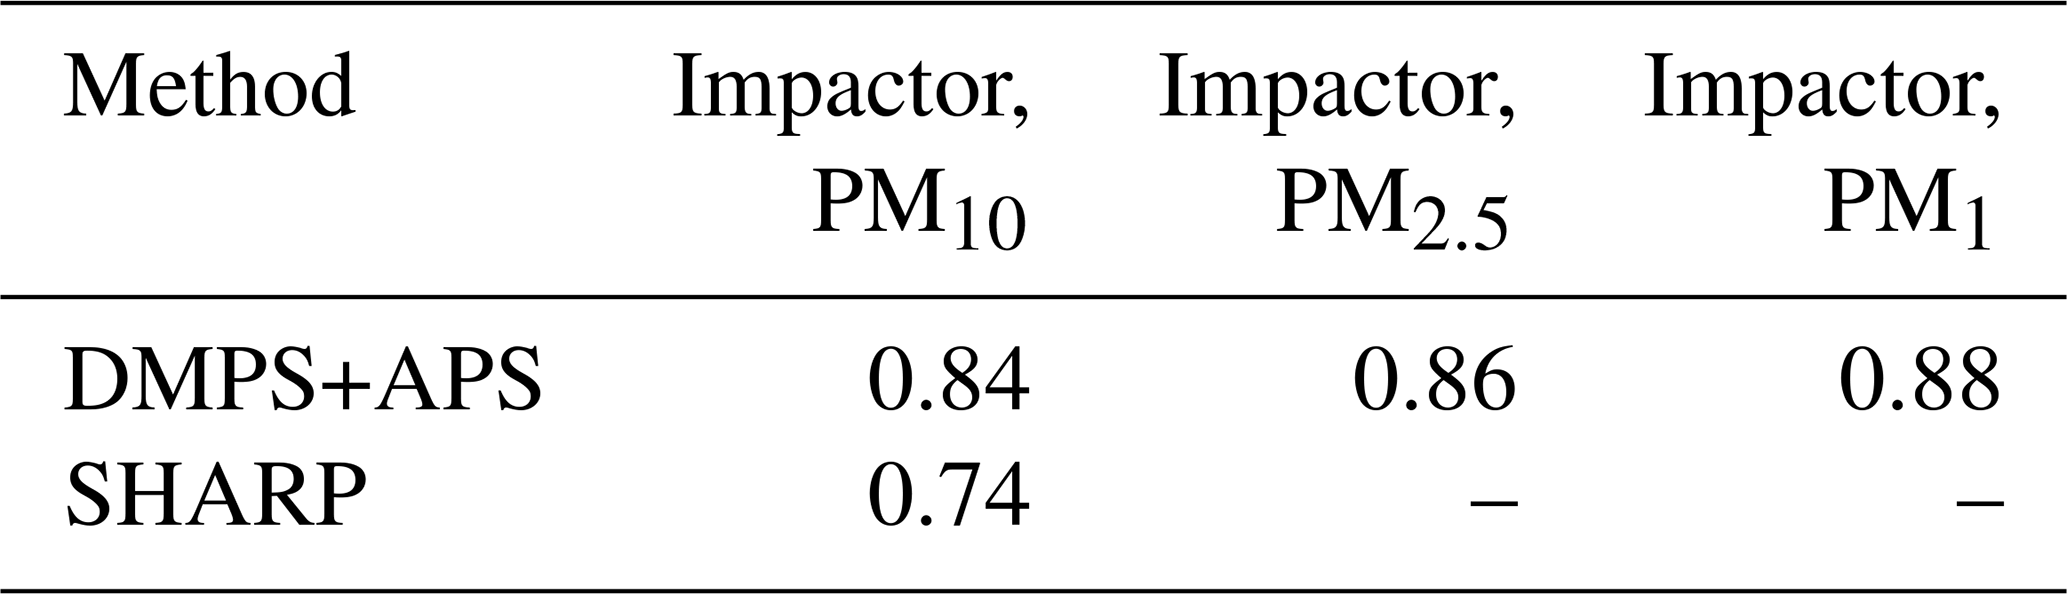
Here, we present the comparison between the different aerosol mass measurement techniques at SMEAR II (Figs. 3 and S1a). We found that the data from the different mass measurement techniques correlate well, with the correlation coefficients R > 0.8 for all the measurements except between SHARP and the impactor, for which R = 0.74 (Table 1). Thereby, the correlation was lower between the two direct mass measurements, SHARP and impactor, than between DMPS+APS-derived and the impactor or SHARP measurements, even though with the DMPS+APS method we had to assume constant density and the spherical shape of the particles in the mass concentration calculations. In reality, the particle composition, density, and shape vary between different particles (Kannosto et al., 2008; Heikkinen et al., 2020), which could potentially lead to the higher uncertainty in the indirect DMPS+APS mass calculations.
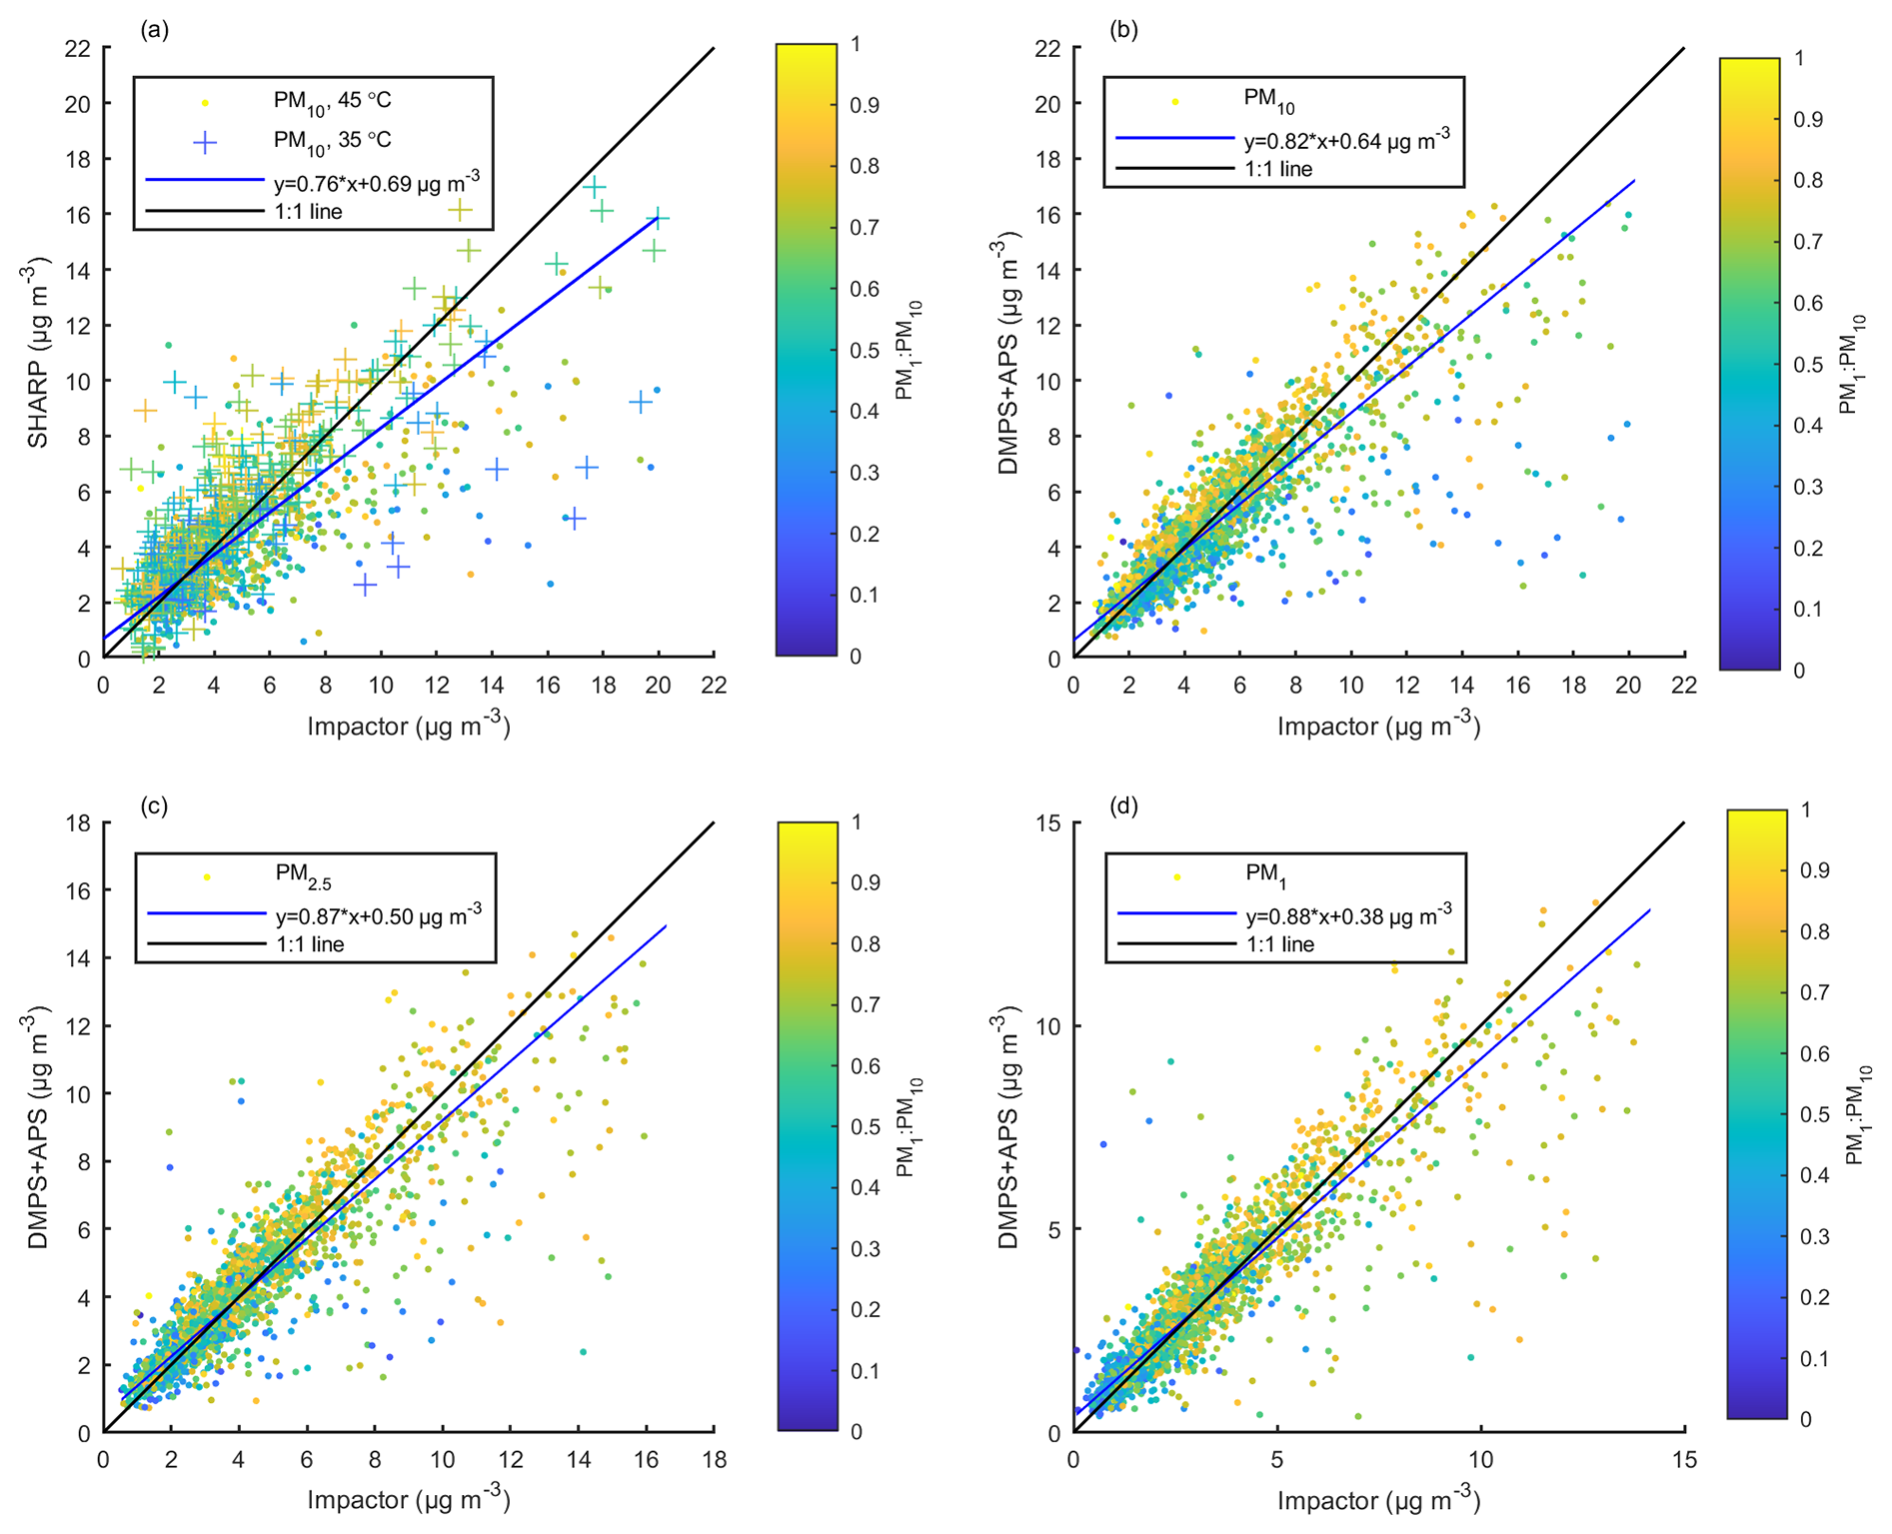
Figure 3Correlation between the different mass measuring methods against impactor measurements (a) PM10 from SHARP, (b) PM10 from DMPS+APS, (c) PM2.5 from DMPS+APS, and (d) PM1 from DMPS+APS. Bivariate fit to the data is represented with a blue line, and the 1 : 1 line is black. The color is the PM1 to PM10 ratio from impactor measurements, and in (a) markers differentiate the inlet heating temperature of SHARP (circle = 45 °C and plus sign = 35 °C). The data are averaged based on the impactor time resolution (2–3 d).
Table 1Correlation coefficients between different PM measurement techniques. Correlation coefficient between SHARP and DMPS+APS in PM10 was 0.84. In all cases, the p value ≪ 0.05.
To estimate the impact of selected density in the DMPS+APS method, we calculated the average mass concentrations using 1.1 and 2.0 g cm−3 as the lower and upper estimates of the particle densities (Kannosto et al., 2008). The average PM mass concentrations for 2005–2020 are presented in Table S1. The average mass concentrations calculated with 1.1 g cm−3 particle density were 7 %–12 % smaller compared to the mass obtained with 1.5 g cm−3 density for PM10, 12 %–20 % for PM2.5, and 20 %–25 % for PM1. Correspondingly, with 2.0 g cm−3 particle density, the calculated mass concentrations were 14 %–17 % larger for PM10, 19 %–27 % for PM2.5, and 29 %–30 % for PM1.
Comparing Figs. 3 and S1a, it seems that the data points between SHARP and DMPS+APS are positioned more distinctly on the 1 : 1 line, whereas the impactor data are scattered more towards higher concentrations in all size classes. After the inlet heating temperature reduction in SHARP from 45 to 35 °C, the PM10 values measured by SHARP were more comparable to those measured by the impactor, except for the lowest and highest PM10 concentrations (Fig. S2a–b). When comparing to DMPS+APS data (Fig. S2c–d), SHARP also showed slightly lower PM10 concentrations when the inlet was heated to 45 °C and mostly similar concentrations (within the standard deviation) when the inlet was heated to 35 °C. Again, with the lowest concentrations, SHARP showed higher variability in the measured PM10 concentrations. When excluding the lowest mass concentrations (approximately below 1.5 µg m−3), with the 45 °C inlet heating, the SHARP to impactor ratio was 0.65 and the SHARP to DMPS+APS ratio was 0.85. With 35 °C inlet heating, the ratios were 0.91 and 1.0, respectively. This indicates that the higher inlet heating temperature might have led to 15 %–25 % losses of semi-volatile compounds from the sample air of SHARP.
The color in Figs. 3 and S1a is the PM1 to PM10 ratio from impactor measurements. In general, the correlations between instruments were rather independent of the fractions of different particle sizes, but in the PM10 correlation with the impactor (Fig. 3a–b), the scattered data points have a lower PM1 to PM10 ratio. This implies that the impactor PM10 measurements were likely overestimated in these cases since in PM1 and PM2.5, as well as in the DMPS+APS correlation with SHARP, the PM1 to PM10 ratio from impactor data seems to be more evenly distributed (Figs. 3c–d and S1a). Additionally, we plotted the correlation between the monthly median concentration of PM1 and PM2.5 as well as PM2.5 and PM10 from the DMPS+APS and impactor measurements (Fig. S1b). The figure shows that while the data from DMPS+APS are rather well aligned with the 1 : 1 line, the PM10 against PM2.5 from the impactor data has more scattered data points, further implying that the impactor data might be overestimated.
In Waldén et al. (2010), different PM analyzers were tested for air quality monitoring in Helsinki. They reported that the two tested SHARP instruments passed the equivalence tests for PM10 monitoring, while for the PM2.5 measurements, a calibration correction factor had to be applied. In their instruments, inlet lines were heated to 35 °C. They also reported that while the Dekati PM10 impactor was an overall indicative measurement method for PM2.5 (other sizes were not measured), it overestimated the concentrations compared to the reference methods. For the impactor, they used a 24 h sampling period with a 30 L min−1 flow rate.
The measurement methods used in this study differ considerably from each other, and hence, they are subject to different kinds of issues in PM monitoring. The impactor data, for example, are sensitive to any disturbances related to the weighing of the filters or the evaporation of semi-volatile material from the filters during the long sampling time. The impactor is, however, the only purely weighing-based mass measurement at SMEAR II. Thus, in the next section, we compare all the other methods against the impactor data.
3.2 PM concentrations, seasonal variation, and emission events
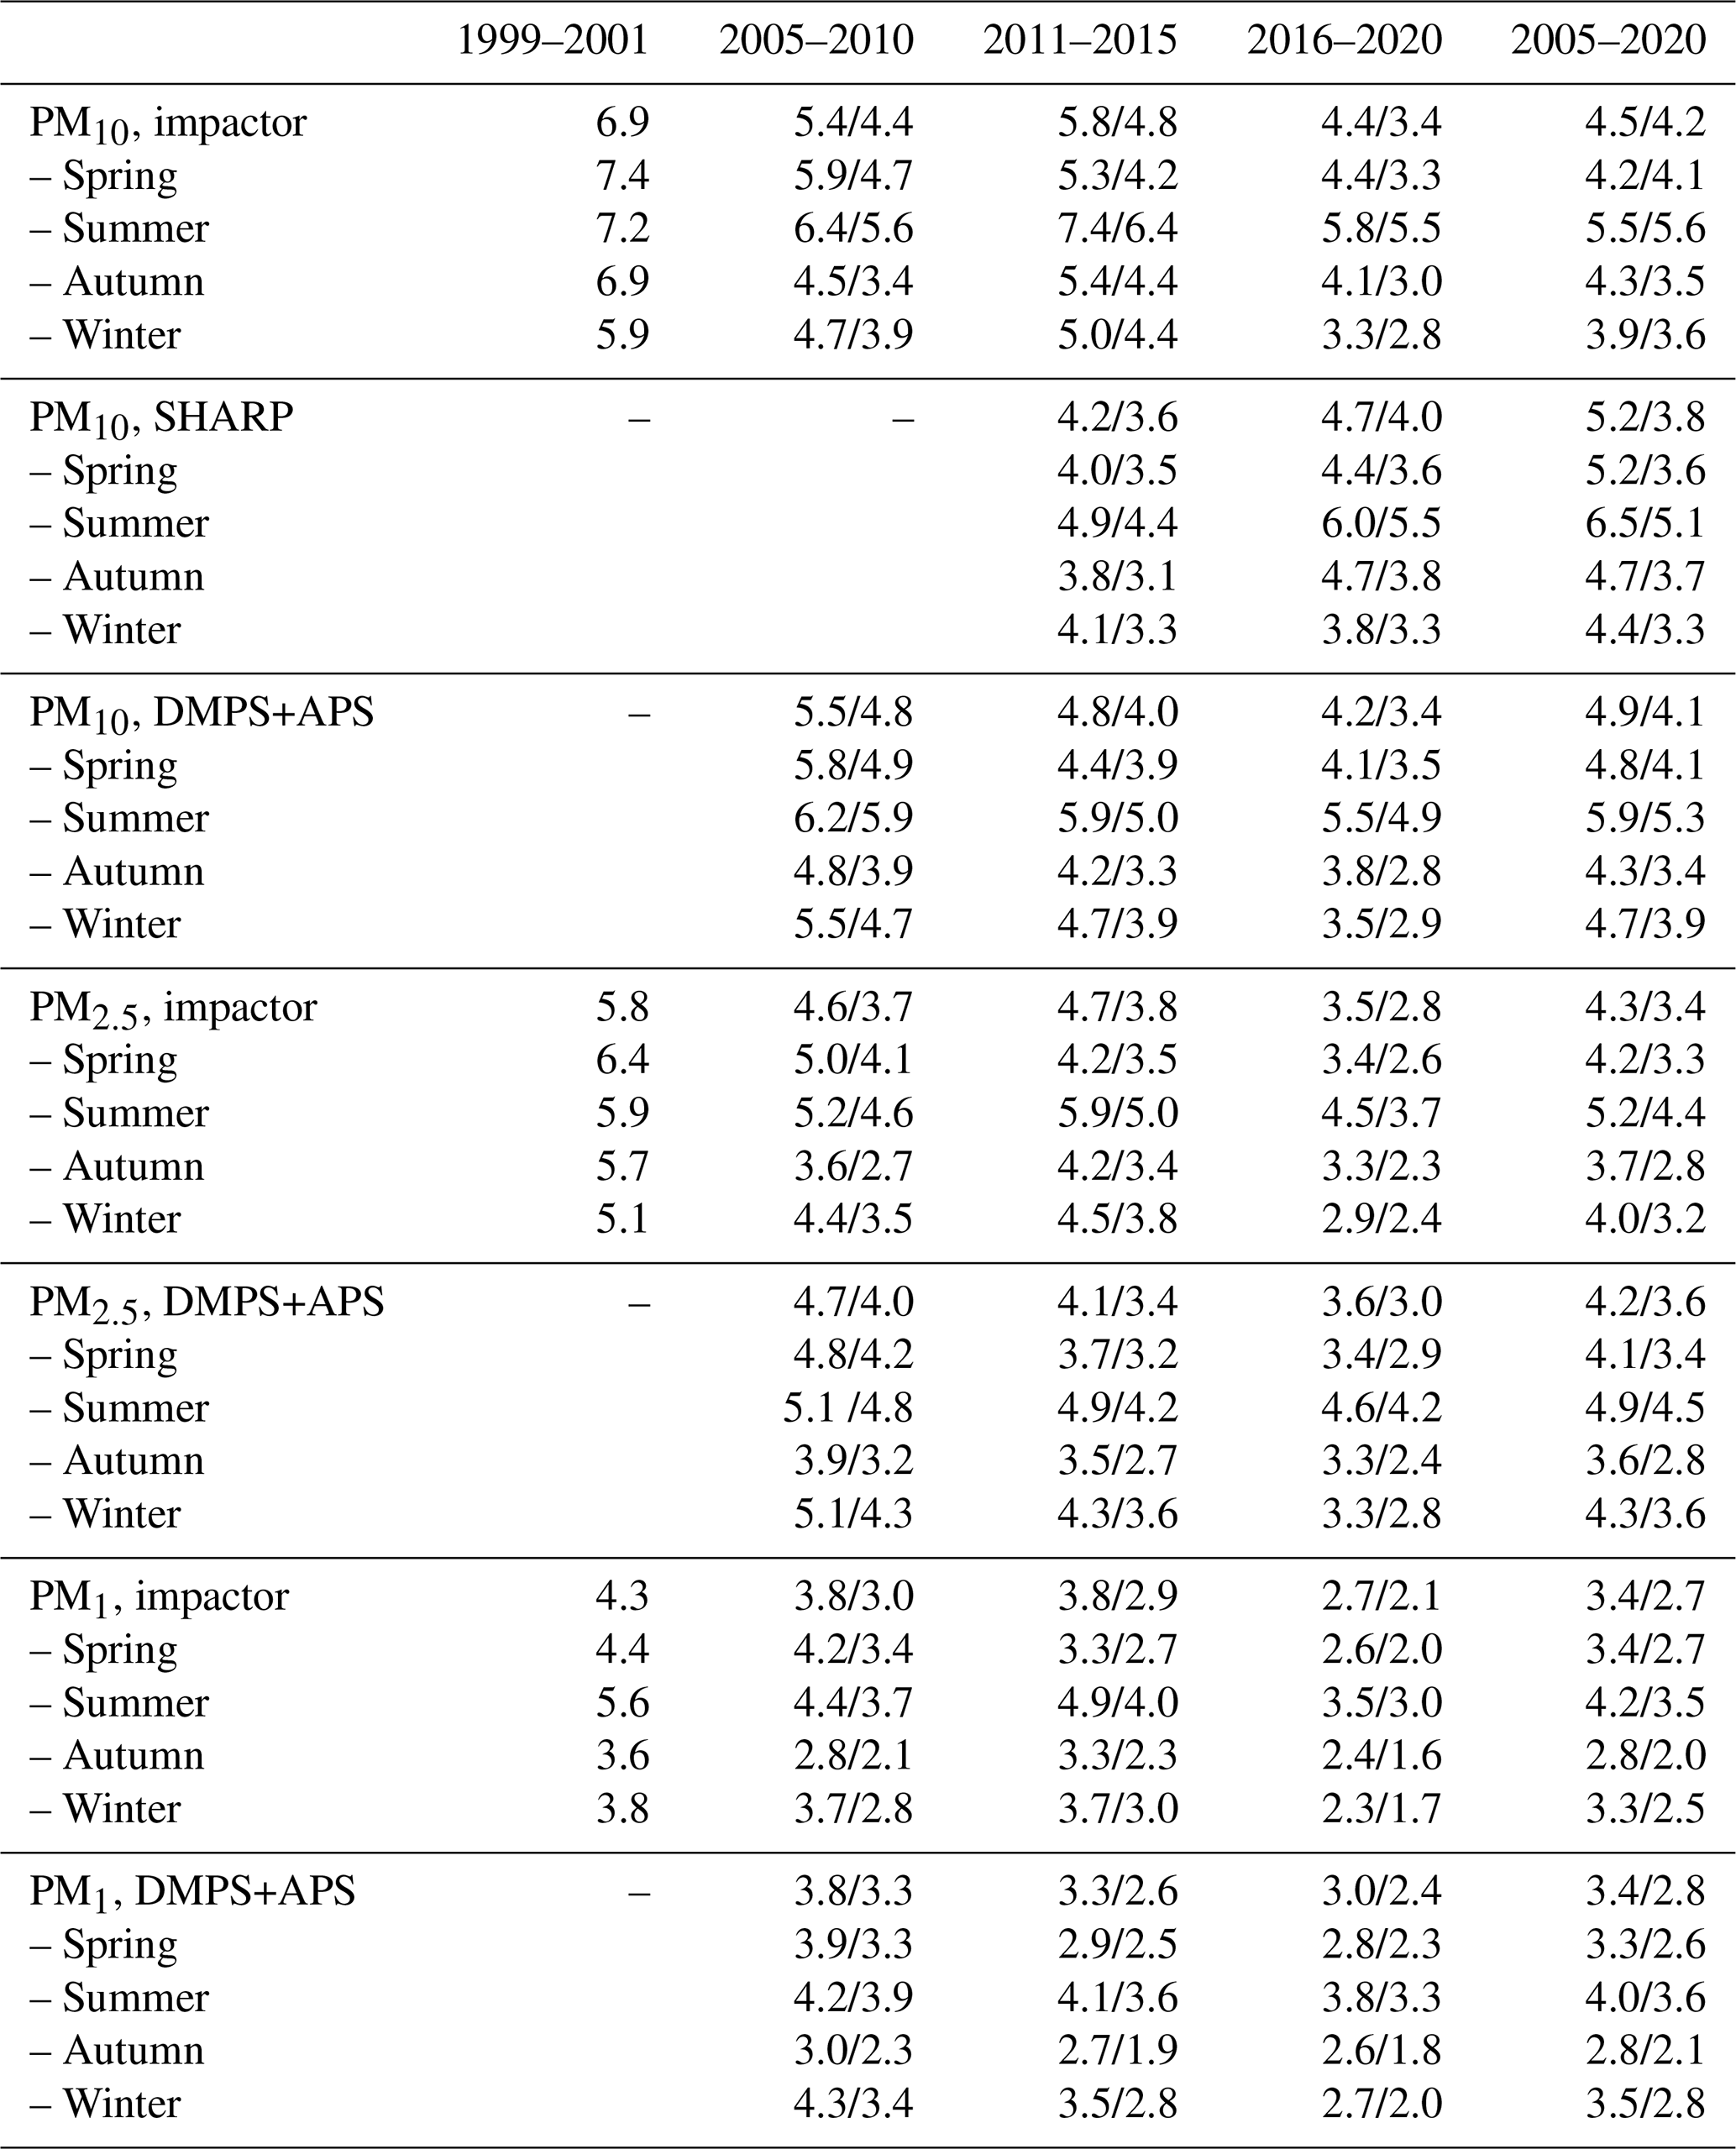
We explore the time series of PM concentrations to observe overall concentration levels, seasonal differences, and specific emission events (Figs. 4 and S2). Mean values from 1991–2002, reported by Laakso et al. (2003), are also included in the figures to compare the results with the earlier values from SMEAR II. To enable the comparison with the values by Laakso et al. (2003), we present mean and median concentrations of shorter, approximately 5-year periods (2005–2010, 2011–2015, and 2016–2020) in Table 2.
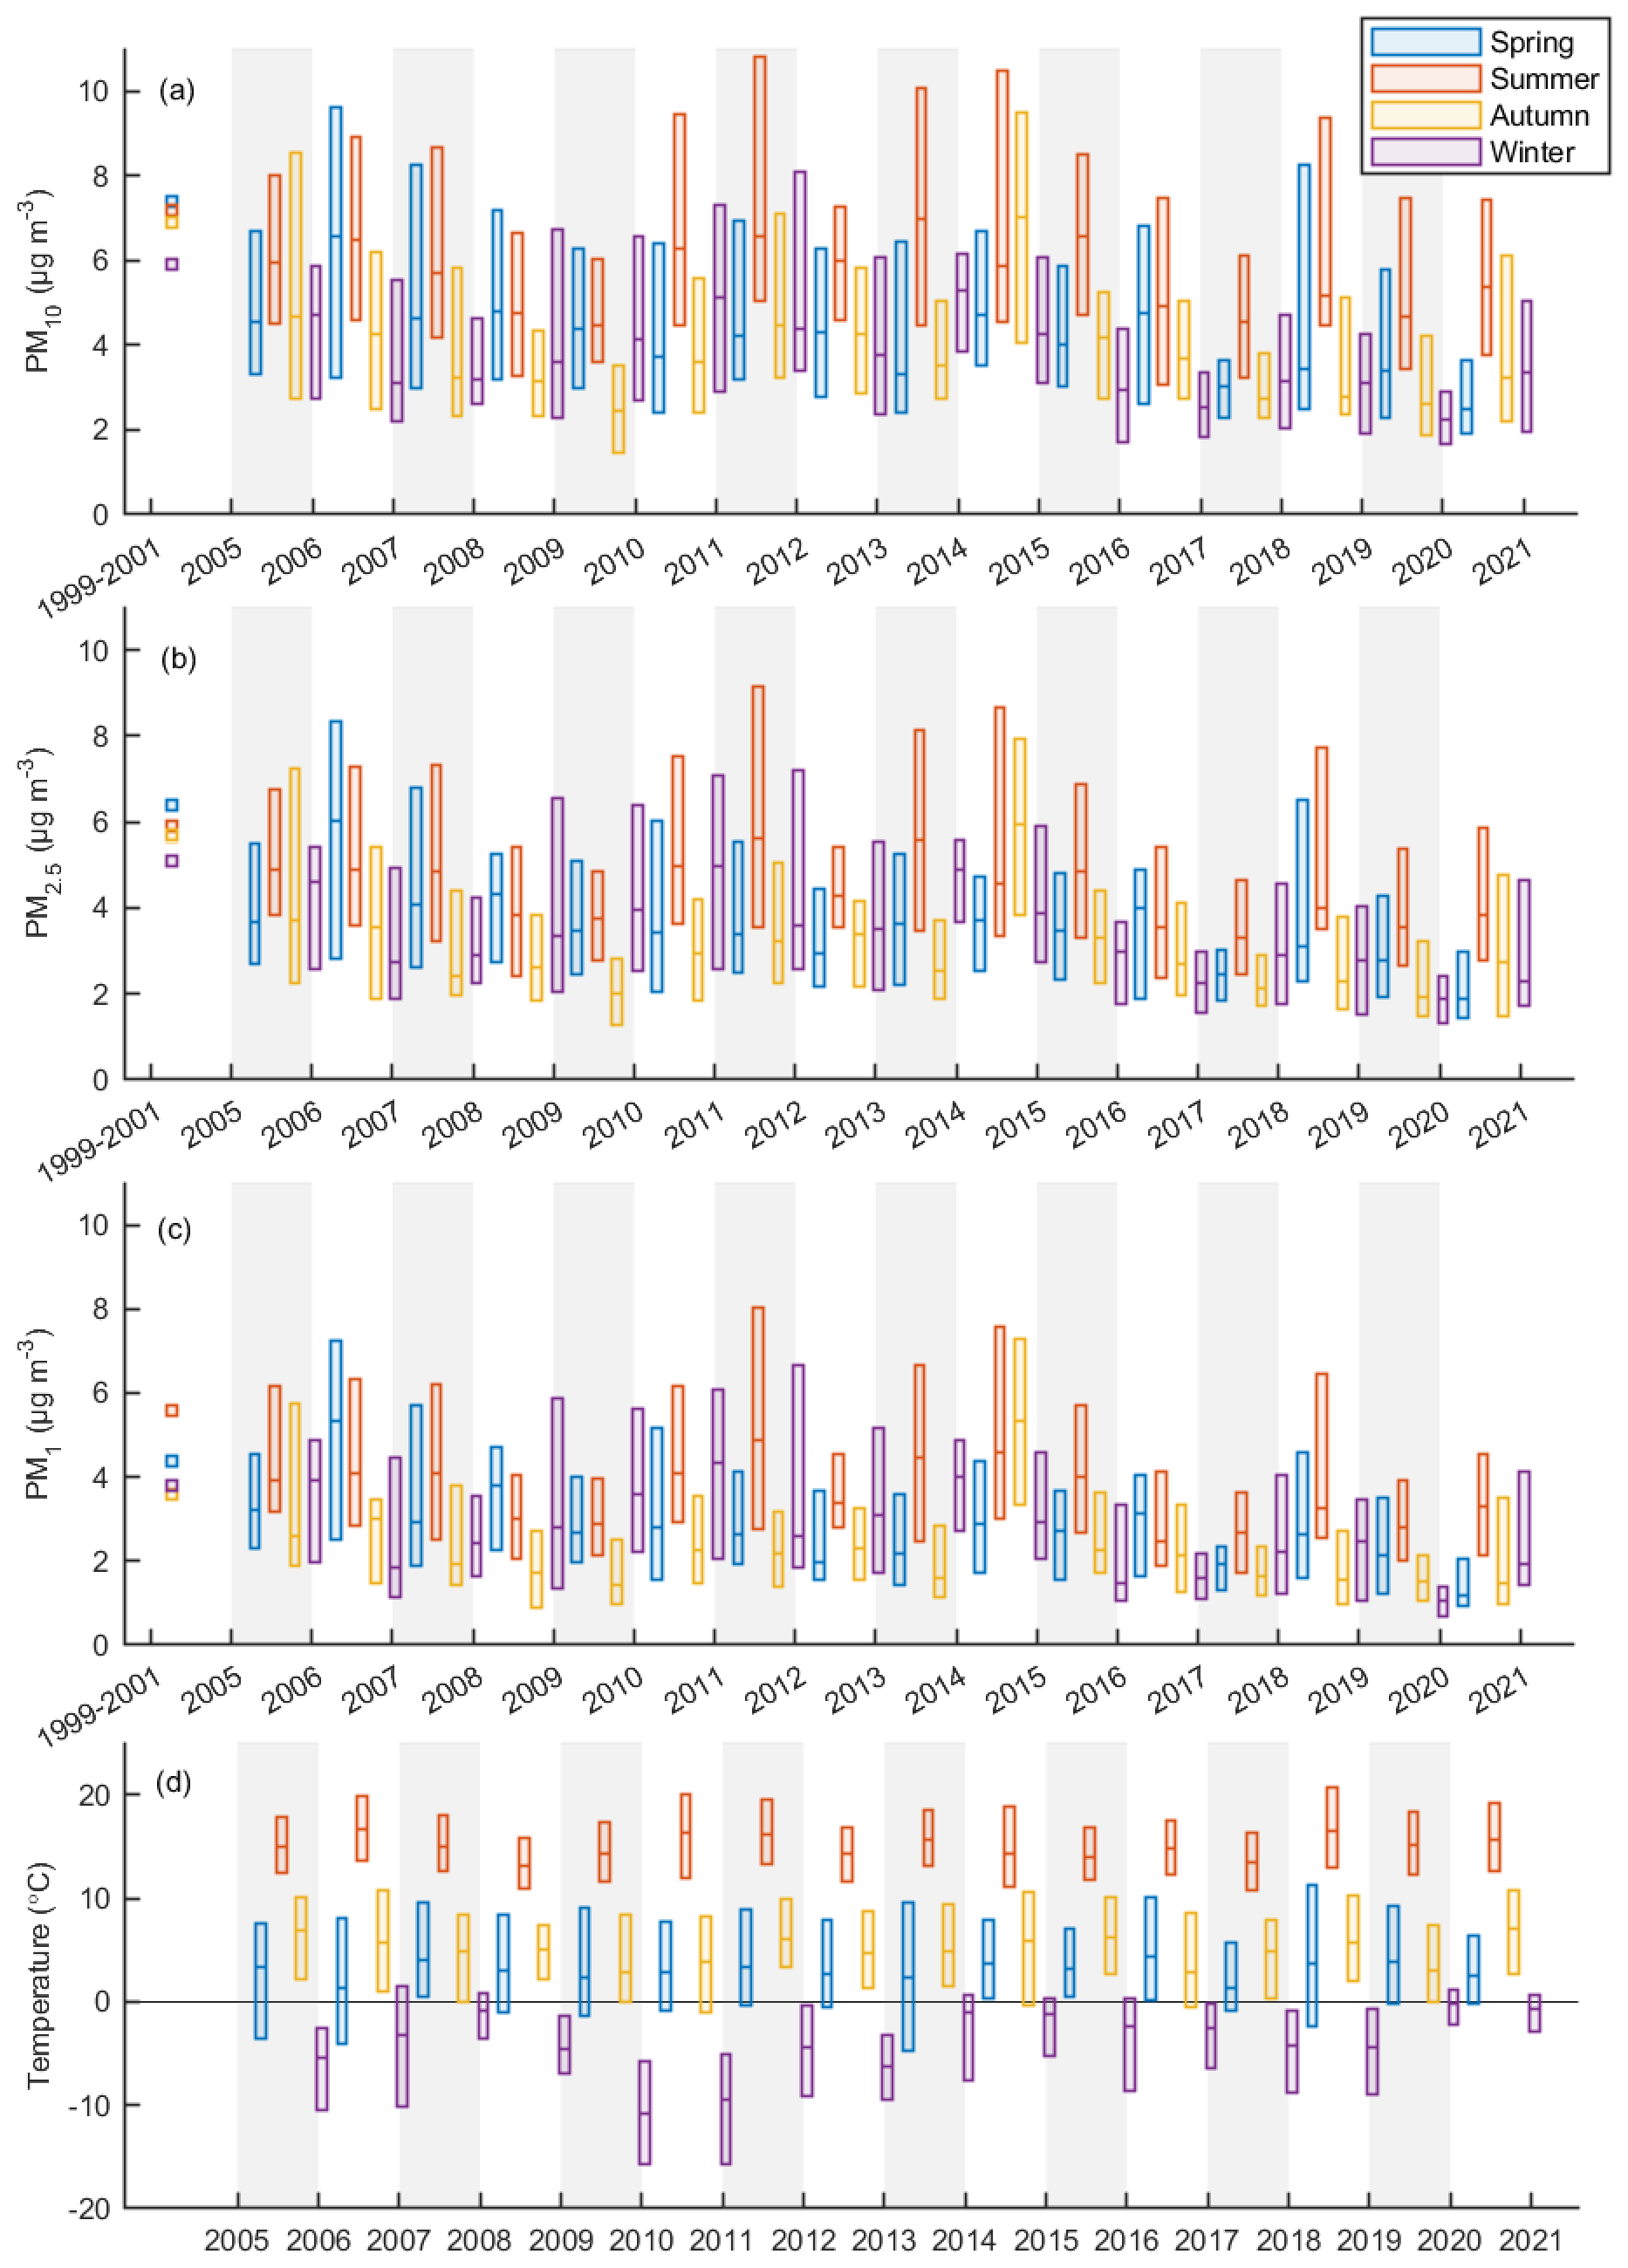
Figure 4Seasonal median (a) PM10, (b) PM2.5, and (c) PM1 concentrations measured with the impactor as well as (d) temperature and the 25 and 75 quartile ranges at SMEAR II. The tick marks on the x axis are in the beginning of a year. Mean values for 1991–2002 are from Laakso et al. (2003).
Table 2Average (mean/median) PM concentrations measured at SMEAR II. Values (mean) for 1999–2001 are from Laakso et al. (2003) and other values from this work. The first number in each cell is the mean for the indicated period, and the following numbers are the seasonal means. The unit is µg m−3.
The PM concentrations in all size classes are typically highest in summer and lowest in autumn (Table 2). In summertime, the surrounding boreal forest is a large source of organic compounds (Fig. S4c), which contribute to the aerosol load as shown already in several studies (e.g., Heikkinen et al., 2020, 2021; Yli-Juuti et al., 2021). Due to the temperature-dependent activity of the forest, warm spells and heat waves increase the VOC emissions, such as in 2018 (Fig. S4c; Neefjes et al., 2022), which is also evident in the PM data in all size classes (Fig. 4). Furthermore, pollen and other biological particles contribute especially to coarse-mode particle mass at SMEAR II from late spring to early autumn (Manninen et al., 2014).
Although PM mass concentrations are generally decreasing (Fig. 4), certain events associated with higher PM levels, such as wildfires and volcanic eruptions, can be detected. In 2006 springtime, as well as in 2006 and 2010 summer, forest fires in eastern Europe increased the measured PM concentrations at SMEAR II (Fig. 4), as seen also in Anttila et al. (2008) and Leino et al. (2014). The growing seasons of 2006 and 2011 were exceptionally warm at SMEAR II, based on the analysis spanning the years 1996–2017 (Pysarenko et al., 2022), which is also visible in PM concentrations (Fig. 4). However, the relatively high PM concentrations in spring 2010 and 2011 can also be caused by the plume of ash and SO2 from the erupted Eyjafjallajökull (Thomas and Prata, 2011; Gudmundsson et al., 2012; Petäjä et al., 2012; Flanner et al., 2014) and Grímsvötn (Cooke et al., 2011; Tesche et al., 2012) volcanoes in Iceland. The considerably higher PM concentrations in autumn 2014 were affected by the eruptions of the Bardarbunga (Gislason et al., 2015) and Holuhraun (Ilyinskaya et al., 2017) volcanoes in Iceland, which Heikkinen et al. (2020) also noticed in the sulfate aerosol and SO2 concentrations.
During the coldest winters in 2009–2010 and 2010–2011, the measured PM concentrations were high (Figs. 4 and S2). These years were also associated with high concentrations of SO2, NOx, and eBC (Fig. S4). Residential heating is known to be a source of particulate emissions as wood is burned for heating (Spindler et al., 2004; Viana et al., 2008; Barmpadimos et al., 2011). However, the coldest winter temperatures are typically measured in Finland when air is transported from the eastern continental areas (Sui et al., 2020). These, and particularly southeastern, areas are also a source of atmospheric pollutants (Niemi et al., 2009; Riuttanen et al., 2013). Hence, rather than being local, pollutants can also be advected to Finland. An analysis of the air mass source area shows that winters with a higher fraction of easterly air masses (Fig. S5) were colder and had also had higher PM levels, although we acknowledge that this analysis does not reveal the actual source of the measured PM. Further, boundary layer height dynamics affect the measured concentrations, because shallow boundary layer heights during cold winter days can concentrate the anthropogenic pollutants close to the surface (Stull, 1988; Sinclair et al., 2022).
Overall, the air quality at SMEAR II was very good during our measurement period from 2005 to 2020. The average concentrations measured by the impactor were 4.5, 4.3, and 3.4 µg m−3 for PM10, PM2.5, and PM1, respectively, which is in line with the PM2.5 concentrations measured in 2002 and 2010 at background stations in Sweden and Norway (average PM2.5 ranging from 4.3 to 9.9 µg m−3 (Cusack et al., 2012)) and generally lower than at other background stations in Europe (average PM2.5 ranging from 5.5 to 26.2 µg m−3 (Cusack et al., 2012)).
3.3 Long-term trends
The measured PM concentrations show a declining trend during the measurement period from 2005 to 2020 (Fig. 4). Compared to the values reported by Laakso et al. (2003), for 1999–2001 (6.9, 5.8, and 4.3 µg m−3 for PM10, PM2.5, and PM1, respectively), the values in 2016–2020 are almost 40 % lower in all size classes (Table 2).
While the overall PM concentrations are decreasing, the different mass measurement methods gave slightly inconsistent results: the DMPS+APS method shows a constant decline in PM concentrations, whereas the impactor data show a slight increase in all PM sizes for the 2011–2015 period for all seasons but spring (Table 2). The clearest difference between the impactor and DMPS+APS data seems to be the steadier decline in autumn concentrations in DMPS+APS data (Figs. 4 and S2b–c). Hence, despite the discrepancies, the methods give generally comparable results.
The SHARP data show an increased PM10 concentration from 2011–2015 to 2016–2020 for all other seasons except for winter, but this is likely explained by the decreased inlet heating temperature, which changed between the two periods (Fig. S3). Hence, no further conclusions of the trend in the SHARP data can be drawn, even though generally the concentrations measured by SHARP follow the concentrations measured by the DMPS+APS method (Fig. S2a–b).
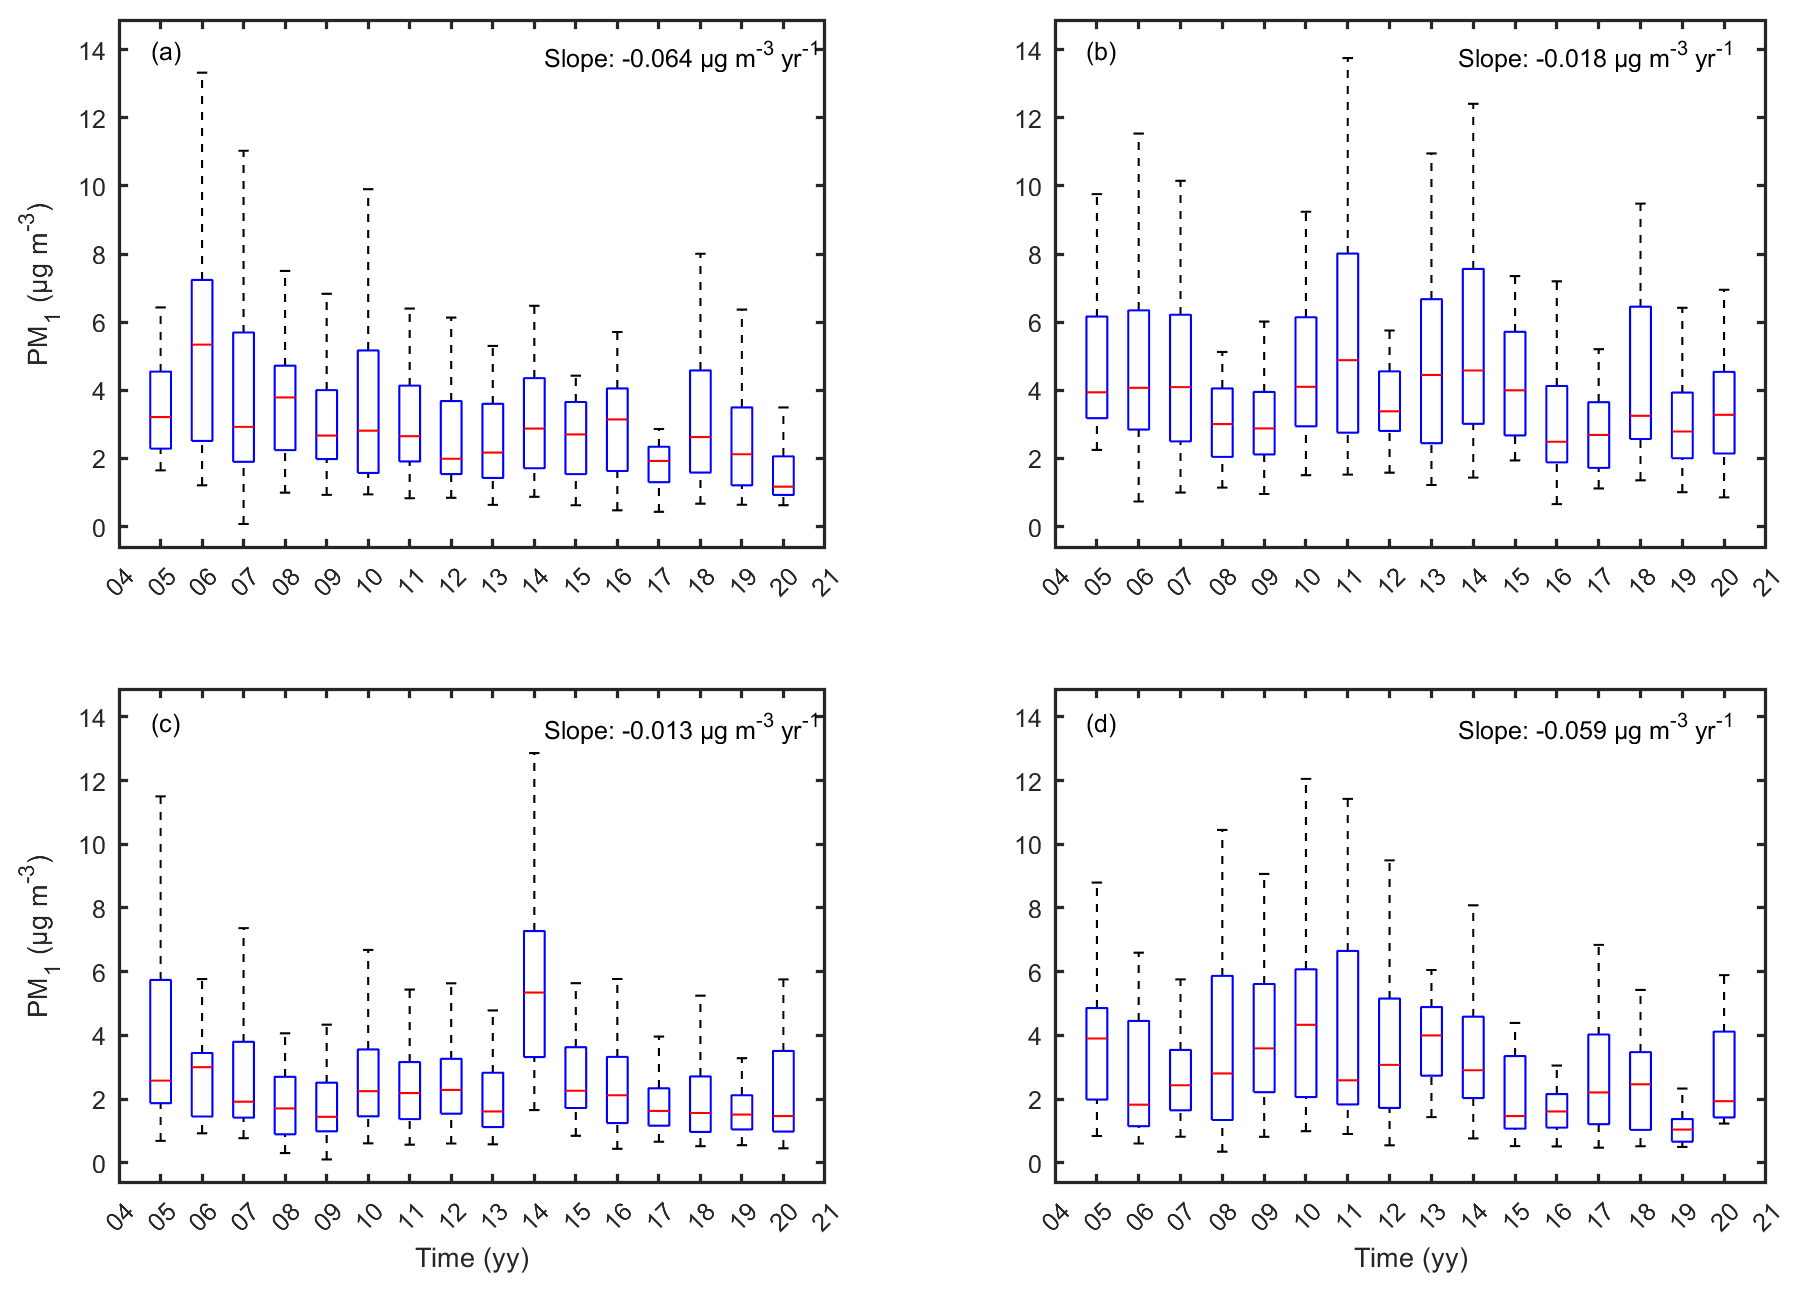
Figure 5PM1 concentration with the impactor method in (a) spring, (b) summer, (c) autumn, and (d) winter. The horizontal red line represents the median, the distance between the box edges shows the interquartile range, and whiskers extend to 1.5 times the interquartile range. Outliers are not shown. The slope represents the trend calculated using Sen's slope, and the statistical significance is calculated using the Mann–Kendall test. The trends were statistically significant in spring and winter but not in summer and autumn.
Table 3Annual and seasonal trends in 2005–2020 PM concentrations at SMEAR II. Results from the DMPS+APS method are calculated from 6 h averages, while impactor data have an original time resolution (averaged over 2–3 d). Results, which are not statistically significant at the 95 % level, are marked with ∗. The unit is µg m−3 yr−1, except the second number in annual trends, which is % yr−1.
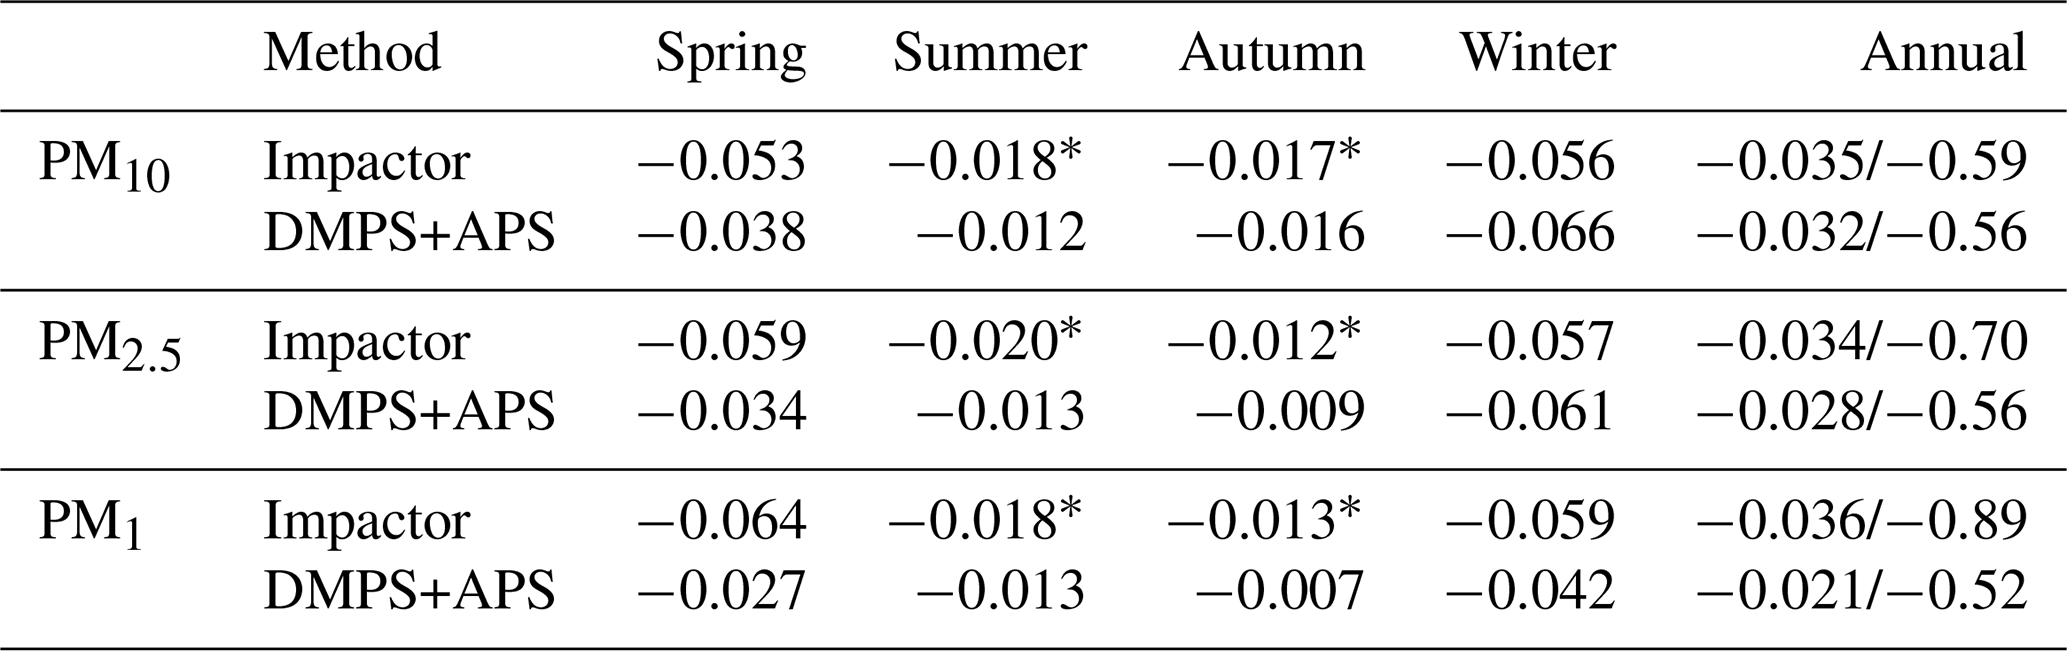
Long-term trends are shown seasonally for each size class of PM10, PM2.5, and PM1 using the impactor (Figs. 5, S6, and S7) and DMPS+APS data (Figs. S8–S10). Calculated seasonal and annual trends are presented in Table 3. On a seasonal scale, decreasing trends, ranging from −0.007 to −0.066 µg m−3 yr−1, are observed in each measured size class, while on an annual scale, the trends vary between −0.021 and −0.036 µg m−3 yr−1. In general, the largest decreases in all size classes are observed in winter, whereas the decrease is the lowest in autumn. For the impactor method, the decline is statistically significant at a 95 % level in spring and winter but not in summer and autumn. However, when calculating the trends from DMPS+APS data using 6 h averages, the Mann–Kendall test revealed a statistically significant decrease in all size classes and seasons (Figs. S8–S10).
The seasonal differences in PM trends follow the trends also observed in SO2 and NOx concentrations (Figs. S11 and S12), as well as in eBC (Fig. S4d–e). Further, Luoma et al. (2019) showed that the relative decline of light-absorbing aerosol is faster than the light-scattering aerosol at SMEAR II and that the decline was strongest in spring and winter. Hence, the results imply that the decrease in anthropogenic pollutants drive the decrease in PM, which has also been seen elsewhere (e.g., Yttri et al., 2021). On the other hand, the lower summer and autumn time decline can also be explained by the high fraction (more than 50 %) of OA from the surrounding boreal forest in the PM mass concentration at SMEAR II (Heikkinen et al., 2020). Further, in Li et al. (2024), the concentrations of organic precursors have even been shown to have an increasing trend at SMEAR II.
In winter, biogenic OA precursors have minima in their concentrations (Fig. S4c), as shown in Heikkinen et al. (2020), and consequently the collected PM originates mostly from anthropogenic sources, such as traffic, industry, and different combustion processes (Forsberg et al., 2005; Anttila and Tuovinen, 2010), as is indicated by the winter maxima in eBC concentrations (Fig. S4d–e). Moreover, many gaseous pollutants, emitted from anthropogenic processes and contributing to atmospheric chemistry or aerosol processes, such as SO2 and NOx, have maxima in their seasonal cycle in spring and winter (Fig. S4a–b; Lyubovtseva et al., 2005; Anttila and Tuovinen, 2010; Riuttanen et al., 2013; Heikkinen et al., 2020), further affirming the contribution of anthropogenic pollution to the observed trends. Additionally, Banerji et al. (2025) showed that at SMEAR II, light-absorbing aerosol peaks in winter, being thus associated with, e.g., black carbon from anthropogenic activities, while aerosol-scattering peaks in summer and winter, being thus likely associated with OA in summer and sulfates in winter. These authors also found an increasing trend in single scattering albedo, indicating that the relative proportion of light-absorbing aerosol decreases. Luoma et al. (2019), in turn, reported decreased light scattering and absorption with a simultaneous increase in light backscattering fraction and scattering Ångström exponent at SMEAR II, indicating a reduction in the large particle concentration.
Figure 6PM1 to PM2.5 and PM2.5 to PM10 ratios in different temperature bins using impactor data. The horizontal line represents the median, the distance between the box edges shows the interquartile range, whiskers extend to 1.5 times the interquartile range, and data points even farther from the median are presented with circles.
The seasonal difference in PM sources is also visible in the ratios between PM1 to PM2.5 and PM2.5 to PM10 plotted against temperature bins (Fig. 6) as well as in the monthly PM1 to PM10 ratio (Fig. S13). The fraction of smaller particles increases in cold and warm temperatures (Fig. 6), which could be attributed to anthropogenic pollution during winter and secondary aerosol formation in summer, which is also visible in the aerosol PM1 to PM10 aerosol light-scattering coefficient (Luoma et al., 2019). In winters, nearly 80 % of PM10 consists of PM1 (Fig. S13).
The PM1 to PM2.5 and PM2.5 to PM10 ratios exhibit small, but statistically significant at the 95 % confidence level, negative trends (Fig. S14). The decline is particularly attributed to the decline in PM1 concentration due to decreasing anthropogenic precursor concentrations since it is larger in the PM1 to PM2.5 ratio. Also, the annual relative trends from the impactor data are largest for PM1 (Table 3). At two regional background sites in Sweden, the PM2.5 to PM10 ratios in 1999–2001 were 0.77 and 0.8 (Forsberg et al., 2005), which is in line with the measurements from SMEAR II. In the 1999–2001 dataset, the PM2.5 to PM10 ratio at SMEAR II was 0.86 in winter and spring and 0.82 in summer and autumn (Laakso et al., 2003), while in 2020, the ratios fell below 0.8 (Fig. S14), also highlighting the change in aerosol population at SMEAR II.
Table 4Summary of PM trends in previous literature. The unit is µg m−3 yr−1, except in Anttila and Tuovinen (2010) where the unit of the first number is µg m−3 per month and the second is % yr−1. Note that the trends are calculated using different methods.
Generally, the PM concentrations have been observed to decrease in Europe (Spindler et al., 2004; Barmpadimos et al., 2011; Keuken et al., 2012; Guerreiro et al., 2014). However, in Guerreiro et al. (2014), non-significant positive trends in PM10 (2002–2011) and PM2.5 (2006–2011) were also observed at Finnish rural background sites. In Anttila and Tuovinen (2010), both increasing and decreasing trends were detected in a dataset from 1994 to 2007 from Finland, which they linked to different measurement environments (urban, suburban, and industrial). Table 4 lists the trends observed at different measurement sites across Europe.
The trends measured at SMEAR II (Table 3) are similar to those reported previously for Finland but are lower than the trends observed elsewhere in Europe (Table 4). One reason for this is likely the overall lower PM concentrations at SMEAR II compared to other locations as well as the longer time span. Moreover, the trends in different studies have been calculated using different methods, such as Sen's slope (this study; Cusack et al., 2012; Guerreiro et al., 2014; Pandolfi et al., 2016) and generalized least-squares regression (Anttila and Tuovinen, 2010; Bigi and Ghermandi, 2016) and also using different data preprocessing, which can further affect the trend estimates.
The connection between decreasing gaseous pollutant emissions and secondary aerosol concentrations has been noted previously (Anttila and Tuovinen, 2010; Cusack et al., 2012; Kyrö et al., 2014; Pandolfi et al., 2016; Li et al., 2024), and decreasing PM trends in Europe have been connected to the modernization of industry and heating systems as well as the technological development of vehicles (Spindler et al., 2004; Barmpadimos et al., 2011; Keuken et al., 2012). Hence, the observed decrease in PM concentrations at SMEAR II is in line with previous studies and can be connected to the emission reductions driven by air quality legislation.
In this paper, different long-term aerosol mass concentration (PM10, PM2.5, PM1) measurement techniques were compared and reported for the years 2005–2020 from SMEAR II, Finland. The direct mass concentration measurements with a cascade impactor and SHARP were compared with the mass concentrations calculated from the combined aerosol number size distributions of DMPS and APS. The results obtained using different methods compare well with the correlation coefficients of about 0.8.
The lower correlation values were connected to sampling methodologies, e.g., reducing the inlet heating temperature of SHARP increased the correlation with the impactor. Additionally, although impactor measurements are simple and based purely on the weighing of filters, the impactor data showed somewhat higher concentrations than the other two methods, especially in the PM10 size, which might stem from the difficulties related to weighing masses down to micrograms. Any disturbances or deposited dust particles can lead to overestimated mass concentrations, which might be the reason why impactor data showed statistically insignificant trends in summer and autumn, while DMPS+APS data with similar absolute values resulted in a statistically significant decreasing trend in PM concentration. On an annual scale, both methods indicated statistically significant decreasing trends, which were comparable with the trends observed elsewhere in Finland.
The measured masses were similar between all the methods, and hence, we can conclude that all methods were applicable for long-term PM monitoring. Nevertheless, we acknowledge that the comparison of PM concentrations measured with different techniques gives valuable information for data quality control purposes, as well as for validating the applicability of the different methods. Therefore, we encourage conducting extensive comparisons with different methods at each measurement site.
The PM concentrations at SMEAR II were generally low, mostly less than 5 µg m−3, which clearly fell below the 20 µg m−3 limit of the EU air quality legislation. The highest PM concentrations at SMEAR II were measured in summer, when organic compounds from the surrounding boreal forest contribute to the measured PM mass. Peaks observed in the PM data can be related to transported particles from regions with, e.g., forest fires or ongoing volcanic eruptions.
The measurements showed overall decreasing PM trends for all size classes and in all seasons, although the decline was faster in the PM1 size class, which can be attributed to the decrease in anthropogenic pollution due to legislation aiming for improved air quality. Importantly, the trends were weakest in summer when natural emissions of VOCs from the forest lead to the formation of OA. As these natural VOCs are projected to increase with increasing temperature, it is possible that summertime OA concentrations keep increasing in the future. Taken together with the declining anthropogenic emissions, the role of natural aerosol particles could be anticipated to become more significant in the future. Overall, the results emphasize the importance of the long-term measurements (Kulmala et al., 2023) for understanding atmospheric aerosol mass concentrations and the factors controlling them. This is a requirement to quantify the relative roles of natural and anthropogenic sources to PM concentrations and ultimately to their impacts on health and the climate.
Aerosol data used in this study are available through the EBAS database operated by Norwegian Institute for Air Research (NILU) at https://ebas-data.nilu.no/ (last access: 5 May 2025). BC data are available at the SmartSMEAR database at https://smear.avaa.csc.fi/ (last access: 5 September 2025). Temperature and trace gas data are published by Aalto et al. (2023) at https://doi.org/10.23729/23dd00b2-b9d7-467a-9cee-b4a122486039. Air mass source area data are available upon request from the corresponding author.
The supplement related to this article is available online at https://doi.org/10.5194/ar-3-503-2025-supplement.
The idea and design of the study were conceived by HMK, MK, and TP. IY, HMK, and KLu wrote the paper and, together with LA, analyzed the data and provided the visualizations. LH, TN, KLe, EE, MK, and TP helped to interpret the results. IY, HMK, LA, PA, JA, JL, KLu, SB, and JK also provided measurement data. All authors contributed to reviewing and commenting on the paper.
At least one of the (co-)authors is a member of the editorial board of Aerosol Research. The peer-review process was guided by an independent editor, and the authors also have no other competing interests to declare.
Publisher's note: Copernicus Publications remains neutral with regard to jurisdictional claims made in the text, published maps, institutional affiliations, or any other geographical representation in this paper. While Copernicus Publications makes every effort to include appropriate place names, the final responsibility lies with the authors. Views expressed in the text are those of the authors and do not necessarily reflect the views of the publisher.
The authors acknowledge the SMEAR II and INAR RI infrastructure as well as ACTRIS for the data accessed from the SmartSMEAR (https://smear.avaa.csc.fi/) and EBAS (https://ebas.nilu.no, last access: 30 October 2025) databases. We also thank the SMEAR II personnel and PIs for the long-term measurement data.
This research has been supported by the Research Council of Finland (grant nos. 337549 (ACCC Flagship), 302958 (Academy Professorship for Markku Kulmala), 1325656, 311932, 334792, 316114, 325647, 325681, and 347782), Horizon 2020 (grant nos. 654109 and 739530), Horizon Europe (Non-CO2 Forcers and Their Climate, Weather, Air Quality and Health Impacts (FOCI)), European Research Council (ATM-GTP, contract no. 742206), the Jane and Aatos Erkko Foundation (Quantifying carbon sink, CarbonSink+ and their interaction with air quality), and the Jenny and Antti Wihuri Foundation (Gigacity).
This paper was edited by Daniele Contini and reviewed by Michael Pikridas and two anonymous referees.
Aalto, J., Aalto, P., Keronen, P., Kolari, P., Rantala, P., Taipale, R., Kajos, M., Patokoski, J., Rinne, J., Ruuskanen, T., Leskinen, M., Laakso, H., Levula, J., Pohja, T., Siivola, E., Kulmala, M., and Ylivinkka, I.: SMEAR II Hyytiälä forest meteorology, greenhouse gases, air quality and soil, University of Helsinki, Institute for Atmospheric and Earth System Research [data set], https://doi.org/10.23729/23dd00b2-b9d7-467a-9cee-b4a122486039, 2023.
Aalto, P., Hämeri, K., Becker, E., Weber, R., Salm, J., Mäkelä, J. M., Hoell, C., O'Dowd, C. D., Hansson, H.-C., Väkevä, M., Koponen, I. K., Buzorius, G., and Kulmala, M.: Physical characterization of aerosol particles during nucleation events, Tellus B: Chem. and Phys. Meteorol., 53, 344–358, https://doi.org/10.1034/j.1600-0889.2001.d01-25.x, 2001.
Anttila, P.: Air Quality Trends in Finland, 1994–2018, Academic dissertation in physics, Institute of Atmospheric and Earth System Research/Physics, Faculty of Science, University of Helsinki, Helsinki, Finland, Finnish Meteorological Institute Contributions No. 163, https://helda.helsinki.fi/items/031b1fc3-2f44-4b6b-a2a0-4da2b079e50e (last access: 30 October 2025), 2020.
Anttila, P. and Tuovinen J.-P.: Trends of primary and secondary pollutant concentrations in Finland in 1994–2007, Atmospheric Environment, 44, 30–41, https://doi.org/10.1016/j.atmosenv.2009.09.041, 2010.
Anttila, P., Makkonen, U., Hellén, H., Kyllönen, K., Leppänen, S., Saari, H., and Hakola, H.: Impact of the open biomass fires in spring and summer of 2006 on the chemical composition of background air in south-eastern Finland, Atmospheric Environment, 42, 6472–6486, https://doi.org/10.1016/j.atmosenv.2008.04.020, 2008.
Banerji, S., Luoma, K., Ylivinkka, I., Ahonen, L., Kerminen, V.-M., and Petäjä, T.: Measurement Report: Optical properties of supermicron aerosol particles in a boreal environment, EGUsphere [preprint], https://doi.org/10.5194/egusphere-2025-1776, 2025.
Barmpadimos, I., Hueglin, C., Keller, J., Henne, S., and Prévôt, A. S. H.: Influence of meteorology on PM10 trends and variability in Switzerland from 1991 to 2008, Atmos. Chem. Phys., 11, 1813–1835, https://doi.org/10.5194/acp-11-1813-2011, 2011.
Barmpadimos, I., Keller, J., Oderbolz, D., Hueglin, C., and Prévôt, A. S. H.: One decade of parallel fine (PM2.5) and coarse (PM10–PM2.5) particulate matter measurements in Europe: trends and variability, Atmos. Chem. Phys., 12, 3189–3203, https://doi.org/10.5194/acp-12-3189-2012, 2012.
Berner, A. and Luerzer, C: Mass size distributions of traffic aerosols at Vienna, J. Phys. Chem., 84, 2079–2083, https://doi.org/10.1021/j100453a016, 1980.
Bigi, A. and Ghermandi, G.: Trends and variability of atmospheric PM2.5 and PM10–2.5 concentration in the Po Valley, Italy, Atmos. Chem. Phys., 16, 15777–15788, https://doi.org/10.5194/acp-16-15777-2016, 2016.
Cantrell, C. A.: Technical Note: Review of methods for linear least-squares fitting of data and application to atmospheric chemistry problems, Atmos. Chem. Phys., 8, 5477–5487, https://doi.org/10.5194/acp-8-5477-2008, 2008.
Chen, Y., Zang, L., Du, W., Xu, D., Shen, G., Zhang, Q., Zou, Q., Chen, J., Zhao, M., and Yao, D.: Ambient air pollution of particles and gas pollutants, and the predicted health risks from long-term exposure to PM(2.5) in Zhejiang province, China, Environ. Sci. Pollut. Res. Int., 25, 23833–23844, https://doi.org/10.1007/s11356-018-2420-5, 2018.
Collaud Coen, M. and Vogt, F. P. A.: mannkendall/Matlab: Bug fix: prob_mk_n (v1.1.0), Zenodo [code], https://doi.org/10.5281/zenodo.4495589, 2021.
Collaud Coen, M., Andrews, E., Bigi, A., Martucci, G., Romanens, G., Vogt, F. P. A., and Vuilleumier, L.: Effects of the prewhitening method, the time granularity, and the time segmentation on the Mann–Kendall trend detection and the associated Sen's slope, Atmos. Meas. Tech., 13, 6945–6964, https://doi.org/10.5194/amt-13-6945-2020, 2020.
Cooke, M. C., Francis, P. N., Millington, S., Saunders, R., and Witham, C.: Detection of the Grímsvötn 2011 volcanic eruption plumes using infrared satellite measurements, Atmos. Sci. Lett., 15, 321–327, https://doi.org/10.1002/asl2.506, 2011.
Cusack, M., Alastuey, A., Pérez, N., Pey, J., and Querol, X.: Trends of particulate matter (PM2.5) and chemical composition at a regional background site in the Western Mediterranean over the last nine years (2002–2010), Atmos. Chem. Phys., 12, 8341–8357, https://doi.org/10.5194/acp-12-8341-2012, 2012.
Dusek, U., Frank, G. P., Hildebrandt, L., Curtius, J., Schneider, J., Walter, S., Chand, D., Drewnick, F., Hings, S., Jung, D., Borrmann, S., and Andreae, M. O.: Size Matters More Than Chemistry for Cloud-Nucleating Ability of Aerosol Particles, Science, 312, 1375–1378, https://doi.org/10.1126/science.1125261, 2006.
Flanner, M. G., Gardner, A. S., Eckhardt, S., Stohl, A., and Perket J.: Aerosol radiative forcing from the 2010 Eyjafjallajökull volcanic eruptions, J. Geophys. Res. Atmos., 119, 9481–9491, https://doi.org/10.1002/2014JD021977, 2014.
Forsberg, B., Hansson, H.-C., Johansson, C., Areskoug, H., Söderlund, K., and Järvholm, B.: Comparative Health Impact Assessment of Local and Regional Particulate Air Pollutants in Scandinavia, Ambio, 34, 11–19, 2005.
Gislason, S., Stefansdottir, G., Pfeffer, M. A., Barsotti, S., Jóhannsson, T., Galeczka, I., Bali, E., Sigmarsson, O., Stefansson, A., Keller, N., Sigurdsson, A., Bergsson, B., Galle, B., Jacobo, V. C., Arellano, S., Aiuppa, A., Jonasdottir, E., Eiriksdottir, E., Jakobsson, S., and Gudmundsson, M.: Environmental pressure from the 2014–15 eruption of Bárðarbunga volcano, Iceland, Geochem. Perspect. Lett., 1, 84–93, https://doi.org/10.7185/geochemlet.1509, 2015.
Goohs, K., Lilienfeld, P., and Wilbertz, J.: A Synchronized Hybrid Real-Time Particulate Monitor, EAC 2009 proceedings, European Aerosol Conference, Karlsruhe, abstract T091A13, https://phaidra.univie.ac.at/o:1079957 (last access: 11 November 2025), 2009.
Gudmundsson, M. T., Thordarson, T., Höskuldsson, A., Larsen, G., Björnsson, H., Prata, F. J., Oddsson, B., Magnússon, E., Högnadóttir, T., Petersen, G. N., Hayward, C. L., Stevenson, J. A., and Jónsdóttir, I.: Ash generation and distribution from the April-May 2010 eruption of Eyjafjallajökull, Iceland, Scientific reports, 2, 572, https://doi.org/10.1038/srep00572, 2012.
Guenther, A. B., Zimmerman, P. R., Harley, P. C., Monson, R. K., and Fall, R.: Isoprene and monoterpene emission rate variability: Model evaluations and sensitivity analyses, Journal of Geophys. Res.: Atmos., 98, 12609–12617, https://doi.org/10.1029/93JD00527, 1993.
Guerreiro, C. B. B., Foltescu, V., and de Leeuw, F.: Air quality status and trends in Europe, Atmospheric Environment, 98, 376–384, 2014.
Hari, P. and Kulmala, M.: Station for Measuring Ecosystem-Atmosphere Relations: (SMEAR II), Boreal Environ. Res., 10, 315–322, https://doi.org/10.1007/978-94-007-5603-8_9, 2005.
Heikkinen, L., Äijälä, M., Riva, M., Luoma, K., Dällenbach, K., Aalto, J., Aalto, P., Aliaga, D., Aurela, M., Keskinen, H., Makkonen, U., Rantala, P., Kulmala, M., Petäjä, T., Worsnop, D., and Ehn, M.: Long-term sub-micrometer aerosol chemical composition in the boreal forest: inter- and intra-annual variability, Atmos. Chem. Phys., 20, 3151–3180, https://doi.org/10.5194/acp-20-3151-2020, 2020.
Heikkinen, L., Äijälä, M., Daellenbach, K. R., Chen, G., Garmash, O., Aliaga, D., Graeffe, F., Räty, M., Luoma, K., Aalto, P., Kulmala, M., Petäjä, T., Worsnop, D., and Ehn, M.: Eight years of sub-micrometre organic aerosol composition data from the boreal forest characterized using a machine-learning approach, Atmos. Chem. Phys., 21, 10081–10109, https://doi.org/10.5194/acp-21-10081-2021, 2021.
Hirsch, R. M., Slack, J. R., and Smith, R. A.: Techniques of trend analysis for monthly water quality data, Water Resour. Res., 18, 107–121, https://doi.org/10.1029/WR018i001p00107, 1982.
Ilyinskaya, E., Schmidt, A., Mather, T. A., Pope, F. D., Witham, C., Baxter, P., Jóhannsson, T., Pfeffer, M., Barsotti, S., Singh, A., Sanderson, P., Bergsson, B., McCormick Kilbride, B., Donovan, A., Peters, N., Oppenheimer, C., and Edmonds, M.: Understanding the environmental impacts of large fissure eruptions: Aerosol and gas emissions from the 2014–2015 Holuhraun eruption (Iceland), Earth Planet. Sci. Lett., 472, 309–322, https://doi.org/10.1016/j.epsl.2017.05.025, 2017.
IPCC: Climate Change 2021: The Physical Science Basis. Contribution of Working Group I to the Sixth Assessment Report of the Intergovernmental Panel on Climate Change, Cambridge University Press, Cambridge, United Kingdom and New York, NY, USA, https://doi.org/10.1017/9781009157896, 2021.
Jimenez, J. L., Canagaratna, M. R., Donahue, N. M., Prevot, A. S. H., Zhang, Q., Kroll, J. H., DeCarlo, P. F., Allan, J. D., Coe, H., Ng, N. L., Aiken, A. C., Docherty, K. S., Ulbrich, I. M., Grieshop, A. P., Robinson, A. L., Duplissy, J., Smith, J. D., Wilson, K. R., Lanz, V. A., Hueglin, C., Sun, Y. L., Tian, J., Laaksonen, A., Raatikainen, T., Rautiainen, J., Vaattovaara, P., Ehn, M., Kulmala, M., Tomlinson, J. M., Collins, D. R., Cubison, M. J., E., Dunlea, J., Huffman, J. A., Onasch, T. B., Alfarra, M. R., Williams, P. I., Bower, K., Kondo, Y., Schneider, J., Drewnick, F., Borrmann, S., Weimer, S., Demerjian, K., Salcedo, D., Cottrell, L., Griffin, R., Takami, A., Miyoshi, T., Hatakeyama, S., Shimono, A., Sun, J. Y., Zhang, Y. M., Dzepina, K., Kimmel, J. R., Sueper, D., Jayne, J. T., Herndon, S. C., Trimborn, A. M., Williams, L. R., Wood, E. C., Middlebrook, A. M., Kolb, C. E., Baltensperger, U., and Worsnop, D. R.: Evolution of Organic Aerosols in the Atmosphere, Science, 326, 1525–-1529, https://doi.org/10.1126/science.1180353, 2009.
Kannosto, J., Virtanen, A., Lemmetty, M., Mäkelä, J. M., Keskinen, J., Junninen, H., Hussein, T., Aalto, P., and Kulmala, M.: Mode resolved density of atmospheric aerosol particles, Atmos. Chem. Phys., 8, 5327–5337, https://doi.org/10.5194/acp-8-5327-2008, 2008.
Keskinen, H.-M., Ylivinkka, I., Heikkinen, L., Aalto, P. P., Nieminen, T., Lehtipalo, K., Aalto, J., Levula, J., Kesti, J., Ahonen, L. R., Ezhova, E., Kulmala, M., and Petäjä, T.: Long-term aerosol mass concentrations in southern Finland: instrument validation, seasonal variation and trends, Atmos. Meas. Tech. Discuss. [preprint], https://doi.org/10.5194/amt-2020-447, 2020.
Keuken, M. P., Roemer, M. G. M., Zandveld, P., Verbeek, R. P., and Velders, G. J. M.: Trends in primary NO2 and exhaust PM emissions from road traffic for the period 2000–2020 and implications for air quality and health in the Netherlands, Atmospheric Environment, 54, 313–319, 2012.
Kulkarni, A. and von Storch, H.: Monte Carlo Experiments on the Effect of Serial Correlation on the Mann-Kendall Test of Trend Monte Carlo experiments on the effect, Meteorologische Zeitschrift, 82–85, https://doi.org/10.1127/METZ/4/1992/82, 1995.
Kulmala, M., Kontkanen, J., Junninen, H., Lehtipalo, K., Manninen, H. E., Nieminen, T., Petäjä, T., Sipilä, M., Schobesberger, S., Rantala, P., Franchin, A., Jokinen, T., Järvinen, E., Äijälä, M., Kangasluoma, J., Hakala, J., Aalto, P. P., Paasonen, P., Mikkilä, J., Vanhanen, J., Aalto, J., Hakola, H., Makkonen, U., Ruuskanen, T., Mauldin, R. L., Duplissy, J., Vehkamäki, H., Bäck, J., Kortelainen, A., Riipinen, I., Kurtén, T., Johnston, M. V., Smith, J. N., Ehn, M., Mentel, T. F., Lehtinen, K. E. J., Laaksonen, A., Kerminen, V.-M., and Worsnop, D. R.: Direct Observations of Atmospheric Aerosol Nucleation, Science, 339, 943–946, https://doi.org/10.1126/science.1227385, 2013.
Kulmala, M., Lintunen, A., Lappalainen, H., Virtanen, A., Yan, C., Ezhova, E., Nieminen, T., Riipinen, I., Makkonen, R., Tamminen, J., Sundström, A.-M., Arola, A., Hansel, A., Lehtinen, K., Vesala, T., Petäjä, T., Bäck, J., Kokkonen, T., and Kerminen, V.-M.: Opinion: The strength of long-term comprehensive observations to meet multiple grand challenges in different environments and in the atmosphere, Atmos. Chem. Phys., 23, 14949–14971, https://doi.org/10.5194/acp-23-14949-2023, 2023.
Kuula, J., Timonen, H., Niemi, J. V., Manninen, H. E., Rönkkö, T., Hussein, T., Fung, P. L., Tarkoma, S., Laakso, M., Saukko, E., Ovaska, A., Kulmala, M., Karppinen, A., Johansson, L., and Petäjä, T.: Opinion: Insights into updating Ambient Air Quality Directive 2008/50/EC, Atmos. Chem. Phys., 22, 4801–4808, https://doi.org/10.5194/acp-22-4801-2022, 2022.
Kyrö, E.-M., Väänänen, R., Kerminen, V.-M., Virkkula, A., Petäjä, T., Asmi, A., Dal Maso, M., Nieminen, T., Juhola, S., Shcherbinin, A., Riipinen, I., Lehtipalo, K., Keronen, P., Aalto, P. P., Hari, P., and Kulmala, M.: Trends in new particle formation in eastern Lapland, Finland: effect of decreasing sulfur emissions from Kola Peninsula, Atmos. Chem. Phys., 14, 4383–4396, https://doi.org/10.5194/acp-14-4383-2014, 2014.
Laakso, L., Hussein, T., Aarnio, P., Komppula, M., Hiltunen, V., Viisanen, Y., and Kulmala, M.: Diurnal and annual characteristics of particle mass and number concentrations in urban, rural and Arctic environments in Finland, Atmos. Environ., 37, 2629–2641, 2003.
Laakso, L., Laakso, H., Aalto, P. P., Keronen, P., Petäjä, T., Nieminen, T., Pohja, T., Siivola, E., Kulmala, M., Kgabi, N., Molefe, M., Mabaso, D., Phalatse, D., Pienaar, K., and Kerminen, V.-M.: Basic characteristics of atmospheric particles, trace gases and meteorology in a relatively clean Southern African Savannah environment, Atmos. Chem. Phys., 8, 4823–4839, https://doi.org/10.5194/acp-8-4823-2008, 2008.
Laj, P., Lund Myhre, C., Riffault, V., Amiridis, V., Fuchs, H., Eleftheriadis, K., Petäjä, T., Salameh, T., Kivekäs, N., Juurola, E., Saponaro, G., Philippin, S., Cornacchia, C., Alados Arboledas, L., Baars, H., Claude, A., De Mazière, M., Dils, B., Dufresne, M., Evangeliou, N., Favez, O., Fiebig, M., Haeffelin, M., Herrmann, H., Höhler, K., Illmann, N., Kreuter, A., Ludewig, E., Marinou, E., Möhler, O., Mona, L., Eder Murberg, L., Nicolae, D., Novelli, A., O'Connor, E., Ohneiser, K., Petracca Altieri, R. M., Picquet-Varrault, B., van Pinxteren, D., Pospichal, B., Putaud, J., Reimann, S., Siomos, N., Stachlewska, I., Tillmann, R., Voudouri, K. A., Wandinger, U., Wiedensohler, A., Apituley, A., Comerón, A., Gysel-Beer, M., Mihalopoulos, N., Nikolova, N., Pietruczuk, A., Sauvage, S., Sciare, J., Skov, H., Svendby, T., Swietlicki, E., Tonev, D., Vaughan, G., Zdimal, V., Baltensperger, U., Doussin, J., Kulmala, M., Pappalardo, G., Sorvari Sundet, S., and Vana, M.: Aerosol, Clouds and Trace Gases Research Infrastructure (ACTRIS): The European Research Infrastructure Supporting Atmospheric Science, Bulletin of the American Meteorological Society, 105, E1098–E1136, https://doi.org/10.1175/BAMS-D-23-0064.1, 2024.
Leino, K., Riuttanen, L., Nieminen, T., Dal Maso, M., Väänänen, R., Pohja, T., Keronen, P., Järvi, L., Aalto, P., Virkkula, A., Kerminen, V.-M., Petäjä, T., and Kulmala, M.: Biomass-burning smoke episodes in Finland from eastern European wildfires, Boreal Environ. Res., 19, 275–292, https://helda.helsinki.fi/items/5dac9562-b29c-419d-8e78-3364088a2db9 (last access: 30 October 2025), 2014.
Li, X., Li, H., Yao, L., Stolzenburg, D., Sarnela, N., Vettikkat, L., de Jonge, R. W., Baalbaki, R., Uusitalo, H., Kontkanen, J., Lehtipalo, K., Daellenback, K. R., Jokinen, T., Aalto, J., Keronen, P., Schobesberger, S., Nieminen, T., Petäjä, T., Kerminen, V.-M., Bianchi, F., Kulmala, M., and Dada, L.: Over 20 years of observations in the boreal forest reveal a decreasing trend of atmospheric new particle formation, Boreal Env. Res., 29, 25–52, 2024.
Luoma, K., Virkkula, A., Aalto, P., Petäjä, T., and Kulmala, M.: Over a 10-year record of aerosol optical properties at SMEAR II, Atmos. Chem. Phys., 19, 11363–11382, https://doi.org/10.5194/acp-19-11363-2019, 2019.
Luoma, K., Virkkula, A., Aalto, P., Lehtipalo, K., Petäjä, T., and Kulmala, M.: Effects of different correction algorithms on absorption coefficient – a comparison of three optical absorption photometers at a boreal forest site, Atmos. Meas. Tech., 14, 6419–6441, https://doi.org/10.5194/amt-14-6419-2021, 2021.
Lyubovtseva, Y. S., Sogacheva, L., Dal Maso, M., Bonn, B., Keronen, P., and Kulmala, M.: Seasonal variations of trace gases, meteorological parameters, and formation of aerosols in boreal forests, Boreal Env. Res., 10, 493–510, 2005.
Makkonen, U., Virkkula, A., Hellén, H., Hemmilä, M., Sund, J., Äijälä, M., Ehn, M., Junninen, H., Keronen, P., Petäjä, T., Worsnop, D. R., Kulmala, M., and Hakola, H.: Semi-continuous gas and inorganic aerosol measurements at a boreal forest site: seasonal and diurnal cycles of NH3, HONO and HNO3, Boreal Env. Res., 19, 311–328, 2014.
Manavi, S. E. I., Aktypis, A., Siouti, E., Skyllakou, K., Myriokefalitakis, S., Kanakidou, M., and Pandis, S. N.: Atmospheric aerosol spatial variability: Impacts on air quality and climate change, One Earth 8, 101237, https://doi.org/10.1016/j.oneear.2025.101237, 2025.
Manninen, H., Bäck, J., Sihto-Nissilä, S.-L., Huffman, J., Pessi, A.-M., Hiltunen, V., Aalto, P. P., Hidalgo, P., Hari, P., Saarto, A., Kulmala, M., and Petäjä, T.: Patterns in airborne pollen and other primary biological aerosol particles (PBAP), and their contribution to aerosol mass and number in a boreal forest, Boreal Env. Res., 19, 383–405, 2014.
Maynard, A. D. and Kuempel, E. D.: Airborne Nanostructured Particles and Occupational Health, J. Nanopart. Res., 7, 587–614, https://doi.org/10.1007/s11051-005-6770-9, 2005.
Neefjes, I., Laapas, M., Liu, Y., Médus, E., Miettunen, E., Ahonen, L., Quéléver, L., Aalto, J., Bäck, J., Kerminen, V.-M., Lamplahti, J., Luoma, K., Mäki, M., Mammarella, I., Petäjä, T., Räty, M., Sarnela, N., Ylivinkka, I., Hakala, S., Kulmala, M., Nieminen, T., and Lintunen, A.: 25 years of atmospheric and ecosystem measurements in a boreal forest – Seasonal variation and responses to warm and dry years, Boreal Env. Res., 27, 1–31, 2022.
Neusüß, C., Weise, D., Birmili, W., Wex, H., Wiedensohler, A., and Covert, D. S.: Size-segregated chemical, gravimetric and number distribution-derived mass closure of the aerosol in Sagres, Portugal during ACE-2, Tellus B: Chem. Phys. Meteorol., 52, 169–184, https://doi.org/10.1034/j.1600-0889.2000.00039.x, 2000.
Niemi, J. V., Saarikoski, S., Aurela, M., Tervahattu, H., Hillamo, R., Westphal, D. L., Aarnio, P., Koskentalo, T., Makkonen, U., Vehkamäki, H., and Kulmala, M.: Long-range transport episodes of fine particles in southern Finland during 1999–2007, Atmospheric Environment, 43, 1255–1264, https://doi.org/10.1016/j.atmosenv.2008.11.022, 2009.
Occhipinti, L. G. and Oluwasanya, P. W.: Particulate Matter Monitoring: Past, Present and Future, Int. J. Earth Environ. Sci., 2, 144, https://doi.org/10.15344/2456-351X/2017/144, 2017.
Pandolfi, M., Alastuey, A., Pérez, N., Reche, C., Castro, I., Shatalov, V., and Querol, X.: Trends analysis of PM source contributions and chemical tracers in NE Spain during 2004–2014: a multi-exponential approach, Atmos. Chem. Phys., 16, 11787–11805, https://doi.org/10.5194/acp-16-11787-2016, 2016.
Petäjä, T., Laakso, L., Grönholm, T., Launiainen, S., Evele-Peltoniemi, I., Virkkula, A., Leskinen, A., Backman, J., Manninen, H.E., Sipilä, M., Haapanala, S., Hämeri, K., Vanhala, E., Tuomi, T., Paatero, J., Aurela, M., Hakola, H., Makkonen, U., Hellén, H., Hillamo, R., Vira, J., Prank, M., Sofiev, M., Siitari-Kauppi, M., Laaksonen, A., lehtinen, K. E. J., Kulmala, M., Viisanen, Y., and Kerminen, V.-M.: In-situ observations of Eyjafjallajökull ash particles by hot-air balloon, Atmospheric Environment, 48, 104–112, https://doi.org/10.1016/j.atmosenv.2011.08.046, 2012.
Peters, T., Ott, D., and O'Shaughnessy, P.: Comparison of the GRIMM 1.108 and 1.109 Portable Aerosol Spectrometer to the TSI 3321 Aerodynamic Particle Sizer for Dry Particles, Ann. Occup. Hyg., 50, 843–850, https://doi.org/10.1093/annhyg/mel067, 2006.
Pope, C., Burnett, R. T., and Thun, M. J.: Lung cancer, cardiopulmonary mortality, and long-term exposure to fine particulate air pollution, J. Amer. Med. Assoc., 287, 1132–1141, https://doi.org/10.1001/jama.287.9.1132, 2003.
Pöschl, U.: Atmospheric Aerosols: Composition, Transformation, Climate and Health Effects, Angewandte Chemie International Edition, 44, 7520–7540, https://doi.org/10.1002/anie.200501122, 2005.
Pysarenko, L., Krakovska, S., Savenets, M., Ezhova, E., Lintunen, A., Petäjä, T., Bäck, J., and Kulmala, M.: Two-decade variability of climatic factors and its effect on the link between photosynthesis and meteorological parameters: example of Finland's boreal forest, Boreal Environment Research, 27, 131–144, 2022.
Rantala, P., Taipale, R., Aalto, J., Kajos, M. K., Patokoski, J., Ruuskanen, T. M., and Rinne, J.: Continuous flux measurements of VOCs using PTR-MS – reliability and feasibility of disjunct-eddy-covariance, surface-layer-gradient, and surface-layer-profile methods, Boreal Env. Res., 19, 87–107, 2014.
Räty, M., Sogacheva, L., Keskinen, H-M., Kerminen, V-M., Nieminen, T., Petäjä, T., Ezhova, E., and Kulmala, M.: Dynamics of aerosol, humidity and clouds in air masses travelling over Fennoscandian boreal forests, Atmospheric Chemistry and Physics, 23, 3779–3798, 2023.
Rinne, J., Ruuskanen, T., Reissell, A., Taipale, R., Hakola, H., and Kulmala, M.: On-line PTR-MS measurements of atmospheric concentrations of volatile organic compounds in a European boreal forest ecosystem, Boreal Environ. Res., 10, 425–436, http://www.borenv.net/BER/archive/pdfs/ber10/ber10-425.pdf (last access: 30 October 2025), 2005.
Riuttanen, L., Hulkkonen, M., Dal Maso, M., Junninen, H., and Kulmala, M.: Trajectory analysis of atmospheric transport of fine particles, SO2, NOx and O3 to the SMEAR II station in Finland in 1996–2008, Atmos. Chem. Phys., 13, 2153–2164, https://doi.org/10.5194/acp-13-2153-2013, 2013.
Saarikoski, S., Mäkelä, T., Hillamo, R., Aalto, P., Kerminen, V.-M., and Kulmala, M.: Physicochemical characterization and mass closure of size-segregated atmospheric aerosols in Hyytiälä, Finland, Boreal Environ. Res., 10, 386–400, 2005.
Schraufnagel, D. E.: The health effects of ultrafine particles, Exp. Mol. Med., 52, 311–317, https://doi.org/10.1038/s12276-020-0403-3, 2020.
Seinfeld, J. and Pandis, S.: Atmospheric chemistry and physics: from air pollution to climate change, 2nd edn., John Wiley & Sons, New Jersey, USA, ISBN 978-0471720188, 2006.
Shiraiwa, M., Ueda, K, Pozzer, A., Lammel, G., Kampf, C. J., Fushimi, A., Enami, S., Arangio, A. M., Fröhlich-Nowoisky, J., Fujitani, Y., Furuyama, A., Lakey, P. S. J., Lelieveld, J., Lucas, K., Morino, Y., Pöschl, U., Takahama, S., Takami, A., Tong, H., Weber, B., Yoshino, A., and Sato, K.: Aerosol Health Effects from Molecular to Global Scales, Environmental Science & Technology, 51, 13545-1-3567, https://doi.org/10.1021/acs.est.7b04417, 2017.
Shukla, K. and Aggarwal, S. G.: A Technical Overview on Beta-Attenuation Method for the Monitoring of Particulate Matter in Ambient Air, Aerosol Air Qual. Res., 22, 220195, https://doi.org/10.4209/aaqr.220195, 2022.
Sinclair, V. A., Ritvanen, J., Urbancic, G., Erner, I., Batrak, Y., Moisseev, D., and Kurppa, M.: Boundary-layer height and surface stability at Hyytiälä, Finland, in ERA5 and observations, Atmos. Meas. Tech., 15, 3075–3103, https://doi.org/10.5194/amt-15-3075-2022, 2022.
Spindler, G., Müller, K., Brüggemann, E., Gnauk, T., and Herrmann, H.: Long-term size-segregated characterization of PM10, PM2.5, and PM1 at the IfT research station Melpitz downwind of Leipzig (Germany) using high and low-volume filter samplers, Atmos. Environ., 38, 5333–5347, https://doi.org/10.1016/j.atmosenv.2003.12.047, 2004.
Stull, R. B.: An Introduction to Boundary Layer Meteorology, Springer Dordrecht, ISBN 978-90-277-2769-5, 1988.
Stein, A. F., Draxler, R. R., Rolph, G. D., Stunder, B. J. B., Cohen, M. D., and Ngan, F.: Noaa's Hysplit Atmospheric Transport and Dispersion Modeling System, B. Am. Meteorol. Soc., 96, 2059–2077, https://doi.org/10.1175/BAMS-D-14-00110.1, 2015.
Sui, C., Yu, L., and Vihma, T.: Occurrence and drivers of wintertime temperature extremes in Northern Europe during 1979–2016, Tellus A: Dynamic Meteorology and Oceanography, 72, 1–19, https://doi.org/10.1080/16000870.2020.1788368, 2020.
Taipale, R., Ruuskanen, T. M., Rinne, J., Kajos, M. K., Hakola, H., Pohja, T., and Kulmala, M.: Technical Note: Quantitative long-term measurements of VOC concentrations by PTR-MS – measurement, calibration, and volume mixing ratio calculation methods, Atmos. Chem. Phys., 8, 6681–6698, https://doi.org/10.5194/acp-8-6681-2008, 2008.
Tesche, M., Glantz, P., Johansson, C., Norman, M., Hiebsch, A., Ansmann, A., Althausen, D., Engelmann, R., and Seifert, P.: Volcanic ash over Scandinavia originating from the Grímsvötn eruptions in May 2011, J. Geophys. Res., 117, D09201, https://doi.org/10.1029/2011JD017090, 2012.
Thomas, H. E. and Prata, A. J.: Sulphur dioxide as a volcanic ash proxy during the April–May 2010 eruption of Eyjafjallajökull Volcano, Iceland, Atmos. Chem. Phys., 11, 6871–6880, https://doi.org/10.5194/acp-11-6871-2011, 2011.
Van Dingenen, R., Raes, F., Putaud, J.-P., Baltensperger, U., Charron, A., Facchini, M., Decesari, S., Sandro, F., Gehrig, R., Hansson, H.-C., Harrison, R., Hüglin, C., Jones, A., Laj, P., Lorbeer, G., Maenhaut, W., Palmgren, F., Querol, X., Rodriguez, S., and Wåhlin, P.: A European aerosol phenomenology – 1: Physical characteristics of particulate matter at kerbside, urban, rural and background sites in Europe, Atmos. Environ., 38, 2561–2577, https://doi.org/10.1016/j.atmosenv.2004.01.040, 2004.
Viana, M., Kuhlbusch, T. A. J., Querol, X., Alastuey, A., Harrison, R. M., Hopke, P. K., Winiwarter, W., Vallius, M., Szidat, S., Prévôt, A. S. H., Hueglin, C., Bloemen, H., Wåhlin, P., Vecchi, R., Miranda, A. I., Kasper-Giebl, A., Maenhaut, W., and Hitzenberger, R.: Source apportionment of particulate matter in Europe: A review of methods and results, Journal of Aerosol Science, 39, 827–849, https://doi.org/10.1016/j.jaerosci.2008.05.007, 2008.
Virkkula, A., Mäkelä, T., Hillamo, R., Yli-Tuomi, T., Hirsikko, A., Hämeri, K., and Koponen, I. K.: A Simple Procedure for Correcting Loading Effects of Aethalometer Data, Journal of the Air & Waste Management Association, 57, 1214–1222, https://doi.org/10.3155/1047-3289.57.10.1214, 2007.
Waldén, J., Hillamo, R., Aurela, M., Mäkelä, T., and Laurila, S.: Demonstration of the equivalence of PM2.5 and PM10 measurement methods in Helsinki 2007–2008, Studies No. 3, Finnish Meteorological Institute, Helsinki, Finland, ISBN 978-951-697-726-6, 2010.
Wang, J., Xing, J., Mathur, R., Pleim, J. E., Wang, S., Hogrefe, C., Gan, J.-M., Wong, D. C., and Hao, J.: Historical Trends in PM2.5-Related Premature Mortality during 1990–2010 across the Northern Hemisphere, Environmental Health Perspectives 125, 3, https://doi.org/10.1289/EHP298, 2017.
Wang, W., Chen, Y., Becker, S., and Liu, B.: Linear trend detection in serially dependent hydrometeorological data based on a variance correction Spearman rho method, Water, 7, 7045–7065, https://doi.org/10.3390/w7126673, 2015.
WHO: WHO global air quality guidelines: Particulate matter (PM2.5 and PM10), ozone, nitrogen dioxide, sulfur dioxide and carbon monoxide, World Health Organization, Geneva, ISBN 9789240034228, 2021.
Yli-Juuti, T., Mielonen, T., Heikkinen, L., Arola, A., Ehn, M., Isokääntä, S., Keskinen, H.-M., Kulmala, M., Laakso, A., Lipponen, A., Luoma, K., Mikkonen, S., Nieminen, T., Paasonen, P., Petäjä, T., Romakkaniemi, S., Tonttila, J., Kokkola, H., and Virtanen, A.: Significance of the organic aerosol driven climate feedback in the boreal area, Nature Communications, 12, 1–9, 2021.
Yttri, K. E., Canonaco, F., Eckhardt, S., Evangeliou, N., Fiebig, M., Gundersen, H., Hjellbrekke, A.-G., Lund Myhre, C., Platt, S. M., Prévôt, A. S. H., Simpson, D., Solberg, S., Surratt, J., Tørseth, K., Uggerud, H., Vadset, M., Wan, X., and Aas, W.: Trends, composition, and sources of carbonaceous aerosol at the Birkenes Observatory, northern Europe, 2001–2018, Atmos. Chem. Phys., 21, 7149–7170, https://doi.org/10.5194/acp-21-7149-2021, 2021.
Yue, S., Pilon, P., Phinney, B., and Cavadias, G.: The influence of autocorrelation on the ability to detect trend in hydrological series, Hydrol. Process., 16, 1807–1829, https://doi.org/10.1002/hyp.1095, 2002.