the Creative Commons Attribution 4.0 License.
the Creative Commons Attribution 4.0 License.
 | 03 Mar 2026
Evaluation of mass measurement techniques for soot with different size distributions and OC ∕ TC contents
Guillaume Pailloux
Amel Kort
This study focuses on measuring the mass concentration of soot aggregates generated with a Mini-CAST burner. The experiments were performed in a test bench able to generate soot particles with different size distributions and different organic to total carbon () ratios. With this soot production, we assessed the mass concentration measurements obtained with four online instruments, based on different methods: oscillating microbalance, aerosol electrical charging, filter photometry, and aerosol mobility, as well as an offline gravimetric measurement. The ratio was determined by the thermal–optical method. The findings demonstrate that the oscillating microbalance measurements were performed within acceptable limits of 10 % in comparison to the gravimetric measurements, over a wide range of ratio, mass concentration, and size distribution. The oscillating microbalance measurements were therefore considered to be the reference. The mass concentration measurement based on the aerosol electrical charging is calibrated for a reference size distribution, and we suggested a correction of the mass concentration measurement based on the aerosol Fuchs active surface, which proved to be efficient within the limits of this study. Finally, we confirmed that the mass concentration measurements obtained with the filter photometry method are ratio and wavelength dependent, and we were able to establish limits for the overall mass concentration evaluation with the infrared and ultraviolet wavelengths.
- Article
(3509 KB) - Full-text XML
- BibTeX
- EndNote


In the context of studies on airborne dispersion of soot particles emitted during fire scenarios and monitoring and quantification of emissions from thermal engines, it is important to have a robust measurement of the mass concentration of emitted soot. These measurements are needed to assess the consequences of fires in basic nuclear installations (Kort et al., 2022), as soot is responsible for clogging the last containment barrier made by HEPA filters and for the metrology of conventional engine PM emissions (Aakko-Saksa et al., 2022). Dynamic real-time monitoring of mass emissions can be performed using various types of instruments based on different measurement principles, such as the Aethalometer-type real-time filter photometry measurement method (MA300), tapered element oscillating microbalance (TEOM), or the electrical-charging-based Pegasor particle sensor (PPS). These instruments allow for the study of aerosols across a wide range of concentrations, from ambient air quality monitoring to highly concentrated exhaust emissions. The quantification performed by the PPS is based on the electrical charge on the surface of aerosols, making it extremely dynamic. However, it requires calibration that primarily depends on the mobility median diameter of the aerosol particle size distribution, measured using a scanning mobility particle sizer (SMPS). Similarly, the Aethalometer is an instrument based on optical transmission through a soot cake collected on a filter, and its mass quantification is influenced by the physical nature of the soot, particularly the elemental carbon to organic carbon ratio. For time-stable emission sources, it is also possible to perform measurements using filter sampling, which allows mass concentration quantification by weighing (gravimetric measurement) and organic carbon to total carbon () ratio determination using a Sunset Laboratory analyzer. All these mass concentration measurement techniques, usually used in different contexts, need to be qualified to provide reliable and robust measurements.
For this purpose, soot was generated by a mini-CAST JING 5201C burner through the combustion of propane. Different studies have demonstrated that this mini-CAST generator can produce soot with a wide range of sizes and properties and is regarded as a relevant tool to produce soot similar to that emitted by different combustion processes, such as aircraft engines (Marhaba et al., 2019) or fire situations (Kort et al., 2021). It has been extensively used for soot characterization and as a time-stable soot production source: by varying the gas flow rates supplied to this generator, it is possible to adjust the mass concentration over a wide range, as well as the particle size distribution and the elemental carbon to organic carbon ratio of the produced soot particles. The concentrations of generated soot are then either collected on a filter for ex situ measurements or diluted using a double-stage ejector-type diluter, such as the Dekati eDiluter, which delivers concentrations compatible with the measurement ranges of the instruments used.
The mass concentrations evaluated by the online devices (MA300, PPS Pegasor, SMPS) and the offline direct gravimetric measurement were studied as a function of the reference mass concentration evaluated by the TEOM. The evaluation of the ratio done from the filters and the size distributions of the produced soot particles are also necessary for the interpretation of the instrument responses.
For this experimental study, we developed a test bench (Fig. 1) dedicated to the mass concentration intercomparison. This setup includes the soot generation source and the mini-CAST, followed by two lines. One line, maintained at 180 °C, is used for filter sampling. This standard method will initially be regarded as the reference. The other line feeds a dilution system that distributes the diluted and cooled aerosol to various measurement instruments: the TEOM, PPS, MA300, and SMPS. The standard filter sampling reference method will allow for the verification of the diluter performance and the evaluation of losses along the different branches. The sampling system was designed and operated in accordance with ISO 8178 requirements, which specify standardized procedures for measuring exhaust emissions from internal combustion engines with a target temperature of 180 °C for the sampling line and a maximum residence time of 3 s. With a sampling flow rate of 7.7 L min−1 and a line length of 1 m (inner diameter of 6 mm), the aerosol residence time is approximately 0.22 s. The following sections detail the operating principles and implementation conditions of each component of this test setup.
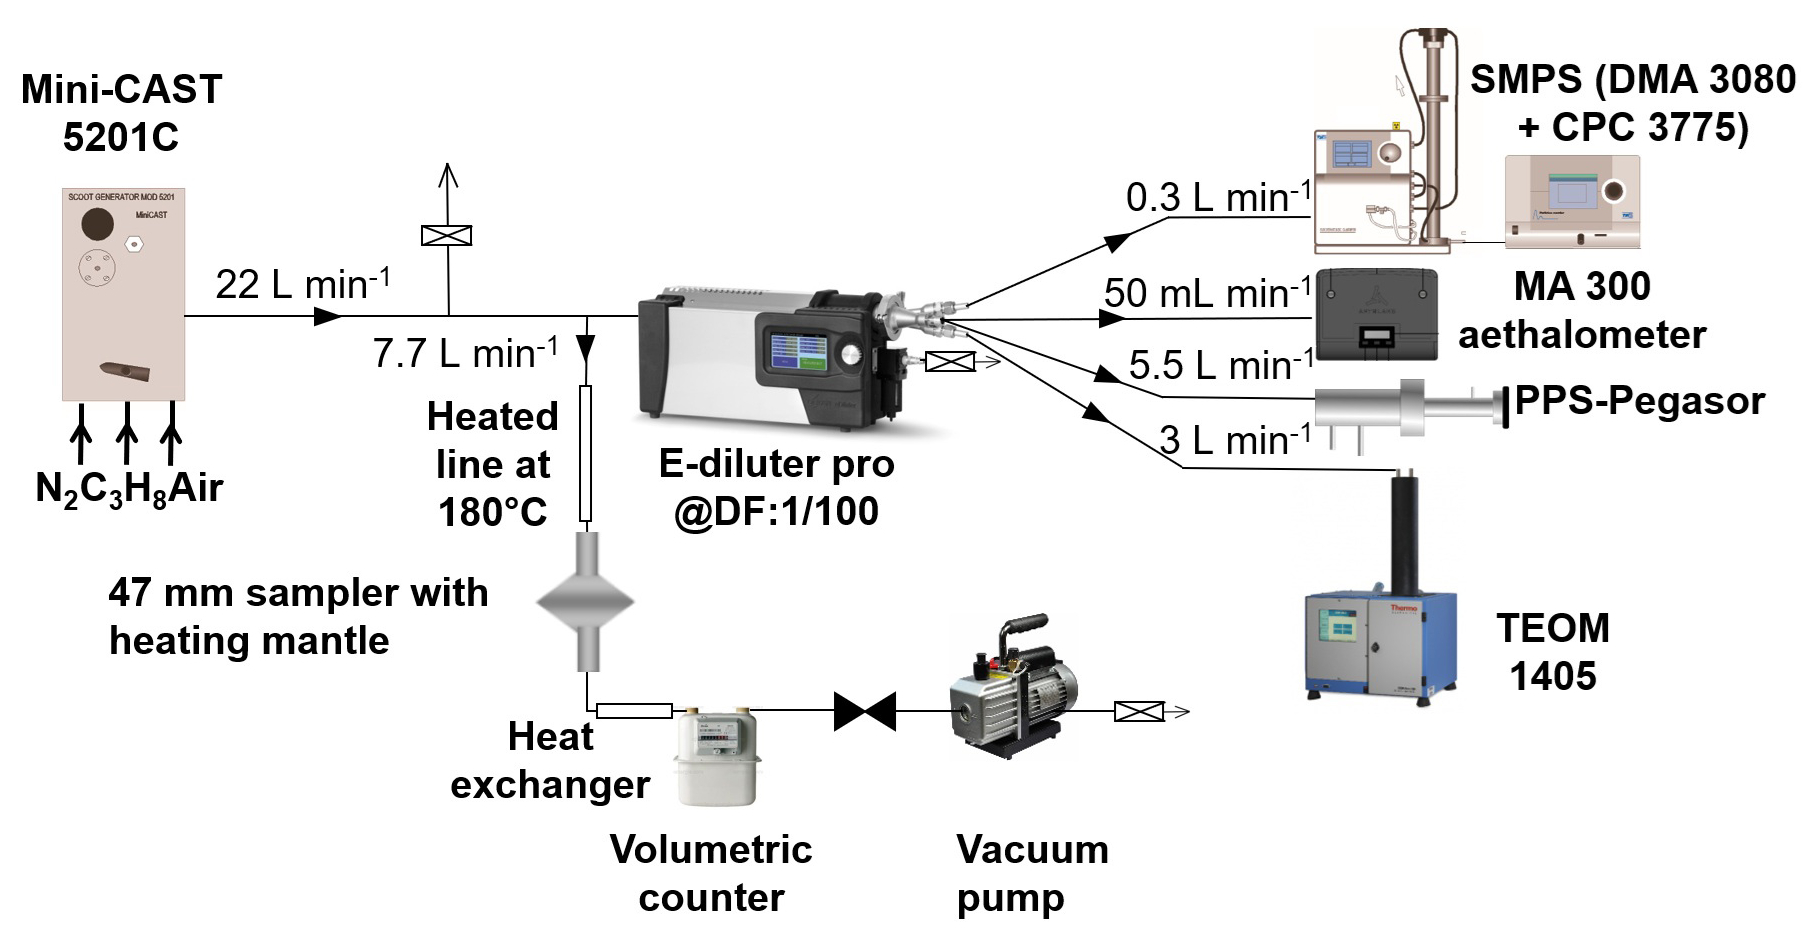
Figure 1Configuration of the experimental bench for intercomparison of mass concentration measurements.
The aerosol source is a Mini-CAST 5201C soot generator, which produces polydisperse soot particles by propane combustion. The principle of soot generation by the Mini-CAST involves an axial laminar diffusion flame, which is quenched by a cold, dry nitrogen flow to stop the combustion process and prevent soot oxidation. A rapid dilution with clean, dry air reduces the soot concentration, thereby limiting particle coagulation. By varying the flow rates of fuel, oxidizing air, and mixing nitrogen, it is possible to modify the characteristics of the flame, particularly its temperature, which affects both the quantity and the properties of the produced soot particles (Moore et al., 2014). As in the study by Marhaba et al. (2019), propane flow is maintained at 60 mL min−1, nitrogen flow at 0 mL min−1, dilution airflow at 20 L min−1, and quenching nitrogen flow at 7 L min−1. Variations in soot production were obtained by varying the oxidation airflow rate from 0.9 up to 1.5 L min−1 (0.9, 1, 1.15, 1.2, 1.25, 1.3, 1.35, and 1.5 L min−1). The measurement points with oxidation airflow rate at 1, 1.15, and 1.5 L min−1 correspond to the CAST3, CAST2, and CAST1 operating points, respectively, in the study of Marhaba et al. (2019). These specific operating points were also chosen for different studies (Bescond et al., 2016; Ouf et al., 2016). During the tests, stable generation points were sought, and before initiating filter sampling, the stability of the concentration production was ensured through measurements taken with online instruments such as the PPS and TEOM. Each measurement point was repeated three times, and the error bars represent the standard deviation of these measurements.
A flexible heated line (1 m long with 6 mm internal diameter) connects the mini-CAST soot generator to the filter sampler and is maintained at 180 °C. This line is dedicated to sampling on quartz fiber filters (Whatman quartz filter, grade QM-H, diam. 47 mm) for ex situ gravimetric measurements and for later analysis. These filters are used for mass quantification of soot concentration during stable generation conditions. Quartz filters are preconditioned by heating at 180 °C in an oven for 1 h to eliminate moisture. They are then weighed and stored with desiccant to prevent reabsorption of humidity. During measurements, the filters are placed in the 47 mm sampler with a 180 °C-temperature-regulated heating jacket surrounding it. The collected mass is determined using a precision balance (Kern ABT 100-5M). The volume of gas passing through the filter is measured using a Gallus gas volumetric counter (see Fig. 1). Between the mass sampler and this Gallus volumetric counter, a heat exchanger cools the gas down to ambient temperature, maintained at 20 °C in the laboratory. By combining the collected mass with the measured gas volume, the soot mass concentration is calculated. This measurement is referred to as “gravimetric mass concentration” in the study.
The Sunset Lab OC/EC field instrument (Sunset Laboratory) has been used for the measurement of the ratio. Filters were analyzed based on the IMPROVE_A thermal protocol (Chow et al., 2001). In this instrument, to separate the organic fraction of carbon (OC) from the elemental fraction (EC), the samples are subjected to various temperature plateaus (up to 850 °C) in a helium inert atmosphere for the OC fraction and in an oxidizing atmosphere for the EC fraction. The formed gases are then transported by the helium flow to a catalytic furnace, where they are oxidized to CO2, then reduced to CH4 for more accurate measurement by a calibrated flame-ionization detector (FID). A thermal–optical correction is applied to separate OC from EC. measurements have been performed on quartz fiber filters. Three punches of 1.5 cm2 were analyzed for each sample.
The second sampling line, after dilution, feeds real-time measurement instruments. The Dekati eDiluter Pro dilution system enables two-stage dilution with a dilution factor set at 100. The first dilution stage is heated, while the second dilution stage operates at room temperature, where the aerosol sample is also cooled in a controlled manner. Both dilution stages are ejector type, with a complementary sweep airflow in the duct. Concentrations downstream of the dilution system are compatible with the measurement ranges of the instruments used: a TEOM for robust measurement of mass concentration, a PPS, and an MA300 Aethalometer for real-time mass concentration measurement, as well as an SMPS for measurement of particle size distribution. The SMPS is composed of a differential mobility analyzer (DMA 3080, TSI), which provides a mobility diameter size selection of particles, and a condensation particle counter (CNC 3775, TSI).
The TEOM (Thermo Scientific 1405) can continuously measure the mass of PM accumulating on a filter mounted upon an inertial microbalance using the tapered element oscillating method at its natural frequency (at 200 Hz). Aerosol is drawn in by a pump connected to the base of the microbalance. Sampled particles retained by the filter increase the mass of the oscillating system, producing a decrease in the natural frequency of vibration. Changes in the frequency of oscillation, which are related to the mass of material accumulating on the filter, are detected in quasi-real-time and converted by a microprocessor into an equivalent PM mass concentration (Allen et al., 1997). The sampled particles are heated at a temperature of 50 °C.
The PPS is a real-time sensor that can be used to provide the mass and number concentration of aerosols in the exhaust of car engines based on electrical measurement. Figure 2 presents the operating principle of the PPS: the device is supplied with clean, dry compressed air. In the first phase, the clean air is ionized by the corona effect and ejected through an orifice (Ntziachristos et al., 2013). Particles are electrically charged by the binding of ions within a zone isolated by a Faraday cage. Only the small number of ions that charge the particle surface are lost to the sensor outlet, where an electrometer is used to measure the “compensation” electrical current. It is related to the particle number concentration and particle size, and Ntziachristos et al. (2004) demonstrated that this instrument provides a measure of the active surface area of the studied aerosol (Rostedt et al., 2014).

The raw current measurement is then used to determine the mass or number concentrations of sampled particles using calibration coefficients dependent on particle size. The remaining free ions with high electrical mobility are eliminated by an ion trap. In addition, the injector design protects the corona needle, and the charged particles are sensed with no need for contact with the sensor, which can be beneficial in these polluted environments (Maricq, 2013). Despite the PPS's ability to track emissions dynamically (at hertz frequency) under high number and mass concentrations, which can be useful for real-time emission monitoring in fire situations, the PPS mass calibration factor was essentially established on automobile emissions with a relatively limited range of size distribution in number (Ntziachristos et al., 2013) and ratios which were not indicated in their study.
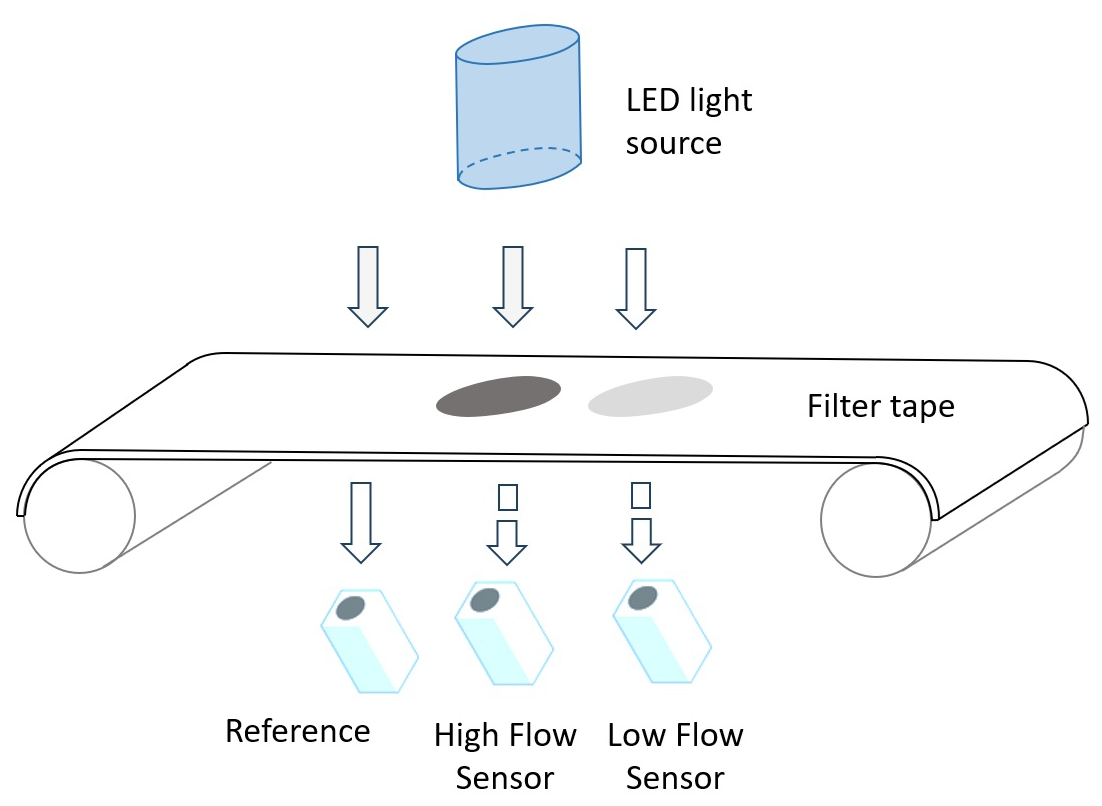
The MA300 Aethalometer (AethLabs, San Francisco) is a real-time portable analyzer that uses the filter-based light absorption principle: the mass concentration measurement is based on the optical attenuation ATN of a light beam passing through a cake of particles collected on a filtering fiber tape. The instrument has five analytical channels that operate at different wavelengths (375, 470, 528, 625, and 880 nm), and the measurement of absorption at 880 nm is interpreted as black carbon (Hansen et al., 1984). The MA300 draws a controlled flow through the collection spot on the filter tape, and when the light attenuation reaches a threshold value, the tape advances automatically.
The ATN is defined (Gundel et al., 1984) as ATN = −100 , with I and I0 being the measured intensity through the loaded spot signal and the reference signal through the empty filter, respectively (see Fig. 3). The instrument measures the transmission of light through the particle-loaded filter, from which the ATN is derived based on its rate of change over time. This attenuation is then converted into an absorption coefficient. Finally, the equivalent black carbon mass concentration is obtained by dividing the absorption coefficient by σMAC, the mass absorption coefficient (MAC) specific to black carbon (Drinovec et al., 2015). With this definition and for the 880 nm wavelength, the deposited equivalent black carbon (eBC) mass concentration is then evaluated as
where S is the collection spot area, ΔATN the change in attenuation during interval Δt, Q the measured flow rate after accounting for the instrument's internal leakage, Δt the time interval between two measurements, Cref the multiple scattering correction factor, and k a compensation parameter for the filter loading effect correction. Since the airflow is measured downstream of the filter, potential leakage may occur and should be accounted for. However, recent studies using the MA300 and MA350 Aethalometers (Chakraborty et al., 2023; Elomaa et al., 2025) considered these leakages to be negligible, as we did in this study.
The filter-based light absorption techniques are subject to measurement artifacts due to scattering on the filter (Weingartner et al., 2003). These empirical parameters are related to the instrument design and filter material (Wu et al., 2024). The Cref parameter considers a multiple-scattering correction factor, which mainly depends on the properties of the filter substrate and the optical characteristics of the aerosol deposited on the filter, with no significant spectral dependence (Drinovec et al., 2015). For the MA300 Aethalometer, the sampling filter tape is composed of polytetrafluoroethylene (PTFE), and the manufacturer calibrated a value of Cref = 1.3. The mass absorption coefficient σMAC at 880 nm wavelength is = 7.8 m2 g−1. The specific attenuation cross-section σATN is wavelength dependent and was taken from the instrument manufacturer's specifications, with values ranging from σATN = 10.12 m2 g−1 for IR at λ = 880 nm up to σATN = 24.069 m2 g−1 for UV at λ = 375 nm. The fixed MAC values used in the Aethalometers may not accurately represent the true MAC of the sampled soot aerosol, as MAC can vary with aerosol composition (Chakraborty et al., 2023), including the ratio, thus introducing uncertainty in the reported eBC concentrations. Sipkens et al. (2025) cite several mechanisms that can explain the variability of MAC between aerosol samples, including intraparticle scattering (the “lensing effect”), the condensation of semi-volatile materials on soot, and variations in particle size. This recent study evaluated operational uncertainties through an intercomparison of five Aethalometers. The results showed that these uncertainties scale with mass concentration, with inter-device multiplicative errors of around 10 % under favorable conditions (Sipkens et al., 2025), such as extended measurement periods or high aerosol loadings. One of the identified drawbacks of Aethalometers is the overestimation of BC concentration on a new filter and the underestimation of it when the loading is high, with the most accurate concentrations being obtained on slightly loaded filters (Arnott et al., 2005; Collaud Coen et al., 2010). Several models have been proposed to correct this loading effect when processing Aethalometers data, such as the Weingartner et al. (2003) and Virkkula et al. (2007) models, which have most frequently been used for loading effect compensation. Drinovec et al. (2015) developed a real-time method to compensate for nonlinearity with a high time resolution by using a double collection on two spots in parallel at different flow rates. In this method, the k constant is evaluated for each wavelength, and this so-called “dual-spot technology” permits users to eliminate the data artifact due to filter loading. In this study, the MA300 Aethalometer employs the dual-spot technology to eliminate data distortions caused by filter loading. The sensor applies a variant of the dual-spot correction (Chakraborty et al., 2023; Mendoza et al., 2024), with the parameter k evaluated using Eq. (2):
where L and H represent the low and high flow rates used in this dual-spot technology, respectively.
Aethalometers have been used to monitor black carbon concentrations in urban areas (Blanco-Donado et al., 2022), assess biomass burning contribution to emissions in urban areas (Favez et al., 2007), and measure personal exposure in working environments (Gren et al., 2022). However, the ability of Aethalometers to accurately quantify soot emissions remains an active research topic. The recent study by Aakko-Saksa et al. (2022) over a wide ship exhaust test matrix, obtained with different fuels, engines, and emission control devices, showed that measurement with an Aethalometer could lead to overestimation of BC emissions.
Figure 4 shows the evolution of the reference (TEOM) mass concentration (left) and the number size distribution measured by the SMPS (right) as a function of oxidation air. When changing the oxidation airflow rate, the main parameter that varies is the fuel–air equivalence ratio Φ, describing the flame in terms of fuel-lean (Φ<1), stoichiometric (Φ=1), and fuel-rich (Φ>1) conditions (Marhaba et al., 2019).
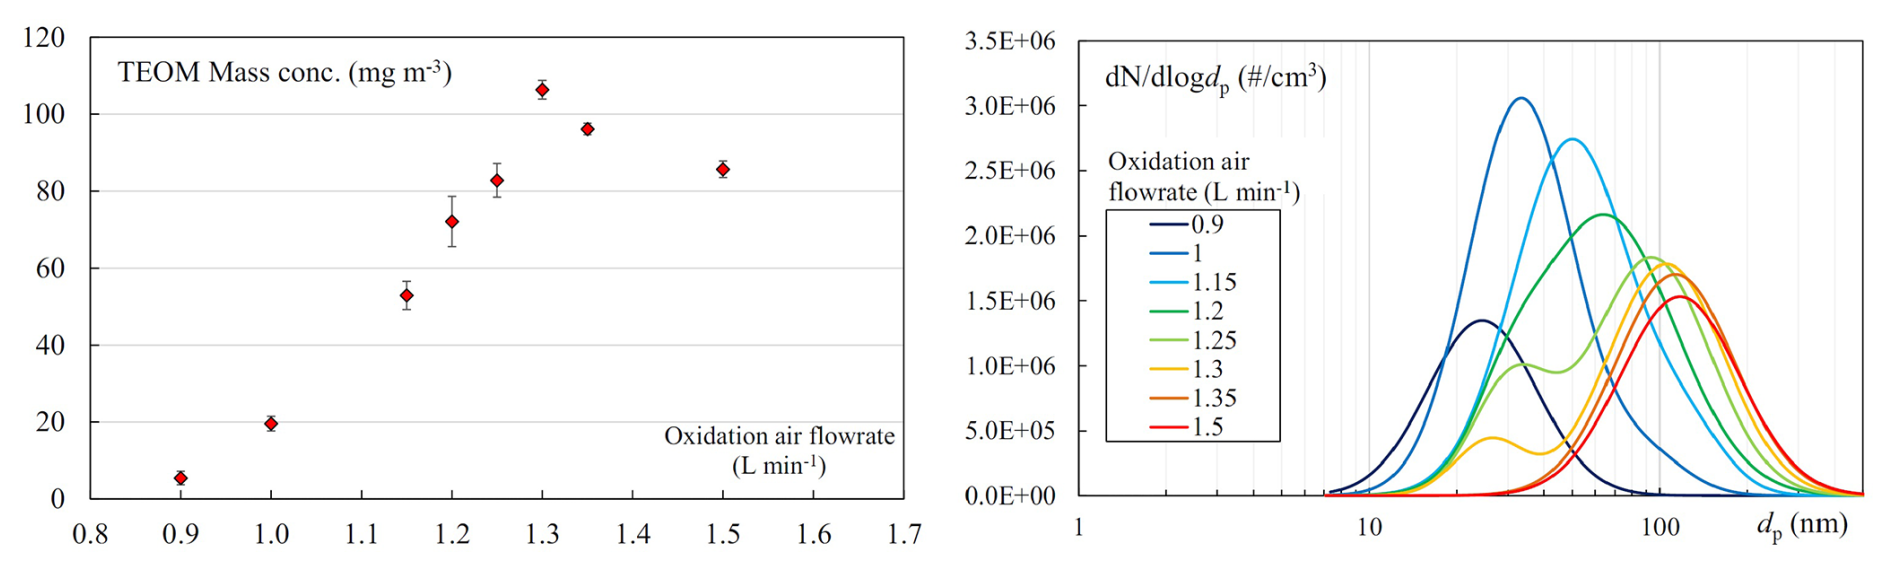
Figure 4Evolution of the reference (TEOM) mass concentration (left) and the number size distribution (right) as a function of oxidation air.
Table 1Main characteristics of the number size distributions for each of the operating points studied.

For oxidation air of 0.9 L min−1, the size distribution of generated soot particles is monomodal with a number median diameter of 23.3 nm and the lowest mass concentration of 5.44 mg m−3. Moore et al. (2014) showed that by continuously increasing the oxidation airflow rate, the volumetric soot production reaches a maximum at a value close to 1.3 L min−1 when the adiabatic temperature of the flame reaches its maximum, with a strong impact on the ratio. In our experiments, intermediate values of the oxidation air were thus added. When increasing the oxidation airflow rate, the produced mass concentration increases up to a maximum of 106.39 mg m−3 for generated soot, corresponding to an oxidation airflow rate of 1.3 L min−1. For this generation point, a bimodal size distribution is obtained. For higher-oxidation air, a decrease in the mass concentration is then observed. When reaching 1.5 L min−1, the size distribution becomes monomodal again, with the highest modal median diameter of 113.4 nm and a mass concentration of 85.68 mg m−3. The measured particle size distributions were fitted with the sum of two lognormal distributions that correspond to an ultrafine and a fine mode. We describe in Table 1 the nature of the distribution and report, for each operating point, the median diameters of the two modes and their respective intensities expressed as a percentage. We also indicate the number median diameter of the measured distribution.
Figure 5 shows a parity curve of the mass concentrations measured by the TEOM as a function of the gravimetric reference measurements. Over a 2-decade-long mass concentration range, mass concentrations measured by the TEOM remain within a 10 % interval of the gravimetric reference for all eight tested oxidation airflow rates (values indicated next to each data point, in L min−1). Based on ISO 16450, we evaluated the slope and offset of the orthogonal assessment. The linear regression established between the reference and tested measurements satisfies the ISO 16450 validation criteria, with the slope b statistically compatible with unity () and the intercept close to zero and statistically compatible with it (), where ub and ua are the standard uncertainties associated with the slope and intercept, respectively. Therefore, we have established the equivalence between the TEOM and the gravimetric measurement. This shows that the measurement protocol, including the 180 °C sampling line for the standard filter method and the dilution upstream of the tested instruments, does not significantly affect the mass measurements in either branch of the experiment. Finally, we concluded that the TEOM should be considered the reference measurement, being online in the exact same conditions downstream of the dilution system. For this uncertainty evaluation, we followed ISO 15767 to assess the uncertainty related to weighing; evaluated the uncertainty on the sampled volume; and applied uncertainty propagation to estimate the overall uncertainty, which combines measurement uncertainty with the uncertainty associated with repeatability based on the three repetitions. The error bars shown in Fig. 5 for gravimetric mass concentration result from this analysis.
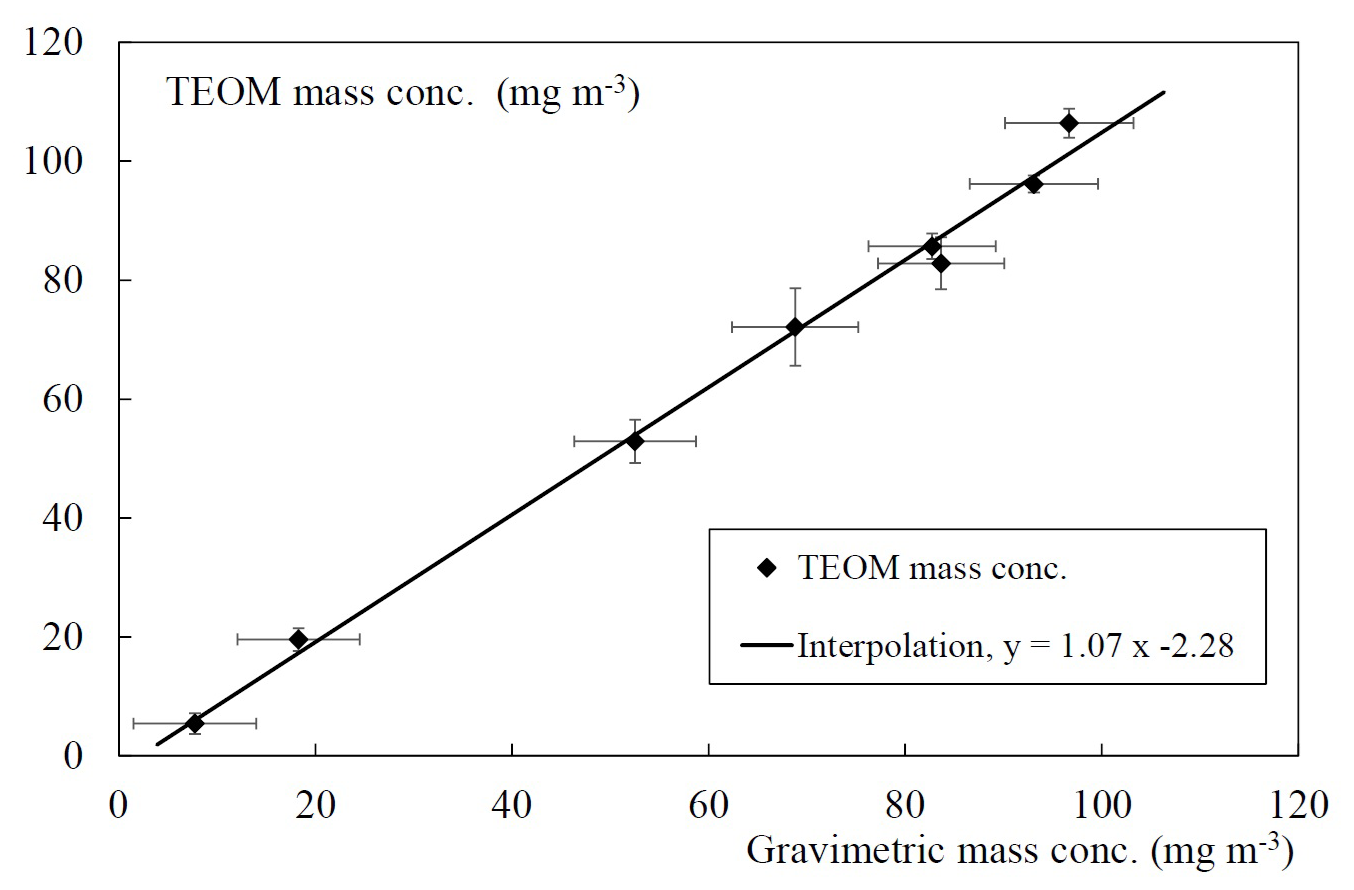
Figure 5Parity curve of measured TEOM mass concentrations as a function of the gravimetric reference measurements, with the corresponding interpolation.
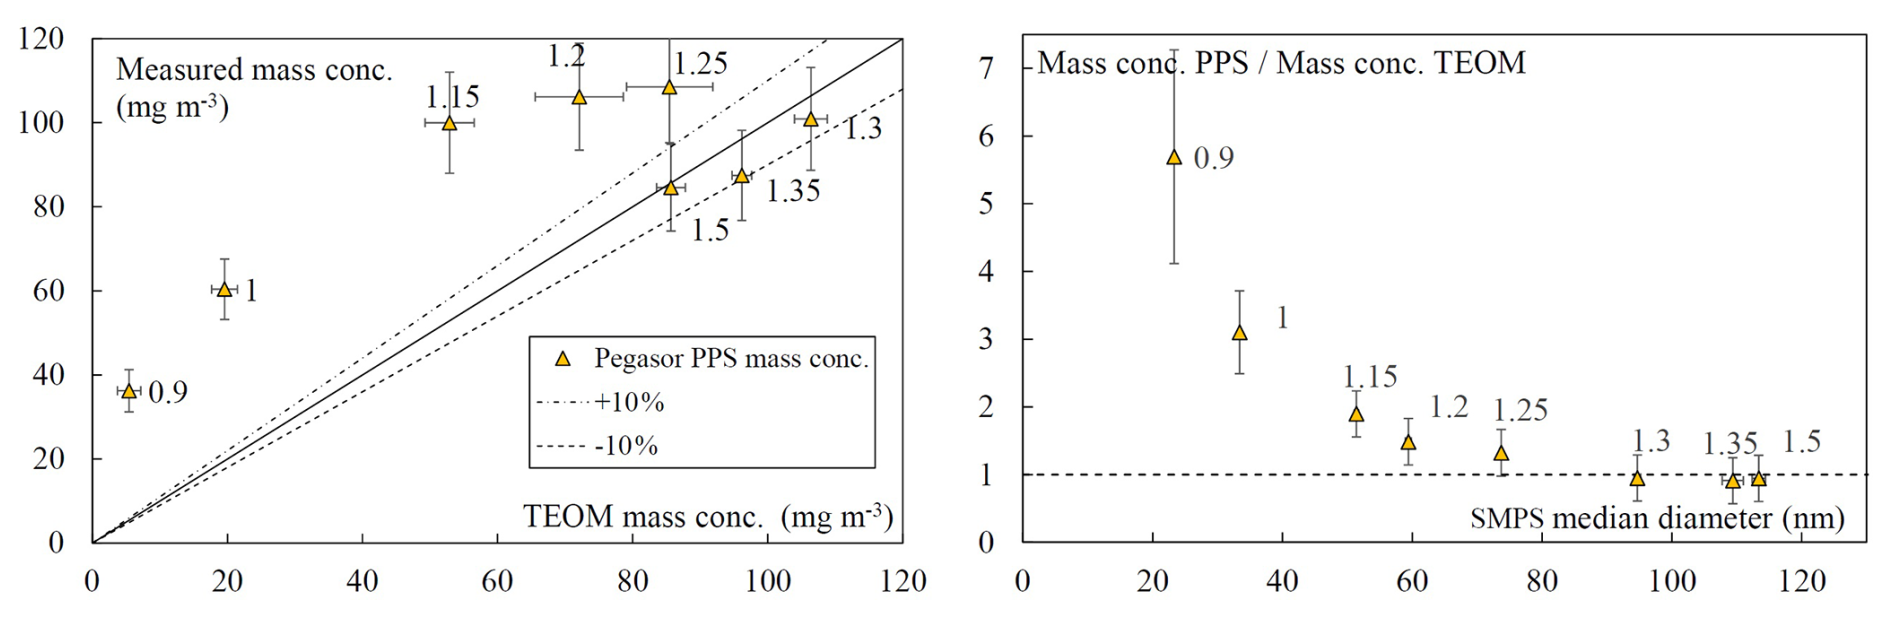
Figure 6Mass concentrations measured by the PPS as a function of the TEOM reference measurements (left) and ratio of mass concentration measured by PPS and TEOM as a function of the median diameter (right).
Figure 6 (left) shows the mass concentrations measured by the PPS as a function of those measured by the TEOM for soot produced with the different oxidation airflow rates tested. Figure 6 (right) shows the evolution of the mass concentration ratio measured by the PPS and by the TEOM as a function of the SMPS-measured number median diameter. This ratio logically increases as the median diameter decreases. Indeed, the PPS estimates the particle mass based on its active surface area (Ntziachristos et al., 2004). For spherical particles with a constant diameter, the mass is proportional to the cube of the particle diameter, while the surface area scales with the square of the diameter, resulting in a surface to mass ratio that varies as . With the calibration performed on polydisperse soot aerosol produced by an engine, the mass is correctly estimated for median diameters close to 80 nm.
The raw PPS measurement becomes reliable for soot generated with an oxidation airflow rate in the limited range of 1.3 to 1.5 L min−1, where the mass concentration ratio between the PPS and the TEOM reference method remains nearly constant and close to 1, regardless of the measured median diameter. The mass concentration Cm,PPS raw results have been corrected using Eq. (3) (Pandis et al., 1991):
Table 2Properties, true density, and effective density ρeff,100 of considered emitted soot particles.

Here, ds,Fuchs is the diameter of the Fuchs active surface, evaluated from the size distribution for each measurement point (evaluated values are reported in Table 2), x(dp)=1.39 in the transition regime (30 to 150 nm) (Jung and Kittelson, 2005), and d0 is a reference diameter taken arbitrarily equal to 100 nm.
We also calculated the mass concentration based on the number size distribution measured by the SMPS. For this evaluation, we initially considered a constant so-called “true density”, independent of the particle mobility diameter but varying with the ratio and therefore dependent on the selected operating point of the Mini-CAST. Indeed, as reported by several studies (Ouf et al., 2019; Park et al., 2004), the density of combustion soot particles decreases when the organic fraction increases from the value of the elemental carbon density ρEC (close to 2000 kg m−3) down to the value of the organic carbon density ρOC. For diesel soot particles, Park et al. (2004) proposed the evaluation of the true aggregate density through a mixing law based on the mass fraction of organic carbon (), where ρEC and ρOC are the densities of elemental and organic carbon, respectively, and expressed as
Based on data from a wide range of liquid, gaseous, or solid fuel combustion soot, Ouf et al. (2019) suggested that a constant true density could be considered with a mean value of ρEC = 1834 kg m−3 for soot with OC contents below 5 %. In the absence of metallic compounds, which is the case for the Mini-CAST soot, they also proposed considering three different ranges of the true density as a function of x, the organic carbon to total carbon ratio: for low-OC contents (i.e., below 5 %) and high-OC contents (i.e., above 20 %), they consider the constant true density values ρEC and ρOC, respectively. For intermediate-OC-content values between these two reference points, a linear mixing law as a function of x has been suggested by Ouf et al. (2019). Using this zone-based approach, we observed an underestimation of soot mass for almost all measurement points. Therefore, we considered using the Park mixing model (Eq. 4), with the values ρEC = 1834 kg m−3 for x=0 and ρOC = 1285 kg m−3, as suggested by Ouf et al. (2019). We report in Table 2 the values obtained for the ratios as determined by thermal–optical analysis and the corresponding true densities calculated with the Park mixing model (Eq. 4) that were used to evaluate the SMPS true density mass concentrations reported in Fig. 8. The measured values of the organic fraction contained in soot compare well with those obtained in Marhaba et al. (2019) for equivalent operating conditions of the Mini-CAST.
For the considered points named CAST1, CAST2, and CAST3 in Marhaba et al. (2019), they reported ratio values of 87 %, 46.8 %, and 4.1 %, respectively, with CAST3 corresponding to 1 L min−1, CAST2 to 1.15 L min−1, and CAST1 to 1.5 L min−1 of oxidation airflow. In the same operating conditions, we measured corresponding values of 56.7 %, 46 %, and 6.2 %, respectively. For CAST3, our measured value is significantly lower, while the two other points are coherent. However, as highlighted by Moore et al. (2014), soot production conditions can vary with parameters other than the overall ratio of the flame, and variations in mode size or ratio have already been observed between different studies using different Cast or Mini-CAST generators. This makes it difficult to directly compare data between studies conducted with this type of generator and justifies the necessity of carrying out thermal–optical analysis of the organic content of soot.
As can be observed in Fig. 8 (right), for the mass concentrations determined from SMPS size distributions and the true density, as well as for the evaluations based on the corrected PPS, we observe good agreement with the mass concentration obtained from the TEOM; except for a very limited number of points and at very low mass concentration measurements, both mass concentrations evaluated from the “SMPS, true density” and the PPS after correction fall within a 10 % interval of the TEOM reference mass concentration.
Furthermore, other approaches have been developed to estimate an “effective density” of soot particles, considering their fractal nature. These methods are based on so-called tandem techniques (Ghazi et al., 2013; Maricq and Xu, 2004; Tavakoli and Olfert, 2014) for evaluating this effective density. Based on an analysis of various data sets available in the literature, Olfert and Rogak (2019) proposed a model that expresses the effective density as a function of the mobility diameter:
with dm being the aggregate mobility diameter, m its mass, and ρeff,100 the effective density for aggregates with a 100 nm reference scale. This model allows the evaluation of the decrease in effective density with the mobility diameter dm of soot aggregates. The data used to develop this model originate primarily from studies of particles produced by internal combustion engines or gas turbines, and a value of 510 kg m−3 for the effective density at 100 nm was proposed by Olfert and Rogak (2019). However, Yon et al. (2015) reported higher effective density values at 100 nm for the Mini-CAST, with values ranging from 1100 to 765 kg m−3 for oxidation airflow rates between 1 and 1.5 L min−1. Although only three operating points were investigated, the decrease in effective density with increasing oxidation airflow rate was found to be linear. Additionally, we observed that the decay in with oxidation airflow rate is also linear. We therefore conducted a “best-fit” identification procedure to obtain the values of ρeff,100, the density at 100 nm that would allow us to recover the TEOM reference mass concentrations from the SMPS analysis together with the Olfert and Rogak (2019) model. We obtained a set of values ρeff,100 from the best-fit analysis (see Fig. 7) and observed that the change in this density at 100 nm with the ratio can be represented by a linear interpolation, expressed as
with x being the ratio.
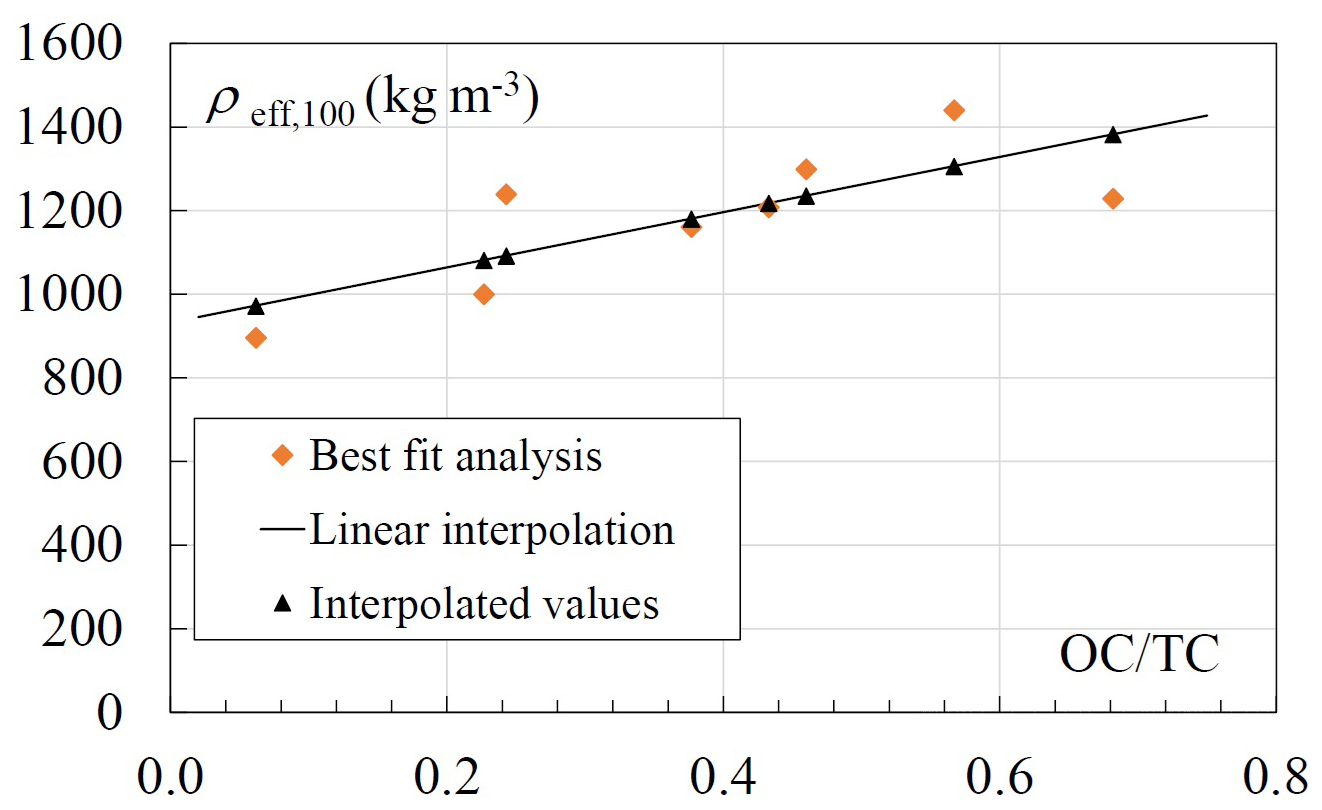
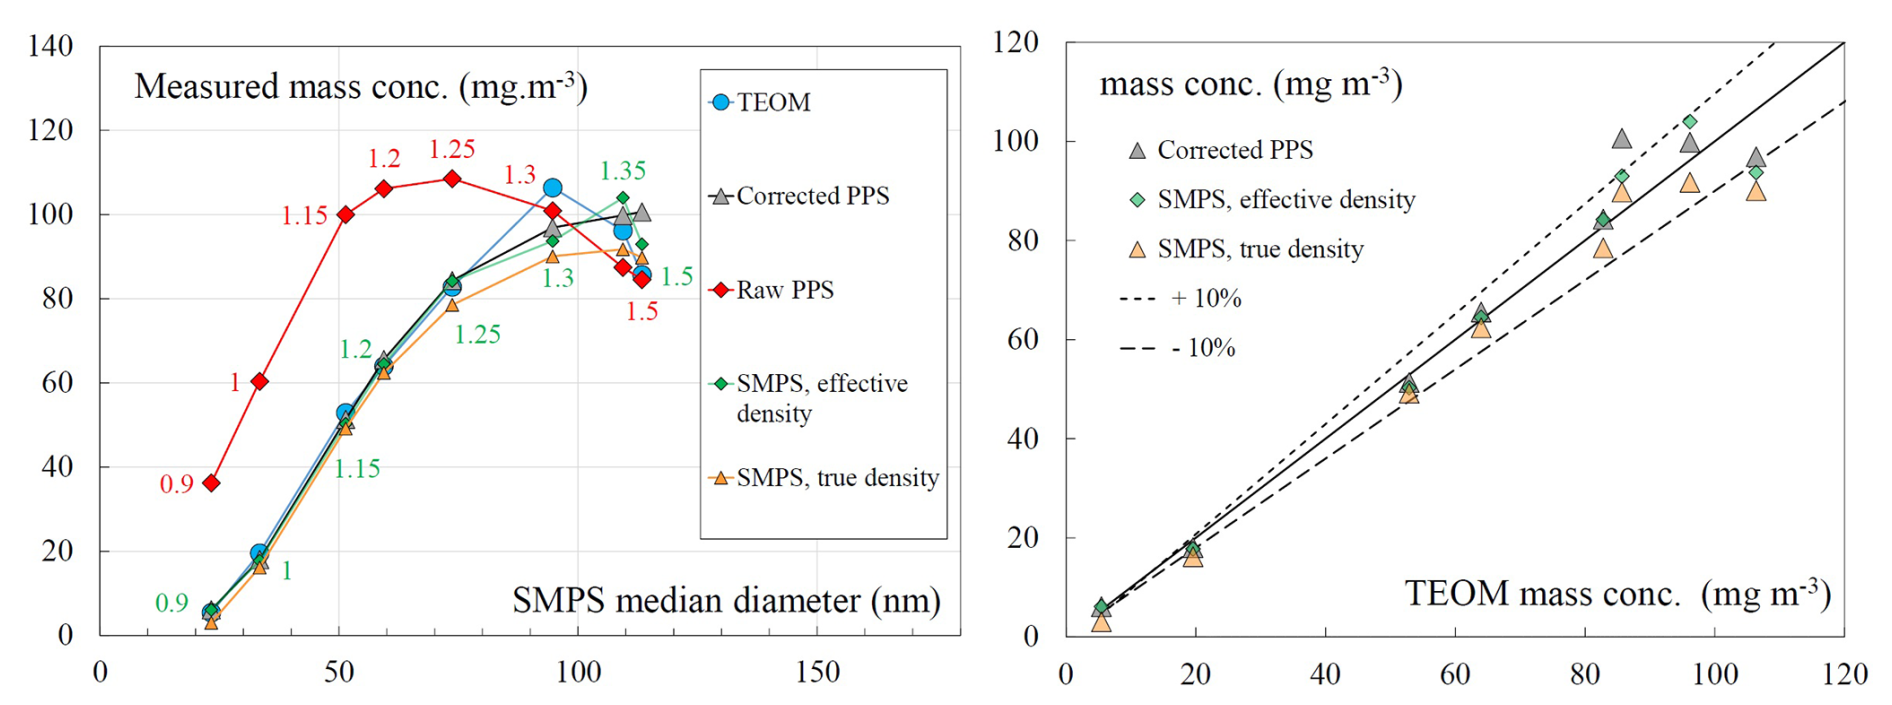
Figure 8Mass concentration evaluations as a function of the median diameter (left) and comparison of PPS and SMPS mass concentration evaluations with TEOM measurements (right).
From Eq. (5), interpolated values of ρeff,100 can be evaluated. These effective densities at 100 nm determined through this procedure are reported in Table 2, and the corresponding mass concentrations, labeled “SMPS effective density”, are shown in Fig. 8: the use of this effective density model combined with the measured size distributions results in a good estimation of the mass concentration.
Figure 9 shows the mass concentrations measured by the MA300 for ultraviolet and infrared wavelengths as a function of those measured by the TEOM reference method for soot produced with the different oxidation airflow rates tested (value indicated next to each measuring point, in L min−1). For oxidation air of 0.9 L min−1, the generated soot is composed of 68 % organic carbon. This percentage drops to around 6 % for that generated with 1.5 L min−1 oxidation air.
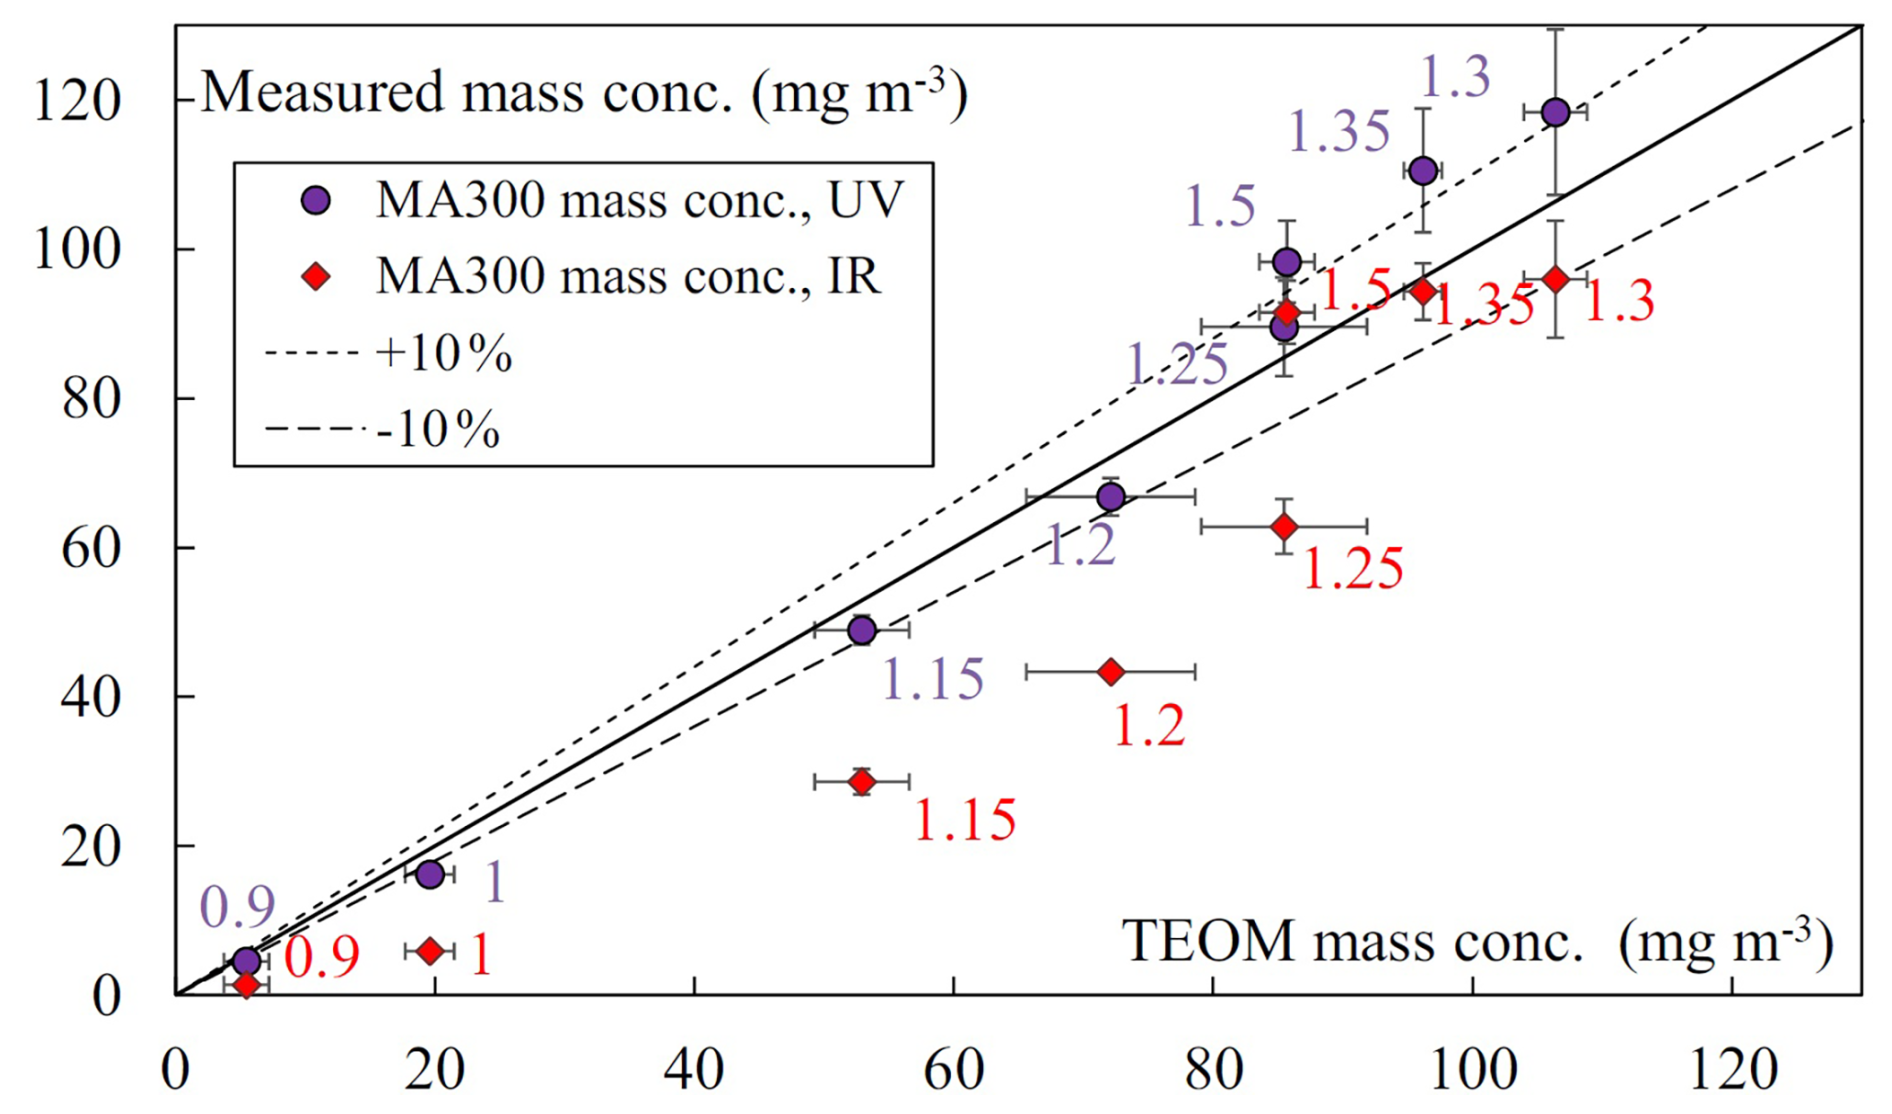
Figure 9Mass concentrations measured by the MA300 as a function of the TEOM reference measurements.
The equivalent black carbon (eBC) mass concentration evaluated by the MA300 with Eq. (1) is based on a constant value of the mass absorption coefficient σMAC correction. We observe good linearity of the measured mass concentration in the UV range for an oxidation airflow rate below 1.25 L min−1, thus corresponding to ratios above 38 %. In the same way, the IR mass concentration determination is linear for an oxidation airflow rate above 1.3 L min−1, corresponding to ratios below 24.3 %, which are soot particles predominantly made up of elemental carbon. In both UV and IR cases, the deviation from linearity may be a consequence of changes in the MAC value and the multiple-scattering parameter.
For this intercomparison of instruments and measurement techniques for the evaluation of soot mass concentration, we used a Mini-CAST generator commonly employed in laboratory experiments to produce soot particles under stable and controlled conditions. This generator allows us to generate soot that is representative of that emitted by internal combustion engines, in fire situations, or during biomass combustion. By significantly and continuously varying one of the Mini-CAST parameters, we were able to generate a set of eight soot particle measurement points, with significant variations in their organic to total carbon ratio (), ranging from 6 % to 68 %, and in their size distributions, while also achieving mass concentrations covering values from 7 to 96 mg m−3. Over a mass concentration range spanning almost 2 decades, we obtained a very good correlation between the gravimetric method using filter sampling, the real-time online methods with the reference TEOM instrument, and the offline thermal–optical analysis, which also provided access to the fraction. Based on the electrical charging of the aerosol particles, the Pegasor particle sensor (PPS) analyzer provides real-time measurement of the mass concentration at 1 Hz frequency but with a response that depends on the particle size distribution. We established that with an appropriate correction based on the aerosol active surface, the PPS can also provide relevant quantitative information on the soot mass concentration. Finally, the MA300 Aethalometer was evaluated over a wide range of ratios. In this instrument, the measurement technique is based on the attenuation of a light beam with different wavelengths through a particle cake accumulating on a filter. This attenuation is dependent on the wavelength and the ratio. We were able to determine a limit in soot organic content, with a maximum value of = 24 % for which the infrared measurement allows quantification of the total mass concentration, rather than only the so-called black carbon fraction. We also established that the ultraviolet wavelength, usually used to quantify brown carbon, can also provide an evaluation of the total mass concentration when the organic carbon ratios are sufficiently high (at least higher than 38 %). For the analysis of soot mass concentration based on SMPS size distribution measurements, we applied two methods: one based on a “true density” constant for each operating point of the Mini-CAST and a second one that accounts for the effective density of the aggregates, considering both their mobility diameter and the ratio. Originally, in the considered model of Olfert and Rogak (2019), the effective density of aggregates is calculated based on their mobility diameter and a constant reference effective density at 100 nm. In this work, we propose considering that this reference effective density is a function of the ratio. This approach – considering both the ratio and the mobility diameter – results in mass concentrations that are in good agreement with the reference TEOM measurements. The results of this study show that the selected operating points led to simultaneous variations in mass concentration, size distribution, and the ratio. It would be relevant, by varying other gas flow rates of the Mini-CAST or aerosol dilution conditions, to better decouple the parameters under investigation in future studies.
The raw data can be provided upon request to the authors.
BS and AK planned the measurement campaign; BS, AK, and GP performed the measurements; BS, AK, and GP analyzed the data; BS and AK wrote the manuscript draft; and BS and AK reviewed and edited the paper.
The contact author has declared that none of the authors has any competing interests.
Publisher's note: Copernicus Publications remains neutral with regard to jurisdictional claims made in the text, published maps, institutional affiliations, or any other geographical representation in this paper. The authors bear the ultimate responsibility for providing appropriate place names. Views expressed in the text are those of the authors and do not necessarily reflect the views of the publisher.
The authors thank the reviewers for their contributions, which improved this paper. They also thank François Gensdarmes for constructive discussions.
This paper was edited by Attila Nagy and reviewed by three anonymous referees.
Aakko-Saksa, P., Kuittinen, N., Murtonen, T., Koponen, P., Aurela, M., Järvinen, A., Teinilä, K., Saarikoski, S., Barreira, L. M. F., Salo, L., Karjalainen, P., Ortega, I. K., Delhaye, D., Lehtoranta, K., Vesala, H., Jalava, P., Rönkkö, T., and Timonen, H.: Suitability of different methods for measuring black carbon emissions from marine engines, Atmosphere (Basel), 13, https://doi.org/10.3390/atmos13010031, 2022.
Allen, G., Sioutas, C., Koutrakis, P., Reiss, R., Lurmann, F. W., and Roberts, P. T.: Evaluation of the TEOM® Method for Measurement of Ambient Particulate Mass in Urban Areas, J. Air Waste Manage. Assoc., 47, 682–689, https://doi.org/10.1080/10473289.1997.10463923, 1997.
Arnott, W. P., Hamasha, K., Moosmüller, H., Sheridan, P. J., and Ogren, J. A.: Towards Aerosol Light-Absorption Measurements with a 7-Wavelength Aethalometer: Evaluation with a Photoacoustic Instrument and 3-Wavelength Nephelometer, Aerosol Sci. Tech., 39, 17–29, https://doi.org/10.1080/027868290901972, 2005.
Bescond, A., Yon, J., Ouf, F. X., Rozé, C., Coppalle, A., Parent, P., Ferry, D., and Laffon, C.: Soot optical properties determined by analyzing extinction spectra in the visible near-UV: Toward an optical speciation according to constituents and structure, J. Aerosol Sci., 101, 118–132, https://doi.org/10.1016/j.jaerosci.2016.08.001, 2016.
Blanco-Donado, E. P., Schneider, I. L., Artaxo, P., Lozano-Osorio, J., Portz, L., and Oliveira, M. L. S.: Source identification and global implications of black carbon, Geoscience Frontiers, 13, 101149, https://doi.org/10.1016/J.GSF.2021.101149, 2022.
Chakraborty, M., Giang, A., and Zimmerman, N.: Performance evaluation of portable dual-spot micro-aethalometers for source identification of black carbon aerosols: application to wildfire smoke and traffic emissions in the Pacific Northwest, Atmos. Meas. Tech., 16, 2333–2352, https://doi.org/10.5194/amt-16-2333-2023, 2023.
Chow, J. C., Watson, J. G., Crow, D., Lowenthal, D. H., and Merrifield, T.: Comparison of IMPROVE and NIOSH Carbon Measurements, Aerosol Science and Technology, 34, 23–34, https://doi.org/10.1080/02786820119073, 2001.
Collaud Coen, M., Weingartner, E., Apituley, A., Ceburnis, D., Fierz-Schmidhauser, R., Flentje, H., Henzing, J. S., Jennings, S. G., Moerman, M., Petzold, A., Schmid, O., and Baltensperger, U.: Minimizing light absorption measurement artifacts of the Aethalometer: evaluation of five correction algorithms, Atmos. Meas. Tech., 3, 457–474, https://doi.org/10.5194/amt-3-457-2010, 2010.
Drinovec, L., Močnik, G., Zotter, P., Prévôt, A. S. H., Ruckstuhl, C., Coz, E., Rupakheti, M., Sciare, J., Müller, T., Wiedensohler, A., and Hansen, A. D. A.: The “dual-spot” Aethalometer: an improved measurement of aerosol black carbon with real-time loading compensation, Atmos. Meas. Tech., 8, 1965–1979, https://doi.org/10.5194/amt-8-1965-2015, 2015.
Elomaa, J. T., Luoma, K., Harni, S. D., Virkkula, A., Timonen, H., and Petäjä, T.: The applicability and challenges of black carbon sensors in monitoring networks, Aerosol Research, 3, 293–314, https://doi.org/10.5194/ar-3-293-2025, 2025.
Favez, O., Cachier, H., Sciare, J., and Le Moullec, Y.: Characterization and contribution to PM2.5 of semi-volatile aerosols in Paris (France), Atmos. Environ., 41, 7969–7976, https://doi.org/10.1016/j.atmosenv.2007.09.031, 2007.
Ghazi, R., Tjong, H., Soewono, A., Rogak, S. N., and Olfert, J. S.: Mass, mobility, volatility, and morphology of soot particles generated by a mckenna and inverted burner, Aerosol Science and Technology, 47, 395–405, https://doi.org/10.1080/02786826.2012.755259, 2013.
Gren, L., Krais, A. M., Assarsson, E., Broberg, K., Engfeldt, M., Lindh, C., Strandberg, B., Pagels, J., and Hedmer, M.: Underground emissions and miners' personal exposure to diesel and renewable diesel exhaust in a Swedish iron ore mine, Int. Arch. Occup. Environ. Health, 95, 1369–1388, https://doi.org/10.1007/s00420-022-01843-x, 2022.
Gundel, L. A., Dod, R. L., Rosen, H., and Novakov, T.: The relationship between optical attenuation and black carbon concentration for ambient and source particles, Science of The Total Environment, 36, 197–202, https://doi.org/10.1016/0048-9697(84)90266-3, 1984.
Hansen, A. D. A., Rosen, H., and Novakov, T.: The aethalometer — An instrument for the real-time measurement of optical absorption by aerosol particles, Science of The Total Environment, 36, 191–196, https://doi.org/10.1016/0048-9697(84)90265-1, 1984.
Jung, H. and Kittelson, D. B.: Characterization of aerosol surface instruments in transition regime, Aerosol Science and Technology, 39, 902–911, https://doi.org/10.1080/02786820500295701, 2005.
Kort, A., Ouf, F. X., Gelain, T., Malet, J., Lakhmi, R., Breuil, P., and Viricelle, J. P.: Quantification of soot deposit on a resistive sensor: Proposal of an experimental calibration protocol, J. Aerosol Sci., 156, https://doi.org/10.1016/j.jaerosci.2021.105783, 2021.
Kort, A., Ouf, F. X., Lakhmi, R., Gelain, T., Malet, J., Breuil, P., and Viricelle, J. P.: An Innovative Method for Soot Deposit Quantification Using a CO2 Sensor: Application to Fire Studies in Research Facilities, J. Aerosol Sci., 164, https://doi.org/10.1016/j.jaerosci.2022.106005, 2022.
Marhaba, I., Ferry, D., Laffon, C., Regier, T. Z., Ouf, F. X., and Parent, P.: Aircraft and MiniCAST soot at the nanoscale, Combust. Flame, 204, 278–289, https://doi.org/10.1016/j.combustflame.2019.03.018, 2019.
Maricq, M. M.: Monitoring Motor vehicle pm emissions: An evaluation of three portable low-cost aerosol instruments, Aerosol Science and Technology, 47, 564–573, https://doi.org/10.1080/02786826.2013.773394, 2013.
Maricq, M. M. and Xu, N.: The effective density and fractal dimension of soot particles from premixed flames and motor vehicle exhaust, J. Aerosol Sci., 35, 1251–1274, https://doi.org/10.1016/j.jaerosci.2004.05.002, 2004.
Mendoza, D. L., Hill, L. D., Blair, J., and Crosman, E. T.: A Long-Term Comparison between the AethLabs MA350 and Aerosol Magee Scientific AE33 Black Carbon Monitors in the Greater Salt Lake City Metropolitan Area, Sensors, 24, https://doi.org/10.3390/s24030965, 2024.
Moore, R. H., Ziemba, L. D., Dutcher, D., Beyersdorf, A. J., Chan, K., Crumeyrolle, S., Raymond, T. M., Thornhill, K. L., Winstead, E. L., and Anderson, B. E.: Mapping the operation of the miniature combustion aerosol standard (Mini-CAST) soot generator, Aerosol Science and Technology, 48, 467–479, https://doi.org/10.1080/02786826.2014.890694, 2014.
Ntziachristos, L., Giechaskiel, B., Ristimäki, J., and Keskinen, J.: Use of a corona charger for the characterisation of automotive exhaust aerosol, J. Aerosol Sci., 35, 943–963, https://doi.org/10.1016/j.jaerosci.2004.02.005, 2004.
Ntziachristos, L., Amanatidis, S., Samaras, Z., Janka, K., and Tikkanen, J.: Application of the Pegasor Particle Sensor for the Measurement of Mass and Particle Number Emissions, SAE Int. J. Fuels Lubr., 6, 521–531, https://doi.org/10.4271/2013-01-1561, 2013.
Olfert, J. and Rogak, S.: Universal relations between soot effective density and primary particle size for common combustion sources, Aerosol Sci. Tech., 53, 485–492, https://doi.org/10.1080/02786826.2019.1577949, 2019.
Ouf, F. X., Parent, P., Laffon, C., Marhaba, I., Ferry, D., Marcillaud, B., Antonsson, E., Benkoula, S., Liu, X. J., Nicolas, C., Robert, E., Patanen, M., Barreda, F. A., Sublemontier, O., Coppalle, A., Yon, J., Miserque, F., Mostefaoui, T., Regier, T. Z., Mitchell, J. B. A., and Miron, C.: First in-flight synchrotron X-ray absorption and photoemission study of carbon soot nanoparticles, Sci. Rep., 6, https://doi.org/10.1038/srep36495, 2016.
Ouf, F. X., Bourrous, S., Fauvel, S., Kort, A., Lintis, L., Nuvoli, J., and Yon, J.: True density of combustion emitted particles: A comparison of results highlighting the influence of the organic contents, J. Aerosol Sci., 134, 1–13, https://doi.org/10.1016/j.jaerosci.2019.04.007, 2019.
Pandis, S. N., Baltensperger, U., Wolfenbarger, J. K., and Seinfeld, J. H.: Inversion of aerosol data from the epiphaniometer, J. Aerosol Sci., 22, 417–428, https://doi.org/10.1016/0021-8502(91)90002-Y, 1991.
Park, K., Kittelson, D. B., and McMurry, P. H.: Structural properties of diesel exhaust particles measured by Transmission Electron Microscopy (TEM): Relationships to particle mass and mobility, Aerosol Science and Technology, 38, 881–889, https://doi.org/10.1080/027868290505189, 2004.
Rostedt, A., Arffman, A., Janka, K., Yli-Ojanperä, J., and Keskinen, J.: Characterization and response model of the PPS-M aerosol sensor, Aerosol Science and Technology, 48, 1022–1030, https://doi.org/10.1080/02786826.2014.951023, 2014.
Sipkens, T. A., Corbin, J. C., Chen, K., Rivellini, L.-H., Abbatt, J., and Olfert, J. S.: Quantitative uncertainty and post-processing for micro-aethalometers measuring black carbon, EGUsphere [preprint], https://doi.org/10.5194/egusphere-2025-4209, 2025.
Tavakoli, F. and Olfert, J. S.: Determination of particle mass, effective density, mass-mobility exponent, and dynamic shape factor using an aerodynamic aerosol classifier and a differential mobility analyzer in tandem, J. Aerosol Sci., 75, 35–42, https://doi.org/10.1016/j.jaerosci.2014.04.010, 2014.
Virkkula, A., Mäkelä, T., Hillamo, R., Yli-Tuomi, T., Hirsikko, A., Hämeri, K., and Koponen, I. K.: A simple procedure for correcting loading effects of aethalometer data, J. Air Waste Manage. Assoc., 57, 1214–1222, https://doi.org/10.3155/1047-3289.57.10.1214, 2007.
Weingartner, E., Saathoff, H., Schnaiter, M., Streit, N., Bitnar, B., and Baltensperger, U.: Absorption of light by soot particles: Determination of the absorption coefficient by means of aethalometers, J. Aerosol Sci., 34, 1445–1463, https://doi.org/10.1016/S0021-8502(03)00359-8, 2003.
Wu, L., Shen, Y., Che, F., Zhang, Y., Gao, J., and Wang, C.: Evaluating the performance and influencing factors of three portable black carbon monitors for field measurement, J. Environ. Sci. (China), 139, 320–333, https://doi.org/10.1016/j.jes.2023.05.044, 2024.
Yon, J., Bescond, A., and Ouf, F. X.: A simple semi-empirical model for effective density measurements of fractal aggregates, J. Aerosol Sci., 87, 28–37, https://doi.org/10.1016/j.jaerosci.2015.05.003, 2015.