the Creative Commons Attribution 4.0 License.
the Creative Commons Attribution 4.0 License.
 | 09 Jul 2026
Exploring ice nucleation particle concentrations in a boreal environment: limits of machine-learning-assisted variable screening
Yusheng Wu
Zoé Brasseur
Dimitri Castarède
Paavo Heikkilä
Jorma Keskinen
Ottmar Möhler
Markku Kulmala
Tuukka Petäjä
Jonathan Duplissy
Mixed-phase clouds, which are dominant in mid- and high-latitude regions, strongly influence Earth's radiative balance and precipitation processes. Their formation depends critically on the presence of ice-nucleating particles (INPs), which are rare relative to cloud condensation nuclei. The HyICE-2018 measurement campaign took place at the SMEAR II station in the high-latitude boreal forest of Hyytiälä, Finland, between February and June 2018. Two continuous-flow diffusion chambers (CFDCs), PINC and PINCii (Portable Ice Nucleation Chambers I and II), were deployed with high-frequency sampling to measure INP concentrations. We applied machine-learning techniques to explore predictors of INP concentrations using more than 500 high-resolution atmospheric, aerosol, and ecosystem variables measured continuously at the Station for Measuring Ecosystem–Atmosphere Relations (SMEAR) II, of which 84 were retained after quality screening for the analysis. We identify distinct differences between winter and spring–summer measurements. The winter measurements conducted with PINC appear to be nearly independent of any monitored variable. In contrast, the spring–summer measurements conducted with PINCii appear to be more closely linked to and responsive to ambient aerosol properties. Furthermore, we find that classical parameterisations based on aerosol particle concentration overestimate observed INP concentrations in the boreal environment. However, similar empirical fits based on local proxies, such as a marker of biogenic aerosol or nitrate, yield improved agreement during spring and summer, while no improvement occurs during winter. A core cautionary finding of this study is that, even with more than 500 co-located, high-resolution variables at one of the world's most heavily instrumented atmospheric stations, strong, deterministic links between INP concentrations and monitored parameters remain elusive. These results underscore the need for site-specific parameterisations to capture INP variability in the complex boreal environments; local biogenic and chemical proxies, such as fluorescent particle concentrations and nitrate aerosol mass, emerge as the most promising predictors for the spring and summer period.
- Article
(6591 KB) - Full-text XML
- BibTeX
- EndNote


Clouds, especially at high latitudes, exist in a sensitive balance. Most clouds, including those that bring precipitation to northern latitudes, exist between 0 and −40 °C and are “mixed-phase”, meaning that both liquid water and ice exist within their bounds (Mülmenstädt et al., 2015). For ice crystals to form via heterogeneous nucleation, temperatures below 0 °C are required; at such temperatures, ice is the thermodynamically stable phase, yet supercooled liquid water persists because a high kinetic barrier inhibits spontaneous freezing. Even with this inherently thermodynamically metastable co-existence of ice and supercooled liquid water, mixed-phase clouds are widespread (Mülmenstädt et al., 2015) and persist for many hours and even days, which is important for Earth's energy budget and precipitation processes (Shupe et al., 2013). At high latitudes, particularly in the Arctic, mixed-phase clouds play out-sized roles in regulating climate, where amplifying feedbacks – such as the ice-albedo feedback and the water vapour–temperature amplification characteristic of polar warming – have particularly pronounced effects (Shupe and Intrieri, 2004; Morrison et al., 2012). Importantly, mixed-phase clouds primarily form with the help of small particles in the atmospheric aerosol that provide the initial seeds for ice and liquid droplet formation (ice can also enter a cloud via sedimentation from above, e.g. the seeder–feeder mechanism). Those seeds, ice-nucleating particles (INPs), and cloud condensation nuclei (CCN) are fundamental to cloud formation, precipitation efficiency, and radiative properties. Of these, the consensus is that INPs are significantly more rare than CCN, and there remains great uncertainty when it comes to predicting INP occurrence (whether INPs are present at all) and abundance (how many are present per unit volume of air; DeMott et al., 2010).
In 2018 an intensive measurement campaign (HyICE-2018; Brasseur et al., 2022) was undertaken at the Hyytiälä, Finland, Station for Measuring Ecosystem–Atmosphere Relations (SMEAR) II, with a focus on measuring INPs in the boreal environment. A strong motivation for co-locating the HyICE-2018 INP measurements at the SMEAR II station was due to the fact that SMEAR II is a heavily instrumented station for monitoring a plethora of meteorological, ecological, and hydrological variables, among others (Hari and Kulmala, 2005). It is, in fact, one of the most significantly instrumented stations of this sort globally, as illustrated by its inclusion in many measurement networks, e.g. the Integrated Carbon Observation System (ICOS; Heiskanen et al., 2022), the Aerosol, Clouds and Trace Gases Research Infrastructure (ACTRIS; Pandolfi et al., 2018), and the Swedish Infrastructure for Ecosystem Science (SITES; Swedish Infrastructure for Ecosystem Science, 2021). Previously, several results from both the intensive HyICE-2018 campaign (Paramonov et al., 2020b; Schneider et al., 2021; Brasseur et al., 2022, 2024; Vogel et al., 2024) and long-term studies extending the campaign (Schneider et al., 2021) were published. Key findings include the characterisation of condensation- and/or immersion-mode INP concentrations and their likely origin from long-range transport (Paramonov et al., 2020b), the identification of seasonal trends linked to biogenic emissions (Schneider et al., 2021), instrument intercomparison results (Brasseur et al., 2022), the vertical distribution of INPs over the boreal forest (Brasseur et al., 2024), and the role of fluorescent biological aerosol particles as INP tracers (Vogel et al., 2024). To complement those studies, herein we attempt to exploit the wide scope of parameters that are measured at SMEAR II with a high time resolution. In addition to classical correlation studies, commensurate with the already published HyICE studies, we attempt to use several machine-learning algorithms as importance-ranking and pattern exploration tools to investigate the emergence of non-obvious (or intuitive) connections within the available high-frequency data. When many variables are screened simultaneously, the probability of finding spurious correlations increases; the results presented here should therefore be interpreted as hypothesis-generating rather than hypothesis-confirming, and the identified associations require independent validation.
Previous studies have linked INP concentrations to a range of aerosol properties, including total particle number concentrations above 0.5 µm (DeMott et al., 2010; Tobo et al., 2013), fluorescent biological aerosol particle concentrations (Tobo et al., 2013), mineral dust loading (DeMott et al., 2015), and black carbon (DeMott, 1990). At the same site, Paramonov et al. (2020b) found that no single parameter predicted INP concentrations over the full campaign period, although short-timescale correlations with black carbon, supermicron biological particles, and sub-0.1 µm particles were observed. These precedents motivate the present study's open-ended screening approach while providing the physical context for interpreting the resulting variable rankings.
The results of our study are educational but cautionary. Strong links between INP concentrations and fundamental chemical signatures of the atmospheric aerosol do exist but are likely to be open to over-interpretation. Especially with several hundred variables measured with a high-frequency time resolution, correlation does not necessarily illuminate causation. With regard to INPs, which are a small fraction of all atmospheric particulate, the indication is that improved mechanistic understanding remains abstruse.
2.1 Study site and period
The HyICE-2018 campaign took place at the SMEAR II measurement station in Hyytiälä, Finland (Hari and Kulmala, 2005), located within a sub-Arctic boreal environment at 61°51′ N, 24°17′ E and 181 m above sea level. The station setup and details during HyICE-2018 are fully described in Brasseur et al. (2022). For the purposes of this study, the time period of interest is from 19 February 2018 to 10 June 2018, during which time two continuous flow diffusion chambers (CFDCs; PINC – Portable Ice Nucleation Chamber and PINCii – second-generation PINC) sharing design characteristics were operated to sample ambient aerosol and measure INPs with high time resolution.
2.2 Complementary data and machine learning
Although INP concentration is highly temperature dependent, for much of the heterogeneous freezing temperature spectrum (between ≈ −38 and 0 °C), INPs represent a small fraction (as low as one in a million) of all particles (DeMott et al., 2010). That means that there is significant scientific interest in identifying tracers or other indicators of freezing activity that can be used to follow INP concentration.
Detailed instrument specifications for the HyICE-2018 campaign instruments are provided in Brasseur et al. (2022); metadata for the full SMEAR II monitoring suite are available via the SmartSMEAR portal (Junninen et al., 2009).
The machine-learning analysis employed random forest and decision tree models to derive feature importance rankings and principal component analysis (PCA) together with K-means clustering for dimensionality reduction and pattern exploration. These algorithms were applied as exploratory importance-ranking tools; no train–test data splitting or cross-validation was performed as the objective was hypothesis generation rather than predictive modelling. Prior to analysis, all variables were harmonised to a common 20 min time base; variables measured at a coarser resolution were assigned to the nearest 20 min interval, and those at a finer resolution were averaged. The analyses were implemented in R: random forests with the randomForest package, decision trees with rpart, and PCA and K-means with the base functions prcomp and kmeans. Random-seed sensitivity is quantified by running the random forest under 50 independent seeds; the seed-resolved importance scores are archived with the analysis code (see the “Code availability” section).
In addition to the INP measurements, for the purpose of this investigation, 509 individually monitored variables that are continuously recorded at SMEAR II were interrogated (data are available online at University of Helsinki, 2026). Those measurements, recorded with high time resolutions, are mostly atmospheric in character and can be broadly categorised as meteorological, radiological, soil, characteristics of aerosols and gases, and associated data products of the aforementioned. Naturally, the resulting multidimensional data include many potential redundancies and/or irrelevancies in terms of illuminating connections to INPs. Therefore, data filtering techniques were implemented to reduce the dimensionality and redundancy within the data. As a first pass, data features were not considered if they contained the following: (I) excessive NaN (Not a Number) values, often generated when concentrations are below instrument sensitivities; (II) data with little or no variability, i.e. constant values; and (III) data which were duplicated, like the same parameter sampled at different heights but without showing systematic differences.
The study also employs the Wideband Integrated Bioaerosol Sensor (WIBS), a real-time, single-particle instrument designed for atmospheric bioaerosol detection. The WIBS uses dual ultraviolet excitation wavelengths and subsequent fluorescence emission measurement to infer the presence of biological material in individual aerosol particles. Light scattering from a 635 nm diode laser determines particle size (> 0.5 µm; Tang et al., 2022).
It is important to note that these machine-learning methods were applied here as importance-ranking and exploratory tools and not to build or evaluate a predictive model; no train–test data splits were applied.
2.3 INP concentration measurements
The following instrument specifications are provided to establish the conditions under which INP concentrations were measured (particularly the lamina temperature and humidity, which define the INP activation threshold) and to facilitate comparison with other CFDC-based INP studies.
Specifically, we test whether new particle formation (NPF) events generate particles that grow into the INP-relevant size range (> 0.5 µm); whether primary biological aerosol (proxied by fluorescent particle counts from the WIBS) is a dominant INP source in this environment; and whether aerosol chemical markers – including black carbon, nitrate, and organic aerosol mass – can serve as practical INP proxies.
Of the operational sampling units from the HyICE-2018 campaign, two CFDCs have time resolutions that make their data practical to compare with other parameters sampled at high frequency and have been directly compared by Brasseur et al. (2022). PINC and PINCii are parallel-plate CFDCs designed to measure INPs, present in a sample air flow that is sandwiched between clean sheath air. Ice nucleation conditions within the sample air flow are modelled for CFDCs based on measured wall temperatures and the known saturation vapour pressure for the ice-covered walls (Garimella et al., 2016, 2017; Castarède et al., 2023).
PINC, the first-generation instrument, has been widely used in field campaigns for over a decade (Chou et al., 2011; Paramonov et al., 2020b). Originally built for airborne deployments, it features a compact design with a main chamber (568 mm in length) and a 230 mm evaporation section. It is effective for ambient INP measurements but has limitations in terms of cooling power, wall temperature control, and laminar flow stability. Its operation typically involves fixed temperature and humidity conditions that target mixed-phase cloud scenarios. During HyICE-2018 PINC was operated from 19 February to 2 April at a fixed sample lamina temperature of Tl = −31 °C and a relative humidity with respect to water of RHw = 105 %. PINC utilised a 1 L min−1 dried (RH ≤ 30 %) sample flow with an inline cyclone impactor used to eliminate sampling particles larger than 2.5 µm. PINC measurements from HyICE-2018 are presented in detail in Paramonov et al. (2020b).
PINCii was originally designed and built based on upgrading PINC (Castarède et al., 2023), utilising knowledge gained from more than a decade of experimental use (Stetzer et al., 2008; Chou et al., 2011; Kanji et al., 2013, 2019), and thus significantly enhancing the PINC design and capabilities. PINCii is fully described in Castarède et al. (2023). It has a much larger chamber, approximately twice the length(s) in both the main (1000 mm) and the evaporation (440 mm) sections, which provides extended residence time for aerosol particles and ice nucleation and crystal growth. These longer sections – and, thus, increased growth time - improve the counting statistics and the instrument resolution. PINCii incorporates a pre-cooled sheath air system, as well as an enhanced wall temperature control and monitoring, with dense thermocouple arrays and a sophisticated cooling system that allows cooling to ≈ −67 °C. PINCii also introduces improved methods for thermodynamic measurements by accounting for wall inhomogeneities and ice layer thickness, increasing the accuracy of RH and temperature estimations. During HyICE-2018, PINCii also utilised a dried sample aerosol flow of 1 L min−1 (measuring from 22 April to 10 June) with aerosol lamina temperature Tl = −32 °C and RHw = 105 % and a 2.5 µm cyclone impactor.
Both PINC and PINCii operate with the same measurement cycle: a 5 min background (particle-free) period followed by a 15 min ambient sampling period, cycling continuously. Each INP concentration value is derived from the ambient-period particle count minus the interpolated background, yielding one data point every 20 min (Brasseur et al., 2022). At a sample flow rate of 1 L min−1, the 15 L sample volume per data point is sufficient for statistically meaningful INP counts even at the low concentrations observed during winter (< 1 L−1). Instrumental constraints and availability made it impossible for PINC and PINCii to operate simultaneously during HyICE-2018. However, their operation in succession means that, for the bulk of the campaign, there exists high-frequency data coverage, which appears to be self-consistent. An instrument comparison summary is available within the campaign measurement report (Brasseur et al., 2022), where the inconsistencies with another parallel-plate CFDC chamber, SPectrometer for Ice Nuclei (SPIN), make plain its absence here. The comparison showed that PINC and PINCii agree within a factor of 2 during the overlapping measurement period, with both instruments capturing the same general trends in INP concentrations; minor differences in absolute concentration are attributable to the 1 K difference in operating temperature (Tl = −31 °C for PINC, −32 °C for PINCii) and instrument-specific detection efficiencies.
3.1 INP and other monitored variables
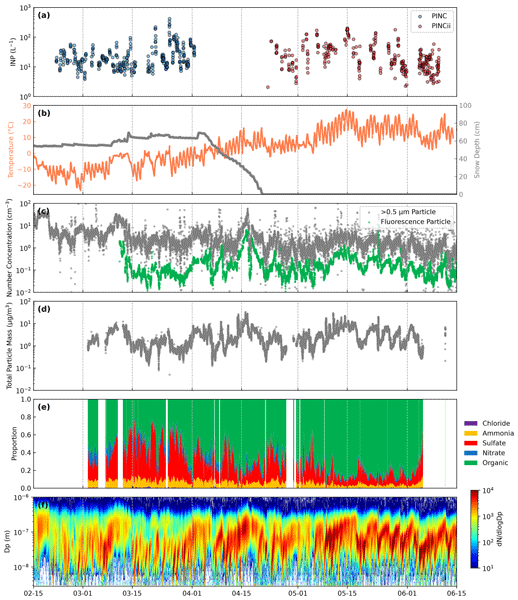
The time series of INP concentrations measured by PINC and PINCii, each with a 15 min ambient sampling window (one data point every 20 min) (Brasseur et al., 2022), are presented in Fig. 1a. INP concentrations were measured at Tl = −31 °C (PINC) and Tl = −32 °C (PINCii). Each point represents a 15 min ambient sampling period (with 5 min background periods before and after, yielding one data point every 20 min) with a subtracted background interpolated from particle-free measurements before and after the sampling periods. Between instruments and across the entire campaign period no significant differences in the absolute concentrations and spread of measurements are noted. However, by visual inspection of Fig. 1a, the PINCii spring and early-summer time series appear to be somewhat more spread on the logarithmic concentration axis than the PINC winter series, consistent with seasonal changes in aerosol sources and meteorology; we do not report distribution fits or geometric moments here because PINC and PINCii did not operate simultaneously, and so we restrict the comparison to this qualitative description.
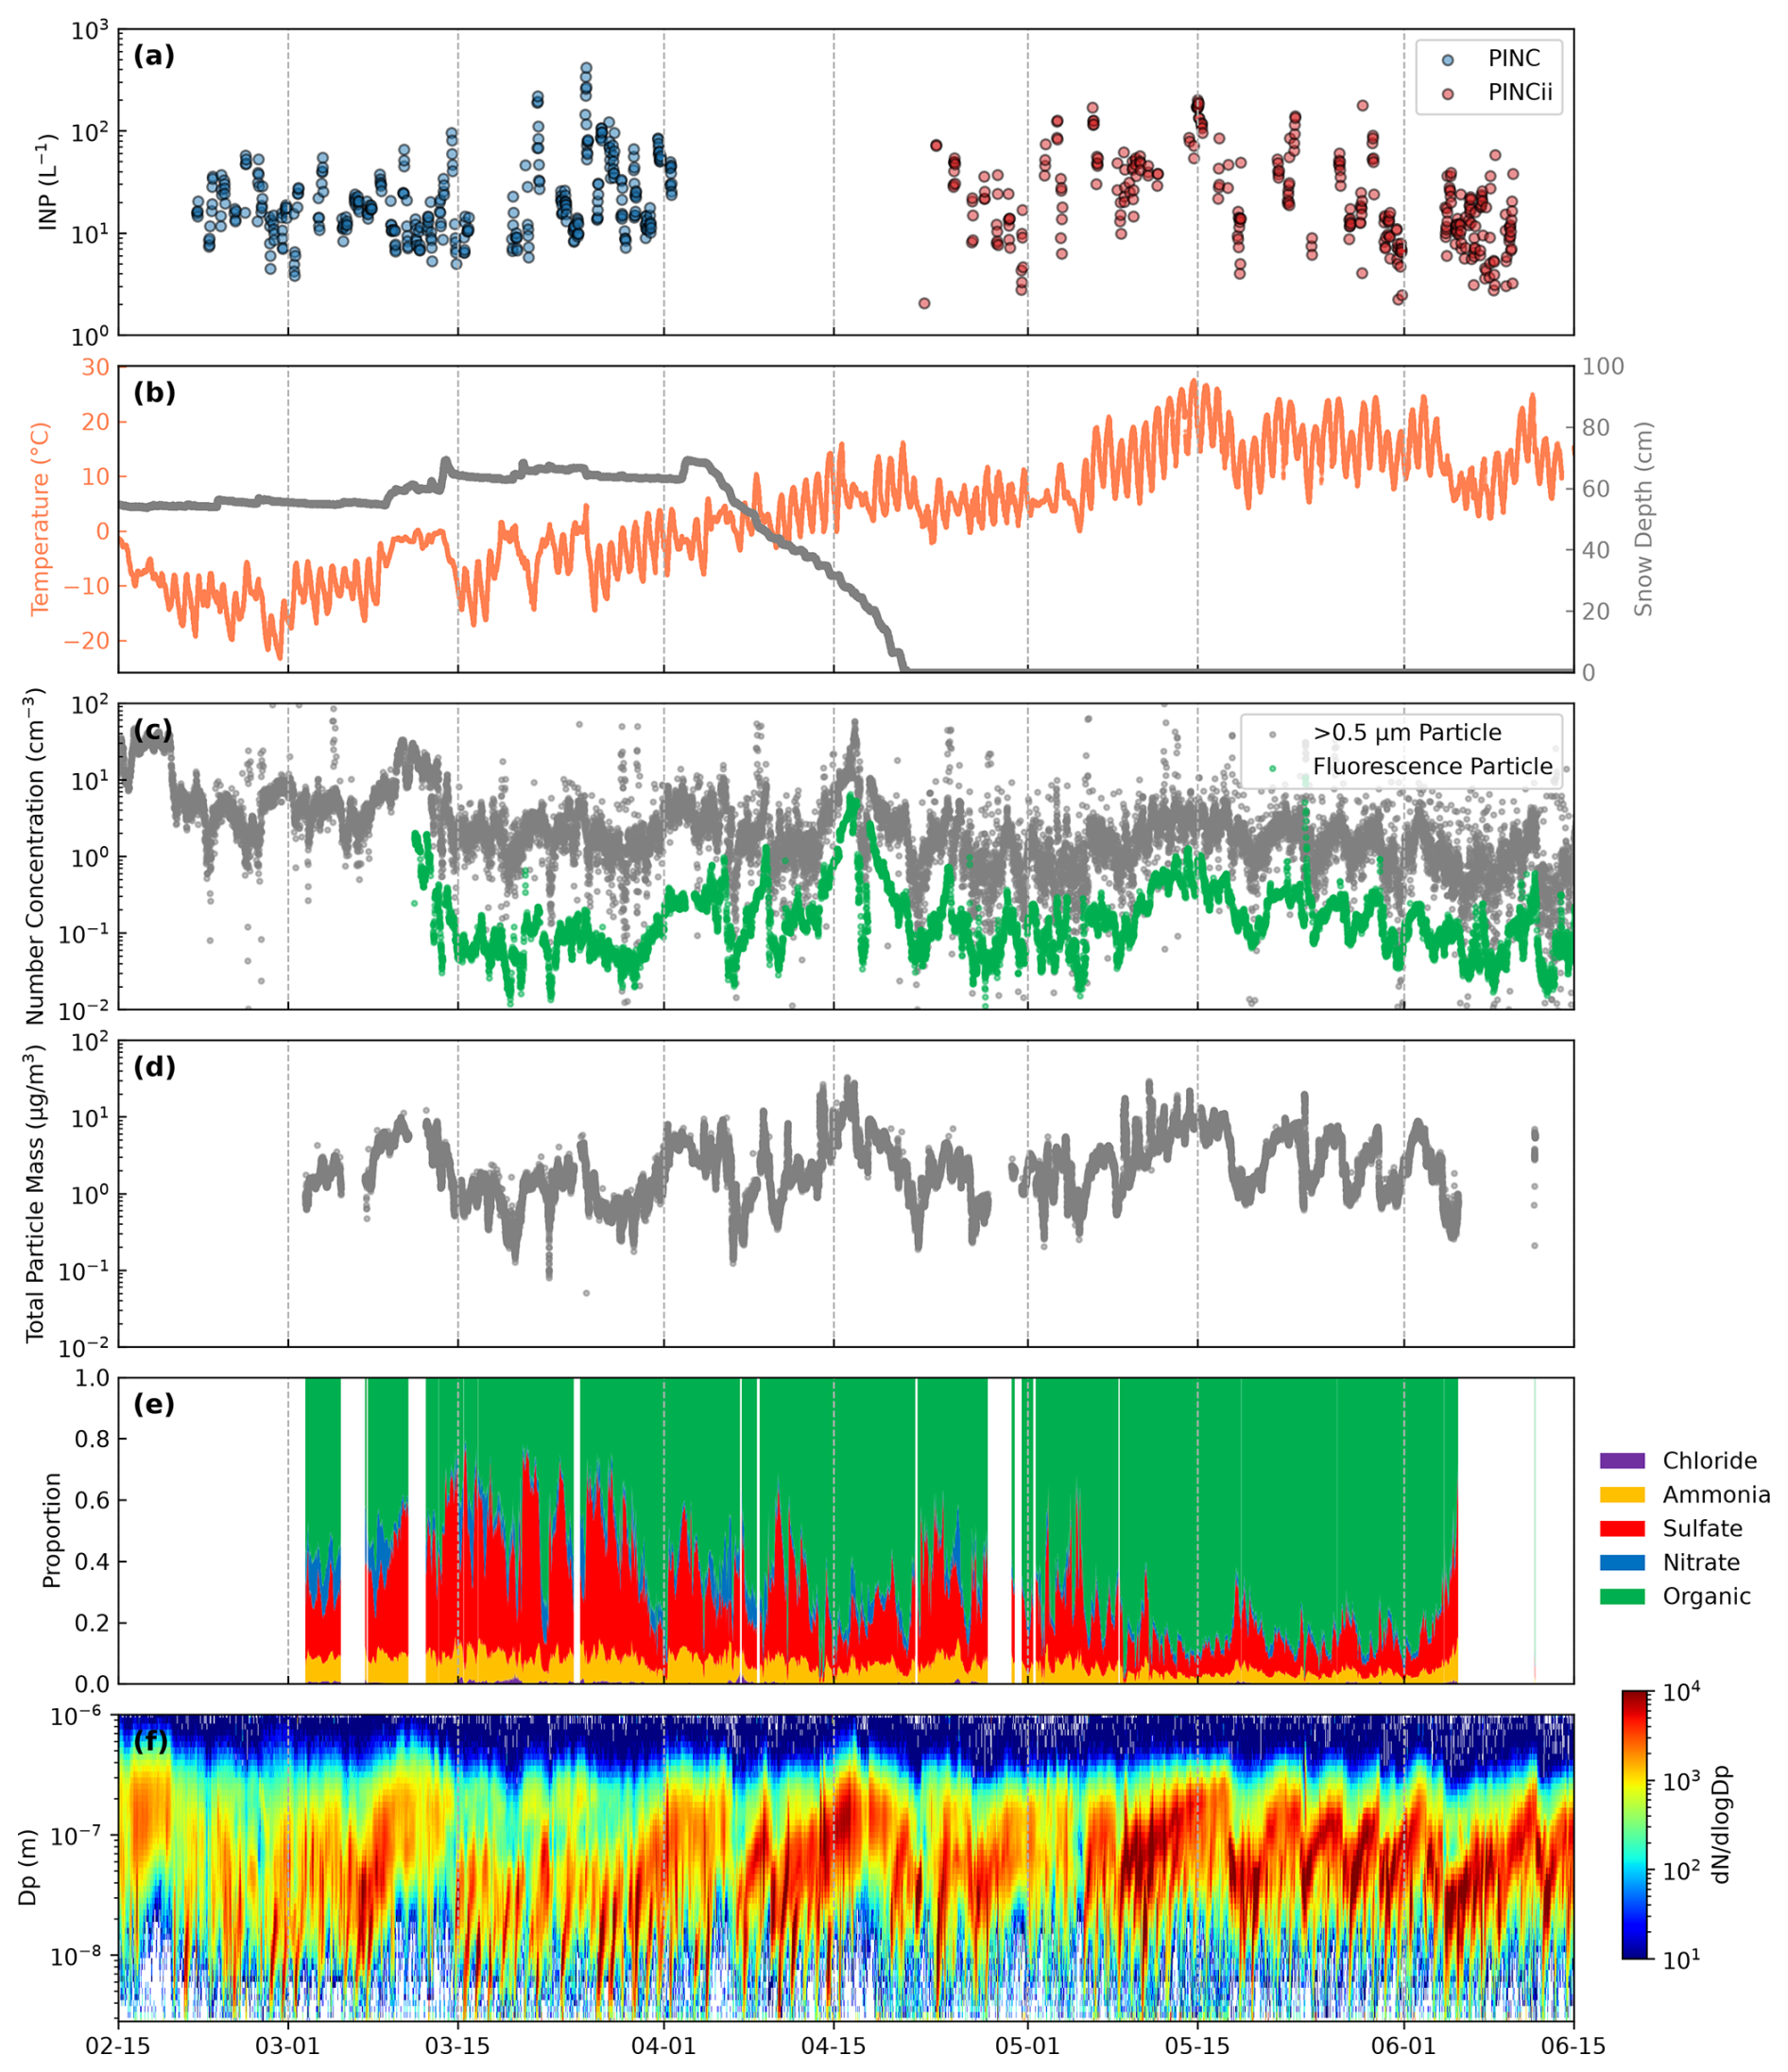
Figure 1Time series of atmospheric, aerosol, and INP properties measured during the HyICE-2018 campaign at the SMEAR II station in Hyytiälä, Finland (19 February–10 June 2018). (a) INP concentrations measured by the Portable Ice Nucleation Chamber (PINC; circles) and its updated version, PINCii (circles, differentiated by colour), shown on a logarithmic scale. INP concentrations were measured at Tl = −31 °C (PINC; blue) and Tl = −32 °C (PINCii; red). (b) Air temperature (coral, left axis) and snow depth (grey, right axis), illustrating the transition from winter through spring to summer. (c) Number concentration (particles cm−3) of particles with diameters > 0.5 µm (grey) and fluorescent biological aerosol particles (> 0.5 µm, green); WIBS fluorescence data begin on 11 March 2018, when the instrument was first deployed. (d) Total particle mass concentration for particles with d < 1µm measured with an aerosol mass spectrometer (AMS). (e) Mass fractions of AMS-measured chemical components (colours follow AMS convention): chloride (purple), ammonia (yellow), sulfate (red), nitrate (blue), and organics (green). (f) Particle number size distributions (PNSDs) measured with a differential mobility particle sizer (DMPS), with colour indicating . Together, the panels capture seasonal changes, aerosol chemical and physical characteristics, and the variability in INP abundance across the intensive campaign period.
Also depicted in Fig. 1 are the time series of several other key monitored variables. Some, like temperature (Fig. 1b) and snow depth (Fig. 1b, grey trace), reflect the seasonal change from winter to spring and summer, while others are quite commonly associated with INP abundance (e.g. particle number concentrations, Fig. 1c). Given that previously published results from daily and/or multi-day samples have demonstrated seasonal variability for Hyytiälä INPs and linked observed trends with biogenic emissions (Schneider et al., 2021; Proske et al., 2025), the time evolutions of aerosol mass fractions are also plotted (Fig. 1e). The most notable change in that time series is the increasing organic aerosol fraction with the change in season from winter to summer.
Finally, the time series of sub-micron particles (Fig. 1f) clearly exhibits the characteristic “banana” curves, indicative of new particle formation, that Hyytiälä is well-known for (Dal Maso et al., 2005; Kulmala et al., 2013). New particle formation events are relevant here because freshly nucleated particles can grow into the INP-relevant size range during sustained growth episodes, potentially contributing to the INP-active aerosol population.
3.2 Machine learning
The seasonal progression visible in Fig. 1 – the transition in temperature and snow depth, the spring–summer increase in fluorescent biological particles, the shift in aerosol chemical composition (increasing organic fraction, panel e), and the apparent co-variability of INPs with these tracers – motivates a more objective evaluation of how INP variability relates to the broader set of concurrently measured parameters. Given the large number of variables and their inherent covariance, simple visual or pairwise analyses are insufficient to robustly rank their relevance. Therefore we apply statistical and machine-assisted approaches to explore the reduction of the feature space and to identify consistent associations with INP concentrations.
The variables presented in Fig. 1 are a small subset of the total of 509 recorded variables that were investigated within this study. Of those 509 sampled variables the previously outlined first-pass dimensional reduction left 84 variables. The remaining 84 parameters were further interrogated using several machine-supported analysis techniques, including random forest models (Fig. 2), along with pairwise correlation, decision tree, principal component, and K-means clustering analyses. While it was difficult to extract quantitative results in all cases, to quantify the random-seed sensitivity of the random forest feature importance we ran the analysis with 50 independent random seeds (1 … 50). Figure 2 reports the per-variable median importance with 5th–95th-percentile whiskers across seeds; the top-ranked variables discussed below remain in the top group across all seeds. A formal multi-method comparison (e.g. side-by-side feature rankings from random forest, decision tree, and PCA) is not shown but was verified by the authors during analysis; these approaches consistently highlighted similar top-ranking variables.
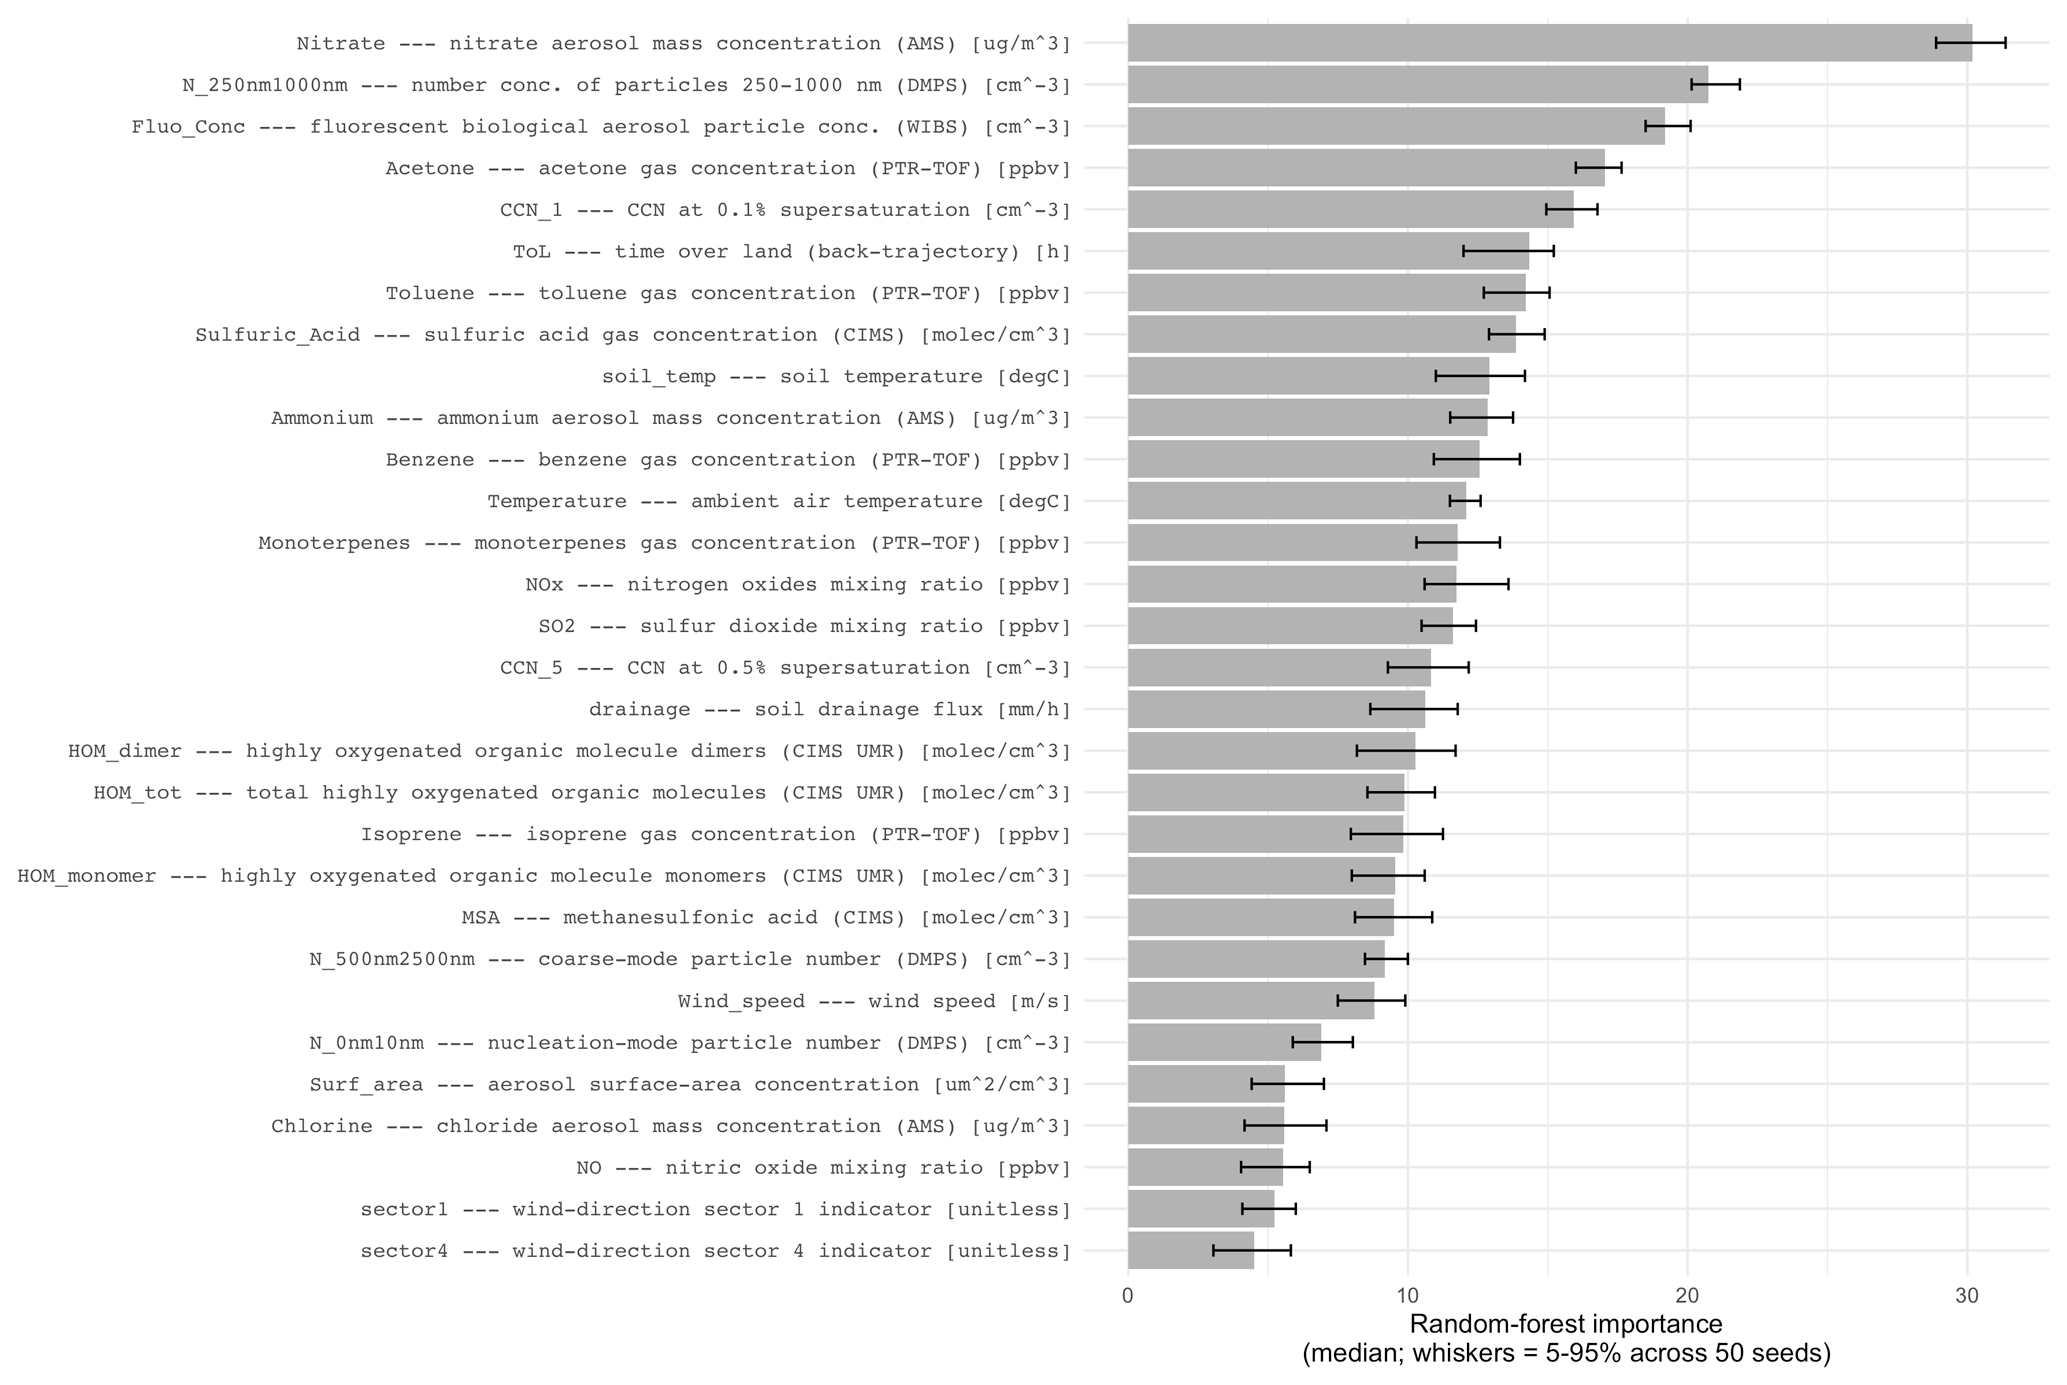
Figure 2Feature importance analysis derived from a random forest model trained to predict ice-nucleating particle (INP) concentrations during the HyICE-2018 campaign at SMEAR II. Variables are shown in decreasing order of random-forest importance. The six highest-ranked variables in this panel are nitrate aerosol mass concentration (AMS), 250–1000 nm particle number concentration (DMPS), fluorescent biological aerosol particle concentration (WIBS), acetone gas-phase concentration (PTR-TOF), CCN concentration at 0.1 % supersaturation, and the back-trajectory-derived time over land (ToL). Fluorescent particle concentration and nitrate aerosol mass are subsequently examined in pairwise correlation in Fig. 3 alongside particle mass (AMS), > 0.5 µm number concentration (APS), organic mass (AMS), and black carbon mass (aethalometer) – variables are drawn from a separate aerosol-only feature set and therefore are not part of the random forest input shown here (selection criteria in Sect. 2.2). The bars show the relative importance of each variable, expressed in arbitrary units. Higher values indicate a stronger statistical association with INP concentrations, although this does not necessarily imply a causal relationship. For WIBS, ABC denotes particles that fluoresce above the detection threshold in three WIBS fluorescence channels; further details are given in Savage et al. (2017). Only the top-ranked variables (by median random forest importance across 50 seeds) are shown for legibility; the full ranked list and per-seed importance scores are archived with the analysis code (see the ”Code availability” section). Short names on the y axis are SMEAR II identifiers paired with their spelled-out long names and units; see https://smear.avaa.csc.fi (last access 2 July 2026) for the full SMEAR variable registry.
The feature importance rankings from random forest models (e.g. Fig. 2) consistently assign high importance to variables that are known to be strongly correlated with INP concentration. For example, biological particles that yield a fluorescence signal serve as a tracer for primary biological aerosol, which may include INP-active species, and are among the most studied INP types in forest environments (Murray et al., 2012; Morris et al., 2014; Proske et al., 2025). The connection(s) between other highly ranked quantities that emerge and INP are sometimes less clear, but suggest closer investigation. Several other highly ranked variables (e.g. acetone, methanol concentrations) are not examined individually because they largely co-vary with the selected predictors (particularly nitrate) and thus provide redundant information for the purposes of this exploratory analysis. A systematic investigation of all high-ranking but unexpected variables is an important avenue for future work.
In Fig. 3 six variables are selected to illustrate their pairwise correlation with INPs. The six variables were selected on two complementary grounds: (i) a high importance rank in the random forest analysis and (ii) an established physical or empirical connection to INP in prior literature or at this specific site (> 0.5 µm particle number concentration as per DeMott et al., 2010; Tobo et al., 2013; organic aerosol mass as per the biogenic seasonality documented by Schneider et al., 2021). For example, in Fig. 3, fluorescence and nitrate are more closely examined, but acetone and methanol, which largely co-vary with nitrate, are not. Ice nucleation has a documented dependence on particle size that emerges in many parameterisations (DeMott et al., 2015; Tobo et al., 2019) and combined with mass accounts for volume. Indeed, nitrate and acetone concentrations correlate positively with total aerosol mass during the PINCii spring–summer period (r ≈ 0.5–0.6), suggesting that their association with INPs may partly reflect the total aerosol burden rather than a specific chemical mechanism. Several indicators of black carbon (BC) are surprisingly highly ranked, given that many INP studies suggest weak ice activity for BC (Mahrt et al., 2020a; Testa et al., 2024). Notably, Paramonov et al. (2020b) also reported a positive correlation between BC and INP concentrations at short timescales during the HyICE-2018 campaign at the same site (their Fig. 5), independently supporting this finding. Possible mechanisms include enhancement of BC's ice-nucleating ability through atmospheric ageing, oxidation, and coating with organic material (DeMott, 1990; Mahrt et al., 2020a, b). Finally, because of Hyytiälä's well-documented legacy in organic aerosol measurements and new particle formation (Kulmala et al., 2013), organics are added as a variable of interest.
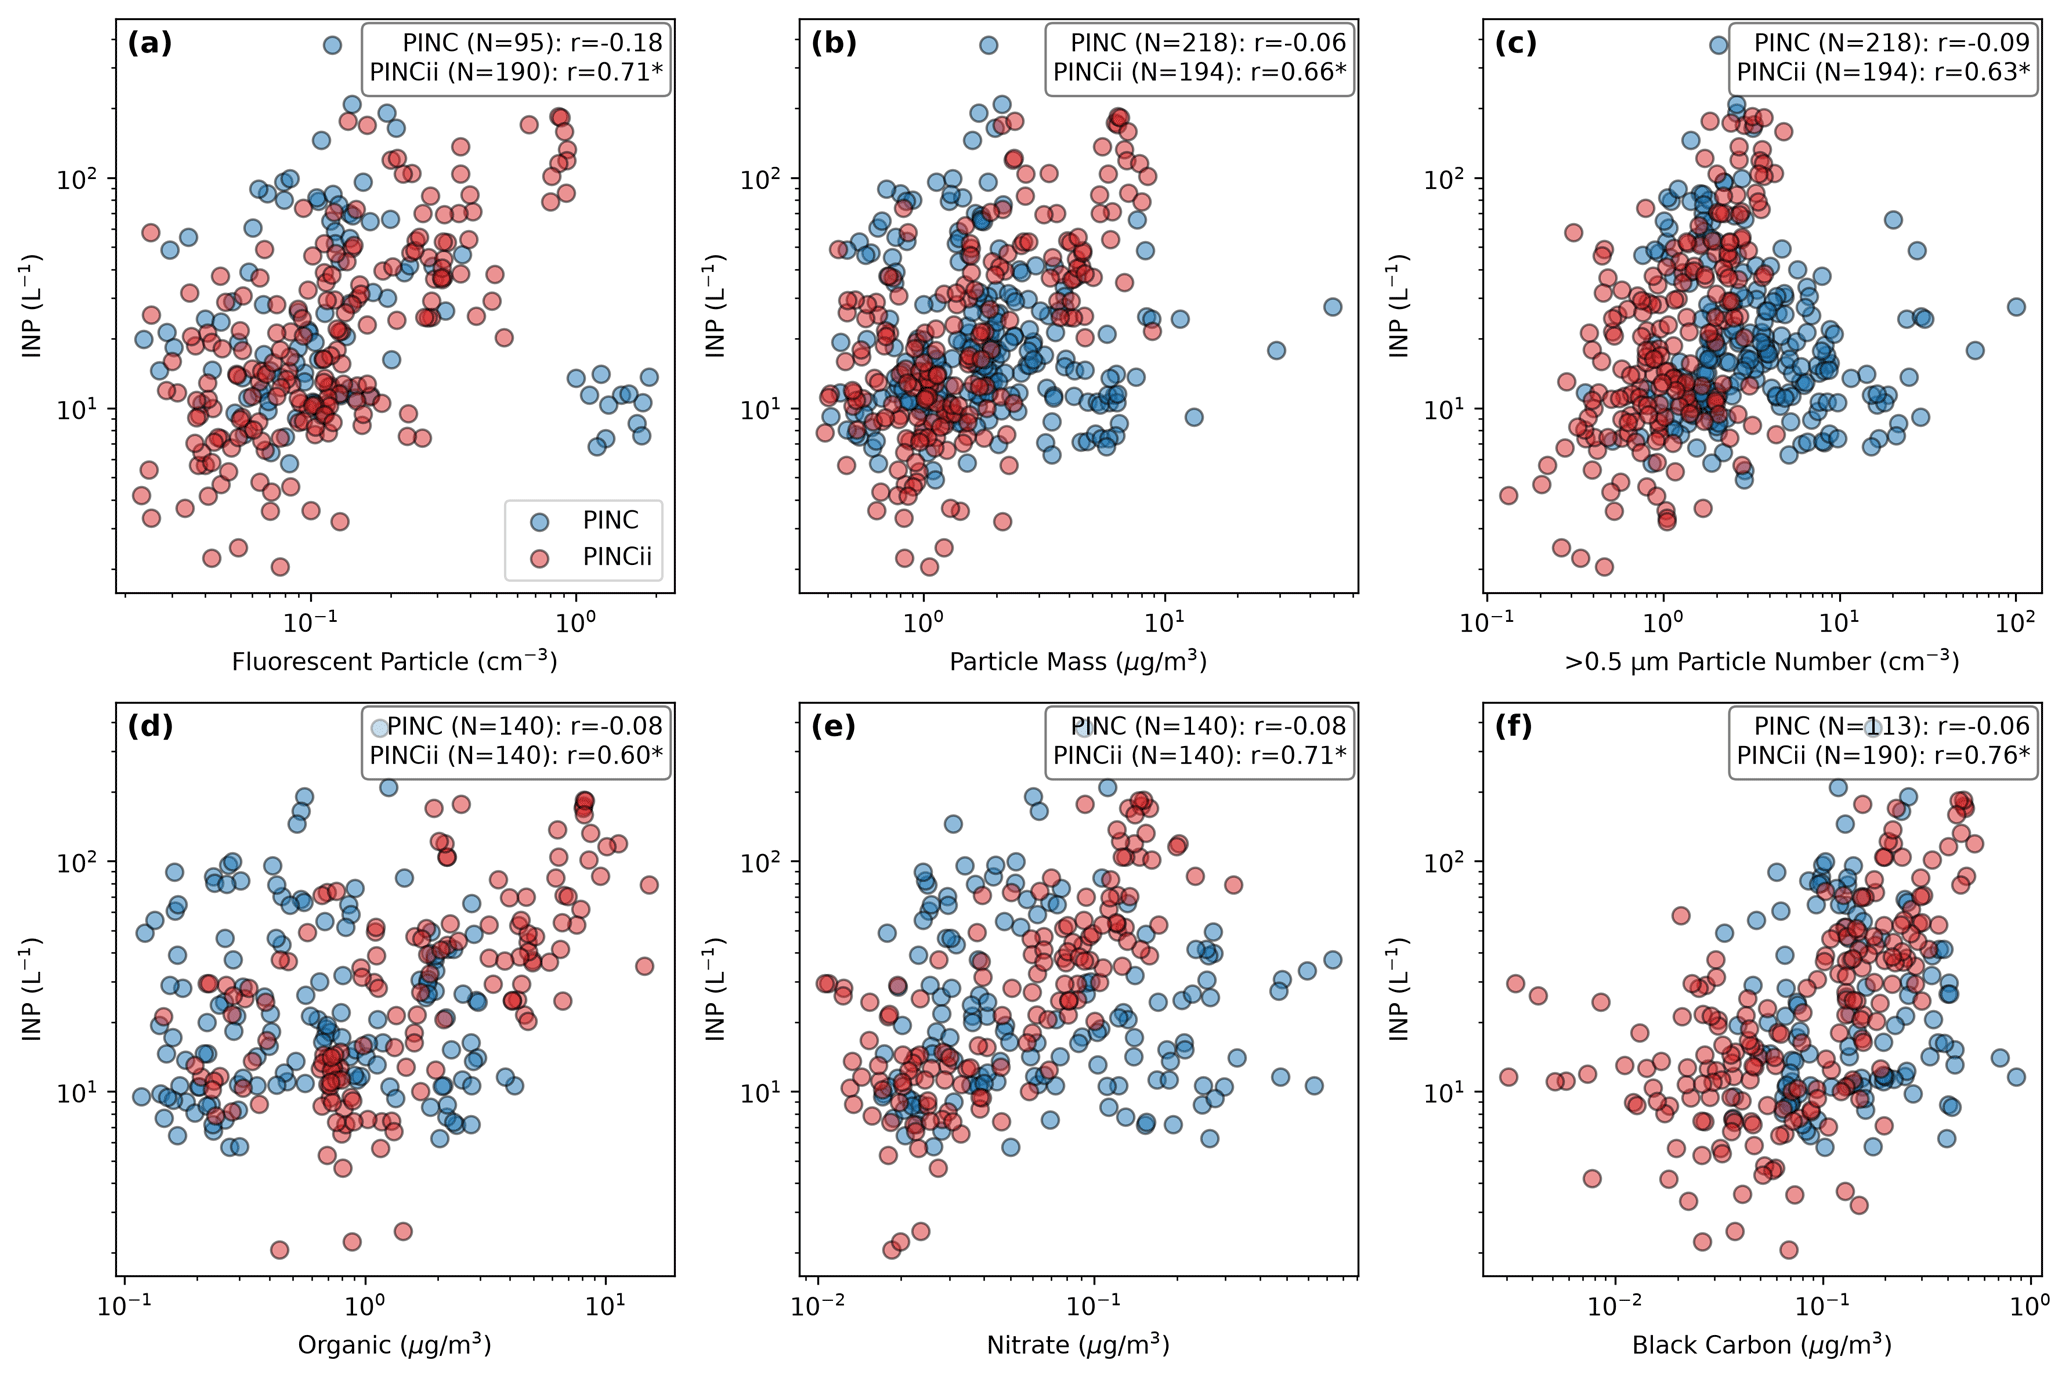
Figure 3Log–log scatterplots showing correlations between ice-nucleating particle (INP) concentrations measured by PINC (blue) and PINCii (red) during HyICE-2018 and six selected aerosol parameters measured at SMEAR II, Hyytiälä, Finland: (a) fluorescent particle number concentration (WIBS), (b) particle mass (1 nm–10 µm aerodynamic diameter, AMS), (c) number concentration of particles with diameters > 0.5 µm (APS), (d) organic aerosol mass concentration (AMS), (e) nitrate aerosol mass concentration (AMS), and (f) black carbon mass concentration (aethalometer). Asterisks (*) denote statistically significant correlations (p < 0.05). Pearson coefficients were calculated from the raw (untransformed) data; the log–log axes are for visualisation only. Hourly means, computed for each full hour when both variables were above zero, were used to align with the coarser temporal resolution of some complementary datasets, while using 20 min data yielded qualitatively similar results (see text). N values in each panel indicate the number of PINC and PINCii data points. Data are plotted separately for PINC and PINCii to highlight similarities and differences in observed relationships and to illustrate potential links between INP abundance and aerosol chemical or physical properties. PINC data (blue) correspond to winter measurements (19 February–2 April); PINCii data (red) correspond to spring—summer measurements (22 April–10 June).
In Fig. 3 measured INPs are plotted on the vertical axis. In the upper panels variables with previously established linkages to INPs are plotted on the horizontal axes (fluorescent biological aerosol particles from the WIBS; total particle mass from the aerosol mass spectrometer (AMS); > 0.5 µm number concentration from the particles larger than 0.5 µm (Aerodynamic Particle Sizer, APS)). In addition to fluorescent biological aerosol particles (WIBS), particle number concentrations for particles larger than 0.5 µm (APS) are plotted. Particle concentrations of this size appear in several, widely used INP parameterisation schemes (Tobo et al., 2013; DeMott et al., 2015). Particle mass concentration, again largely a proxy for the number of large particles present in the aerosol, is plotted in Fig. 3b. In the bottom panels several highly ranked variables that constrain aerosol chemistry are plotted. For all of these cases, the organic mass concentration (Fig. 3d), nitrate mass concentration (Fig. 3e), and black carbon mass concentration (Fig. 3f; all three from the AMS except BC, which is from the aethalometer), the direct correlation is as good as or better than what is demonstrated in the upper panels for variables with previously established links to ice activity. Data for PINC and PINCii are shown separately because the two instruments operated in different seasons (winter vs. spring–summer) with distinct ambient aerosol and INP characteristics; combining them would conflate seasonal differences and obscure the key finding: the observed correlations are specific to the PINCii spring–summer subset and do not hold generally across the full campaign (the PINC winter data show no meaningful correlation with any of the examined predictors). The Pearson correlation coefficients were calculated from the raw (untransformed) data; the log–log axes are used for visualisation only to accommodate the wide dynamic range of the measurements. Using 20 min data instead of hourly means yields qualitatively similar results, suggesting that the dominant co-varying processes operate on timescales exceeding 20 min (diurnal or synoptic scale) rather than at sub-hourly variability. This subset-specific character of the correlations has broader implications for campaign-based INP correlations reported in the literature: INP–aerosol correlations derived from short, season-specific field campaigns are conditioned on the ambient regime of the measurement period and should be interpreted with caution when generalised to other seasons, sites, or ecosystems.
While the individual learning algorithms that were tested were consistent and succeeded in bringing to light several variables that also exhibit strong pairwise correlation with INP, they identify statistical associations between predictor variables and INP concentrations but cannot establish causal relationships. This is perhaps unsurprising as, taken holistically, the highly ranked variables simply suggest that more dirty, mixed aerosol with higher particulate concentrations is more likely to contain INPs. The correlations likely reflect co-varying air mass properties rather than direct INP composition: INPs are a vanishingly small fraction of the total aerosol (∼ 1 in 106), and, without single-particle analysis of ice crystal residuals, the identity of the actual ice-nucleating species remains undetermined (Paramonov et al., 2020b). Similar observations have been made previously in several diverse ecosystems, from the subtropical marine boundary layer (Welti et al., 2018) to ocean basins (Welti et al., 2020), and globally distributed land-based samples ranging from Arctic to equatorial latitudes (Schrod et al., 2020). In those studies it has been noted that INP concentrations measured remotely from strong sources often exhibit log-normal frequency distributions (Fig. 4a). This observation is directly analogous to random mixing (dilution) of trace pollutant species (Ott, 1990) and suggests that the dominant INP signal originates from long-range transport of well-mixed aerosol. Log-normal concentration distributions arise naturally from the multiplicative dilution and mixing of aerosol during atmospheric transport (Ott, 1990), consistent with INPs at this site originating from diverse, distant sources. This interpretation aligns with the findings of Paramonov et al. (2020b), who hypothesised that long-range transport is the dominant INP source at SMEAR II based on the same PINC dataset. Lagrangian back trajectories or dispersion models (e.g. HYbrid Single-Particle Lagrangian Integrated Trajectory (HYSPLIT, Stein et al., 2015, and the FLEXible PARTicle dispersion model, FLEXPART, Pisso et al., 2019) can contextualise air mass history and are often used together with chemical tracers or receptor modelling to assess long-range transport, but they do not by themselves uniquely verify INP provenance or the dilution interpretation above: trajectory errors, mixing along the path, and the lack of INP-specific tagging in kinematic histories mean that such analyses complement – rather than uniquely test – inferences from local correlations and distribution shape. We highlight combined trajectory–tracer or trajectory–receptor studies as a priority for future work. In Fig. 4 the relative frequency distributions of INP concentrations measured with PINC (blue) and PINCii (red) are plotted with unimodal (a) and bimodal (b) fitted curves. From the χ2 statistics (using raw bin counts; see caption), the formal tests reject the simple unimodal log-normal null at conventional significance for both PINCii (χ2 = 81.98, p = 0.001) and PINC (χ2 = 157.19, p < 0.001). Nevertheless, the histograms are broadly similar in shape and scale, and so log-normality remains a useful approximate description of the bulk distribution. A modest elevated tail in the PINCii histogram motivates the bimodal decomposition in Fig. 4b: for PINCii, χ2 decreases to 63.54 (p = 0.028), whereas for PINC the bimodal fit does not improve overall agreement (χ2 = 242.72, p < 0.001). We therefore do not interpret the PINCii tail as evidence for a statistically robust separate population at the 5 % level, and we caution that the χ2 values indicate residual structure beyond ideal unimodal log-normal behaviour for both instruments.
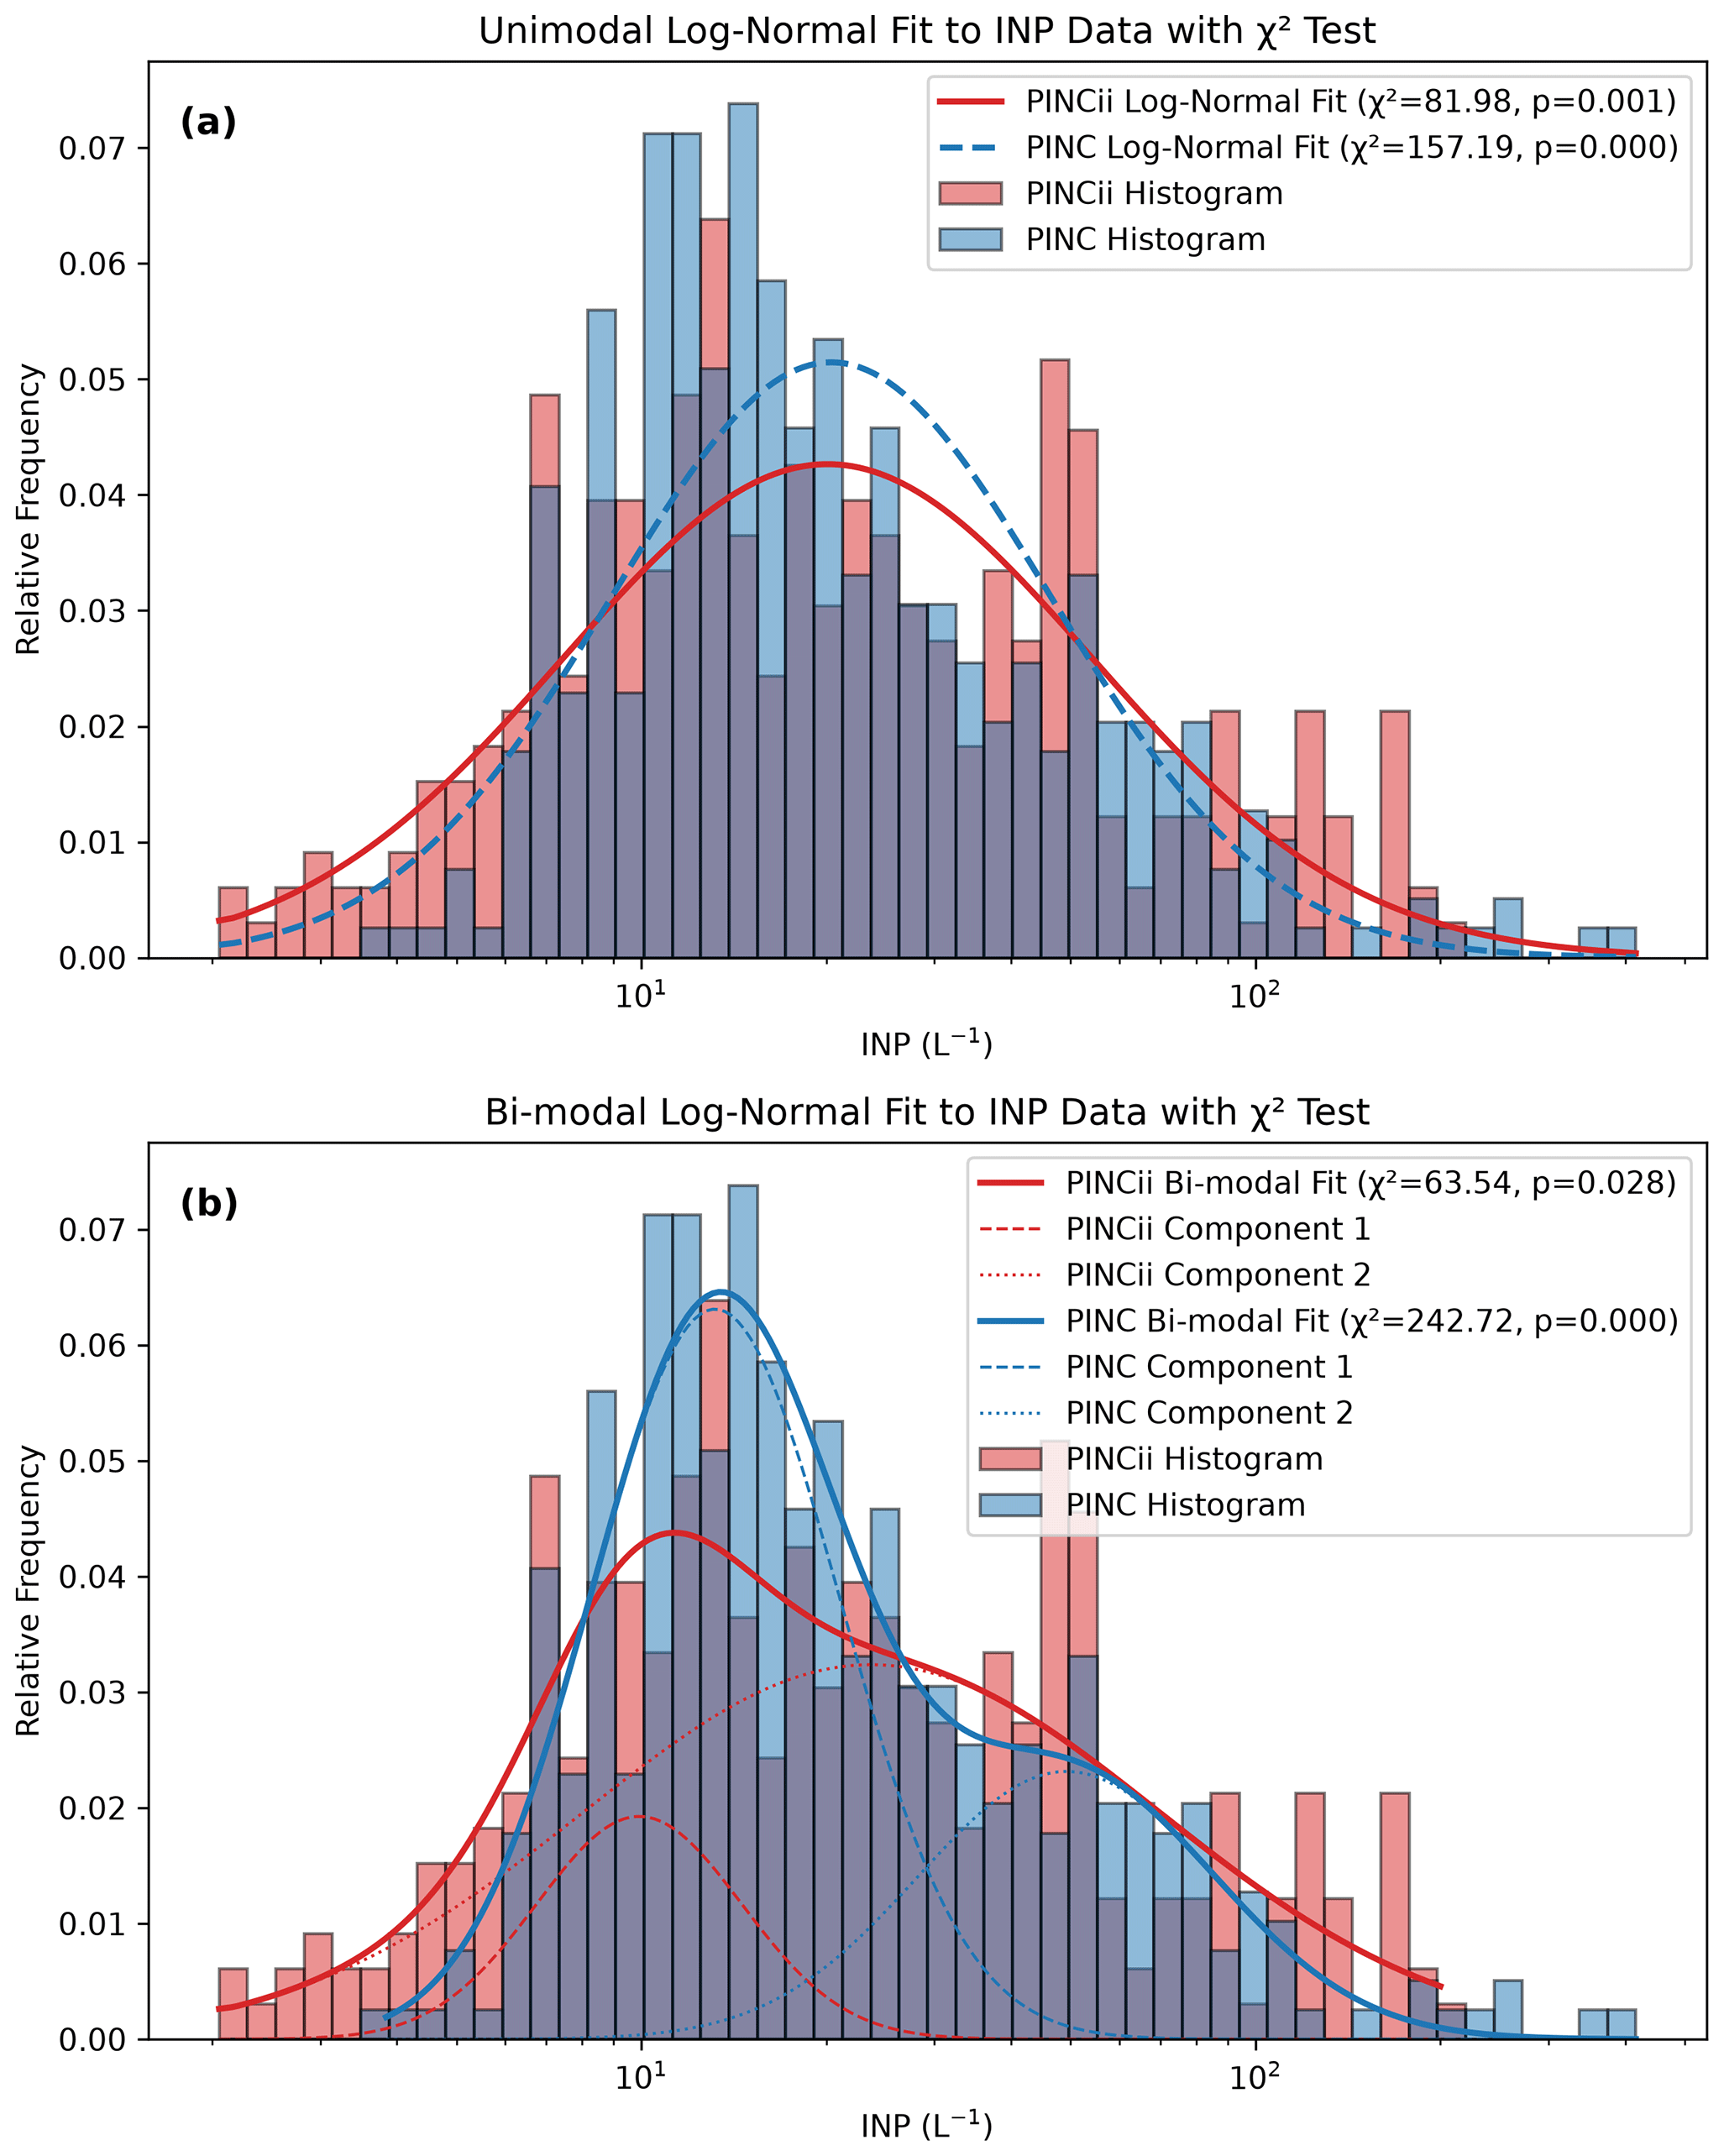
Figure 4Normalised relative frequency distributions for INP concentrations measured by PINC and PINCii during the HyICE-2018 campaign, along with fitted log-normal probability density functions. (a) Unimodal log-normal fits to the instruments' INP histogram, with fit parameters evaluated using maximum-likelihood estimation and goodness of fit assessed via χ2 statistics. (b) Bimodal log-normal fits decomposed into two component modes, illustrating potential multi-population structure in the INP size–activation spectrum. The χ2 goodness-of-fit test uses raw bin counts as observed frequencies, with expected counts derived by integrating the fitted probability density over each bin and scaling by total sample size N; degrees of freedom are adjusted for the number of estimated parameters (DOF = 2 for unimodal; DOF = 5 for bimodal fits). The unimodal fits yield χ2 = 81.98 (p = 0.001) for PINCii and χ2 = 157.19 (p < 0.001) for PINC. The bimodal fits give χ2 = 63.54 (p = 0.028) for PINCii and χ2 = 242.72 (p < 0.001) for PINC; χ2 decreases for PINCii relative to the unimodal case, but the test still rejects the bimodal fit at the 5 % level (p = 0.028), whereas the PINC bimodal model is not supported as an improvement over its unimodal counterpart.
3.3 Parameterisation
If the dominant INP signal originates from long-range transport, local parameterisations based on co-located measurements will have limited predictive power – a prediction directly borne out by the PINC winter results below. The modest success of the PINCii spring–summer parameterisations may then reflect a local biogenic INP contribution that augments the transported background during the growing season.
The limited correlations identified in Sect. 3.2 suggest that existing parameterisations – which rely on variables, such as nAP > 0.5 µm, that do not strongly correlate with INPs in this dataset – are unlikely to reproduce the observed INP variability. Testing them nonetheless serves two purposes: (i) it quantifies the parameterisation failure against a comprehensive boreal dataset, and (ii) it motivates the exploration of alternative local proxies in Sect. 3.3.2.
The qualitative connections that emerge between INP and aerosol characteristics (Fig. 3) from the machine-learning algorithms (Fig. 2) signal an opportunity to explore the parameterisation space. We expect existing parameterisations to account for the observed correlations related to aerosol particle abundance and biogenic origin (top panels in Fig. 3). In contrast, the connections to aerosol chemical composition (bottom panels in Fig. 3) are less obvious, and, in fact, despite considerable explorations, black carbon is typically observed to have limited ice activity (Thomson et al., 2018; Adams et al., 2020; Santos et al., 2024), especially when it occurs as fresh soot. That said, there is some evidence that transport, oxidation, and ageing enhance soot's ice activity (DeMott, 1990; Mahrt et al., 2020a, b).
3.3.1 Previous parameterisations
Although episodic long-range transport of high-latitude dust to Finland cannot be excluded a priori, we cross-referenced the PINC measurement window (19 February–2 April 2018) against the systematic Finnish Meteorological Institute catalogue of long-range dust transport events to Finland from 1980 to 2022 (86 documented events: 59 Saharan, 22 Aral-Caspian, 5 Middle Eastern; Meinander et al., 2023). No catalogue event overlaps with our campaign window. The nearest documented Saharan dust depositions over Finland are dated to 8–10 March 1991 (northern Finland) and 21–23 February 2021 (southern Finland); neither falls within our measurement period. Although the FMI catalogue does not explicitly enumerate Icelandic or Greenlandic glacial-outwash dust events, no major high-latitude glacial-dust outbreak affecting northern Europe in spring 2018 has been reported in the peer-reviewed literature. We therefore find no documented evidence that long-range dust transport materially contributed to the winter INP signal observed by PINC, supporting our choice to compare measurements against the dust-independent DeMott et al. (2010) formulation rather than the dust-aware DeMott et al. (2015) revision.
Several empirical parameterisations have been developed to predict INP concentrations as a function of temperature and aerosol properties. Among the most widely used are the formulations by DeMott et al. (2010) and Tobo et al. (2013), which express INP number concentration (nINP) as a function of cloud temperature T in degrees Kelvin and aerosol number concentration [scm−3] for particles larger than 0.5 µm (nAP > 0.5 µm) and were derived specifically from CFDC datasets. DeMott et al. (2015) revised the 2010 parameterisation for predicting INP concentrations to explicitly include mineral dust as a primary source. However, since mineral dust likely represents a negligible component in our boreal study environment, where no local mineral dust sources exist (although episodic long-range transport of high-latitude glacially sourced dust (e.g. Tobo et al., 2019; Sanchez-Marroquin et al., 2020) cannot be excluded), we refer back to the 2010 formulation, which is as follows:
where a = 0.0000594, b = 3.33, c = 0.0264, and d = 0.0033. The subsequent Tobo et al. (2013) parameterisation follows a similar power-law formulation but was updated using primary biological aerosol particle measurements. It is also investigated because the works of Schneider et al. (2021), Vogel et al. (2024), and Proske et al. (2025) suggest a strong link between INPs and primary biological activity at SMEAR II. The Tobo et al. (2013) parameterisation is
where α = −0.074, β = 3.8, γ = 0.414, and δ = −9.671 are suggested as coefficients. Note that both Eqs. (1) and (2) use the total aerosol number concentration nAP > 0.5 µm as the predictor. Tobo et al. (2013) also provide a separate parameterisation based on fluorescent biological aerosol particle (FBAP) concentrations; that variant is not applied here. Further INP parameterisations have been developed from SMEAR II-based immersion-freezing measurements (Schneider et al., 2021; Brasseur et al., 2024). However, the immersion-freezing focus differs from the operating principle of CFDCs and is largely in a different, warmer temperature regime. Moreover, the Schneider et al. (2021) study sought to capture longer-term INP trends. Thus, although the sampling of those studies was also located at and above SMEAR II, it is not applied in our analysis of these high-frequency data.
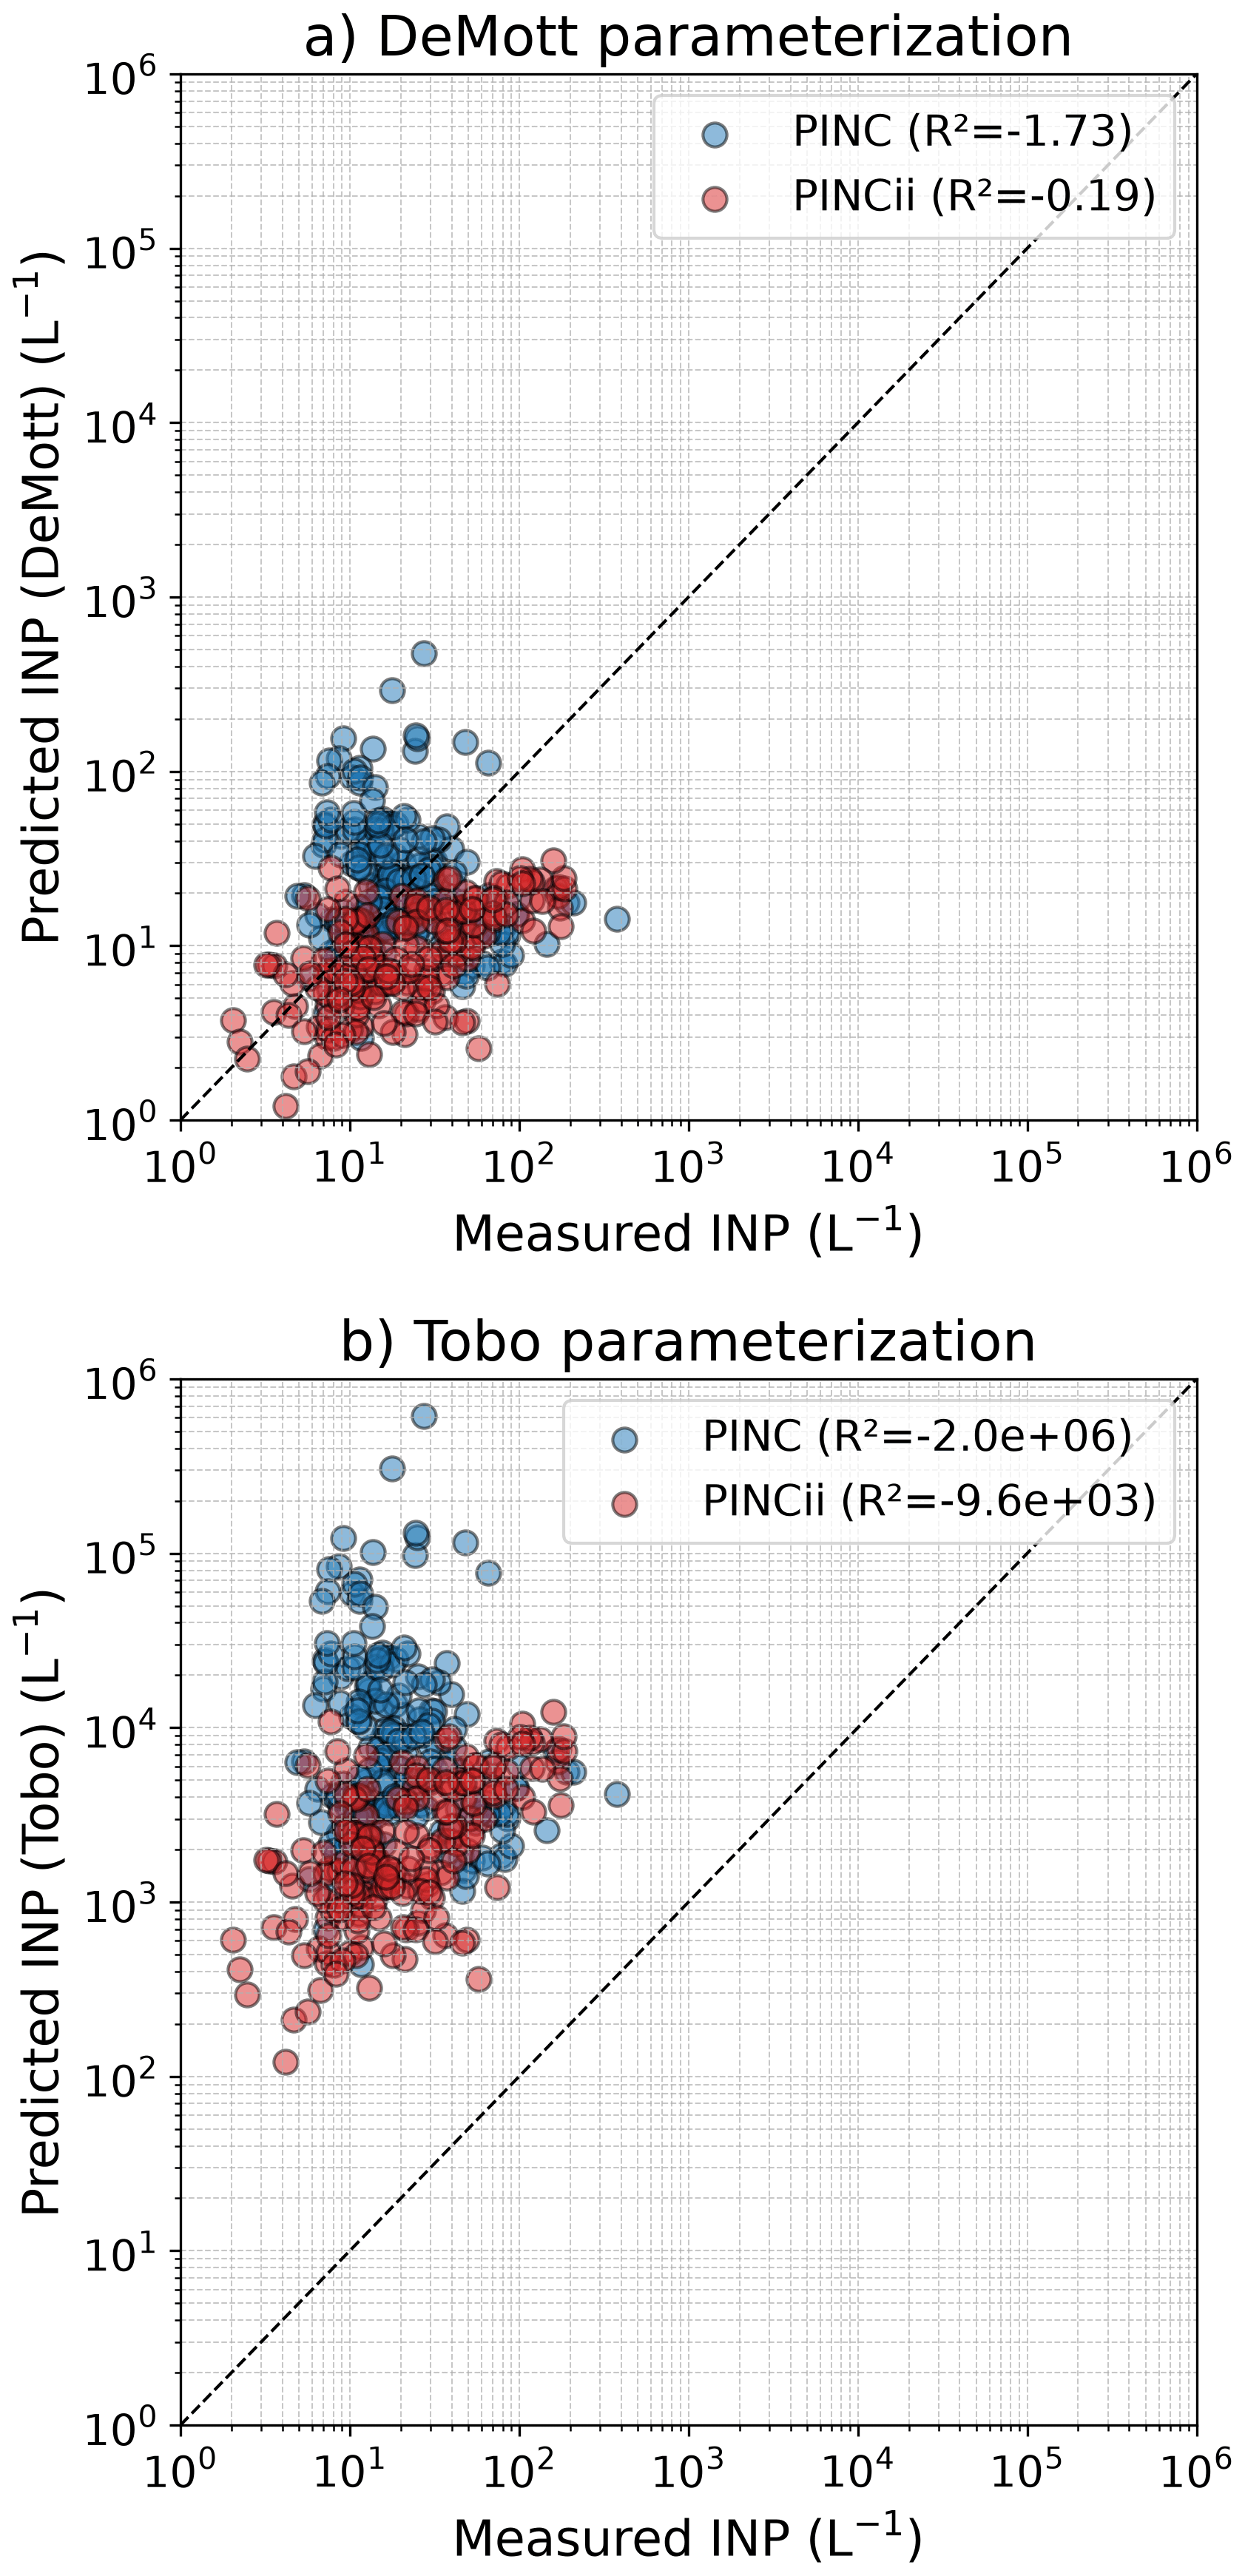
Figure 5Predicted INP concentrations from (a) DeMott et al. (2010) and (b) Tobo et al. (2013) parameterisations plotted versus the INP concentrations measured using the PINC (blue) and PINCii (red) CFDCs. The 1:1 line is plotted, and R2 values corresponding to the coefficient(s) of determination for each fit are given within the legend. Negative R2 values indicate that the parameterisations provide no more predictive strength than the arithmetic mean value.
In Fig. 5 the INP predicted from these models is compared to the PINC (blue) and PINCii (red) measurements, and the coefficient of determination (R2) is used to quantify how well the models explain the observed variability. In all cases the R2 has nonintuitive negative values, which can occur when fitting non-linear functions and indicates that the model predictions are less accurate than simply applying the observational mean as a predictor (i.e. a horizontal line at the mean value). Thus, both model formulations perform poorly when applied to the HyICE-2018, PINC, and PINCii data, indicating that these existing parameterisations do not capture the observed boreal-specific INP variability (Fig. 5). Specifically, the DeMott et al. (2010) underprediction is consistent with the intercomparison findings of Brasseur et al. (2022), whereas the poor performance of Tobo et al. (2013) over the full campaign contrasts with its relatively better performance during their four targeted intercomparison days. The better performance noted by Brasseur et al. (2022, their Fig. 8) time series and the consolidated 28 March inter-instrument spectrum summary in their Fig. 11) reflects a focused comparison over 4 targeted intercomparison days that are not representative of the full seasonal range covered here; Brasseur et al. (2022) themselves caution that their comparison “might not be representative of the entire HyICE-2018 campaign.” Direct comparison between CFDC-based and bulk immersion-freezing assay results is not straightforward because CFDCs primarily activate condensation and deposition freezing on a timescale of seconds, whereas bulk immersion assays (such as INSEKT, used to derive the Schneider et al., 2021 and Brasseur et al., 2024 parameterisations) probe a different nucleation pathway over longer timescales.
3.3.2 New parameterisations for boreal conditions
Although previously described parameterisations do not adequately capture the observed variability, they suggest the exploration of simple empirical power-law fittings between nINP and aerosol and chemical tracers that have been highly ranked by the machine-learning algorithms. We seek to determine whether such an approach can elucidate potential local INP proxies. We utilise a highly simplified, generic power-law relationship:
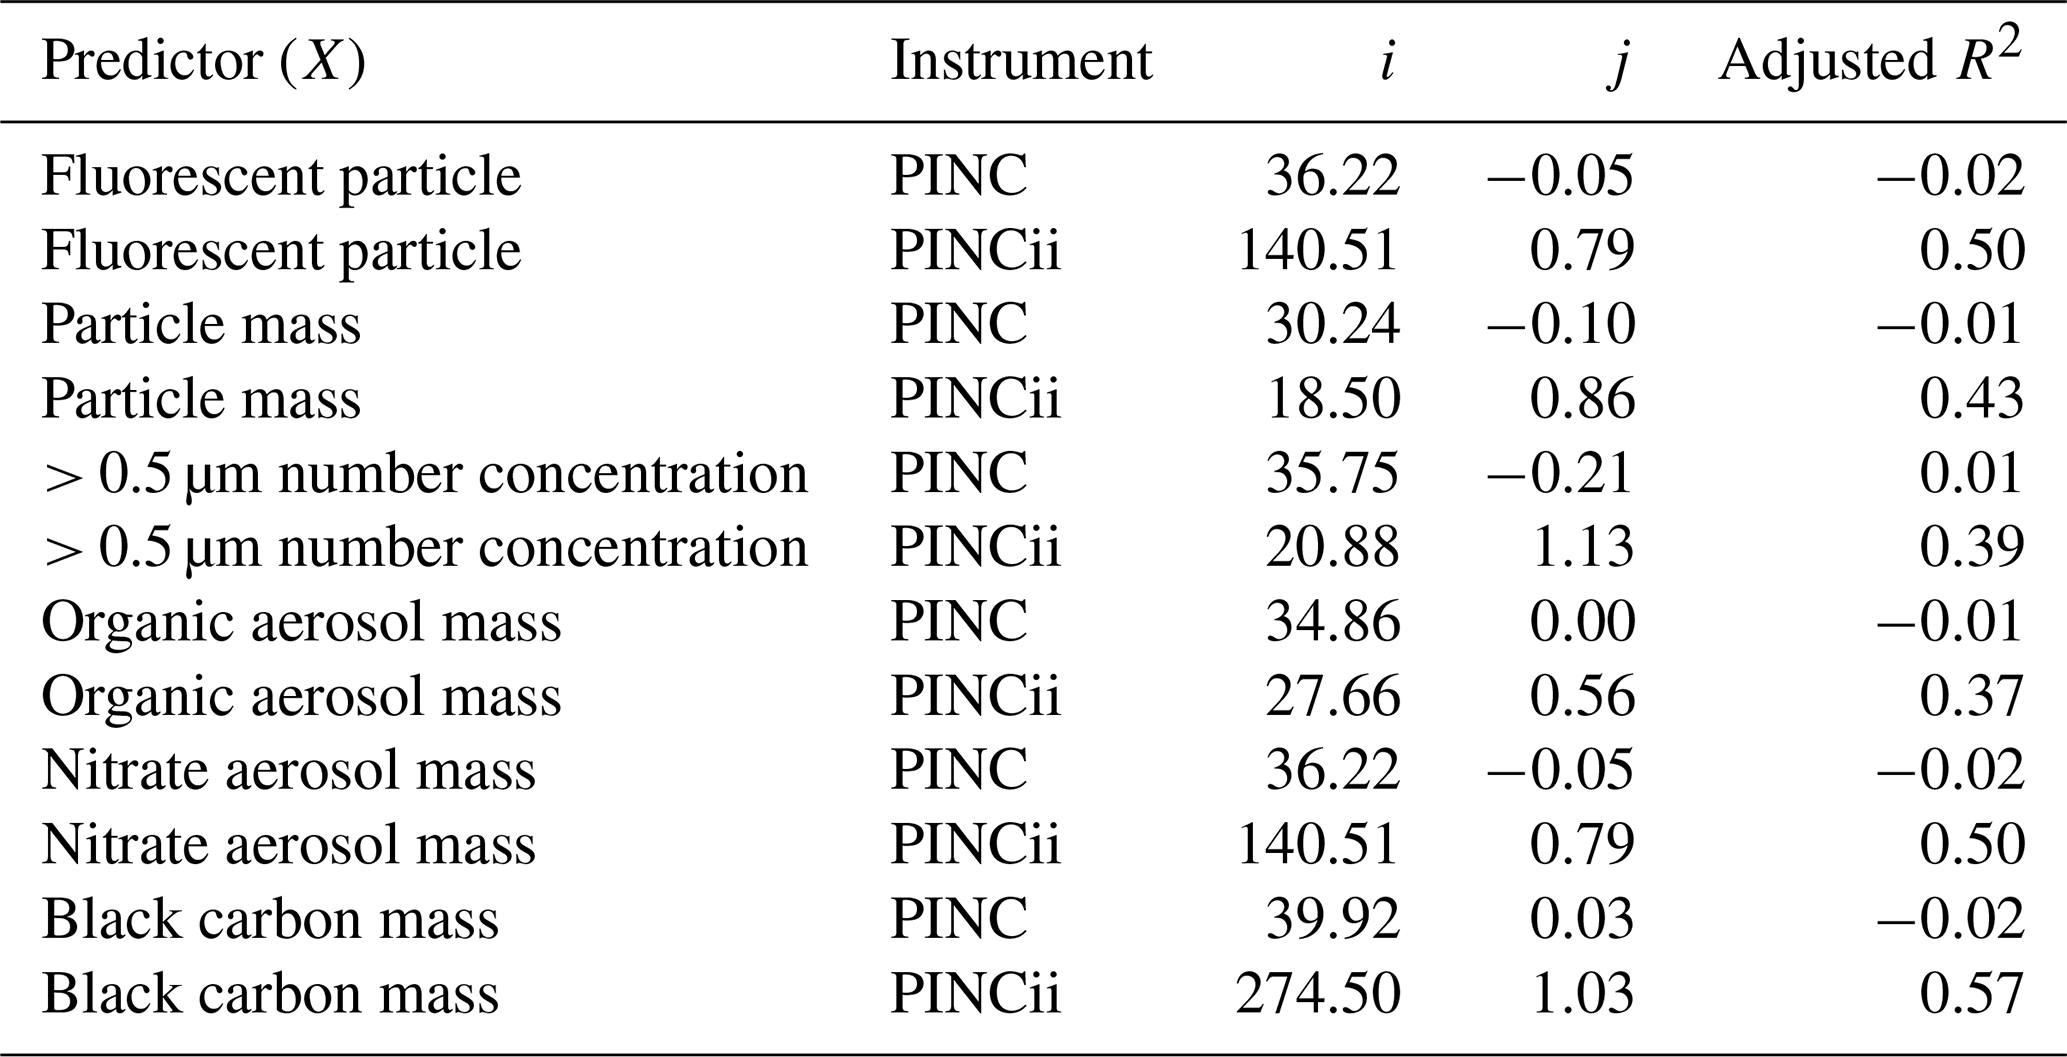
where X is used to represent variables such as those in Fig. 3, and i and j are fitting parameters. The coefficients that result from fitting (Eq. 3) and adjusted R2 values are summarised in Table 1. The exponent j reflects the sensitivity of INP concentration to changes in the predictor: values near unity indicate approximately linear relationships (> 0.5 µm number: j = 1.13; BC mass: j = 1.03), values well below unity suggest weak sensitivity (organic mass: j = 0.56), and near-zero or negative values indicate the absence of a meaningful relationship (all PINC predictors). The pre-factor i sets the absolute scale and is influenced by the ambient INP concentration range during the respective measurement period. The consistently low or negative adjusted R2 for PINC confirms the absence of predictive skill during the winter period, regardless of the predictor chosen.
Table 1Regression coefficients and adjusted R2 values calculated for different predictors based on the simplified power-law relationship (Eq. 3). The presented predictors were selected based on their high importance ranking in the random forest analysis and established physical or empirical connections to INPs in prior literature (see Sect. 3.2).
The persistent overprediction by Tobo et al. (2013) for PINCii reflects two site-specific factors: (i) at Hyytiälä, frequent NPF events grow secondary organic aerosol into the > 0.5 µm size range (Dal Maso et al., 2005; Kulmala et al., 2013), inflating nAP > 0.5 µm without a commensurate increase in biological INPs, whereas the parameterisation was calibrated at a North American temperate forest where large particles are predominantly primary biological aerosol, and (ii) the sub-Arctic boreal spring supports lower primary biological aerosol emission than the temperate calibration environment, further reducing the fraction of large particles that are ice-active at these temperatures.
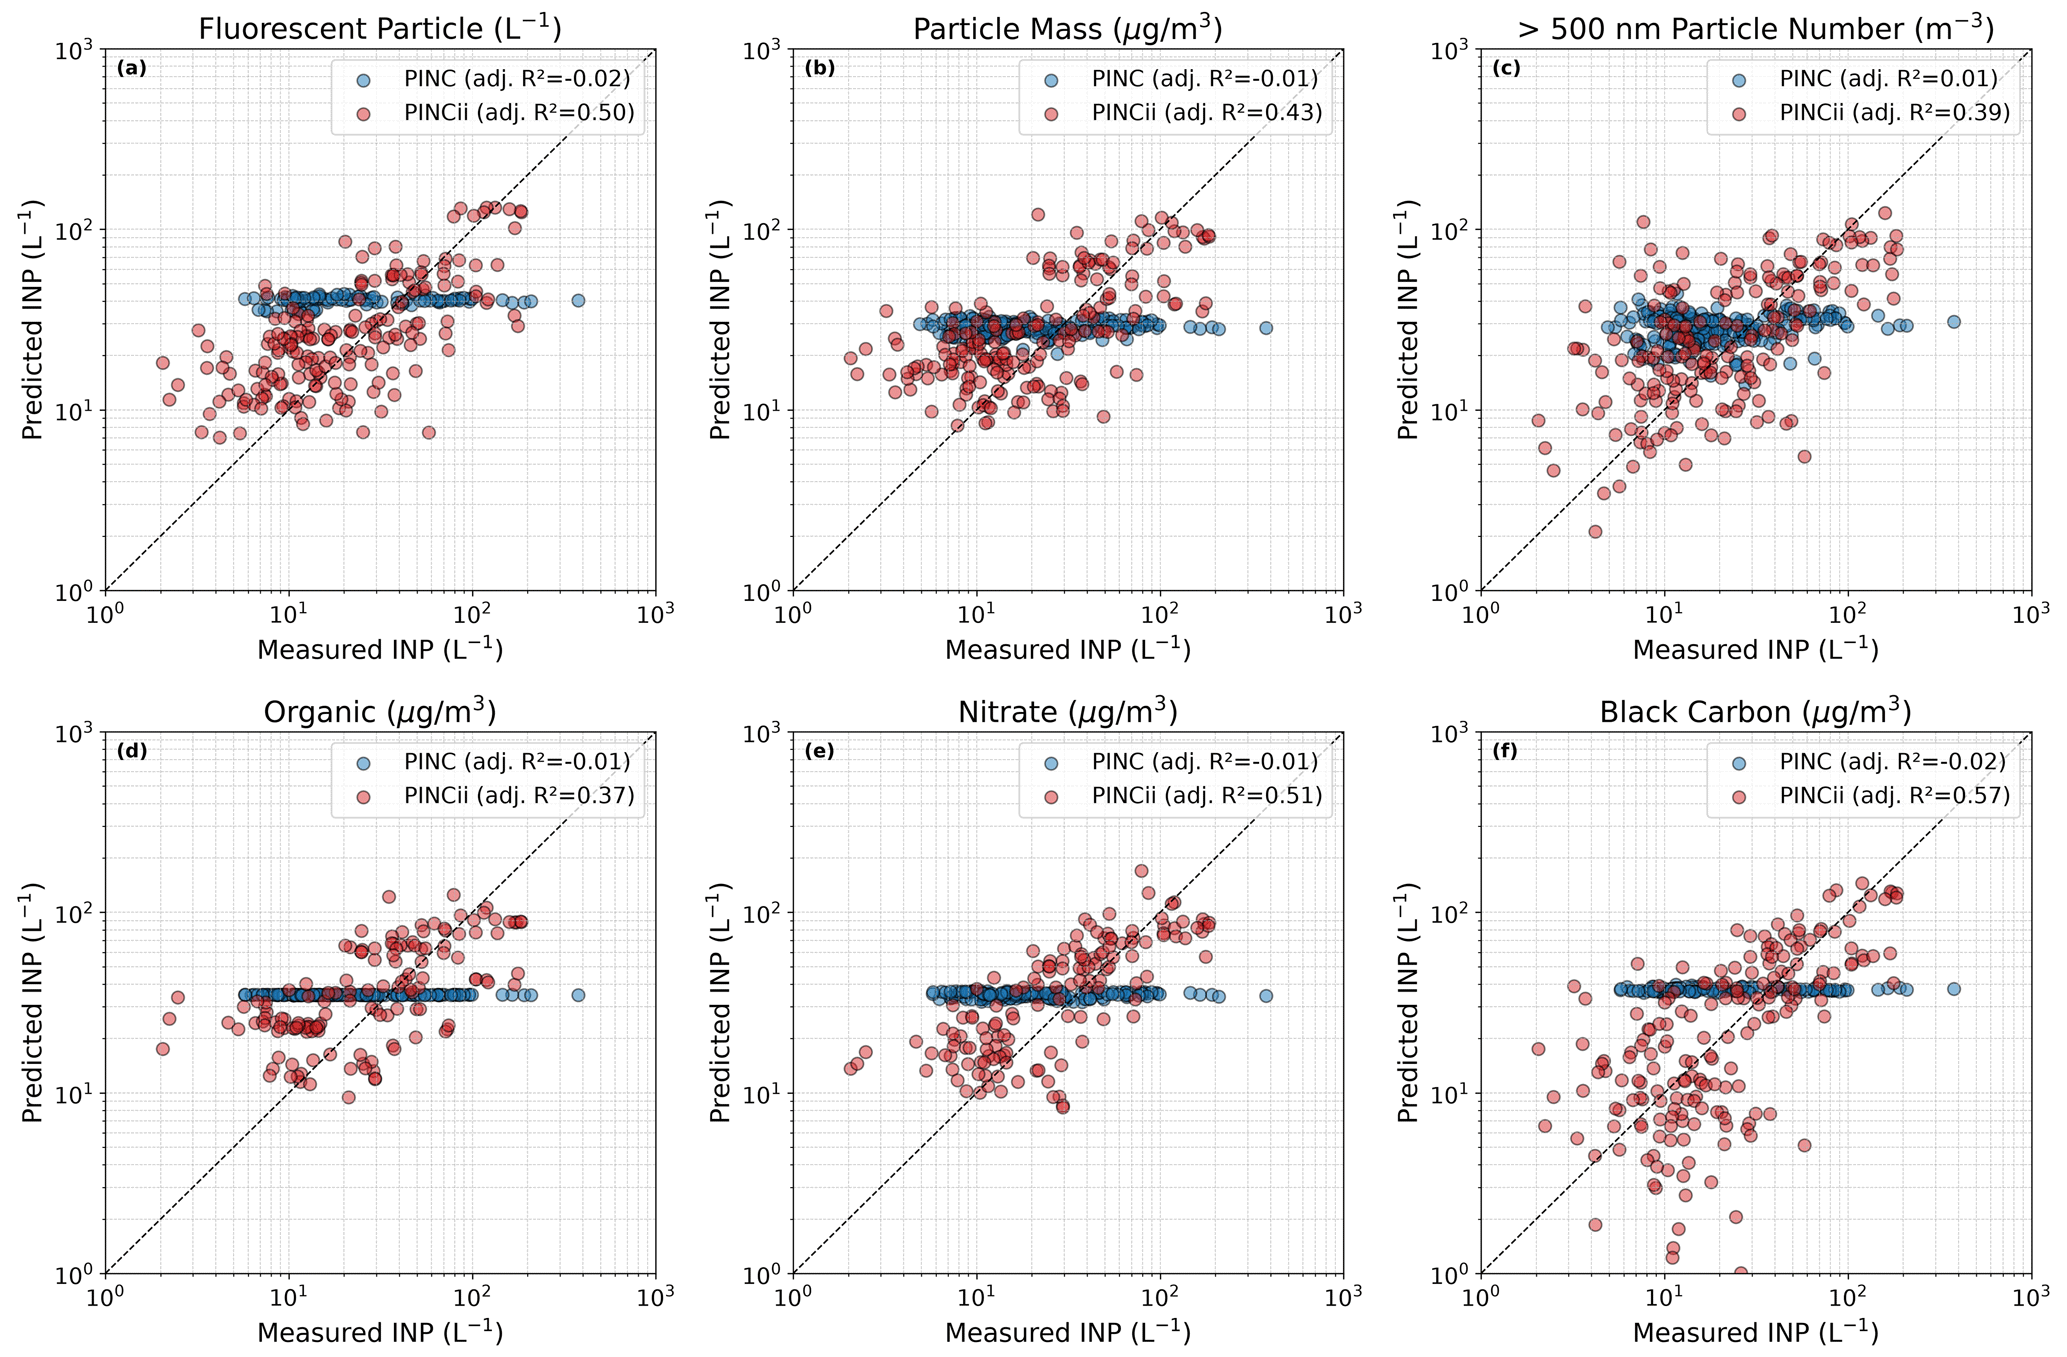
Figure 6Comparison between measured and parameterised ice-nucleating particle (INP) concentrations for six empirical fits using (a) fluorescent particle number concentration, (b) particle mass (1 nm–10 µm), (c) number concentration of particles with diameters > 0.5 µm, (d) organic aerosol mass, (e) nitrate aerosol mass, and (f) black carbon mass. Each panel shows PINC (blue) and PINCii (red) data from the HyICE-2018 campaign. The 1:1 dashed lines indicate agreement between the measured INP and the simplified power-law parameterisations for both datasets. The adjusted coefficients of determination (adjusted R2) are given in Table 1. Moderate skill was obtained for the WIBS- and NO3-based parameterisations (adjusted R2 ≈ 0.5 for PINCii), suggesting that biologically and chemically enriched aerosol components contribute to INP variability in the boreal atmosphere during spring and early summer.
The best-performing relationships are obtained for the PINCii dataset, with nitrate mass and WIBS fluorescence both yielding moderate predictive skill (Fig. 6). This suggests that INP abundance in the boreal boundary layer is more closely linked to chemically complex and biologically active aerosols than to bulk particle number alone. However, the PINC measurements, collected during the snow-covered (Fig. 1) winter season yield near-constant predicted INP concentrations because the fitted exponents (j in Eq. 3) are near zero for all PINC predictors (Table 1), meaning the predicted values collapse to approximately the pre-factor i regardless of predictor variability. While the total variability of the PINC data largely spans the PINCii data, the muted response to all predictors mimics the Fig. 5 results, and no model seems to improve prediction beyond the mean PINC value.
Here we have attempted to deepen our understanding of the sources, abundance, and variability of INPs in the boreal environment. A major objective of the HyICE-2018 campaign was to utilise high-frequency INP measurements, co-located with the over 500 time-resolved monitoring measurements at SMEAR II, to illuminate INP characteristics in more detail. The results are mixed. Using CFDCs, we capture higher-frequency INP variability, with time increments as short as 20 min. However, the observed INP concentrations show statistically detectable but weak associations with other measured variables, insufficient for reliable prediction, and no single parameter emerges that is strongly linked to INP.
One qualitatively strong connection is that aerosol bulk chemical composition parameters (e.g. nitrate, acetone) are consistently highly ranked predictor variables. The origin of the connection is unclear, and it may simply be a connection between total aerosol burden and INP abundance. Other previously established connections, for example, with large particles and with biogenic particles, also exhibit highly ranked importance. However, even these features do not have the strength to suggest cause and effect.
There are distinct differences between measurements in the winter and spring–summer seasons. The winter measurements made with PINC appear to be nearly independent of any monitored variable and rather appear to reflect INP concentrations driven by processes external to the measurement site – most plausibly long-range transport from diverse, distant sources, as indicated by the log-normal concentration distribution (Fig. 4) and the absence of local predictor correlations. This potentially suggests that, in southern Finland, winter INPs largely originate from long-range transport and are reflective of the mixing and dilution of INPs from many sources. The spring–summer measurements conducted with PINCii appear to be more linked to and respond to the ambient aerosol properties. This is consistent with previous work with longer-term averages (Schneider et al., 2021) that showed that, in 2018, at SMEAR II, the INP concentrations increased as spring arrived and the ecosystem awoke. That said, more work and longer-term high-frequency measurements would be needed to close the loop and to examine whether there is consistency between seasonal trends and high-resolution measurements.
The weak correlations observed in this study, combined with the log-normal INP concentration distributions consistent with random dilution of trace species, suggest that INPs at this boreal site are dominated by long-range transport from diverse, distant sources. In such a regime, no local measurement suite – however comprehensive – can be expected to yield strong, causal predictor–INP relationships because the INP identity and source vary stochastically with air mass origin. This interpretation is independently supported by Paramonov et al. (2020b), who reached a similar conclusion using the same PINC dataset at the same site. We therefore propose that future campaigns should complement high-frequency INP measurements with source-apportionment tools (e.g. back-trajectory analysis, receptor modelling) to evaluate consistency with the long-range transport hypothesis and to constrain the geographic origins and aerosol types that plausibly contribute to the INP population – recognising that trajectory-based tools alone cannot uniquely verify INP provenance without tracer or receptor constraints. The question “why can we not predict INPs from local measurements?” is itself a scientifically valuable finding: it constrains the problem space and guides the field toward approaches that account for air mass history rather than relying solely on local co-located tracers.
Given the rarefied nature and high spatial and temporal variability of INPs, one underlying conclusion of this study is that, even with vast amounts of complementary data, drawing strong conclusions that can illuminate causality will likely remain illusive. Rather than simply calling for more of the same local measurements, we suggest that future long-term studies at heavily equipped complementary stations – for example, the ACTRIS cloud in situ (CCice) effort and the instrument co-location it enables – should pair high-frequency INP measurements with source apportionment tools (back-trajectory analysis; receptor modelling; and, where available, single-particle ice residual analysis) so that the air mass history behind each measurement is explicitly accounted for. Such an effort could significantly enhance future mobile measurements, where investigators typically have limited scope and resources to choose the “important” complementary measurements.
The full R analysis code used in this study – comprising the multi-seed random forest sensitivity sweep, the dust episode screen, the figure generation script for Fig. 2, and the parent analysis notebook – is archived at https://doi.org/10.5281/zenodo.20367476 (Wu et al., 2026) together with the analysis-ready data. The R version and full list of package versions used to generate the results are captured in the archived session information file; the analysis was performed in R 4.6.0 with the randomForest, rpart, ggplot2, dplyr, and readr packages, among others.
The aerosol, trace gas, and meteorological data are available from the SmartSMEAR data repository (https://avaa.tdata.fi/web/smart, last access: 2 July 2026). Contact with the original data contributors can be requested from atmdata@helsinki.fi. The INP data presented in this study are available at https://doi.org/10.5281/zenodo.5141574 (Brasseur et al., 2021). Derived analysis-ready datasets (the harmonised 20 min feature matrix used as input into the random forest analysis, the multi-seed random forest importance table, and the dust episode screen output) are deposited together with the analysis scripts at https://doi.org/10.5281/zenodo.20367476 (Wu et al., 2026; see the “Code availability” section). The data discussed and presented from PINC are also included in Paramonov et al. (2020b) and are available at https://doi.org/10.3929/ethz-b-000397022 (Paramonov et al., 2020a).
OM, MK, TP, JD, and JK initiated and planned the HyICE-2018 campaign. ZB and JD largely coordinated and oversaw the campaign with the support of the permanent SMEAR II staff. DC, ZB, YW, JD, and EST constructed, troubleshot, and deployed the PINCii during the campaign. ZB, YW, and DC conducted measurements using the PINCii, while PH conducted measurements using the WIBS. EST and JD also participated as campaign supervisors. YW analysed the data and prepared the figures presented here. EST, JD, and YW wrote the paper. All of the authors read and reviewed the paper and contributed to its improvement before and during the review process.
At least one of the (co-)authors is a member of the editorial board of Aerosol Research. The peer-review process was guided by an independent editor, and the authors also have no other competing interests to declare.
Publisher's note: Copernicus Publications remains neutral with regard to jurisdictional claims made in the text, published maps, institutional affiliations, or any other geographical representation in this paper. The authors bear the ultimate responsibility for providing appropriate place names. Views expressed in the text are those of the authors and do not necessarily reflect the views of the publisher.
The authors thank the technical staff of the Hyytiälä Forestry Field Station for their help throughout the HyICE-2018 campaign.
This project received funding from the Research Council of Finland Flagship Programme (ACCC) (grant nos. 337549, 337551, 357902, 357903) and the European Union's Horizon 2020 research and innovation programme under grant agreement nos. 654109 and 739530 and TransNational Access via the ACTRIS-2 HyICE-2018 TNA project. The work of the University of Helsinki was supported by the Academy of Finland Centre of Excellence in Atmospheric Science (grant no. 307331) and NANOBIOMASS (grant no. 307537); ACTRIS-Finland (grant no. 328616); ACTRISCF (grant no. 329274); and the Arctic Community Resilience to Boreal Environmental change: Assessing risks from fire and disease (ACRoBEAR, grant no. 334792) Belmont Forum project. In addition, the work of the University of Helsinki was financially supported by the European Commission through ACTRIS2 and ACTRIS-IMP (grant no. 871115) and ACTRIS2 TransNational Access and through integrative and Comprehensive Understanding on Polar Environments (iCUPE, grant no. 689443), ERA-NET-Cofund and by the University of Helsinki (ACTRIS-HY). EST has been supported by the Swedish Research Councils, VR (grant nos. 2013-05153, 2020-03497) and FORMAS (grant no. 2017-00564), and the Swedish Strategic Research Area MERGE.
This research has been supported by the Research Council of Finland Flagship Programme (ACCC) (grant nos. 337549, 337551, 357902, 357903); the European Commission, EU's Horizon 2020 Framework Programme (grant nos. 654109, 739530, and 871115); the Research Council of Finland, Biotieteiden ja Ympäristön Tutkimuksen Toimikunta (grant nos. 307331, 307537, 328616, 329274, and 334792); the Svenska Forskningsrådet Formas (grant no. 2017-00564); and by the Swedish Research Councils, VR (grant nos. 2013-05153, 2020-03497).
This paper was edited by Luis A. Ladino and reviewed by two anonymous referees.
Adams, M. P., Tarn, M. D., Sanchez-Marroquin, A., Porter, G. C. E., O'Sullivan, D., Harrison, A. D., Cui, Z., Vergara-Temprado, J., Carotenuto, F., Holden, M. A., Daily, M. I., Whale, T. F., Sikora, S. N. F., Burke, I. T., Shim, J.-U., McQuaid, J. B., and Murray, B. J.: A major combustion aerosol event had a negligible impact on the atmospheric ice-nucleating particle population, J. Geophys. Res.-Atmos., 125, e2020JD032938, https://doi.org/10.1029/2020jd032938, 2020. a
Brasseur, Z., Castarède, D., Thomson, E. S., Adams, M. P., Drossaart van Dusseldorp, S., Heikkilä, P., Korhonen, K., Lampilahti, J., Paramonov, M., Schneider, J., and Duplissy, J.: Datasets to: Measurement Report: Introduction to the HyICE-2018 Campaign for Measurements of Ice-Nucleating Particles and Instrument Inter-Comparison in the Hyytiälä Boreal Forest, Zenodo [data set], https://doi.org/10.5281/zenodo.5141575, 2021. a
Brasseur, Z., Castarède, D., Thomson, E. S., Adams, M. P., Drossaart van Dusseldorp, S., Heikkilä, P., Korhonen, K., Lampilahti, J., Paramonov, M., Schneider, J., Vogel, F., Wu, Y., Abbatt, J. P. D., Atanasova, N. S., Bamford, D. H., Bertozzi, B., Boyer, M., Brus, D., Daily, M. I., Fösig, R., Gute, E., Harrison, A. D., Hietala, P., Höhler, K., Kanji, Z. A., Keskinen, J., Lacher, L., Lampimäki, M., Levula, J., Manninen, A., Nadolny, J., Peltola, M., Porter, G. C. E., Poutanen, P., Proske, U., Schorr, T., Silas Umo, N., Stenszky, J., Virtanen, A., Moisseev, D., Kulmala, M., Murray, B. J., Petäjä, T., Möhler, O., and Duplissy, J.: Measurement report: Introduction to the HyICE-2018 campaign for measurements of ice-nucleating particles and instrument inter-comparison in the Hyytiälä boreal forest, Atmos. Chem. Phys., 22, 5117–5145, https://doi.org/10.5194/acp-22-5117-2022, 2022. a, b, c, d, e, f, g, h, i, j, k, l
Brasseur, Z., Schneider, J., Lampilahti, J., Vakkari, V., Sinclair, V. A., Williamson, C. J., Xavier, C., Moisseev, D., Hartmann, M., Poutanen, P., Lampimäki, M., Kulmala, M., Petäjä, T., Lehtipalo, K., Thomson, E. S., Höhler, K., Möhler, O., and Duplissy, J.: Vertical distribution of ice nucleating particles over the boreal forest of Hyytiälä, Finland, Atmos. Chem. Phys., 24, 11305–11332, https://doi.org/10.5194/acp-24-11305-2024, 2024. a, b, c, d
Castarède, D., Brasseur, Z., Wu, Y., Kanji, Z. A., Hartmann, M., Ahonen, L., Bilde, M., Kulmala, M., Petäjä, T., Pettersson, J. B. C., Sierau, B., Stetzer, O., Stratmann, F., Svenningsson, B., Swietlicki, E., Thu Nguyen, Q., Duplissy, J., and Thomson, E. S.: Development and characterization of the Portable Ice Nucleation Chamber 2 (PINCii), Atmos. Meas. Tech., 16, 3881–3899, https://doi.org/10.5194/amt-16-3881-2023, 2023. a, b, c
Chou, C., Stetzer, O., Weingartner, E., Jurányi, Z., Kanji, Z. A., and Lohmann, U.: Ice nuclei properties within a Saharan dust event at the Jungfraujoch in the Swiss Alps, Atmos. Chem. Phys., 11, 4725–4738, https://doi.org/10.5194/acp-11-4725-2011, 2011. a, b
Dal Maso, M., Kulmala, M., Riipinen, I., Wagner, R., Hussein, T., Aalto, P. P., and Lehtinen, K. E.: Formation and growth of fresh atmospheric aerosols: eight years of aerosol size distribution data from SMEAR II, Hyytiala, Finland, Boreal Environ. Res., 10, 323–336, 2005. a, b
DeMott, P. J.: An exploratory study of ice nucleation by soot aerosols, J. Appl. Meteorol. Clim., 29, 1072–1079, https://doi.org/10.1175/1520-0450(1990)029<1072:aesoin>2.0.co;2, 1990. a, b, c
DeMott, P. J., Prenni, A. J., Liu, X., Kreidenweis, S. M., Petters, M. D., Twohy, C. H., Richardson, M. S., Eidhammer, T., and Rogers, D. C.: Predicting global atmospheric ice nuclei distributions and their impacts on climate, P. Natl. Acad. Sci. USA, 107, 11217–11222, https://doi.org/10.1073/pnas.0910818107, 2010. a, b, c, d, e, f, g, h
DeMott, P. J., Prenni, A. J., McMeeking, G. R., Sullivan, R. C., Petters, M. D., Tobo, Y., Niemand, M., Möhler, O., Snider, J. R., Wang, Z., and Kreidenweis, S. M.: Integrating laboratory and field data to quantify the immersion freezing ice nucleation activity of mineral dust particles, Atmos. Chem. Phys., 15, 393–409, https://doi.org/10.5194/acp-15-393-2015, 2015. a, b, c, d, e
Garimella, S., Kristensen, T. B., Ignatius, K., Welti, A., Voigtländer, J., Kulkarni, G. R., Sagan, F., Kok, G. L., Dorsey, J., Nichman, L., Rothenberg, D. A., Rösch, M., Kirchgäßner, A. C. R., Ladkin, R., Wex, H., Wilson, T. W., Ladino, L. A., Abbatt, J. P. D., Stetzer, O., Lohmann, U., Stratmann, F., and Cziczo, D. J.: The SPectrometer for Ice Nuclei (SPIN): an instrument to investigate ice nucleation, Atmos. Meas. Tech., 9, 2781–2795, https://doi.org/10.5194/amt-9-2781-2016, 2016. a
Garimella, S., Rothenberg, D. A., Wolf, M. J., David, R. O., Kanji, Z. A., Garimella, S., Rothenberg, D. A., Wolf, M. J., David, R. O., Kanji, Z. A., Wang, C., Rösch, M., and Cziczo, D. J.: Uncertainty in counting ice nucleating particles with continuous flow diffusion chambers, Atmos. Chem. Phys., 17, 10855–10864, https://doi.org/10.5194/acp-17-10855-2017, 2017. a
Hari, P. and Kulmala, M.: Station for measuring Ecosystem-Atmosphere relations (SMEAR II), Boreal Environ. Res., 10, 315–322, 2005. a, b
Heiskanen, J., Brümmer, C., Buchmann, N., Calfapietra, C., Chen, H., Gielen, B., Gkritzalis, T., Hammer, S., Hartman, S., Herbst, M., Janssens, I. A., Jordan, A., Juurola, E., Karstens, U., Kasurinen, V., Kruijt, B., Lankreijer, H., Levin, I., Linderson, M.-L., Loustau, D., Merbold, L., Myhre, C. L., Papale, D., Pavelka, M., Pilegaard, K., Ramonet, M., Rebmann, C., Rinne, J., Rivier, L., Saltikoff, E., Sanders, R., Steinbacher, M., Steinhoff, T., Watson, A., Vermeulen, A. T., Vesala, T., Vítková, G., and Kutsch, W.: The integrated carbon observation system in Europe, B. Am. Meteorol. Soc., 103, E855–E872, https://doi.org/10.1175/bams-d-19-0364.1, 2022. a
Junninen, H., Lauri, A., Keronen, P., Aalto, P., Hiltunen, V., Hari, P., and Kulmala, M.: Smart-SMEAR: on-line data exploration and visualization tool for SMEAR stations, Boreal Environ. Res., 14, 447–457, 2009. a
Kanji, Z. A., Welti, A., Chou, C., Stetzer, O., and Lohmann, U.: Laboratory studies of immersion and deposition mode ice nucleation of ozone aged mineral dust particles, Atmos. Chem. Phys., 13, 9097–9118, https://doi.org/10.5194/acp-13-9097-2013, 2013. a
Kanji, Z. A., Sullivan, R. C., Niemand, M., DeMott, P. J., Prenni, A. J., Chou, C., Saathoff, H., and Möhler, O.: Heterogeneous ice nucleation properties of natural desert dust particles coated with a surrogate of secondary organic aerosol, Atmos. Chem. Phys., 19, 5091–5110, https://doi.org/10.5194/acp-19-5091-2019, 2019. a
Kulmala, M., Kontkanen, J., Junninen, H., Lehtipalo, K., Manninen, H. E., Nieminen, T., Petäjä, T., Sipilä, M., Schobesberger, S., Rantala, P., Franchin, A., Jokinen, T., Järvinen, E., Äijälä, M., Kangasluoma, J., Hakala, J., Aalto, P. P., Paasonen, P., Mikkilä, J., Vanhanen, J., Aalto, J., Hakola, H., Makkonen, U., Ruuskanen, T., Mauldin, R. L., Duplissy, J., Vehkamäki, H., Bäck, J., Kortelainen, A., Riipinen, I., Kurtén, T., Johnston, M. V., Smith, J. N., Ehn, M., Mentel, T. F., Lehtinen, K. E. J., Laaksonen, A., Kerminen, V.-M., and Worsnop, D. R.: Direct Observations of Atmospheric Aerosol Nucleation, Science, 339, 943–946, https://doi.org/10.1126/science.1227385, 2013. a, b, c
Mahrt, F., Alpert, P. A., Dou, J., Grönquist, P., Arroyo, P. C., Ammann, M., Lohmann, U., and Kanji, Z. A.: Aging induced changes in ice nucleation activity of combustion aerosol as determined by near edge X-ray absorption fine structure (NEXAFS) spectroscopy, Environmental Science: Processes & Impacts, 22, 895–907, https://doi.org/10.1039/c9em00525k, 2020a. a, b, c
Mahrt, F., Kilchhofer, K., Marcolli, C., Grönquist, P., David, R. O., Rösch, M., Lohmann, U., and Kanji, Z. A.: The impact of cloud processing on the ice nucleation abilities of soot particles at cirrus temperatures, J. Geophys. Res.-Atmos., 125, e2019JD030922, https://doi.org/10.1029/2019jd030922, 2020b. a, b
Meinander, O., Kouznetsov, R., Uppstu, A., Sofiev, M., Kaakinen, A., Salminen, J., Rontu, L., Welti, A., Francis, D., Piedehierro, A. A., Heikkilä, P., Heikkinen, E., and Laaksonen, A.: African dust transport and deposition modelling verified through a citizen science campaign in Finland, Scientific Reports, 13, 21379, https://doi.org/10.1038/s41598-023-46321-7, 2023. a
Morris, C. E., Conen, F., Alex Huffman, J., Phillips, V., Pöschl, U., and Sands, D. C.: Bioprecipitation: a feedback cycle linking Earth history, ecosystem dynamics and land use through biological ice nucleators in the atmosphere, Glob. Change Biol., 20, 341–351, https://doi.org/10.1111/gcb.12447, 2014. a
Morrison, H., De Boer, G., Feingold, G., Harrington, J., Shupe, M. D., and Sulia, K.: Resilience of persistent Arctic mixed-phase clouds, Nat. Geosci., 5, 11–17, https://doi.org/10.1038/ngeo1332, 2012. a
Murray, B., O'sullivan, D., Atkinson, J., and Webb, M.: Ice nucleation by particles immersed in supercooled cloud droplets, Chem. Soc. Rev., 41, 6519–6554, https://doi.org/10.1039/c2cs35200a, 2012. a
Mülmenstädt, J., Sourdeval, O., Delanoë, J., and Quaas, J.: Frequency of Occurrence of Rain from Liquid-, Mixed-, and Ice-Phase Clouds Derived from A-Train Satellite Retrievals, Geophys. Res. Lett., 42, 6502–6509, https://doi.org/10.1002/2015GL064604, 2015. a, b
Ott, W. R.: A physical explanation of the lognormality of pollutant concentrations, J. Air Waste Manage., 40, 1378–1383, https://doi.org/10.1080/10473289.1990.10466789, 1990. a, b
Pandolfi, M., Alados-Arboledas, L., Alastuey, A., Andrade, M., Angelov, C., Artiñano, B., Backman, J., Baltensperger, U., Bonasoni, P., Bukowiecki, N., Collaud Coen, M., Conil, S., Coz, E., Crenn, V., Dudoitis, V., Ealo, M., Eleftheriadis, K., Favez, O., Fetfatzis, P., Fiebig, M., Flentje, H., Ginot, P., Gysel, M., Henzing, B., Hoffer, A., Holubova Smejkalova, A., Kalapov, I., Kalivitis, N., Kouvarakis, G., Kristensson, A., Kulmala, M., Lihavainen, H., Lunder, C., Luoma, K., Lyamani, H., Marinoni, A., Mihalopoulos, N., Moerman, M., Nicolas, J., O'Dowd, C., Petäjä, T., Petit, J.-E., Pichon, J. M., Prokopciuk, N., Putaud, J.-P., Rodríguez, S., Sciare, J., Sellegri, K., Swietlicki, E., Titos, G., Tuch, T., Tunved, P., Ulevicius, V., Vaishya, A., Vana, M., Virkkula, A., Vratolis, S., Weingartner, E., Wiedensohler, A., and Laj, P.: A European aerosol phenomenology – 6: scattering properties of atmospheric aerosol particles from 28 ACTRIS sites, Atmos. Chem. Phys., 18, 7877–7911, https://doi.org/10.5194/acp-18-7877-2018, 2018. a
Paramonov, M., Drossaart van Dusseldorp, S., and Gute, E.: Condensation/immersion mode ice nucleating particles in a boreal environment, ETH Zurich [data set], https://doi.org/10.3929/ethz-b-000397022, 2020a. a
Paramonov, M., Drossaart van Dusseldorp, S., Gute, E., Abbatt, J. P. D., Heikkilä, P., Keskinen, J., Chen, X., Luoma, K., Heikkinen, L., Hao, L., Petäjä, T., and Kanji, Z. A.: Condensation/immersion mode ice-nucleating particles in a boreal environment, Atmos. Chem. Phys., 20, 6687–6706, https://doi.org/10.5194/acp-20-6687-2020, 2020b. a, b, c, d, e, f, g, h, i, j
Pisso, I., Sollum, E., Grythe, H., Kristiansen, N. I., Cassiani, M., Eckhardt, S., Arnold, D., Morton, D., Thompson, R. L., Groot Zwaaftink, C. D., Evangeliou, N., Sodemann, H., Haimberger, L., Henne, S., Brunner, D., Burkhart, J. F., Fouilloux, A., Brioude, J., Philipp, A., Seibert, P., and Stohl, A.: The Lagrangian particle dispersion model FLEXPART version 10.4, Geosci. Model Dev., 12, 4955–4997, https://doi.org/10.5194/gmd-12-4955-2019, 2019. a
Proske, U., Adams, M. P., Porter, G. C. E., Holden, M. A., Bäck, J., and Murray, B. J.: Measurement report: The ice-nucleating activity of lichen sampled in a northern European boreal forest, Atmos. Chem. Phys., 25, 979–995, https://doi.org/10.5194/acp-25-979-2025, 2025. a, b, c
Sanchez-Marroquin, A., Arnalds, O., Baustian-Dorsi, K. J., Browse, J., Dagsson-Waldhauserova, P., Harrison, A. D., Maters, E. C., Pringle, K. J., Vergara-Temprado, J., Burke, I. T., McQuaid, J. B., Carslaw, K. S., and Murray, B. J.: Iceland is an episodic source of atmospheric ice-nucleating particles relevant for mixed-phase clouds, Science Advances, 6, eaba8137, https://doi.org/10.1126/sciadv.aba8137, 2020. a
Santos, L., Salo, K., Kong, X., Hartmann, M., Sjöblom, J., and Thomson, E.: Marine fuel regulations and engine emissions: Impacts on physicochemical properties, cloud activity and emission factors, J. Geophys. Res.-Atmos., 129, e2023JD040389, https://doi.org/10.1029/2023jd040389, 2024. a
Savage, N. J., Krentz, C. E., Könemann, T., Han, T. T., Mainelis, G., Pöhlker, C., and Huffman, J. A.: Systematic characterization and fluorescence threshold strategies for the wideband integrated bioaerosol sensor (WIBS) using size-resolved biological and interfering particles, Atmos. Meas. Tech., 10, 4279–4302, https://doi.org/10.5194/amt-10-4279-2017, 2017. a
Schneider, J., Höhler, K., Heikkilä, P., Keskinen, J., Bertozzi, B., Bogert, P., Schorr, T., Umo, N. S., Vogel, F., Brasseur, Z., Wu, Y., Hakala, S., Duplissy, J., Moisseev, D., Kulmala, M., Adams, M. P., Murray, B. J., Korhonen, K., Hao, L., Thomson, E. S., Castarède, D., Leisner, T., Petäjä, T., and Möhler, O.: The seasonal cycle of ice-nucleating particles linked to the abundance of biogenic aerosol in boreal forests, Atmos. Chem. Phys., 21, 3899–3918, https://doi.org/10.5194/acp-21-3899-2021, 2021. a, b, c, d, e, f, g, h, i, j
Schrod, J., Thomson, E. S., Weber, D., Kossmann, J., Pöhlker, C., Saturno, J., Ditas, F., Artaxo, P., Clouard, V., Saurel, J.-M., Ebert, M., Curtius, J., and Bingemer, H. G.: Long-term deposition and condensation ice-nucleating particle measurements from four stations across the globe, Atmos. Chem. Phys., 20, 15983–16006, https://doi.org/10.5194/acp-20-15983-2020, 2020. a
Shupe, M. D. and Intrieri, J. M.: Cloud Radiative Forcing of the Arctic Surface: The Influence of Cloud Properties, Surface Albedo, and Solar Zenith Angle, J. Climate, 17, 616–628, https://doi.org/10.1175/1520-0442(2004)017<0616:crfota>2.0.co;2, 2004. a
Shupe, M. D., Persson, P. O. G., Brooks, I. M., Tjernström, M., Sedlar, J., Mauritsen, T., Sjogren, S., and Leck, C.: Cloud and boundary layer interactions over the Arctic sea ice in late summer, Atmos. Chem. Phys., 13, 9379–9399, https://doi.org/10.5194/acp-13-9379-2013, 2013. a
University of Helsinki: SMEAR: Station for Measuring Ecosystem–Atmosphere Relations, https://smear.avaa.csc.fi/, last access: 2 July 2026. a
Stein, A. F., Draxler, R. R., Rolph, G. D., Stunder, B. J. B., Cohen, M. D., and Ngan, F.: NOAA's HYSPLIT Atmospheric Transport and Dispersion Modeling System, B. Am. Meteorol. Soc., 96, 2059–2077, https://doi.org/10.1175/BAMS-D-14-00110.1, 2015. a
Stetzer, O., Baschek, B., Lueoeond, F., and Lohmann, U.: The Zurich Ice Nucleation Chamber (ZINC) - A new instrument to investigate atmospheric ice formation, Aerosol Sci. Technol., 42, 64–74, https://doi.org/10.1080/02786820701787944, 2008. a
Swedish Infrastructure for Ecosystem Science: SITES: Swedish Infrastructure for Ecosystem Science, https://www.fieldsites.se/ (last access: 2 July 2026), 2021. a
Tang, D., Wei, T., Yuan, J., Xia, H., and Dou, X.: Observation of bioaerosol transport using wideband integrated bioaerosol sensor and coherent Doppler lidar, Atmos. Meas. Tech., 15, 2819–2838, https://doi.org/10.5194/amt-15-2819-2022, 2022. a
Testa, B., Durdina, L., Alpert, P. A., Mahrt, F., Dreimol, C. H., Edebeli, J., Spirig, C., Decker, Z. C. J., Anet, J., and Kanji, Z. A.: Soot aerosols from commercial aviation engines are poor ice-nucleating particles at cirrus cloud temperatures, Atmos. Chem. Phys., 24, 4537–4567, https://doi.org/10.5194/acp-24-4537-2024, 2024. a
Thomson, E., Weber, D., Bingemer, H., Tuomi, J., Ebert, M., and Pettersson, J.: Intensification of ice nucleation observed in ocean ship emissions, Scientific Reports, 8, 1111, https://doi.org/10.1038/s41598-018-19297-y, 2018. a
Tobo, Y., Prenni, A. J., DeMott, P. J., Huffman, J. A., McCluskey, C. S., Tian, G., Pöhlker, C., Pöschl, U., and Kreidenweis, S. M.: Biological aerosol particles as a key determinant of ice nuclei populations in a forest ecosystem, J. Geophys. Res.-Atmos., 118, 10100–10110, https://doi.org/10.1002/jgrd.50801, 2013. a, b, c, d, e, f, g, h, i, j, k
Tobo, Y., Adachi, K., DeMott, P. J., Hill, T. C. J., Hamilton, D. S., Mahowald, N. M., Nagatsuka, N., Ohata, S., Uetake, J., Kondo, Y., and Koike, M.: Glacially sourced dust as a potentially significant source of ice nucleating particles, Nat. Geosci., 12, 253–258, https://doi.org/10.1038/s41561-019-0314-x, 2019. a, b
Vogel, F., Adams, M. P., Lacher, L., Foster, P. B., Porter, G. C. E., Bertozzi, B., Höhler, K., Schneider, J., Schorr, T., Umo, N. S., Nadolny, J., Brasseur, Z., Heikkilä, P., Thomson, E. S., Büttner, N., Daily, M. I., Fösig, R., Harrison, A. D., Keskinen, J., Proske, U., Duplissy, J., Kulmala, M., Petäjä, T., Möhler, O., and Murray, B. J.: Ice-nucleating particles active below −24 °C in a Finnish boreal forest and their relationship to bioaerosols, Atmos. Chem. Phys., 24, 11737–11757, https://doi.org/10.5194/acp-24-11737-2024, 2024. a, b, c
Welti, A., Müller, K., Fleming, Z. L., and Stratmann, F.: Concentration and variability of ice nuclei in the subtropical maritime boundary layer, Atmos. Chem. Phys., 18, 5307–5320, https://doi.org/10.5194/acp-18-5307-2018, 2018. a
Welti, A., Bigg, E. K., DeMott, P. J., Gong, X., Hartmann, M., Harvey, M., Henning, S., Herenz, P., Hill, T. C. J., Hornblow, B., Leck, C., Löffler, M., McCluskey, C. S., Rauker, A. M., Schmale, J., Tatzelt, C., van Pinxteren, M., and Stratmann, F.: Ship-based measurements of ice nuclei concentrations over the Arctic, Atlantic, Pacific and Southern oceans, Atmos. Chem. Phys., 20, 15191–15206, https://doi.org/10.5194/acp-20-15191-2020, 2020. a
Wu, Y., Brasseur, Z., Castarède, D., Heikkilä, P., Keskinen, J., Möhler, O., Kulmala, M., Petäjä, T., Thomson, E. S., and Duplissy, J.: HyICE-2018 INP analysis code: machine-learning variable screening, multi-seed random-forest sensitivity, and dust-episode screen (ar-2026-4), Zenodo [code], https://doi.org/10.5281/zenodo.20367476, 2026. a, b