the Creative Commons Attribution 4.0 License.
the Creative Commons Attribution 4.0 License.
 | 20 Jul 2026
From seeding to detachment: leveraging deep learning to quantify the transport of tyre wear microplastics in a wind tunnel
Bashir Olasunkanmi Ayinde
Wolfgang Babel
Johannes Olesch
Daniel Wagner
Seema Agarwal
Christian Laforsch
Julian Brehm
Anke Nölscher
Christoph Karl Thomas
The transport of tyre wear particles (TWPs) remains poorly understood despite its recognized contribution to airborne microplastic pollution. We address this knowledge gap by investigating how idealized tyre wear particles detach from an idealized reference surface under controlled wind tunnel conditions. Our study aimed at simplifying the system and isolating the fundamental mechanisms controlling how particle size and shape influence this important initial transport mode. The experiments were conducted in a boundary-layer wind tunnel, where a near-monolayer of particles was seeded onto glass substrates. Time-resolved visual imaging at 0.1 Hz was combined with automatic image analysis using an open-source, deep learning segmentation model, which allows for detecting individual particles, quantifying their detachment, and tracking their size and shape with high model accuracy. For the detachment experiments, pristine tyre wear particles generated on a laboratory test stand with car test tyres supplied by Continental Reifen Deutschland GmbH, providing a well-characterized and idealized particle source. Among the seeding methods tested, we identified a low-cost pressurized seeding approach to produce the most uniform and reproducible particle distribution for subsequent detachment analysis. Across the analysed size range (80 to 300 µm), larger and more irregularly shaped particles exhibited significantly higher threshold friction velocities for detachment than smaller and more rounded particles. Ensemble fits yield a bulk threshold friction velocity of approximately 0.26 m s−1, with size- and shape-resolved detachment threshold velocity values varying by a factor of approximately 1.3 between the most easily detached and most resistant particles. The application of the Shao and Lu semi-empirical fluid threshold model reproduced the size-dependent threshold friction velocity of smooth polyethylene microspheres investigated in a preceding study using the identical wind tunnel, but it underestimates that of tyre wear particles unless the effective cohesion and aerodynamic scaling parameter are increased beyond values typically used for dust and sand. This behaviour is consistent with tyre wear particles experiencing stronger, more effective adhesion than smooth, rounded grains of similar size due to their irregular morphology and multiple contact points with the substrate. The density differences between the tyre wear particles (∼1300 kg m−3) and microspheres (∼1025 kg m−3) showed negligible influence within the studied size range (106 to 125 µm). We conclude that particle morphology, specified by both size and shape, plays a dominant role in controlling the aerodynamic detachment from the idealized glass substrate. This morphological effect was evident across the investigated TWP size range, whereas density effects were secondary within the compared particle types. Because controlled laboratory studies using well-defined particles and simplified surfaces are a necessary step towards isolating these fundamental mechanisms, our findings provide insights for improving microplastic and tyre wear particle resuspension models and highlight the need for future studies on more realistic environmental surfaces and broader particle size and density ranges.
- Article
(11740 KB) - Full-text XML
- BibTeX
- EndNote


Microplastics (MPs), defined as plastic particles smaller than 5 mm, are among the highly discussed topics that have garnered significant global attention due to their ubiquitous nature in the environment (Arthur et al., 2009; Sundt et al., 2014). Although tyre wear particles (TWPs) have been recognized as pollutants since the late 1970s (Cadle and Williams, 1978), they were only recently identified as MPs (Sundt et al., 2014). Earlier studies on MPs primarily focused on microbeads from pharmaceuticals and personal care products (Gregory, 1996), as well as fragmentation and weathering of larger plastics. These particles find their way into all environmental compartments, having multifaceted impacts on ecosystems, organisms, and human health (Luo et al., 2021; Osuoha et al., 2023; Piehl et al., 2018; Horton and Dixon, 2018; Laforsch et al., 2021). In recent years, more attention has been given to MPs in marine environments and their shorelines (Laglbauer et al., 2014; van Calcar and van Emmerik, 2019). However, as more research emerges on this topic, we see the need to investigate MP transport in other environmental compartments, including the terrestrial ecosystem, urban air, and non-exhaust traffic particles, thereby drawing more attention to additional, less obvious MP sources and materials, including TWPs (Laermanns et al., 2021; Bigalke et al., 2022; Järlskog et al., 2022; Kernchen et al., 2024).
In the context of MPs, tyre and road wear particles (TRWPs) are generated through the continuous friction between tyres and the road surfaces, releasing particulates of different sizes, shapes, and compositions that can be transported by wind or runoff (Kreider et al., 2010; Baensch-Baltruschat et al., 2020; Beji et al., 2023; Bondorf et al., 2025). TRWPs constitute a complex mixture of diverse particulates (Gunawardana et al., 2012). Despite many studies focusing on the chemistry and morphology (Kreider et al., 2010; Sommer et al., 2018; Kim et al., 2021), eco-toxicology effects on human health (Wik et al., 2008; Marwood et al., 2011; Turner and Rice, 2010; Gualtieri et al., 2005), and overall emission rates of these particles (Hillenbrand et al., 2005; Lee et al., 2019; Mennekes and Nowack, 2022), there remains a notable gap in understanding their behaviour pre- and post-deposition onto various surfaces, including road surfaces and other structures. Particularly, the mechanism by which these particles detach from, move across, and get entrained from these surfaces into the fluid flow remains understudied, despite its significance in determining whether particles remain on the surface or become mobilized. In real road environments, this mobilization is driven not only by aerodynamic forcing but also by a combination of mechanical forcings, including tyre passage, vehicle-induced vibrations, and wake turbulence (Hesse et al., 2022).
Similarly to dust and other MP particulate transport, multiple factors – including inherent entrainment forces such as aerodynamic drag and lift and stabilizing forces such as adhesion, cohesion, electrostatic, and gravity – act at the interface between particles and the substrate, thus influencing the detachment behaviour of TWPs (Grigoratos and Martini, 2015; Esders et al., 2023). Existing studies on the aeolian dynamics and mechanisms governing MP detachment, resuspension, and deposition under simulated free-stream velocity and surface conditions have relied on numerical models and experimental methods, which evolved from erosion modelling (Chepil, 1945; Shao and Li, 1999; Liu et al., 2019). Due to their simplicity and convenience, most experimental designs and models assume or sometimes prefer to use particles that are spherical in nature (Shao and Lu, 2000; Ibrahim et al., 2003). For instance, Esders et al. (2023) studied how microsphere-to-microsphere collisions affect detachment behaviour of borosilicate and polyethylene (PE) particles of various sizes on glass substrate. They pointed out that collision plays a critical role in modulating the detachment threshold of these microspheres. The effect of surface roughness of substrates and particle sizes significantly influences the detachment threshold to mobilize and transport particles from surfaces, as studied by Kassab et al. (2013). In contrast, perfect spherical particles are rare in environmental settings (Olivares et al., 2024), and the balance of forces could further be complicated by the irregular nature of particles which do not conform to the spherical assumptions. Interestingly, Olivares et al. (2024) performed experimental studies using irregular and flat-shaped micro-particles corroborated with a Monte Carlo simulation model. Their results highlighted that while smaller irregular particles may exhibit higher removal efficiency, the overall removal fraction of irregularly shaped particles remains significantly lower than that of glass microspheres of similar cohorts subject to identical aerodynamic forces.
Understanding the importance of the threshold friction velocity () value is critical in particle detachment, as it represents the minimum wind-induced stress required to overcome adhesive and gravitational forces and initiate particle migration. Shao and Lu (2000) provided a theoretical force balance model for predicting this threshold, originally formulated for spherical particles. They explicitly account for how cohesive forces such as van der Waals and electrostatic forces can dominate for smaller particles, while gravitational forces become more significant for larger ones. By balancing these forces against the aerodynamic forces, the particle type threshold friction velocity can be predicted. Despite this model being validated primarily on spherical particles with experimental observations, it remains a core force balance framework which can be adopted for irregularly shaped particles (Del Bello et al., 2021). However, for particles with irregularly shaped geometries, such as those from tyre wear, it is important to evaluate model-predicted thresholds by using experimental results across particle sizes and shapes.
Particle detachment is further complicated by spatial variations in how particles are deposited on the substrate, such as clustering, agglomeration, and differences in particle number density. These deposition characteristics are influenced by the seeding method and can affect the uniformity and reproducibility of detachment experiments. Various seeding approaches have been used in dust and powder depositional studies, including dust-cloud generation (Goossens and Van Kerschaever, 1999), injection and fan mixing (Jiang et al., 2011), and some advanced pressurized solutions (e.g. the PALAS RBG 1000; Theron et al., 2020), to achieve a uniform, near-monolayer deposit with minimal agglomerates. Some conventional seeding techniques, such as tipping and sieving, have also been used due to their low cost and simplicity (Qasem et al., 2014; Beattie et al., 2012; Chanchangi et al., 2020). The deposited particles often settle in clusters, thereby introducing bias in predicting the threshold velocity needed to dislodge particles. Consequently, to address the inherent limitations of these conventional approaches, we implemented a cost-effective and efficient alternative that achieves near-monolayer deposition with reduced agglomeration while being uniformly distributed, offering a more realistic, yet controlled solution for particle deposition on test surfaces.
Most previous detachment studies employed traditional image processing approaches to detect and count particles frame by frame. For instance, Esders et al. (2022) applied an algorithm requiring fluorescence-induced colour intensity thresholding to quantitatively determine the number of microspheres in each frame. Similarly, an optical microscope system coupled with image analysis software, which also employs binary thresholding and water segmentation, was used to quantify detached microspheres (Barth et al., 2014). However, this approach can be more time-consuming, is prone to operator bias, and may lack the precision required for accurately identifying individual particles with complex shapes (Marsh et al., 2018; Zhu et al., 2021). Consequently, accurately detecting and quantifying MPs can be challenging without the use of more complex image processing or costly optical systems.
Recently, the application of deep learning to environmental pollution research has expanded considerably (Astorayme et al., 2024; Ayinde et al., 2024; Zailan et al., 2022; Zhao et al., 2024), with a growing focus on detection, segmentation, and quantitative characterization of particulate pollutants and plastic debris in microscopic images (Zeng et al., 2021; Chazhoor et al., 2022; Thammasanya et al., 2024; Liang et al., 2023; Jia et al., 2024). Convolutional neural networks (CNNs) underpin many of these deep learning models, enabling them to learn hierarchical feature representations that excel at detecting and delineating objects against complex backgrounds (Benali Amjoud and Amrouch, 2020). CNN-based architectures perform relatively well in classifying plastic waste (Chazhoor et al., 2022). We here underscore the breakthrough of these models in discerning smaller particles in the form of MPs. Xu and Wang (2024) used U-Net-based instance segmentation models to accurately segment MPs collected from water, reporting segmentation accuracies above 91 %. Strikingly, MP particles within the range of 1–10 µm performed relatively well using an exposure time of 0.4 s and confidence level reaching approximately 85 % (Lim et al., 2024). Notably, “You Only Look Once (Yolo)” architectures have gained widespread recognition for their speed, accuracy, and flexibility in both object detection and instance segmentation (Firdauz et al., 2023; Li et al., 2023; Xu et al., 2023). The latest generation, Yolo Version 8, developed in January 2023, offers enhanced performance, making it well suited for various image processing tasks. While deep learning techniques have seen growing use in MP studies, their application to detachment and resuspension processes remains unexplored.
To address these limitations, we employ the state-of-the-art deep-learning-based instance segmentation model YoloV8nano (YoloV8n), which detects individual TWPs as separate objects and delineates their pixel-level boundaries to quantify their detachment dynamics. This enables the characterization and comparison of the spatial deposition patterns and their influence on detachment behaviour, thereby helping to bridge the existing knowledge gap and enhancing our understanding of how TWPs behave on near-real-world surfaces. In light of these scientific needs, our research aimed at advancing the experimental analysis of TWP detachment, with a special focus on TWPs generated on a laboratory test stand from a car tyre and deposited on a laboratory-standard dry glass substrate. This simplified and well-characterized particle–surface system is meant to serve as a reference for comparing the results from idealized spherical particles with those for TWPs. It also minimizes additional complexities present in real-world environments, including the road dust, surface heterogeneity, and environmental ageing, thereby establishing a mechanistic baseline to help improve the representation of TWP mobilization in environmental transport models. The objective of this study is to isolate the fundamental mechanisms controlling TWP detachment under idealized laboratory conditions. First, we examine which seeding method best achieves a representative and uniform deposition of TWPs on glass substrates, then we investigate how evolving aerodynamic conditions impact the detachment rates of TWPs, in contrast with microspheres of the same group, and whether particle shape significantly alters the threshold friction velocity required for detachment.
Although this setup does not reproduce the full complexity of real road environments, it provides a controlled mechanistic baseline for investigating whether particle morphology, particularly size and shape, governs preferential detachment under prescribed aerodynamic forcing. The value of the findings from this first experiment lies not in providing threshold values directly applicable in this field, but in identifying the physical mechanisms that control the preferential detachment. Answering these fundamental questions first is crucial for enhancing our understanding of how MPs and TWPs are mobilized from surface-bound deposits before entrainment and redistribution in the environment.
Conventional image processing techniques are widely adapted in detachment studies to detect particle images and analyse detachment under turbulent flow conditions in wind tunnels. However, these approaches require extensive manual preprocessing to reduce noise and capture key features, which may introduce subjective choices and be time-consuming when applied frame by frame to high-frequency image series. To overcome these shortcomings, we propose an integrated methodology that leverages advanced computer vision techniques to resolve particle detachment, including controlled particle seeding and standardized image acquisition, optimized training, and retrospectively synchronized airflow measurements (Fig. 1). Subsequent sections elaborate on the experimental approaches employed in this study.

Figure 1Overall workflow in the experimental framework. This comprises three stages: (a) seeding and high-resolution image acquisition of particles via pressurized, sieving, and tipping; (b) the deep-learning-based image segmentation and model optimization; (c) quantification of particle detachment and airflow measurement.
2.1 Wind tunnel experimental setup and particle seeding systems
The experiments were conducted in an open-circuit boundary layer wind tunnel (Fig. 2), which is identical to the one used by Esders et al. (2023). The wind tunnel is 730 cm long. The test section is approximately 300 cm long and has a rectangular cross-section measuring 54 cm × 27 cm. The inner walls of the wind tunnel are lined with polystyrene foam, and flow is controlled by a set of 12 fans 26.5 cm in diameter (RAB O TURBO 250, DALAP GmbH; Germany), supported by a stepless transformer (LSS 720-K, Thalheimer Transformatorenwerke GmbH, Germany) controlled and adjusted by an automated robotic system, which enabled smooth, continuous, and reproducible variation in the output voltage up to the maximum level. Ambient laboratory air is drawn into the tunnel by the fan system and passes through a honeycomb flow straightener to maintain uniform and well-conditioned flow conditions entering the contraction zone before entering the test section. The flow is subsequently discharged into the outside air. A HEPA filter (EU2 classification, 10 µm pore size; Erwin Telle GmbH, Germany) is installed at the outlet of the wind tunnel to remove residual particles from the flow before discharge.

The upstream fetch length is approximately 170 cm long and covered with an aerodynamically smooth lining at the bottom, onto which passive roughness elements in the form of LEGO® bricks were placed in a symmetrically staggered pattern along the entire section of the test section to simulate the desired rough wall-boundary conditions. To maintain a uniform surface consistency, a detachable substrate mount was positioned along the span of these roughness elements such that the mounted substrate was flush with their top. The detachment experiments were conducted with standard laboratory glass slides (Thermo Fisher Scientific), measuring 75 mm × 25 mm, oriented with the long side perpendicular to the streamwise flow direction. A high-resolution camera (Sony Alpha 7RII) equipped with a long-distance microscopy lens (CF-1 lens, K2 DistaMax Infinity, USA) was placed directly above the substrate mount with an adjustable object distance of approximately 35 cm to capture detachment events at 10 s intervals, lit by a 50 W LED strip to illuminate the test section uniformly. Moreover, a three-dimensional hot-wire constant-temperature anemometer (model 55P095, Dantec dynamics), mounted on a traverse system, measured turbulent airflow statistics. The probe was calibrated using a dedicated probe calibrator with temperature correction applied during calibration. Directional sensitivity was accounted for using the default manufacturer's calibration coefficient. A pitot tube was used as the velocity reference during calibration, and the probe was manually aligned with the mean streamwise flow direction. A temperature probe for the constant-temperature anemometer system (model 90P10, Dantec Dynamics) was also installed. In addition, a combined relative humidity sensor and temperature sensor (Model HC2A, Rotronic) was installed to measure the air temperature and relative humidity of the system and compare them across runs.
2.2 Tyre wear particles and reference polyethylene microspheres
Pristine tyre wear particles used in this study were supplied by Continental Reifen Deutschland GmbH and were generated on a laboratory test stand. The material consists of tread-based compositions made from natural and synthetic rubber, with mineral fillers and standard additives, including 6PPD and diphenylguanidine. The particles have not undergone road wear or environmental ageing and have not been mixed with road dust; therefore, they are treated as an idealized, well-characterized reference material. For the detachment experiments, TWPs from car tyres were used. Additional particles from a truck tyre composition were used only to increase the diversity of particle morphologies in the image dataset for training and optimizing the deep learning framework. Representative high-resolution imaging of the car TWPs (Fig. 3) was obtained for visual inspection of the material using a scanning electron microscope (SEM). These particles exhibit irregular shapes and jagged textures with numerous sharp edges and span a broad range of sizes and aspect ratios.

As a spherical reference for comparison, we used previously obtained threshold data for polyethylene microspheres of similar size cohorts from a preceding study conducted in the same wind tunnel (Esders et al., 2023). These microspheres had a density of approximately 1025 kg m−3. SEM images of the polyethylene particles (see Esders et al., 2023) show nearly perfectly spherical microspheres with smooth surfaces, in clear contrast to the irregular TWP aggregate. The density of the car TWPs is about 1300 kg m−3, as specified by the manufacturer and consistent with values reported for comparable tyre and tread wear particles (Klöckner et al., 2021).
2.3 Particle seeding methods and image acquisition
Prior to conducting the detachment experiments, three different particle seeding methods were evaluated for their ability to deposit particles homogeneously and as a monolayer onto the test substrate. These methods were assessed with the aim of minimizing particle agglomeration, which can introduce significant bias in detachment measurements if not properly controlled (Kouadio et al., 2022). Some previous studies used a simple cap tipping method for particle deposition. Among the recent examples is the study by Esders et al. (2023), which employed this technique in MP detachment experiments using fluorescent microspheres. In their method, microspheres were stored in a sealed vial, which was flipped once to allow some particles to adhere to the inside of the cap. The cap was then unscrewed and gently tipped, allowing a small quantity of particles to fall gently onto the glass substrate (Fig. 4a). This method requires no specialized equipment beyond the vials and substrate, and its simplicity and gentle deposition make it attractive for detachment studies. Despite some limitations, such as uneven particle distribution and low deposition throughput, we evaluated it for our TWP seeding trials. Another easy and widely used approach in MP particle size fractionation and recovery is through sieving, which we also adopted for particle seeding because it is simple, reproducible, and well suited to laboratory-controlled experiments (Prume et al., 2021). Dried, stacked stainless sieves with mesh sizes of 200 µm (upper) and 150 µm (lower) were employed to isolate particles that were smaller than 200 µm onto the substrate (Fig. 4b). During the sieving process, gentle manual tapping was applied to the frame so that particles adhering to the mesh could easily dislodge, thereby reducing particle clusters.

Figure 4Diagram illustrating the three seeding methods: (a) cap tipping method, (b) sieving method, (c) developed low-cost pressurized method.
Due to the lumpiness of particles aggravated by their high rubber content, we developed a low-cost pressurized seeding apparatus to reproducibly deposit a monolayer of particles while minimizing the agglomeration on substrates (Fig. 4c). Particles are loaded onto a porous media filter housed in a custom, adjustable PVC socket and overlaid with a 600 µm sieve; together, these layers form a dual-orifice assembly that promotes uniform particle entrainment. Laboratory compressed air (6 bar) is regulated by a control valve and stored in a 2 L stainless steel pressure buffer (Festo CRVZS-2 HTI GmbH) fitted with a safety valve to cap the internal pressure at 2 bar. A solenoid valve (Bürkert type 0330) with a control switch then releases a short (∼ 20 ms), high-velocity air pulse through the dual orifices into an airtight acrylic chamber secured by a saddle clamp. The substrates are placed inside the chamber so that particles ejected by the pulse of pressurized air gravitationally settle on them. This system also allows simultaneous seeding of multiple substrates in a single operation, improving the throughput, reproducibility, and efficiency. Finally, all three seeding methods were compared by placing the seeded substrates in the wind tunnel and capturing images at various orientations and replicate trials.
2.4 Deep learning model for particle segmentation
To analyse detachment of TWPs frame by frame, we used YoloV8 model, a deep-learning-based instance segmentation model released by Ultralytics in January 2023 (Jocher et al., 2023). In this study, instance segmentation was referred to as when each individual particle was detected as a separate object, and the pixel-level boundary was delineated. This is important as TWPs vary in size and shape, and accurate particle outlines are required to detect the spatial deposition pattern and subsequently to quantify the detachment dynamics. The YoloV8n model was selected for its favourable trade-off between segmentation accuracy and computational efficiency in frame-to-frame analysis. Although larger YoloV8 models can achieve higher detection accuracy, they require greater computational resources. For this application, the model provided sufficient accuracy with efficient processing. Additional details on the model architecture and comparisons among other model families are provided in Appendix A.
2.5 Image segmentation
2.5.1 Data preparation, training, and optimization
To prepare the dataset for the instance segmentation model, we employed a semi-automated annotation workflow to efficiently generate accurate bounding box labels for densely populated TWPs. At high particle densities, often exceeding 50 particles mm−2, manual creation of polygons around individual particles becomes increasingly difficult, time-consuming and prone to error. We therefore adopted this approach to improve annotation efficiency and consistency. Each image was converted to greyscale and subjected to binary thresholding, with threshold values selected empirically based on image contrast to reliably separate particles from background noise. Contours were subsequently extracted from the binarized images and each vertex's coordinates normalized before converting into the instance segmentation format (see Fig. A2, Appendix A). The training datasets were also enriched by employing a grid-based cropping strategy in which each original image was further divided into 16 evenly sized sub-images with equal horizontal and vertical divisions. This step increased sample diversity without altering particle appearance.
The data were prepared in three phases, each separated into training and validation sets (Table 1), to progressively refine the model's ability to segment microscale particles. Firstly, we trained the network on two class labels, which exhibit a wide range of particle sizes and shapes. The model was trained and subsequently fine-tuned on new datasets using modified parameter settings to improve performance across particle scales. Finally, the fine-tuned model was further trained on datasets collected separately from the three seeding approaches. Additional details on the hyperparameter settings, model optimization, and computational resources are provided in Appendix A.
Table 1Training and validation datasets used across the different training phases. PC denotes passenger car, TT denotes truck tyre, and TWP denotes tyre wear particle.

2.5.2 Performance evaluation
To assess the model's generalization capabilities when presented with new images, we evaluated its ability to detect and segment the particles and their corresponding shapes. Performance metrics such as the precision, recall, and mean average precision (mAP) at different intersections over union (IoU) thresholds were selected. These metrics were computed for both the predicted bounding boxes and corresponding masks. The IoU measures how well a prediction matches the annotated ground truth. It is calculated as the overlap between the prediction and the annotation divided by the total area covered by both. The higher this value, the better the match. Meanwhile, mean average precision summarizes model performance across all particle instances by combining precision and recall, using these IoU thresholds to determine whether a prediction is considered correct. Precision indicates how many predicted particles were correctly identified, whereas recall indicates how many annotated particles were successfully detected:
In the equation, FP, FN, and TP are the total number of false positives, false negatives, and true positives, respectively. To complement these metrics, we also employed the Dice similarity coefficient (DSC) to individually discriminate the particles that were segmented accurately. This metric has been widely adopted to measure instance segmentation quality in medical and microscopy-scale imaging by penalizing both false positives and false negative, providing a stricter measure of segmentation fidelity (Messer et al., 2024; Hajdowska et al., 2022).
where A represents the area of pixels in the predicted segmented mask, and B denotes the area of pixels in the binarized ground-truth mask. The metric ranges from 0 for no overlap to 1 for perfect overlap. By computing this metric for each particle, we obtained a more detailed assessment of how accurately the model delineates particle boundaries across different particle sizes and shapes, thereby helping to evaluate how reliably these particles can be resolved on different surfaces.
2.5.3 Sensitivity analyses
To investigate the robustness of the model and to establish reliable metrics for subsequent detachment studies, we investigated how sensitive the network's performance is to variations in the input image resolution. This selected model offers the lowest latency relative to the other variants (see Fig. A1, Appendix A), which makes it well suited for frame-by-frame detachment tracking. However, the accuracy could be compromised at its default image resolution (640 pixels). Therefore we fine-tuned the model at different input image resolutions specifically at 416, 640, 960, and 1280 pixels, holding other hyperparameters constant and comparing the resulting performance based on the evaluation metrics. This experiment quantifies the trade-off between segmentation accuracy and computational efficiency, guiding the choice of the image size that preserves accuracy yet remains fast enough for the detachment analysis. Using the selected image size, independent validation datasets were evaluated from the three seeding methods, and the particle attributes (projected equivalent diameter, circularity, and corresponding Dice similarity coefficient) for every segmented particle were computed. This experiment enables a comparative evaluation of the seeding methods with respect to agglomerate reduction and size-dependent segmentation performance and provides the empirical basis for defining a segmentation quality threshold and a minimum particle size in resolving detachment.
2.5.4 Particle feature extraction
To evaluate the influence of particle morphology on detachment behaviour, two shape descriptors were quantified from the segmented particle images in two dimensions (2D): projected equivalent diameter (De) and circularity (C). These descriptors characterize the projected size and shape of the particles and are relevant because particle morphology influences adhesion and subsequent detachment from substrates (Ayinde et al., 2025). The equivalent diameter provides a size descriptor based on the projected particle area, which is particularly useful for characterizing irregularly shaped particles, and was calculated as
where A is the projected area (plan view) of the particles expressed in pixels. On the other hand, the circularity, which was first introduced by Cox (1927) as a shape factor, describes how closely the 2D particle outline approaches that of a perfect sphere and was computed as
where P is the projected perimeter of the particle. The circularity value of 1 indicates a perfect circle, whereas values less than 1 denote increasing deviation from circularity. In this study, TWPs exhibited a wide range of irregularly projected shapes (see Fig. B1, Appendix B). This feature made the descriptor metric instrumental in determining how elongated or irregular the particles are, which defines their contact area and adhesion forces.
2.6 Parameter selection and optimization
The trade-off between the performance and image input resolution for the deep learning model is evident, with detection accuracy improving consistently at higher resolutions (Fig. 5). The evaluated metrics precision, recall, and mean average precision at 50 % overlap threshold (mAP@50) and across multiple overlap thresholds (mAP@50-95) improve steadily with higher resolution during fine-tuning. The lowest resolution at 416 pixels produces the weakest performance, the highest number of missed detections, and the lowest confidence value. As the image size increases to 640 and 960 pixels, these metrics improved, and at 1280 pixels, it achieved the maximum performance in precision and recall, indicating that the model detects more objects with a greater confidence value as the image size increases for both outputs. In particular, the stricter metric (mAP@50-95) shows a notable improvement at the highest resolution, especially for mask prediction, reflecting more accurate object localization. This suggests that finer object details and boundaries are better captured at higher input resolutions. However, such behaviour is expected as altering the image size greatly affects the accuracy of any model; hence adapting a higher-resolution image or images similar in resolution to those used during inference helps preserve more details and yield higher segmentation accuracy (Luke et al., 2019). Although a higher-resolution image size increased computational cost and training time, the gain in segmentation performance was substantial. While larger YoloV8 models can achieve slightly higher precision than the smallest model (Zhao et al., 2024), the improvement is modest relative to the more than a 2-fold increase in computational load. Hence, 1280-pixel input resolution was adopted for subsequent analysis based on the comparative assessment of the observed gains in detection accuracy and segmentation performance relative to the associated increase in computational cost during training.

Figure 5Comparison of model performance across input image resolutions. The figure evaluates the performance for TWP detection and segmentation at four input image sizes (416, 640, 960, and 1280 pixels). Metrics labelled B refer to bounding box predictions and M as mask predictions. The results illustrate how image resolution impacts detection and segmentation accuracy.
2.7 Comparative analysis of seeding methods
The three seeding methods employed to deposit TWPs onto the substrates yielded different particle distribution characteristics that influenced segmentation performance (Fig. 6). The tipping method produced the most heterogeneous distribution with pronounced agglomeration, resulting in a lower-quality mask with most data points clustered at Dice coefficient ≤0.2 across most circularity and larger particles (≥200 µm). Sieving demonstrated improved performance with reduced agglomeration, shifting the distribution of the metric upward, particularly for particles with C<0.6. The pressurized methods yielded the optimal dispersion, producing the clearest masks with large particles (≥200 µm) consistently exceeding Dice coefficients of 0.8, and even the smallest size category exhibited moderate segmentation accuracy. This seeding method disperses particles more uniformly across the substrate, reducing agglomerates, as seen from the dense contour in Fig. 6c, with smaller density exceeding the largest particle size category. Across all the methods, particle size and shape modulate segmentation accuracy. The larger the particle size, the more distinctive the edges and pixels are, so the Dice coefficient rises steadily with equivalent diameter. Conversely, smaller particles and those closer to a perfect sphere tend to give little textural details for the network to learn from, explaining why in Fig. 6c some small points remain near the lowest Dice coefficient. The particle size distributions across the three seeding methods also reveal distinct uniformity and agglomeration behaviours, with all methods exhibiting unimodal right-skewed patterns (Fig. 7). The pressurized method produces particles concentrated within the 80–180 µm range, with higher relative frequency and density at the peak, indicating a greater population which is evenly spread with optimized particle sizes. This distribution exhibits reduced right-skewness, suggesting fewer oversized clusters. In contrast, the tipping method yielded a broader particle size distribution, characterized by higher right-skewness and more frequent large clusters, reflecting increased agglomeration and spatial heterogeneity. Benchmarking against commercial equipment (Microtrac Retsch GmbH, Fig. B1, Appendix B), which provides the laboratory reference size distribution predominantly in the 125–200 µm range, confirms that the pressurized method distribution aligns with the expectation from the laboratory analysis, establishing an optimal baseline for future detachment studies.

Figure 6Comparison of particle segmentation accuracy across seeding methods. Plot showing relationship between shape, size, and Dice similarity coefficient, where (a) is the tipping, (b) sieving, and (c) pressurized method.

Figure 7Particle size distributions for the three seeding methods. The histogram bars show the relative frequency of the equivalent diameter (De) on the left y axis, and the smooth curves show the corresponding kernel density estimates on the right y axis for the pressurized, sieving, and tipping methods. The distributions illustrate differences in particle uniformity and agglomeration among the seeding methods.
2.8 Airflow characteristics
2.8.1 Velocity and turbulence measurement
To estimate the mean velocity and the corresponding friction velocity (u*), instantaneous velocities were measured at 15 different heights above the tunnel floor using the constant-temperature anemometer at a frequency of 10 kHz, and the resulting data were analysed using a logarithmic wind profile approach under the assumption of a neutral boundary layer. The device provides measurement of the three-dimensional wind components: streamwise (u), cross-wise (v), and vertical (w) components were collected over 10 s intervals at each measurement point in the vertical profile under steady-state conditions. Four independent replicate measurements were performed for each wind speed stage to assess reproducibility. Prior to each wind tunnel run, the device settings were corrected for temperature variations to account for the small effect of temporal thermal variation, which could affect measurement precision. The mean wind speed profiles obtained were fitted to the logarithmic law of the wall, where the friction velocity was extrapolated using Eq. (6), and roughness length (z0) was computed accordingly. This approach verified the presence of a well-developed boundary layer. In addition to the Prandtl method, the eddy covariance (EC) was utilized independently to estimate friction velocity, , at different heights. This and other flow statistics were computed using the automated software tool “bmmflux” developed by the Micrometeorology Group of the University of Bayreuth. The software performs standard turbulence post-processing, including flow statistics and flux-related variables. Further implementation details and processing workflow are provided in Appendix C, with a broader framework described by Thomas et al. (2009).
where κ is the von Karman constant (0.4), z is the measurement height above the tunnel floor, and d is the zero-plane displacement height. In this study, d was approximately , where h is the roughness element height (10 mm), consistent with the commonly used approximation for roughness canopies and similar elements (Garratt, 1994; Foken and Mauder, 2008). The velocity values, , were compared with those obtained via the Prandtl, . To establish a direct relationship between the friction velocity values computed by the two methods and surface velocity at the substrate position within the tunnel, an empirical equation was derived using linear-regression. This ensured that the estimated friction velocity values used in subsequent detachment experiments were unbiased and accurately reflected the aerodynamic conditions experienced in the system.
2.8.2 Friction velocity estimation
For modelling MP detachment, it is necessary to estimate the friction velocity because it is the driving variable used at the surface to characterize detachment, which is always computed by extrapolating the vertical wind velocity at different heights using the log-law. The friction velocity was evaluated by comparing two computational methods: one assumes the log-law of the wall across measurements at different distances from the wall, and the other one relies solely on the eddy-covariance momentum flux measured at a single height of z=0.0114 m, a point where the two approaches converge and yielded the same friction velocity value, with a mean bias of 0.008 m s−1 and root mean square error of 0.014 m s−1. Across the 10 discrete stepwise stages used in this study, the free-stream velocity (u∞) ranges from 1.0 to 9.4 m s−1 for an average of four replicates conducted to achieve reproducibility. The friction velocity and roughness length (z0) were computed at five different heights at z≤23.5 mm, where the velocity profile agrees well with the logarithmic law of the wall. The profile analysis returned values in the range of 0.052 to 0.527 m s−1 (see Fig. 8), while the eddy covariance yielded 0.063 to 0.525 m s−1 with an average difference of around 4 % between the two methods. The comparison between these two methods confirms that the test section achieves a fully developed turbulent flow (Fig. 9). The empirical linear relation between the free-stream velocity and friction velocity yielded , which was employed to compute the detachment friction velocities for particles at all stages in the experiment. While the log-law fitting was restricted to the near-wall region, the velocity and shear stress profile (See Figs. C1 and C2) suggest that the roughness-influenced layer extends to approximately 7 to 8 cm, depending on the height of the roughness element, the upstream flow structure, and the fetch length. The z0 intercepts at an average of 0.30±0.1 mm, corresponding to approximately of the height of the roughness element, matching the – requirement reported for similar geometric canopies (Fang and Sill, 1992). The longitudinal free-stream turbulence intensity over the entire velocity range in the tunnel is approximately ≤1 %. Based on the spectral peak for the highest velocity stage (see information in the Appendix and Fig. C3), the characteristic frequency was 39.8 Hz, corresponding to a timescale of 0.025 s. Using the mean streamwise surface velocity for that same stage, the corresponding longitudinal length scale was approximately 1.6 cm. This estimated integral length scale was smaller than the internal boundary layer thickness, indicating that the dominant energetic motions relevant to detachment were contained within this layer.

Figure 8Logarithmic wind profile plots showing the relationship between the mean wind speed and logarithmic height ln (z−d) across the 10 flow stages. Each colour represents one stage, and the dashed lines indicate the logarithmic fits used to derive the profile-based friction velocity u* with κ=0.4. Extrapolating the data to U=0 yields the roughness lengths (z0 = 0.3 mm).

Figure 9Calibration of u* from the profile measurement and eddy covariance as a function of free-stream velocity at z = 0.0114 m. The regression gives R2=0.994, with a 95 % confidence interval of 0.055–0.059 for the fitted coefficient.
2.9 Resolving particle detachment
2.9.1 Microplastic deposition and recording
Prior to testing, the glass slides were thoroughly cleaned following the protocol established by Ibrahim et al. (2003), ensuring the removal of surface impurities that could contribute to stabilizing forces and interference with particle detachment.
Image acquisition for both training and detachment analysis was performed under prescribed flow conditions. The images and detachment events were controlled and monitored via computer tethering using the Sony Imaging Edge desktop version 1.2.01.04031, from which images were captured in XAVC S HD format (1920 × 1080 pixels) at 10 s intervals. A clear image zoom was applied during acquisition, resulting in an effective field of view of approximately 18 × 12 mm. All images were stored frame by frame in a designated folder for subsequent analysis.
To ensure statistical reproducibility, given the heterogeneity in particle size and shape, eight independent TWP detachment experiments were conducted under the same prescribed flow conditions. Particle seeding was achieved using our low-cost pressurized technique. The average initial particle count was around 500 ± 250 particles per slide. Care was taken to prevent particle clustering. Seeding was performed immediately prior to each experiment to minimize exposure to environmental conditions that could influence particle adhesion. The particle-laden substrate was exposed to airflow applied in successive stages, each lasting 300 s, with the wind speed set by the discrete tuning of the transformer–fan system, with the u* incrementally increasing from 0.06 to 0.53 m s−1 over the course of the experiment. All experiments were conducted at ambient air temperatures of 18 ± 4 °C and relative humidity ranging from 21 % to 41 %.
2.9.2 Image-based particle detection and detachment quantification
The custom-trained YoloV8n model (as discussed in detail in Appendix A) in tandem with a customized Python script designed to automate object detection, mask extraction, and detachment tracking monitored and quantified particle detachment frame by frame. Parameters such as projected area, perimeter bounding box dimensions, circularity, and equivalent diameter were computed. A conversion factor of 9 µm per pixel was applied to translate the pixel-based quantity into a physical metric in micrometres. Binary ground-truth masks were created for all images to compute the Dice similarity coefficient for the segmented particles individually. To ensure higher accuracy, only particles meeting the following criteria were retained: confidence level ≥0.1, Dice coefficient ≥0.5 (computed against the binary mask), De≥30 µm, and not touching the image boundaries.
To resolve the temporary changes and identify detached particles, a frame-based tracking script was implemented which assigned consistent particle IDs to particles detected in the first frame and matched them across subsequent frames using Euclidean distance between the bounding box centres. A distance threshold was used to determine whether the particle detached and moved or was still attached to the surface. Once the particle was no longer matched in subsequent frames, we considered it to be detached. The detachment fraction was computed as a fraction of particles no longer detected compared to the initial count. For each experiment, the detached fraction was defined as
where ndet is the detached fraction with respect to friction velocity; u*, is the number of particles attached to the substrate at a certain incremental airflow exposure period, t; and N0 is the initial particle number on the substrate. The detached fraction was normalized as across the replicates and then binned into a fixed interval of 0.2. Within each bin, the bin-averaged friction velocity and normalized detached fraction were computed across the replicate data. Subsequently, a two-parameter logistic function and a linear-regression model were fitted to the binned data.
where and denote the logistic-model and linear-regression predictions, respectively, of the binned detached fraction. In the logistic model, β controls the steepness of the curve and thus the rate at which detachment increases with friction velocity, while m denotes the inflection point, corresponding to the friction velocity at which 50 % of the normalized detachment response is reached. In the linear model, a and b denote the intercept and slope, respectively. Although the logistic function has been widely used to model resuspension responses (Esders et al., 2023; Lim et al., 2025), linear regression was additionally fitted here as an empirical approximation to assess whether a simplified linear representation was sufficient to capture the observed detachment trend over the binned friction velocity range. Therefore, the intercept was treated only as an empirical fitting parameter and was not interpreted as the physical detached fraction at .
The influence of particle morphology on detachment behaviour was evaluated by further stratifying all detached particles by equivalent diameter (80–150, 150–300 µm) and circularity (0.3–0.6, 0.6–0.8, 0.8–1.0). For each size and shape class, the normalized detachment data were recomputed, binned, and fitted with both models as described above, and the corresponding values (and their variability across replicates) were compared.
2.9.3 Predicting threshold friction velocity
The theoretical framework developed by Shao and Lu (2000) is adopted to estimate the threshold friction velocity based on a force balance acting on a stationary particle on a surface exposed to wind-induced shear stress. The model predicts the fluid threshold required to initiate particle motion. This threshold condition is governed by particle properties, gravitational forces, and interparticle cohesion forces and is expressed as
where AN is a dimensionless scaling parameter that controls how effective the applied surface shear stress is converted into aerodynamic forces acting on the particle; σp is the ratio of particle to air density; g is the gravitational acceleration; d is the projected equivalent particle diameter; and γ is the interparticle cohesive force, which ranges from 1.65 × 10⁻⁴ to 5 × 10⁻⁴ kg s−2 for dry particles. Although the Shao and Lu (2000) model has been extensively validated for dry, loose sand grain data over a particle size range of approximately 50 to 1800 µm, its applicability to irregularly shaped particles such as TWPs with complex morphology remains unverified. TWPs experience more complex aerodynamic forces, but we hypothesize that their detachment can still be conceptually described within the force balance framework (Fig. 10). In this study, the microsphere data from Esders et al. (2022), obtained under comparable flow conditions, are treated as a reference case for which the Shao and Lu model and its parameter range were validated. We therefore do not recalibrate their dataset but instead use it as a benchmark to evaluate how well the Shao framework agrees with the TWP detachment thresholds. To explore the sensitivity of the model, three calibration strategies are considered:
- i.
AN fixed at 0.111 and γ constrained to the original Shao and Lu range for dry particles (reference);
- ii.
AN fixed and γ allowed to vary within a wider plausible range to accommodate different effective cohesion of the particles;
- iii.
both AN and γ treated as free fit parameters, allowing the model to adapt more flexibly to the estimated particle threshold.
We use these three options not to claim a unique parameter set for TWPs but to illustrate how far the Shao and Lu framework can be modified and stretched to describe the particle detachment threshold in relation to the established microsphere reference.

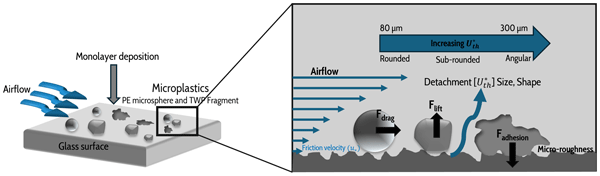
Figure 10Simplified two-dimensional conceptual schematic of the principal forces acting on an irregularly shaped particle on a surface. As illustrated, the aerodynamic forces include the drag force (Fd) and the lift force (Fl), whereas the stabilising forces include the adhesion force (Fa), the gravitational force (Fmg), and the frictional force (Fr). Adapted from Olivares et al. (2024). This figure illustrates the force balance framework considered in this study. When the moment of the aerodynamic forces exceeds the stabilizing forces, the particle detaches and gets entrained into the flow.
This section presents three key findings from the idealized detachment experiments, stratified into (a) quantification of TWP detachment as a function of particle morphology, (b) comparison with the monodisperse microsphere as a benchmark, and (c) evaluation of the performance of the theoretical model against experimental threshold friction velocities.
3.1 Detachment dynamics
The experimental setup captured TWP detachment events across an 18 mm-by-12 mm field of view on the glass surfaces, showing particles of different sizes and shapes (Fig. 11a). The deep learning framework detected over 90 % of TWPs across image frames (Fig. 11b), demonstrating robust individual particle tracking with unique particle identifiers. A Dice coefficient threshold of 0.5 validated segmentation masks, ensuring that the same particle was correctly tracked until it either detached from the glass surface or exited the camera frame. Particle detachment may occur through rolling, sliding, or lift-off (Ibrahim et al., 2003; Kassab et al., 2013). However, our optical tracking approach focused explicitly on identifying detachment events rather than distinguishing among these motion modes. Some particles underwent small positional migrations before complete frame exit, requiring careful tracking to distinguish between temporary movement and actual detachment. In light of this observation, we employed a distance-based particle-matching technique using a threshold of 200 pixels, equivalent to 1.8 mm, to associate particles across frames. This defined distance ensured that particles maintaining their identification while migrating within the field of view were not prematurely classified as detached. A particle was only considered to be detached when it had moved beyond this matching threshold and could no longer be tracked across consecutive frames.

Figure 11Image pair illustrating the acquisition and the deep-learning-based segmentation of TWPs on the glass test substrate. (a) Imagery of the TWPs deposited on the glass substrate, dispersed using the pressurized seeding method. (b) Corresponding model inference results showing detected particles with bounding boxes and segmentation masks in blue; the numbers indicate the particle label and detection confidence score for each identified particle (confidence threshold = 0.1).
The time evolution of the detachment fraction for all eight replicate experiments is shown as a function of time (Fig. D2, Appendix D). Notably, the detachment behaviour varied among the replicates. The remaining fraction on the substrate after the 30 min exposure time ranged from 57 % to 86 %. Such incomplete removal has been reported in detachment studies and depends on different factors, including exposure time and velocity increment during stage change (Theron et al., 2020; Esders et al., 2022). In general, the TWPs were not detached at a single value of u*, but over a range of incremented u* values, with the cumulative detached fraction differing across replicates. In some cases, a sharp initial jump in particle release was observed immediately after the fan started, which is attributed to tunnel vibrations dislodging the most weakly bound particles first. In addition, the transient spin-up of the flow during stage changes may have contributed, as the friction velocity increases sharply at some stage change before reaching a quasi-steady phase. This interpretation is consistent with previous studies showing that weakly adhered particles are removed earlier, whereas more strongly adhered particles require larger or more intermittent aerodynamic forcing for detachment due to the stochastic nature of the turbulent flow (Braaten and Shaw, 1990; Ibrahim et al., 2003). Furthermore, the observed detachment behaviour may have been influenced by local micro-surface roughness and humidity conditions. Although humidity can influence particle detachment (Kim et al., 2016), the experiments were conducted at a moderate relative humidity below 45 %, and this effect was not examined explicitly in the present study. Since the glass substrate used here was relatively smooth, sheltering effects were likely reduced compared with rougher surfaces (Kassab et al., 2013), and adhesion was therefore expected to depend primarily on close-contact forces such as van der Waals and electrostatic interactions (Zhang et al., 2025).
Detachment rate spans a velocity range because adhesion is heterogeneous. Since detachment occurs across a broad range of friction velocity, it is appropriate to define a representative threshold friction velocity () at which a significant fraction (50 %) of particles have detached (Ibrahim et al., 2003). The detachment curve shows a monotonic increase in the ndet with friction velocity, as described by the two models (Fig. 12). Applying both models to the ensemble-binned data yielded very similar characteristic thresholds. The global logistic and linear-regression fit yielded fluid thresholds of 0.25 and 0.26 m s−1, respectively, and the mean threshold of the eight replicates was 0.26±0.06 m s−1. The spread across the binned points could be argued to indicate that TWPs experience broadly similar effective adhesion on the uniformly smooth glass substrate, suggesting that variability may be driven by differences in local contact geometry and microscale adhesion.

Figure 12Detached fraction of TWPs, normalized to the maximum in each replicate, as a function of friction velocity (u*) for the eight replicates. The data points show ensemble-averaged values (mean ± SD across samples). The solid line is the logistic fit (R2=0.97); the dashed line is the linear-regression fit (R2=0.98).
3.2 Investigating the effect of particle size and shape on detachment rate
Particle morphology is another factor that influences detachment. Across all experiments, TWPs spanned a broad range of sizes and shapes (Fig.D3, Appendix D), and the comparison of the initial and final population indicates that detachment does not occur uniformly across the distribution, but preferentially from a particular sub-range (Figs. 13c and 14d). Equivalent diameter ranges from 80–300 µm, with most particles between 100–250 µm and a peak between 120–160 µm. Circularity varies from 0.3 (highly irregular) to 1.0 (nearly rounded), with most particles clustering mainly between 0.6–0.8 and only a few fractions being nearly rounded.

Figure 13Size-resolved detachment behaviour of TWPs on the glass substrate. (a) Normalized detachment fraction (ndet) as a function of friction velocity for particles with De=80–150 µm. (b) Normalized detachment fraction (ndet) as a function of friction velocity for particles with De=150–300 µm. Squares denote ensemble means, and error bars denote ±1 SD of the binned data; solid and dashed lines indicate the logistic and linear-regression fits, respectively. (c) Mean threshold friction velocity for the two equivalent diameter classes; error bars denote ±1 SD across samples.

Figure 14Shape-resolved detachment behaviour of TWPs on glass substrate. (a) Normalized detachment fraction (ndet) as a function of friction velocity for particles with C=0.30–0.60. (b) Normalized detachment fraction (ndet) as a function of friction velocity for particles with 0.60–0.80. (c) Normalized detachment fraction (ndet) as a function of friction velocity for particles with 0.80–1.00. Squares denote ensemble means ±1 SD of the binned data; solid and dashed lines indicate the logistic and linear-regression fits, respectively. Panel (d) shows the mean threshold friction velocity of the three shape classes; error bars denote ±1 SD across samples.
The threshold friction velocity estimated from the detachment curves varied systematically with particle size (Fig. 13a–c). For the smaller-sized bin (80–150 µm), the mean threshold across samples was 0.33±0.05 m s−1, whereas the larger-sized bin (150–300 µm) had a mean threshold value of 0.41±0.03 m s−1. Thus, particles in the upper size bin detached at friction velocities roughly 25 % higher than those from the lower size bin, even though both belong to the same bulk population. This size dependence is consistent with findings from Del Bello et al. (2021), who reported lower thresholds for smaller (81–89 µm) than for larger (110–210 µm) irregular volcanic ash particles for both laboratory experiments and field studies. This also agrees with the semi-empirical force balance model of Shao and Lu (2000), from which it can be inferred that threshold friction velocity reaches a minimum around 75–100 µm, and tends to increase with particle size for larger particles as the effect of gravity becomes increasingly important relative to cohesive forces. The TWP sizes investigated in this study fall largely within this gravity-dominated regime, so a monotonic increase in threshold with equivalent diameter is expected and is reflected in the estimated fluid threshold values.
Particle shape quantified by circularity also had a pronounced effect on detachment rate (Fig. 14a–d). More rounded TWPs (C=0.8–1.0) detached at lower threshold values (0.33±0.02 m s−1), the intermediate class (C=0.6–0.8) at 0.37±0.03 m s−1, and the highly irregular TWPs (C=0.3–0.6) at higher threshold values (0.40±0.02 m s−1). This monotonic increase in these threshold friction velocities with decreasing circularity suggests that irregular TWPs are more resistant to aerodynamic removal than rounded ones. A possible explanation is that irregularly shaped particles can form stronger adhesive contacts with the surface because of their larger effective contact area and multiple contact points. A highly irregular TWP is likely to lie flatter on the substrate, and its deformable nature can further increase its contact area. By contrast, more rounded particles can have a smaller contact footprint and therefore a lower degree of adhesive interaction. Although irregular particles can experience similar or even slightly enhanced aerodynamic forces due to protruding parts extending into higher-velocity regions of the boundary layer, this effect appears to be secondary to their stronger adhesion. In terms of the conceptual two-dimensional force balance schematic shown in Fig. 10, we explain this behaviour as a consequence of the larger adhesion lever arm (la) of irregular particles, caused by their extended footprint, while simultaneously exhibiting a smaller drag lever arm (ld) and a reduced area exposed to the airflow. Depending on the particle orientation and contact geometry, the aerodynamic moment (Fd⋅ld), with a potential contribution from lift, can be insufficient to overcome the adhesion moment (Fa⋅la), which would require a higher threshold friction velocity for detachment.

Figure 15The figure shows the threshold friction velocity as a function of projected equivalent diameter De for TWPs (blue circles) and polyethylene microspheres (green circles; data from Esders et al., 2023) on glass substrate. Error bars denote ±1 SD). The solid blue line shows the Shao Lu model fit with dust parameter range, the dashed blue line shows a fit with AN fixed and γ adjusted, and the dotted blue line shows the fit with both AN and γ adjusted. The solid green line is the Shao and Lu fit for the polyethylene microsphere data.
These findings also align with other studies discussing particle shape effects. Olivares et al. (2024) reported that irregularly shaped particles showed significantly lower detachment rates compared to glass microspheres of the same cohort under similar conditions. Furthermore, Fig. 15 extends our comparison to polyethylene microspheres of the same size cohort (115 µm). In other words, under identical conditions, a polyethylene microsphere requires approximately half the shear force needed to lift a similarly sized TWP. This comparison highlights how variability in particle morphology and particle roughness can alter the balance of forces. Thus, the elevated threshold observed for TWPs arises due to the effect of a broad range of morphological differences.
The magnitude of aerodynamic drag and lift can also be influenced by the flow pattern around the particles. In our study, we also estimated the particle Reynolds number (Rep) as and the Stokes number (St) as , indicating that Stokes drag alone is not strictly applicable across the full parameter range and that Reynolds-number-dependent drag corrections become relevant (Shao, 2008; Loth, 2008). The fluid motion around the vicinity of these particles is influenced mainly by inertia, especially towards the larger particle size class analysed. This feature implies that particle responses to rapid near-wall flow fluctuations are not expected to be instantaneous; rather, stronger and more sustained near-wall forcings are required to overcome adhesion and gravity. This is also consistent with the higher fluid threshold observed for the larger particle class in our findings. It is also noteworthy that detachment motion can occur via rolling, sliding, or lift-off, and many studies and models developed for spherical particles emphasize rolling as an efficient incipient-motion pathway (Wang, 1990; Sharma et al., 1992; Ibrahim et al., 2003; You and Wan, 2014). However, for irregular particles, geometric variation and contact configuration can shift the preferred mode towards sliding, as reported by Olivares et al. (2024) in their recent studies on the simulations of irregular micro-particles (Olivares et al., 2024). For particles with non-negligible inertia, direct lift-off under saltation conditions cannot be ruled out. In principle, micro-impacts with surface asperities and particle-to-particle collisions can impart a vertical impulse, and lift-off may occur when the associated kinetic energy exceeds the adhesive potential well (Hu et al., 2023; Kassab et al., 2013). Owing to the substantial variability in TWP morphology, the dominant detachment motion is expected to be complicated. In this study, our tracking approach resolved detachment events but was not designed to unambiguously classify the specific motion mode.
3.3 Prediction of threshold friction velocity and comparison with microsphere
Across the investigated size range, the Shao and Lu fits reproduce the observed trend that TWPs require a higher friction velocity threshold to initiate detachment compared to the polyethylene microsphere (Fig. 15). For the microsphere reference data, the model with the standard empirical functions (see Eq. 10) returns γ to N m−1, which lies comfortably within the range reported for dry, loose dust and sand particles (Shao and Lu, 2000; Kok et al., 2012). This confirms that the reference parameterization is appropriate for the polyethylene microspheres. In contrast, applying the same parameter constraints to the TWPs clearly underestimates the measure thresholds. Even when γ is pushed to the upper limit of the empirical range, N m−1, the predicted fluid threshold curve remains below the observations, indicating that the unmodified Shao and Lu formulation does not fully capture the detachment behaviour of TWPs. Allowing γ to vary freely improves the fit, but the resulting value ( N m−1) is about 3 times the upper limit proposed for the natural dust and sand particles ( to N m−1; Shao and Lu, 2000). Such a magnitude is difficult to reconcile with independent estimates of cohesive interparticle forces, including van der Waals forces for dry particles and typical polymeric surfaces, and would imply a strong cohesive contribution even in the size range where cohesion already dominates (De<75 µm). Meanwhile, when both AN and γ are treated as free parameters, the fitted curve recovers the expected increase in the fluid threshold with particle size in the gravity-dominated regime. The best fit values (AN = 0.25 and γ = N m−1) remain within the physically plausible bounds but require a substantially larger aerodynamic efficiency parameter. Similar variations in dimensionless threshold coefficients were reported in aeolian studies, where analogous parameters (AB, Aft) vary with particle threshold Reynolds number (Re*t), bed roughness, interparticle forces, and moisture effects (Iversen and White, 1982; Bagnold, 1971; Shao and Lu, 2000; Kok et al., 2012; Dong et al., 2007). In this context, the higher AN for TWPs can be interpreted as an effective parameter that reflects morphological irregularity, multiple particle contact points with substrate, and micro-roughness.
Regardless of the calibration strategy, the TWP curve consistently lies above the polyethylene microsphere curve. The density difference between TWPs and polyethylene microspheres is too small to account for this offset alone. Within the Shao and Lu threshold framework, such a density contrast would influence the predicted threshold friction velocity by less than 10 %, whereas the measured thresholds differ by up to a factor of 2. This observation aligns with previous studies (Del Bello et al., 2021; Olivares et al., 2024) which emphasize that particle geometry and roughness enhance the effective adhesion strength of irregularly shaped particles compared to smooth, rounded grains of similar size. In contrast, for particles of comparable size, Esders et al. (2023) reported only a 29 % increase in threshold friction velocity between polyethylene and borosilicate microspheres, whereas the corresponding difference between these polyethylene microspheres and TWPs in the present study is 57 %. The approximately 2-fold-larger offset observed suggests that density alone cannot account for the higher thresholds observed for TWPs. Similarly, a minor role of density within a restricted parameter range was reported for particle resuspension under different forcing conditions (Valenzuela-Aracena et al., 2019). Given the limited number of size bins available for the TWPs, the present calibrated parameters should be regarded as a first step toward evaluating the Shao and Lu framework for TWPs. However, no robust TWP dataset was available at equivalent diameters around 10–30 µm, which limits direct evaluation of the small-particle regime, where cohesive effects are expected to be increasingly important. Nevertheless, the present results reveal two robust findings from our idealized experiment: TWPs on smooth glass require considerably higher fluid thresholds than polyethylene microspheres of comparable size, and the magnitude of this offset is best explained by enhanced effective cohesion and reduced aerodynamic leverage arising from TWP morphology rather than from density differences.
This study presents a quantitative framework to investigate the detachment behaviour of near-monolayer deposits of tyre wear particles (TWPs) in the 80–300 µm size range from an idealized glass substrate. Its methods combine deep-learning-based image analysis with an optimized pressurized seeding technique for controlled particle deposition. Overall, our experiment shows that a bulk threshold friction velocity of 0.26 m s−1 is required for TWP detachment, showing a clear increase with larger projected particle size and increasing shape irregularity. Under similar surface shear, coarser and more irregularly shaped particles tend to remain attached, while smaller and more rounded fragments are more readily mobilized. Hence, surface stress preferentially entrains finer and more rounded particles rather than removing all deposited sizes and shapes uniformly. Comparison with reference polyethylene microspheres of similar size corroborates this interpretation and demonstrates that density differences alone cannot account for the higher fluid thresholds observed; instead, particle morphology and strong surface adhesion emerge as the dominant controls on TWP detachment. These findings challenge the spherical particle assumptions embedded in widely used Shao and Lu empirical threshold models and highlight the need to explicitly account for morphology-informed parameterization when representing TWPs and other irregularly shaped microplastics in resuspension schemes. While these results provide fundamental insights into TWP detachment behaviour, they are constrained by the studied size range and the idealized nature of pristine test stand TWPs on glass substrates. Hence, the work presented shall be regarded as a first, deliberately idealized step towards identifying the key mechanisms controlling TWP detachment. By using these pristine particles, the study establishes a controlled baseline for examining the effects of particle size, projected shape, and substrate conditions without adding the complexity of environmental ageing and road-dust constituents. These findings can guide future studies on aged and real-world tyre and road wear particles, for which weathering, aggregation, chemical heterogeneity, and surface contamination are likely to further modify their detachment behaviour. Future studies shall build on the high particle detection and detachment quantification accuracy achieved here by extending to broader particle size and density ranges; including environmentally relevant tyre and road wear particles; and using rougher, more heterogeneous and dynamic, realistic surfaces to capture behaviour under complex real-world conditions.
A1 Evolution of Yolo models
YoloV8 belongs to the family of single-stage deep learning models for object detection and instance segmentation, where object localization and classification are performed in one inference pipeline. Since the model is built around a single-stage pipeline, it has a relatively higher processing speed compared to two-stage detections, such as the faster region-based convolution neural network (R-CNN). The input images are divided into grids that predict boundary boxes, confidence scores, and class probabilities. This model incorporates several architectural refinements and contributes to a better trade-off between the detection accuracy and processing speed, which is evident from the comparison of YoloV8 against its predecessors with the default 640-pixel image resolution in Fig. A1, Appendix A, offering better throughput with a similar number of parameters (Jocher et al., 2023; Hussain, 2023).

Figure A1Comparison of the performance of YoloV8 with predecessors. Number of parameters (left), inference speed (right).

Figure A2Preprocessing of YoloV8 images. (a) Sample of a raw image before preprocessing. (b) Binary thresholding. (c) Contour outline.
This model features variants ranging from nano (n) to extra large (x), providing diverse computational and performance requirements. On one hand, YoloV8n has fewer parameters and is optimized to deliver high inference speed with slightly lower accuracy as compared to the other variants. However, as the model progressively increases with depth from YoloV8s, YoloV8m, and YoloV8l to YoloV8x, the accuracy increases while incurring more computational cost and higher inference speed, as evidenced by improved mAP scores in Fig. A1, Appendix A. Although larger models achieve superior detection performance, YoloV8n is highly efficient for real-time detection and frame-to-frame analysis, making it the preferred variant for our study.
A2 Preprocessing of YoloV8
A semi-automated pipeline was used for YOLOv8 image annotation. This approach was adopted instead of manual annotation to extract the YoloV8 .txt format labels, which were used for both the training and validation of the model. Here, each raw image was converted to greyscale and then binarized to separate particles from background. The contours were extracted from these binary images, normalized, and then converted to the .txt format recognized by the model. To increase sample diversity, the raw images were further expanded using a cropping strategy with equal vertical and horizontal strides to produce eight sub-images, which were also subjected to the same cleaning processing.
A3 Image segmentation, training, and performance evaluation
Model training was performed in three phases to progressively improve the segmentation performance. In phase 1, the model was trained on two class labels, PC (passenger car tyre) and TT (truck tyre), representing a broad range of particle sizes and shapes. Before training, we performed a grid-search-based hyperparameter optimization (20 generations over the parameters listed in Table A1). Training and validation loss convergence after 50 epochs was monitored to select the optimal configuration. The model was then trained for 1000 epochs to establish baseline detection performance. Secondly, the model was fine-tuned on a new dataset with a smaller learning rate and reduced epochs, with augmentations removed and multi-scale image sizing introduced to expose the network to scale diversity. Finally, the fine-tuned model was further trained on a dataset collected separately from the three seeding approaches.


Figure A3Precision, recall, mean average precision (mAP), and loss plots after training and validation on the TWP dataset. (a) Metric evaluation for phase 1. (b) Metric evaluation for phase 2.
For performing the model training and optimization, we used a local workstation that runs on the Ubuntu 20.04 LTS operating system equipped with an NVIDIA Quadro P4000 GPU with 8 GB of VRAM, 64 GB of RAM, an Intel Xeon W-2295 CPU (18 cores, 36 threads), and PyTorch 1.10 built with CUDA 11.2 and associated dependencies in a Python 3.10 environment. To supplement our local workstation and expedite model development, we leveraged the tensor processing unit (TPU) resources of Google Colaboratory (Colab), a free hosted Jupyter notebook environment used in parallel with our internal system to run additional training jobs. Despite using the YoloV8 Nano variant, model training remained computationally expensive. For a representative configuration with an image size of 1280×1280 pixels, the TPU setup processed approximately 0.26 s per batch, whereas the local Quadro P4000 GPU processed approximately 1.2 s per batch. This is about 4 to 5 times slower, and training execution time varies with image size, number of epochs, and batch size. In contrast, the inference was relatively cheap, with minimal differences, and single-image processing took around 25 to 30 ms on Colab and 50 to 60 ms on the local workstation.
Figure A3 presents the training and validation loss curves for phase 1 and phase 2, with the precision, recall, and mean average precision (mAP) metrics obtained during model development on the TWP datasets. The training losses decreased with epoch, indicating stable optimization during learning. For the validation metrics, there was improvement during the early training stage and then a plateau before the loss increased at later epochs. This suggests diminishing generalization gains with prolonged training. Accordingly, the model weights corresponding to the best validation performance were selected for subsequent analysis rather than those from the final training epoch.
B1 Analytical analysis of the TWPs
The distribution of the car tyre wear particles with different sizes and shapes was analysed using Microtrac analytical equipment (Microtrac Retsch GmbH, Haan, Germany). This combines laser diffraction with dynamic image analysis for particle characterization. Measurements were conducted in wet mode using deionized water as the mobile phase. A small particle mass (2 to 5 mg) was first mixed with 2 mL of 5 wt % of tetrasodium pyrophosphate solution and a few drops of Tween® 20 to reduce particle aggregation. This suspension was then transferred into the water-filled measuring cell and further diluted with 200 mL of water. For ensuring complete particle suspension, the sample was ultrasonicated for 180 s at 40 kHz prior to sieving. The data sheets in Appendix B extracted from the analytical measurements are used in Sect. 2.7 as an independent laboratory benchmark for comparison with the image-based particle size distributions obtained from the three seeding methods. The analysed particles span approximately 4 to 223 µm and vary from rounded to highly irregular shapes. The corresponding distribution is characterized by D10=94 µm, D50=148 µm, and D90=215 µm, with a mean sphericity of 0.887 and an average length-to-width ratio of 1.42.

C1 Post-processing of constant-temperature anemometer data using BMMFlux
The constant-temperature anemometer (CTA) data were processed using BMMFlux CTA v1.0, a MATLAB-based workflow adapted for wind tunnel flow measurement. This software is designed to analyse turbulence- and flux-related data. This version is explicitly configured to characterized high-frequency tri-axial CTA measurement data. This software was used to import the raw velocity time series, screen the data, and compute flow and turbulence quantities. The processed output includes the mean velocity components, Reynolds stress terms, friction velocity, momentum flux, turbulence kinetic energy, and also the spectra. The resulting variables were then used to evaluate the wind profile, turbulence flow structure, and friction-velocity-based quantities applied in the detachment analysis.

Figure C1Vertical wind profile of the mean streamwise velocity , measured across the 10 stepwise flow stages. Symbols represent the mean values at each measurement height, with the error bars indicating the standard deviation across the four replicates. These profiles show the progressive increase in the flow speed with stage.

Figure C2Vertical shear stress profile , measured across the 10 flow stages, with symbols representing the mean values and error bars also indicating the standard deviation across four replicates. The magnitude of the shear stress generally increases towards the wall within the roughness-influenced layer, indicating enhanced downward momentum transfer near the surface.

Figure C3Velocity spectra normalized by the square of the friction velocity, plotted as against frequency f. The longitudinal, lateral, and vertical velocity spectra (uu, vv, ww) are shown at the measurement height of z=1.4 cm for the highest wind speed stage. The dashed line indicates a reference slope of , corresponding to the expected inertial subrange.

Figure C4Co-spectra normalized by the square of the friction velocity, plotted as against frequency f. The co-spectra (uw, vw) are shown at the measurement height of z=1.4 cm for the highest wind speed stage. The dashed line indicates a reference slope of , corresponding to the expected inertial subrange.
C2 Flow characterization
The vertical flow structure and turbulence in the wind tunnel were characterized by evaluating the mean streamwise velocity and Reynolds shear stress across all 10 flow stages. The mean velocity profiles were used to identify the near-wall logarithmic region from which the friction velocity (u) and aerodynamic roughness length (z0) were estimated. On the other hand, the Reynolds shear stress () profiles were used to examine the vertical distribution of momentum transfer. Both profiles visibly show that the lower part of the flow is governed by roughness-generated shear, with the thickness of the internal boundary layer extending around 7 to 8 cm. The turbulence characteristics were computed at the highest flow stage, near the wall. The auto-spectra and co-spectra of the velocity components were computed to understand the turbulence-scale characteristics obtainable at the highest flow stage in the tunnel. This spectral approach is widely used in wind engineering and wind tunnel studies to estimate integral turbulence length scales (Hui et al., 2009; Kozmar, 2011; Trush et al., 2020). In particular, the peak frequency of the longitudinal velocity spectrum can be used to derive the characteristic longitudinal integral scale following the Engineering Sciences Data Unit (ESDU) procedure (ESDU, 1972).
where Lu,x is the longitudinal integral length scale, is the mean streamwise velocity at the measurement height z, and fp is the peak frequency corresponding to the maximum value in the longitudinal velocity spectrum. From the spectral plot, the extracted peak frequencies indicate that the dominant turbulent motions differ among the spectral components, with uw and uu shifting towards lower frequencies compared to vv, ww, and vw. This indicates that the streamwise-velocity- and momentum-carrying motions are associated with larger, lower-frequency structures, whereas the lateral and vertical fluctuations are dominated by smaller, higher-frequency motions. In the inertial sub-range, the normalized spectra and co-spectra decrease with frequency, following the expected slopes of and for the velocity spectra and Reynolds stress co-spectra, respectively.
D1 Detachment protocol
The detachment protocol applied in the experiment is described here. The stepwise velocity time plot illustrates how near-wall shear stress, represented by friction velocity, was increased in a controlled manner across all eight replicate experiments. The distribution of the particles detached relative to the initial population for all eight replicates is also shown below.

Figure D1Friction velocity time series used in the detachment protocol at z=1.4 cm. Black markers show the instantaneous u*(t), while the shaded background bands denote the successive flow stages. Each stage corresponded to an exposure time of 300 s, followed by a discrete change to the next stage. Stage changes were characterized by a short transient adjustment of u* before reaching a quasi-steady level within each stage.

Figure D2Detached TWPs for the eight replicates, showing the detachment fraction over the successive stage-wise velocity increment. The spread across replicates illustrates variability in detachment rate despite identical forcing protocol.

Figure D3Comparison of particle morphology distribution at initial and final phase of detachment. (a) Projected equivalent diameter, (b) circularity. Blue histograms represent the initial deposited population (initial phase), while the green histograms represent the particles remaining at the end of the detachment experiment (final phase). The shift in the final distributions relative to the initial population indicates selective detachment with respect to morphology. Larger particle size remained attached, whereas more rounded (higher circularity) particles were preferentially detached.
The training and detachment image data, including the dataset generated and analysed during the study, are available at https://doi.org/10.5281/zenodo.20589718 (Ayinde et al., 2026).
BOA conceived the project with CKT, conducted the wind tunnel experiments, designed the instrumental setup, analysed the data, and wrote the manuscript. JO assisted with instrumental preparation with input from CKT and WB. JB and CL provided material assistance. CKT, WB, and AN supervised the revision of the research and manuscript. DW and SA provided reference materials. CKT and AN acquired the funding. All authors further read and commented on the paper.
The contact author has declared that none of the authors has any competing interests.
Publisher's note: Copernicus Publications remains neutral with regard to jurisdictional claims made in the text, published maps, institutional affiliations, or any other geographical representation in this paper. The authors bear the ultimate responsibility for providing appropriate place names. Views expressed in the text are those of the authors and do not necessarily reflect the views of the publisher.
We thank the Collaborative Research Centre 1357 Microplastics (SFB Microplastics) for providing the scientific framework and collaborative research environment for this study. We thank Mathias Schott for his assistance with scanning electron microscopic imaging of the passenger car tyre wear particles (TWPs). We also thank Continental Reifen Deutschland GmbH for their collaboration with the SFB Microplastics consortium and for providing the test-stand-generated TWPs used in this study.
This research has been supported by the Deutsche Forschungsgemeinschaft (grant nos. 391977956–SFB 1357 and 491183248).
This paper was edited by Daniele Contini and reviewed by Alan Robins and one anonymous referee.
Arthur, C., Baker, J. E., and Bamford, H.: Proceedings of the International Research Workshop on the Occurrence, Effects, and Fate of Microplastic Marine Debris, 9–11 September 2008, University of Washington Tacoma, Tacoma, WA, USA, NOAA Technical Memorandum NOS-OR&R-30, National Oceanic and Atmospheric Administration, NOAA Institutional Repository record noaa:2509, 2009. a
Astorayme, M. A., Vázquez-Rowe, I., and Kahhat, R.: The use of artificial intelligence algorithms to detect macroplastics in aquatic environments: A critical review, Sci. Total Environ., 945, 173843, https://doi.org/10.1016/j.scitotenv.2024.173843, 2024. a
Ayinde, B. O., Musa, M. R., and Ayinde, A.-A. O.: Application of machine learning models and landsat 8 data for estimating seasonal pm 2.5 concentrations, Environmental Analysis, Health and Toxicology, 39, e2024011, https://doi.org/10.5620/eaht.2024011, 2024. a
Ayinde, B. O., Babel, W., Olesch, J., Agarwal, S., Wagner, D., Nölscher, A., and Thomas, C.: Quantifying the detachment dynamics of microplastic car tire-wear particles using a deep learning framework in a laboratory wind tunnel, EGU General Assembly 2025, Vienna, Austria, 27 April–2 May 2025, EGU25-11439, https://doi.org/10.5194/egusphere-egu25-11439, 2025. a
Ayinde, B. O., Wolfgang, B., Olesch, J., Wagner, D., Agarwal, S., Laforsch, C., Nölscher, A., and Thomas, C. K.: Dataset and script used for the publication: From seeding to detachment: leveraging deep learning to quantify the transport of tyre wear microplastics in a wind tunnel, Zenodo [data set], https://doi.org/10.5281/zenodo.20589718, 2026. a
Baensch-Baltruschat, B., Kocher, B., Stock, F., and Reifferscheid, G.: Tyre and road wear particles (TRWP)-A review of generation, properties, emissions, human health risk, ecotoxicity, and fate in the environment, Sci. Total Environ., 733, 137823, https://doi.org/10.1016/j.scitotenv.2020.137823, 2020. a
Bagnold, R. A.: The Physics of Blown Sand and Desert Dunes, Springer, https://doi.org/10.1007/978-94-009-5682-7, 1971. a
Barth, T., Preuß, J., Müller, G., and Hampel, U.: Single particle resuspension experiments in turbulent channel flows, J. Aerosol Sci., 71, 40–51, https://doi.org/10.1016/j.jaerosci.2014.01.006, 2014. a
Beattie, N. S., Moir, R. S., Chacko, C., Buffoni, G., Roberts, S. H., and Pearsall, N. M.: Understanding the effects of sand and dust accumulation on photovoltaic modules, Renew. Energ., 48, 448–452, https://doi.org/10.1016/j.renene.2012.06.007, 2012. a
Beji, A., Deboudt, K., Muresan, B., Khardi, S., Flament, P., Fourmentin, M., and Lumiere, L.: Physical and chemical characteristics of particles emitted by a passenger vehicle at the tire-road contact, Chemosphere, 340, 139874, https://doi.org/10.1016/j.chemosphere.2023.139874, 2023. a
Benali Amjoud, A. and Amrouch, M.: Convolutional neural networks backbones for object detection, in: Image and Signal Processing: 9th International Conference, ICISP 2020, Marrakesh, Morocco, 4–6 June 2020, Proceedings 9, 282–289, Springer, https://doi.org/10.1007/978-3-030-51935-3_30, 2020. a
Bigalke, M., Fieber, M., Foetisch, A., Reynes, J., and Tollan, P.: Microplastics in agricultural drainage water: a link between terrestrial and aquatic microplastic pollution, Sci. Total Environ., 806, 150709, https://doi.org/10.1016/j.scitotenv.2021.150709, 2022. a
Bondorf, L., Löber, M., Grein, T., Köhler, L., Epple, F., Schripp, T., Aigner, M., and Philipps, F.: Characterization of airborne tire particle emissions under realistic conditions on the chassis dynamometer, on the test track, and on the road, Aerosol Sci. Tech., 59, 623–634, https://doi.org/10.1080/02786826.2025.2464215, 2025. a
Braaten, D. and Shaw, R.: Particle resuspension in a turbulent boundary layer-observed and modeled, J. Aerosol Sci., 21, 613–628, https://doi.org/10.1016/0021-8502(90)90117-g, 1990. a
Cadle, S. and Williams, R.: Gas and particle emissions from automobile tires in laboratory and field studies, JAPCA J. Air Waste Ma., 28, 502–507, https://doi.org/10.1080/00022470.1978.10470623, 1978. a
Chanchangi, Y. N., Ghosh, A., Sundaram, S., and Mallick, T. K.: An analytical indoor experimental study on the effect of soiling on PV, focusing on dust properties and PV surface material, Sol. Energy, 203, 46–68, https://doi.org/10.1016/j.solener.2020.03.089, 2020. a
Chazhoor, A. A. P., Ho, E. S., Gao, B., and Woo, W. L.: Deep transfer learning benchmark for plastic waste classification, Intelligence & Robotics, 2, 1–19, https://doi.org/10.20517/ir.2021.15, 2022. a, b
Chepil, W.: Dynamics of wind erosion: I. Nature of movement of soil by wind, Soil Sci., 60, 305–320, https://doi.org/10.1097/00010694-194510000-00004, 1945. a
Cox, E.: A method of assigning numerical and percentage values to the degree of roundness of sand grains, J. Paleontol., 1, 179–183, https://www.jstor.org/stable/1298056 (last access: 16 July 2026), 1927. a
Del Bello, E., Taddeucci, J., Merrison, J. P., Rasmussen, K. R., Andronico, D., Ricci, T., Scarlato, P., and Iversen, J. J.: Field-based measurements of volcanic ash resuspension by wind, Earth Planet. Sc. Lett., 554, 116684, https://doi.org/10.1016/j.epsl.2020.116684, 2021. a, b, c
Dong, Z., Mu, Q., and Liu, X.: Defining the threshold wind velocity for moistened sediments, J. Geophys. Res.-Sol. Ea., 112, https://doi.org/10.1029/2006jb004476, 2007. a
Esders, E. M., Georgi, C., Babel, W., and Thomas, C.: Quantitative detection of aerial suspension of particles with a full-frame visual camera for atmospheric wind tunnel studies, Aerosol Sci. Tech., 56, 530–544, https://doi.org/10.1080/02786826.2022.2048789, 2022. a, b, c
Esders, E. M., Sittl, S., Krammel, I., Babel, W., Papastavrou, G., and Thomas, C. K.: Is transport of microplastics different from mineral particles? Idealized wind tunnel studies on polyethylene microspheres, Atmos. Chem. Phys., 23, 15835–15851, https://doi.org/10.5194/acp-23-15835-2023, 2023. a, b, c, d, e, f, g, h, i
ESDU: Characteristics of wind speed in the lower layers of the atmosphere near the ground: strong winds (neutral atmosphere), ESDU Data Item No. 72026, Engineering Sciences Data Unit, London, 1972. a
Fang, C. and Sill, B.: Aerodynamic roughness length: correlation with roughness elements, J. Wind Eng. Ind. Aerod., 41, 449–460, https://doi.org/10.1016/0167-6105(92)90444-f, 1992. a
Firdauz, S. S., Rachmawati, E., and Sulistiyo, M. D.: Mask Detection on Motorcyclists Using YOLOv4, Building of Informatics, Technology and Science (BITS), 4, https://doi.org/10.47065/bits.v4i4.2980, 2023. a
Foken, T. and Mauder, M.: Micrometeorology, vol. 2, Springer, https://doi.org/10.1007/978-3-642-25440-6, 2008. a
Garratt, J. R.: The atmospheric boundary layer, Earth-Sci. Rev., 37, 89–134, https://doi.org/10.1016/0012-8252(94)90026-4, 1994. a
Goossens, D. and Van Kerschaever, E.: Aeolian dust deposition on photovoltaic solar cells: the effects of wind velocity and airborne dust concentration on cell performance, Sol. Energ., 66, 277–289, https://doi.org/10.1016/s0038-092x(99)00028-6, 1999. a
Gregory, M. R.: Plastic “scrubbers” in hand cleansers: a further (and minor) source for marine pollution identified, Mar. Pollut. Bull., 32, 867–871, https://doi.org/10.1016/s0025-326x(96)00047-1, 1996. a
Grigoratos, T. and Martini, G.: Brake wear particle emissions: a review, Environ. Sci. Pollut. Res., 22, 2491–2504, https://doi.org/10.1007/s11356-014-3696-8, 2015. a
Gualtieri, M., Andrioletti, M., Mantecca, P., Vismara, C., and Camatini, M.: Impact of tire debris on in vitro and in vivo systems, Part. Fibre Toxicol., 2, 1–14, https://doi.org/10.1186/1743-8977-2-1, 2005. a
Gunawardana, C., Goonetilleke, A., Egodawatta, P., Dawes, L., and Kokot, S.: Source characterisation of road dust based on chemical and mineralogical composition, Chemosphere, 87, 163–170, https://doi.org/10.1016/j.chemosphere.2011.12.012, 2012. a
Hajdowska, K., Student, S., and Borys, D.: Graph based method for cell segmentation and detection in live-cell fluorescence microscope imaging, Biomed, Signal Proces,, 71, 103071, https://doi.org/10.1016/j.bspc.2021.103071, 2022. a
Hesse, D., Feißel, T., Kunze, M., Bachmann, E., Bachmann, T., and Gramstat, S.: Comparison of methods for sampling particulate emissions from tires under different test environments, Atmosphere, 13, 1262, https://doi.org/10.3390/atmos13081262, 2022. a
Hillenbrand, T., Toussaint, D., Böhm, E., Fuchs, S., Scherer, U., Rudolphi, A., Hoffmann, M., Kreißig, J., and Kotz, C.: Einträge von Kupfer, Zink und Blei in Gewässer und Böden, Forschungsbericht 202 242 20/02, 279 pp., 2005. a
Horton, A. A. and Dixon, S. J.: Microplastics: An introduction to environmental transport processes, WIRes Water, 5, e1268, https://doi.org/10.1002/wat2.1268, 2018. a
Hu, R., Johnson, P. L., and Meneveau, C.: Modeling the resuspension of small inertial particles in turbulent flow over a fractal-like multiscale rough surface, Phys. Rev. Fluids, 8, 024304, https://doi.org/10.1103/physrevfluids.8.024304, 2023. a
Hui, M., Larsen, A., and Xiang, H.: Wind turbulence characteristics study at the Stonecutters Bridge site: Part I – Mean wind and turbulence intensities, J. Wind Eng. Ind. Aerod., 97, 22–36, https://doi.org/10.1016/j.jweia.2008.11.002, 2009. a
Hussain, M.: YOLO-v1 to YOLO-v8, the rise of YOLO and its complementary nature toward digital manufacturing and industrial defect detection, Machines, 11, 677, https://doi.org/10.3390/machines11070677, 2023. a
Ibrahim, A., Dunn, P., and Brach, R.: Microparticle detachment from surfaces exposed to turbulent air flow: controlled experiments and modeling, J. Aerosol Sci., 34, 765–782, https://doi.org/10.1016/s0021-8502(03)00031-4, 2003. a, b, c, d, e, f
Iversen, J. D. and White, B. R.: Saltation threshold on earth, mars and venus, Sedimentology, 29, 111–119, https://doi.org/10.1111/j.1365-3091.1982.tb01713.x, 1982. a
Järlskog, I., Jaramillo-Vogel, D., Rausch, J., Gustafsson, M., Strömvall, A.-M., and Andersson-Sköld, Y.: Concentrations of tire wear microplastics and other traffic-derived non-exhaust particles in the road environment, Environ. Int., 170, 107618, https://doi.org/10.1016/j.envint.2022.107618, 2022. a
Jia, T., Peng, Z., Yu, J., Piaggio, A. L., Zhang, S., and de Kreuk, M. K.: Detecting the interaction between microparticles and biomass in biological wastewater treatment process with Deep Learning method, Sci. Total Environ., 951, 175813, https://doi.org/10.2139/ssrn.4829923, 2024. a
Jiang, L., Fan, G., Li, Z., Kai, X., Zhang, D., Chen, Z., Humphries, S., Heness, G., and Yeung, W. Y.: An approach to the uniform dispersion of a high volume fraction of carbon nanotubes in aluminum powder, Carbon, 49, 1965–1971, https://doi.org/10.1016/j.carbon.2011.01.021, 2011. a
Jocher, G., Chaurasia, A., and Qiu, J.: YOLO by Ultralytics, GitHub [code], https://github.com/ultralytics/ultralytics (last access: 16 July 2026), 2023. a, b
Kassab, A. S., Ugaz, V. M., King, M. D., and Hassan, Y. A.: High resolution study of micrometer particle detachment on different surfaces, Aerosol Sci. Technol., 47, 351–360, https://doi.org/10.1080/02786826.2012.752789, 2013. a, b, c, d
Kernchen, S., Schmalz, H., Löder, M. G., Georgi, C., Einhorn, A., Greiner, A., Nölscher, A. C., Laforsch, C., and Held, A.: Atmospheric deposition studies of microplastics in Central Germany, Air Qual. Atmos. Hlth., 17, 2247–2261, https://doi.org/10.1007/s11869-024-01571-w, 2024. a
Kim, J., Yang, S. I., Moon, H., Hong, J., Hong, J., Choi, W., Son, H., Lee, B.-c., Kim, G.-B., and Kim, Y.: Potential release of nano-carbon black from tire-wear particles through the weathering effect, J. Ind. Eng. Chem., 96, 322–329, https://doi.org/10.1016/j.jiec.2021.01.036, 2021. a
Kim, Y., Wellum, G., Mello, K., Strawhecker, K. E., Thoms, R., Giaya, A., and Wyslouzil, B. E.: Effects of relative humidity and particle and surface properties on particle resuspension rates, Aerosol Sci. Tech., 50, 339–352, https://doi.org/10.1080/02786826.2016.1152350, 2016. a
Klöckner, P., Seiwert, B., Weyrauch, S., Escher, B. I., Reemtsma, T., and Wagner, S.: Comprehensive characterization of tire and road wear particles in highway tunnel road dust by use of size and density fractionation, Chemosphere, 279, 130530, https://doi.org/10.1016/j.chemosphere.2021.130530, 2021. a
Kok, J. F., Parteli, E. J., Michaels, T. I., and Karam, D. B.: The physics of wind-blown sand and dust, Rep. Prog. Phys., 75, 106901, https://doi.org/10.1088/0034-4885/75/10/106901, 2012. a, b
Kouadio, E. K., Goriaux, M., Laguionie, P., and Ruban, V.: Metal particle seeding on urban surface samples, Environ. Sci. Pollut. Res., 29, 30837–30849, https://doi.org/10.1007/s11356-021-13789-7, 2022. a
Kozmar, H.: Characteristics of natural wind simulations in the TUM boundary layer wind tunnel, Theor. Appl. Climatol., 106, 95–104, https://doi.org/10.1007/s00704-011-0417-9, 2011. a
Kreider, M. L., Panko, J. M., McAtee, B. L., Sweet, L. I., and Finley, B. L.: Physical and chemical characterization of tire-related particles: Comparison of particles generated using different methodologies, Sci. Total Environ., 408, 652–659, https://doi.org/10.1016/j.scitotenv.2009.10.016, 2010. a, b
Laermanns, H., Lehmann, M., Klee, M., J. Löder, M. G., Gekle, S., and Bogner, C.: Tracing the horizontal transport of microplastics on rough surfaces, Microplastics and Nanoplastics, 1, 1–12, https://doi.org/10.1186/s43591-021-00010-2, 2021. a
Laforsch, C., Ramsperger, A. F., Mondellini, S., and Galloway, T. S.: Microplastics: a novel suite of environmental contaminants but present for decades, edited by: Reichl, F. X. and Schwenk, M., Regulatory Toxicology, 1185–1210, Springer, Berlin, Heidelberg, https://doi.org/10.1007/978-3-642-36206-4_138-1, 2021. a
Laglbauer, B. J., Franco-Santos, R. M., Andreu-Cazenave, M., Brunelli, L., Papadatou, M., Palatinus, A., Grego, M., and Deprez, T.: Macrodebris and microplastics from beaches in Slovenia, Mar. Pollut. Bull., 89, 356–366, https://doi.org/10.1016/j.marpolbul.2014.09.036, 2014. a
Lee, Y., Lee, C., Lee, H.-J., and Kim, J.-S.: Fast detection of objects using a YOLOv3 network for a vending machine, in: 2019 IEEE International Conference on Artificial Intelligence Circuits and Systems (AICAS), IEEE, 132–136, https://doi.org/10.1109/aicas.2019.8771517, 2019. a
Li, H., Yang, S., Zhang, R., Yu, P., Fu, Z., Wang, X., Kadoch, M., and Yang, Y.: Detection of floating objects on water surface using YOLOv5s in an edge computing environment, Water, 16, 86, https://doi.org/10.3390/w16010086, 2023. a
Liang, C., Jia, Z., and Chen, R.: An automated particle size analysis method for SEM images of powder coating particles, Coatings, 13, 1547, https://doi.org/10.3390/coatings13091547, 2023. a
Lim, J., Shin, G., and Shin, D.: Fast detection and classification of microplastics below 10 µm using CNN with Raman spectroscopy, Anal. Chem., 96, 6819–6825, https://doi.org/10.1021/acs.analchem.4c00823, 2024. a
Lim, Y. K., Lee, C. H., Lee, K.-W., Hong, S. H., and Baek, S. H.: Impact of Heterosigma akashiwo on the environmental behavior of microplastics: Aggregation, sinking, and resuspension dynamics, J. Hazard. Mater., 487, 137242, https://doi.org/10.1016/j.jhazmat.2025.137242, 2025. a
Liu, Z., Zheng, C., Wu, Y., Flay, R. G., and Zhang, K.: Wind tunnel simulation of wind flows with the characteristics of thousand-meter high ABL, Build. Environ., 152, 74–86, https://doi.org/10.1016/j.buildenv.2019.02.012, 2019. a
Loth, E.: Compressibility and rarefaction effects on drag of a spherical particle, AIAA J., 46, 2219–2228, https://doi.org/10.2514/1.28943, 2008. a
Luke, J., Joseph, R., and Balaji, M.: Impact of image size on accuracy and generalization of convolutional neural networks, Int. J. Res. Anal. Rev., 6, 70–80, 2019. a
Luo, Z., Zhou, X., Su, Y., Wang, H., Yu, R., Zhou, S., Xu, E. G., and Xing, B.: Environmental occurrence, fate, impact, and potential solution of tire microplastics: Similarities and differences with tire wear particles, Sci. Total Environ., 795, 148902, https://doi.org/10.1016/j.scitotenv.2021.148902, 2021. a
Marsh, B. P., Chada, N., Sanganna Gari, R. R., Sigdel, K. P., and King, G. M.: The Hessian blob algorithm: Precise particle detection in atomic force microscopy imagery, Sci. Rep., 8, 978, https://doi.org/10.1038/s41598-018-19379-x, 2018. a
Marwood, C., McAtee, B., Kreider, M., Ogle, R. S., Finley, B., Sweet, L., and Panko, J.: Acute aquatic toxicity of tire and road wear particles to alga, daphnid, and fish, Ecotoxicology, 20, 2079–2089, https://doi.org/10.1007/s10646-011-0750-x, 2011. a
Mennekes, D. and Nowack, B.: Tire wear particle emissions: measurement data where are you?, Sci. Total Environ., 830, 154655, https://doi.org/10.1016/j.scitotenv.2022.154655, 2022. a
Messer, C., Khurana, R., and Bedi, S.: Classification of Uncertainty in Nuclei Segmentation From H&E Images, Tech. rep., Stanford University, https://cs231n.stanford.edu/2024/papers/classification-of-uncertainty-in-nuclei-segmentation-from-he-ima.pdf (last access: 16 July 2026), 2024. a
Olivares, M. V., Benito, J., Silin, N., Uñac, R., and Vidales, A.: Aerodynamic resuspension of irregular flat micro-particles, J. Aerosol Sci., 181, 106418, https://doi.org/10.1016/j.jaerosci.2024.106418, 2024. a, b, c, d, e, f, g
Osuoha, J. O., Anyanwu, B. O., and Ejileugha, C.: Pharmaceuticals and personal care products as emerging contaminants: Need for combined treatment strategy, Journal of Hazardous Materials Advances, 9, 100206, https://doi.org/10.1016/j.hazadv.2022.100206, 2023. a
Piehl, S., Leibner, A., Löder, M. G., Dris, R., Bogner, C., and Laforsch, C.: Identification and quantification of macro-and microplastics on an agricultural farmland, Sci. Rep., 8, 17950, https://doi.org/10.1038/s41598-018-36172-y, 2018. a
Prume, J. A., Gorka, F., and Löder, M. G.: From sieve to microscope: an efficient technique for sample transfer in the process of microplastics' quantification, MethodsX, 8, 101341, https://doi.org/10.1016/j.mex.2021.101341, 2021. a
Qasem, H., Betts, T. R., Mullejans, H., AlBusairi, H., and Gottschalg, R.: Dust-induced shading on photovoltaic modules, Progress in Photovoltaics: Research and Applications, 22, 218–226, https://doi.org/10.1002/pip.2230, 2014. a
Shao, Y.: Physics and modelling of wind erosion, 2nd edn., Springer Dordrecht, https://doi.org/10.1007/978-1-4020-8895-7, 2008. a
Shao, Y. and Li, A.: Numerical modelling of saltation in the atmospheric surface layer, Bound.-Lay. Meteorol., 91, 199–225, https://doi.org/10.1023/a:1001816013475, 1999. a
Shao, Y. and Lu, H.: A simple expression for wind erosion threshold friction velocity, J. Geophys. Res.-Atmos., 105, 22437–22443, https://doi.org/10.1029/2000jd900304, 2000. a, b, c, d, e, f, g, h
Sharma, M. M., Chamoun, H., Sarma, D. S. R., and Schechter, R. S.: Factors controlling the hydrodynamic detachment of particles from surfaces, J. Colloid Interf. Sci., 149, 121–134, https://doi.org/10.1016/0021-9797(92)90398-6, 1992. a
Sommer, F., Dietze, V., Baum, A., Sauer, J., Gilge, S., Maschowski, C., and Gieré, R.: Tire abrasion as a major source of microplastics in the environment, Aerosol Air Qual. Res., 18, 2014–2028, https://doi.org/10.4209/aaqr.2018.03.0099, 2018. a
Sundt, P., Schulze, P.-E., and Syversen, F.: Sources of microplastic pollution to the marine environment, Report M-321/2015, Mepex for the Norwegian Environment Agency (Miljødirektoratet), 108 pp., https://www.miljodirektoratet.no/publikasjoner/2015/februar/sources-of-microplastic-pollution-to-the-marine-environment/ (last access: 16 July 2026), 2014. a, b
Thammasanya, T., Patiam, S., Rodcharoen, E., and Chotikarn, P.: A new approach to classifying polymer type of microplastics based on Faster-RCNN-FPN and spectroscopic imagery under ultraviolet light, Sci. Rep., 14, 3529, https://doi.org/10.1038/s41598-024-53251-5, 2024. a
Theron, F., Debba, D., and Le Coq, L.: Local experimental methodology for the study of microparticles resuspension in ventilated duct during fan acceleration, J. Aerosol Sci., 140, 105477, https://doi.org/10.1016/j.jaerosci.2019.105477, 2020. a, b
Thomas, C. K., Law, B. E., Irvine, J., Martin, J. G., Pettijohn, J. C., and Davis, K. J.: Seasonal hydrology explains interannual and seasonal variation in carbon and water exchange in a semiarid mature ponderosa pine forest in central Oregon, J. Geophys. Res.-Biogeo., 114, https://doi.org/10.1029/2009jg001010, 2009. a
Trush, A., Pospíšil, S., and Kozmar, H.: Comparison of turbulence integral length scale determination methods, Adv. Fluid Mech. XIII, 128, 113, https://doi.org/10.2495/afm200111, 2020. a
Turner, A. and Rice, L.: Toxicity of tire wear particle leachate to the marine macroalga, Ulva lactuca, Environ. Pollut., 158, 3650–3654, https://doi.org/10.1016/j.envpol.2010.08.001, 2010. a
Valenzuela-Aracena, K., Oger, L., Unac, R. O., and Vidales, A. M.: Resuspension due to vertical oscillations: experiments and numerical modeling, Granul. Matter, 21, 51, https://doi.org/10.1007/s10035-019-0906-6, 2019. a
van Calcar, C. and van Emmerik, T.: Abundance of plastic debris across European and Asian rivers, EGU General Assembly 2020, Online, 4–8 May 2020, EGU2020-707, https://doi.org/10.5194/egusphere-egu2020-707, 2019. a
Wang, H.-C.: Effects of inceptive motion on particle detachment from surfaces, Aerosol Sci. Tech., 13, 386–393, https://doi.org/10.1080/02786829008959453, 1990. a
Wik, A., Lycken, J., and Dave, G.: Sediment quality assessment of road runoff detention systems in Sweden and the potential contribution of tire wear, Water Air Soil Poll., 194, 301–314, https://doi.org/10.1007/s11270-008-9718-8, 2008. a
Xu, J. and Wang, Z.: Efficient and accurate microplastics identification and segmentation in urban waters using convolutional neural networks, Sci. Total Environ., 911, 168696, https://doi.org/10.1016/j.scitotenv.2023.168696, 2024. a
Xu, S., Tang, H., Li, J., Wang, L., Zhang, X., and Gao, H.: A yolow algorithm of water-crossing object detection, Appl. Sci., 13, 8890, https://doi.org/10.3390/app13158890, 2023. a
You, S. and Wan, M. P.: A new turbulent-burst-based model for particle resuspension from rough surfaces in turbulent flow, Aerosol Sci. Tech., 48, 1031–1042, https://doi.org/10.1080/02786826.2014.955908, 2014. a
Zailan, N. A., Azizan, M. M., Hasikin, K., Mohd Khairuddin, A. S., and Khairuddin, U.: An automated solid waste detection using the optimized YOLO model for riverine management, Front. Public Health, 10, 907280, https://doi.org/10.3389/fpubh.2022.907280, 2022. a
Zeng, T., Zhu, Y., and Lam, E. Y.: Deep learning for digital holography: a review, Opt. Express, 29, 40572–40593, https://doi.org/10.1364/oe.443367, 2021. a
Zhang, Z., Li, P., Hu, W., Li, J., Li, H., Wang, R., Li, Q., Zou, X., Zhou, B., and Chang, C.: Electric forces can enhance the emission of microplastics into air, Environ. Pollut., 126405, https://doi.org/10.1016/j.envpol.2025.126405, 2025. a
Zhao, S., Zhou, H., and Yang, H.: Smart Monitoring Method for Land-Based Sources of Marine Outfalls Based on an Improved YOLOv8 Model, Water, 16, 3285, https://doi.org/10.3390/w16223285, 2024. a, b
Zhu, Y., Yeung, C. H., and Lam, E. Y.: Microplastic pollution monitoring with holographic classification and deep learning, Journal of Physics: Photonics, 3, 024013, https://doi.org/10.1088/2515-7647/abf250, 2021. a
- Abstract
- Introduction
- Methodology
- Results and discussion
- Conclusions
- Appendix A: Deep learning
- Appendix B: Tyre wear particle characterization
- Appendix C: Flow conditions
- Appendix D: Detachment
- Code and data availability
- Author contributions
- Competing interests
- Disclaimer
- Acknowledgements
- Financial support
- Review statement
- References
- Abstract
- Introduction
- Methodology
- Results and discussion
- Conclusions
- Appendix A: Deep learning
- Appendix B: Tyre wear particle characterization
- Appendix C: Flow conditions
- Appendix D: Detachment
- Code and data availability
- Author contributions
- Competing interests
- Disclaimer
- Acknowledgements
- Financial support
- Review statement
- References