the Creative Commons Attribution 4.0 License.
the Creative Commons Attribution 4.0 License.
 | 20 Feb 2026
Investigating small ion number size distributions: insight into cluster formation and growth
Santeri Tuovinen
Janne Lampilahti
Nina Sarnela
Chengfeng Liu
Yongchun Liu
Markku Kulmala
Veli-Matti Kerminen
Small ions, consisting mostly of charged molecular clusters with mobility diameters below 2 nm, exist continuously in the atmosphere. Here, we studied small ion number size distributions measured with neutral cluster and air ion spectrometer measurements in Hyytiälä, Finland, and Beijing, China. We found that in Hyytiälä, there is a strong positive relationship between the concentration and diameter of small ions of both polarities and highly oxidized organic molecule (HOM) and sulfuric acid concentrations, and that the relationship with the former is especially strong. The relationship between the negative sulfuric acid cluster ions and the small ion number size distribution in Hyytiälä was found to be more complex but overall positive. In contrast to Hyytiälä, we found that in Beijing, the small ion number size distribution does not have a clear relationship with sulfuric acid or oxidized organic molecule (OOM) concentration. We found that the small ion size distribution in Hyytiälä behaved as expected with respect to varying coagulation sink (CoagS), with concentrations of the smallest ions decreasing most with increasing CoagS. Surprisingly, the small ion size distribution in Beijing did not vary significantly with varying CoagS. However, in both locations, the impact of growth on the small ion number size distribution during periods of intense cluster formation and new particle formation is clearly seen. Our results show that although in Hyytiälä the growth of small ions to larger diameters is limited by the concentrations of sulfuric acid and OOMs, in Beijing there are additional factors required for the small ions to grow.
- Article
(6404 KB) - Full-text XML
- BibTeX
- EndNote


Atmospheric aerosol particles influence the Earth's climate (e.g., Quaas et al., 2009; Boucher et al., 2013; Schmale et al., 2021; Li et al., 2022) and can have adverse effects on human health (e.g., Shiraiwa et al., 2017; Arfin et al., 2023). These influences have commonly been related to properties, such as the mass or number concentration of an atmospheric aerosol population, its size distribution, or its chemical composition (Shiraiwa et al., 2017; Atkinson et al., 2015; Finlay, 2021). The electric charge state of atmospheric aerosols has attracted much less interest, although this property may have large influences on the dynamics of atmospheric aerosol populations (Harrison and Carslaw, 2003; Fdez-Arroyabe et al., 2022), thereby affecting many other important aerosol properties. The presence of charges also makes it possible to measure low aerosol concentrations at high resolution in both time and particle size (Mirme and Mirme, 2013; Mirme et al., 2025).
Charged atmospheric particles, or more broadly ions, include charged aerosol particles, charged molecular clusters, and even large molecules having a charge. Ions with electrical mobility diameters roughly below 2 nm in diameter are classified as small ions, and consist of charged molecular clusters, while ions above 2 nm consist of charged aerosol particles (Tammet, 1995; Ehn et al., 2010). Of these charged aerosol particles, those with diameters between 2 and 7 nm are referred to as intermediate ions (Tammet, 1995).
Atmospheric ions are created through the ionization of molecules of the atmosphere. Most important of these ionization sources are cosmic ray radiation, gamma radiation, and radon decay (Harrison and Tammet, 2008). Small ions, constantly present in the troposphere as molecules, are ionized and subsequently grow to small ions (Harrison and Tammet, 2008; Hirsikko et al., 2011). The lifetime of small ions is short, at around 100 s, and their chemical composition depends on the atmospheric trace gas concentrations and their chemistry (Harrison and Tammet, 2008; Ehn et al., 2010; Shuman et al., 2015). In contrast, intermediate ions are typically detected mainly during the occurrence of atmospheric new particle formation (Tammet et al., 2014; Tuovinen et al., 2024), or during snowfall or rain (Hirsikko et al., 2007; Tammet et al., 2014). New particle formation (NPF) is considered to occur when constantly existing stable clusters, neutral or charged, start to grow to larger sizes by the uptake of precursor vapors such as sulfuric acid and organic compounds with low volatilities (Kulmala et al., 2006, 2007; Lehtipalo et al., 2018; Kirkby et al., 2023).
A recent study by Kulmala et al. (2024a) presented the use of a novel Cluster Ion Counter (CIC) for measuring small and intermediate ion concentrations to study local-scale NPF and to derive other parameters such as condensation sink (CS). The information gained by these measurements can be used further to study the complex climate–biosphere feedbacks (Kulmala et al., 2020, 2024b). These recent advances have motivated us to take a deeper look at the small ion size distribution.
The concentration of small ions depends on the ionization rate and the loss rate of small ions due to ion–ion recombination, coagulation with larger aerosol particles, and deposition (Tammet et al., 2006; Hõrrak et al., 2008). The size of the small ions depends on their chemical composition and age as the ions grow through chemical reactions and condensation of vapors, or through coagulation with neutral clusters. We can learn more about these chemical and dynamical processes by investigating the small ion number size distributions.
In this study, we combine ion number size distribution data measured by neutral cluster and air ion spectrometer (NAIS; Manninen et al., 2011; Mirme and Mirme, 2013) with concentrations of low-volatility vapors and ion clusters measured by mass spectrometer instruments to identify how, and why, the size distribution of small ions changes and evolves. Data from two different contrasting locations – Hyytiälä, Finland, and Beijing, China (Kulmala et al., 2025) – are used. First, we will study if the variation of the small ion size distribution with season is considerable. Second, we will quantify the potential relationship of organic low-volatility vapors and sulfuric acid on the size and number of small ions. Third, we will analyze the impact of coagulation scavenging on small ion size distribution. Fourth, we will analyze the small ion size distribution as a function of intensity of NPF to reveal how the small ion size distribution changes as the clusters grow. Finally, some case studies are presented. With these, we aim to identify the most important processes impacting the small ion number size distribution and to evaluate the role of these processes in driving the growth of small ions to intermediate ions.
2.1 Evolution of small ion size distribution
Typically, the parameter of interest when small ions are considered is their total number concentration and its temporal evolution. The changes in the small ion number concentration can be described by the simplified air ion balance equation:
Here, N± is the concentration of one polarity, while N∓ is the concentration of the other polarity. The first term on the right-hand side of the equation describes the source rate of the ions, where Q is the ionization rate of air molecules. The second term, where CoagS stands for coagulation sink, tells the loss rate of small ions due to coagulation on larger aerosol particles. The third term tells the loss rate of ions due to ion–ion recombination, where α is the ion recombination coefficient. The final term describes other losses of the ions, including deposition, and S is the loss rate of the ions to these other sinks.
As we can see, the above equation does not explicitly depend on the size of the small ions, nor can it be directly used to describe the evolution of the size-dependent small ion size distribution. The time evolution of small ions of certain size i are described by the charged general dynamics equations (charged GDEs; Kulmala et al., 2012):
Here, Ji is the formation rates of ions of size i. The second term on the right-hand side represents the charging of neutral clusters by ions smaller than i, where X is the ion-cluster attachment coefficient. The last term, where GR is the ion growth rate, describes the growth of ions i to larger sizes. Considering Eq. (2), we can see that an increasing GR will shift the ion size distribution towards larger diameters. CoagS is the highest for the smallest ions, and if it increases, the concentrations of smallest ions decrease the most, causing an apparent shift in the distribution towards larger diameters. However, CoagS also affects the lifetime of small ions, so that with an increasing CoagS the ions have less time to grow, reducing the concentration of larger small ions. If ion concentrations are high, the ion–ion recombination rate will be higher, which will also lead to shorter small ion lifetime and possibly smaller concentrations of larger small ions. Through ion-cluster attachment, the small ion size distribution depends on the size distribution of neutral clusters, although this term is relatively small when compared to the coagulation loss and growth terms.
We assume that the role of direct transport of clusters on the changes in the small ion size distribution is negligible due to their short lifetime of just a couple of minutes (Tammet et al., 2006). Therefore, the observations are assumed to be very local. However, transport can indirectly impact the size distribution of small ions, i.e., through the transport of trace gases and larger particles. We also note that while meteorological conditions, such as temperature, strongly influence processes such as HOM formation (e.g., Quéléver et al., 2019), we do not explicitly consider them in this study.
2.2 Measurement sites
Two different locations were considered in this study: the SMEAR II measurement station in Hyytiälä, Finland (61°51′ N, 24°17′ E), and the BUCT/AHL measurement station in Beijing, China (39°94′ N, 116°30′ E). The former is a rural site surrounded by boreal forest, while the latter is an urban site close to residential buildings and traffic roads. For more details on the SMEAR II station, see Hari and Kulmala (2005). For more details on the BUCT/AHL site, see Liu et al. (2020). These two locations are included in the analysis due to their contrasting natures, providing an opportunity for insight into the variation in small ion size distribution and small ion dynamics in different environments.
2.3 Measurement and other data
Atmospheric ion and total particle number size distributions in Hyytiälä and Beijing were measured with neutral cluster and air ion spectrometer (NAIS; Manninen et al., 2011; Mirme and Mirme, 2013). The NAIS measures both charged and total particle number size distributions in the ranges 0.8–42 and 2.5–42 nm, respectively. The main focus of the analysis in this study is on the number size distributions of small ions (diameters below 2.0 nm). Ion concentrations between 2.0 and 2.3 nm were used to characterize the intensity of local clustering (Tuovinen et al., 2024). New particle formation ranking data, characterizing the intensity of NPF, were also used. The NPF ranking was based on the total particle number concentration between 2.5 and 5.0 nm, and determined according to the method presented by Aliaga et al. (2023).
The chemical composition of small ions typically differs between the polarities (Ehn et al., 2010; Zha et al., 2023). For example, Ehn et al. (2010) found that in Hyytiälä the daytime negative small ions consisted largely of sulfuric acid clusters, while positive small ions consisted of organic species such as alkyl pyridines and alkyl amines. Therefore, we cannot assume that the negative and positive small ion populations behave similarly with respect to, i.e., increased sulfuric acid concentrations. Thus, both negative and positive polarity were separately considered.
All diameters used in the study are electrical mobility diameters. We note that especially for the smallest of the ions, the mobility diameter may not accurately describe the physical dimensions of the ion (see, e.g., Ehn et al., 2011). Regardless, we refer to diameter rather than the electrical mobility, as we see it as a more intuitively understandable parameter for the ion size.
For Hyytiälä, all the times used in this study are in UTC+2. For Beijing, times are in UTC+8.
From Hyytiälä, concentrations of neutral sulfuric acid and highly oxidized organic molecules (HOMs) were used to study the influence of cluster formation and growth on the small ion size distribution. These were measured with chemical-ionization atmospheric-pressure-interface time-of-flight (CI-APi-TOF) mass spectrometer (Jokinen et al., 2012). In addition, the signal counts of ionized sulfuric acid clusters measured with APi-TOF were used to give further insight into the composition of the small ions. The signal counts in the study are given as relative signals to the total measured ion current. From Beijing, neutral sulfuric acid, sulfuric acid dimer, and total oxidized organic molecule (OOM) concentrations – which were measured with a nitrate-based long time-of-flight chemical ionization mass spectrometer (CIMS) – were included in the analysis. We note that we use the term OOM instead of HOM for the organic molecules in Beijing based on previous results by Yan et al. (2021), suggesting that most of these measured organic molecules in Beijing do not meet the requirements for HOMs (see Bianchi et al., 2017).
Condensation sinks (CS) for both sites were included in the analysis as proxies for the coagulation scavenging of the small ions. In Hyytiälä, the particle size distributions from which CS was derived were measured with a twin differential mobility particle sizer (DMPS) system (Aalto et al., 2001). In Beijing, the particle size distributions for CS were measured with a particle size distribution (PSD) system (Liu et al., 2016).
Data coverage for both sites is presented in Fig. 1.
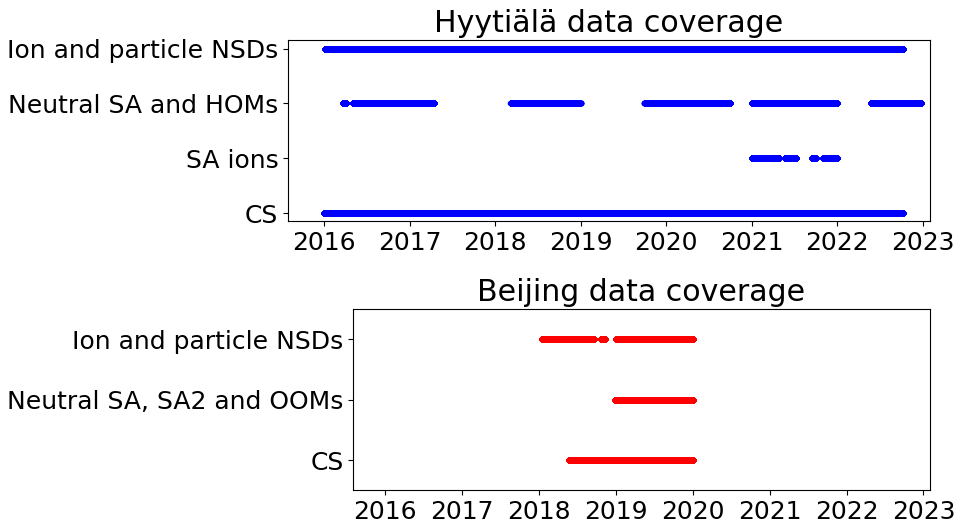
Figure 1Data coverage for the two sites – Hyytiälä, Finland, and Beijing, China – from which data were used in this study. NSD refers to number size distribution, SA to sulfuric acid, SA2 to neutral sulfuric acid dimer, HOM to highly oxidized organic molecule, and OOM to oxidized organic molecule. CS refers to condensation sink.
2.4 Determining the average small ion diameter
From the small ion number size distributions, we determined the mean mobility diameter (dmean) and the median mobility diameter (dmedian) of small ions. First, cubic interpolation was applied to the measured ion number size distributions. We note that nearest neighbor and linear interpolation methods were also tested, and the influence of the chosen method on the value of dmean or dmedian was found to be minor. The diameter range for the interpolation was from the lower detection limit to 2.0 nm, with a step of 0.001 nm. Then, dpeak was determined by finding the diameter corresponding to the maximum concentration of small ions. Weighted mean and median were used to determine dmean and dmedian, with the number concentrations of ions below 2 nm in diameter used as weights. The equation below was used to find weighted mean diameter:
where di is the diameter of ions of a certain size and Ni is their number concentration. The weighted median was determined by finding the diameter dj, satisfying
3.1 Seasonal variation of the small ion size distribution
Figure 2a and b show the monthly median negative and positive ion distributions between 0.8 and 2.0 nm in Hyytiälä. Table 1 records the monthly mean and median diameters (dmean and dmedian). Clear month-to-month changes in the size distributions are observed, and these are more pronounced for negative ions (Fig. 2a). During winter, the concentration of negative ions already peaks below 1.0 nm, while during summer the highest concentration is observed between 1.1 and 1.2 nm. In addition, the concentrations of negative ions above 1.1 nm increase from winter to summer. When close to 2.0 nm in diameter, the ion concentration is almost 1 order of magnitude higher. This behavior of the size distribution is reflected in the values of dmean and dmedian, which are smallest during December and January, with dmean = 0.99 nm and dmedian = 0.95 nm. The the largest is during June and July, with dmean = 1.15 nm and dmedian = 1.11 nm.
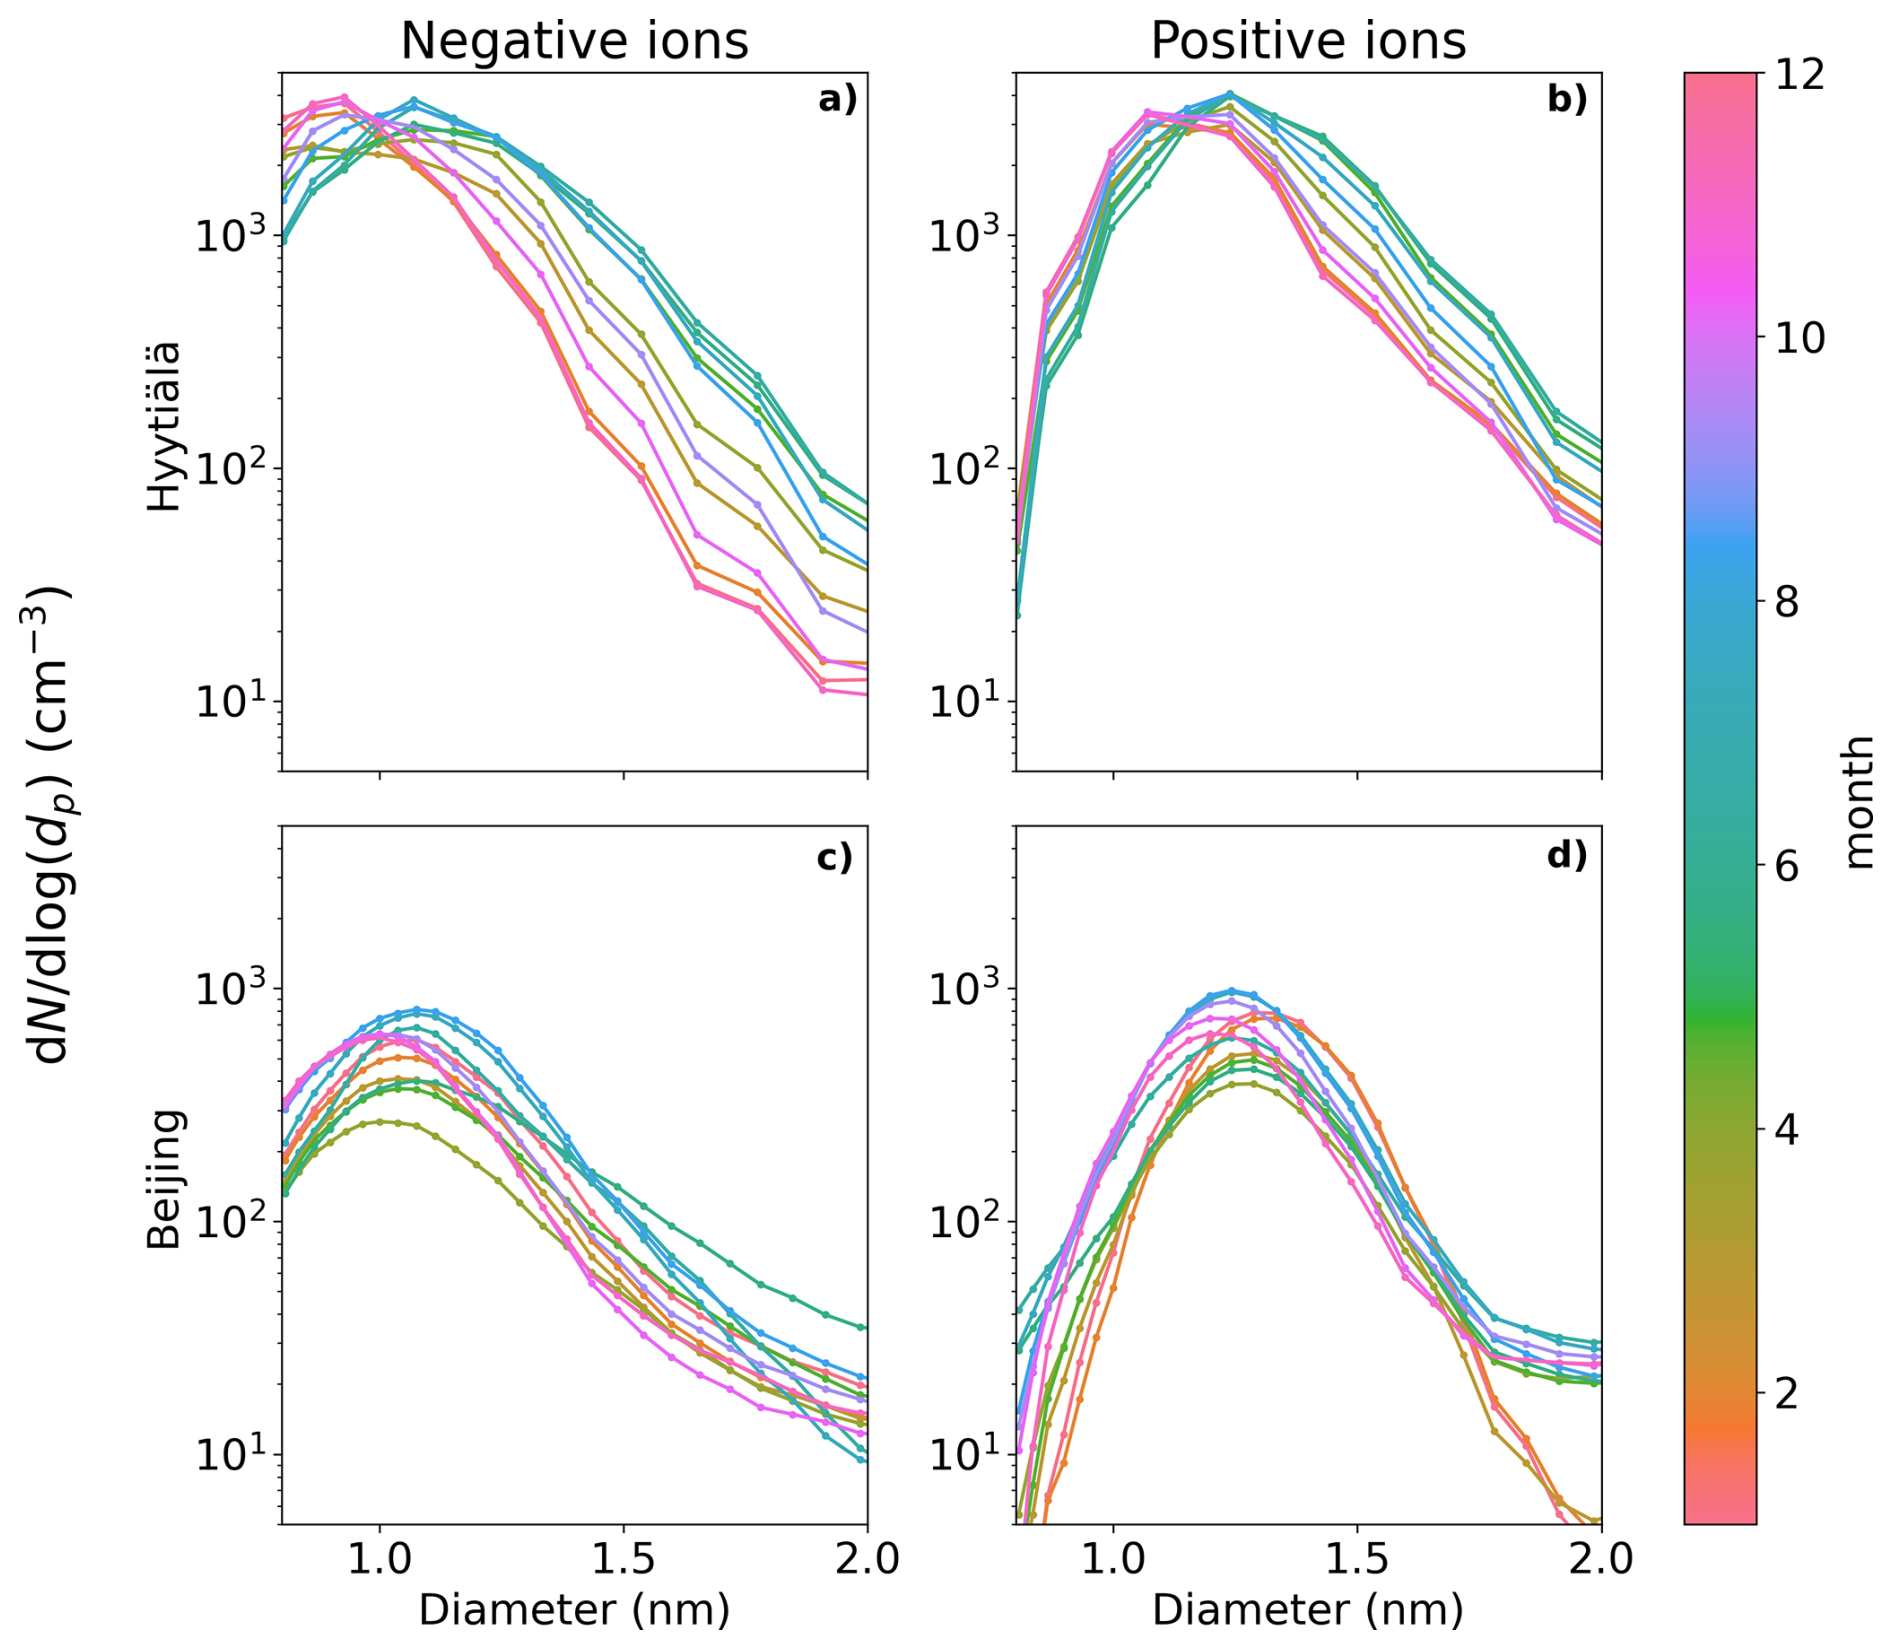
Figure 2Median monthly sub-2 nm negative (a, c) and positive (b, d) ion size distributions for Hyytiälä (a, b) and Beijing (c, d). The different months are marked by the different colors.
Table 1Mean and median monthly diameters (nm) of ions between 0.8 and 2.0 nm in Hyytiälä.
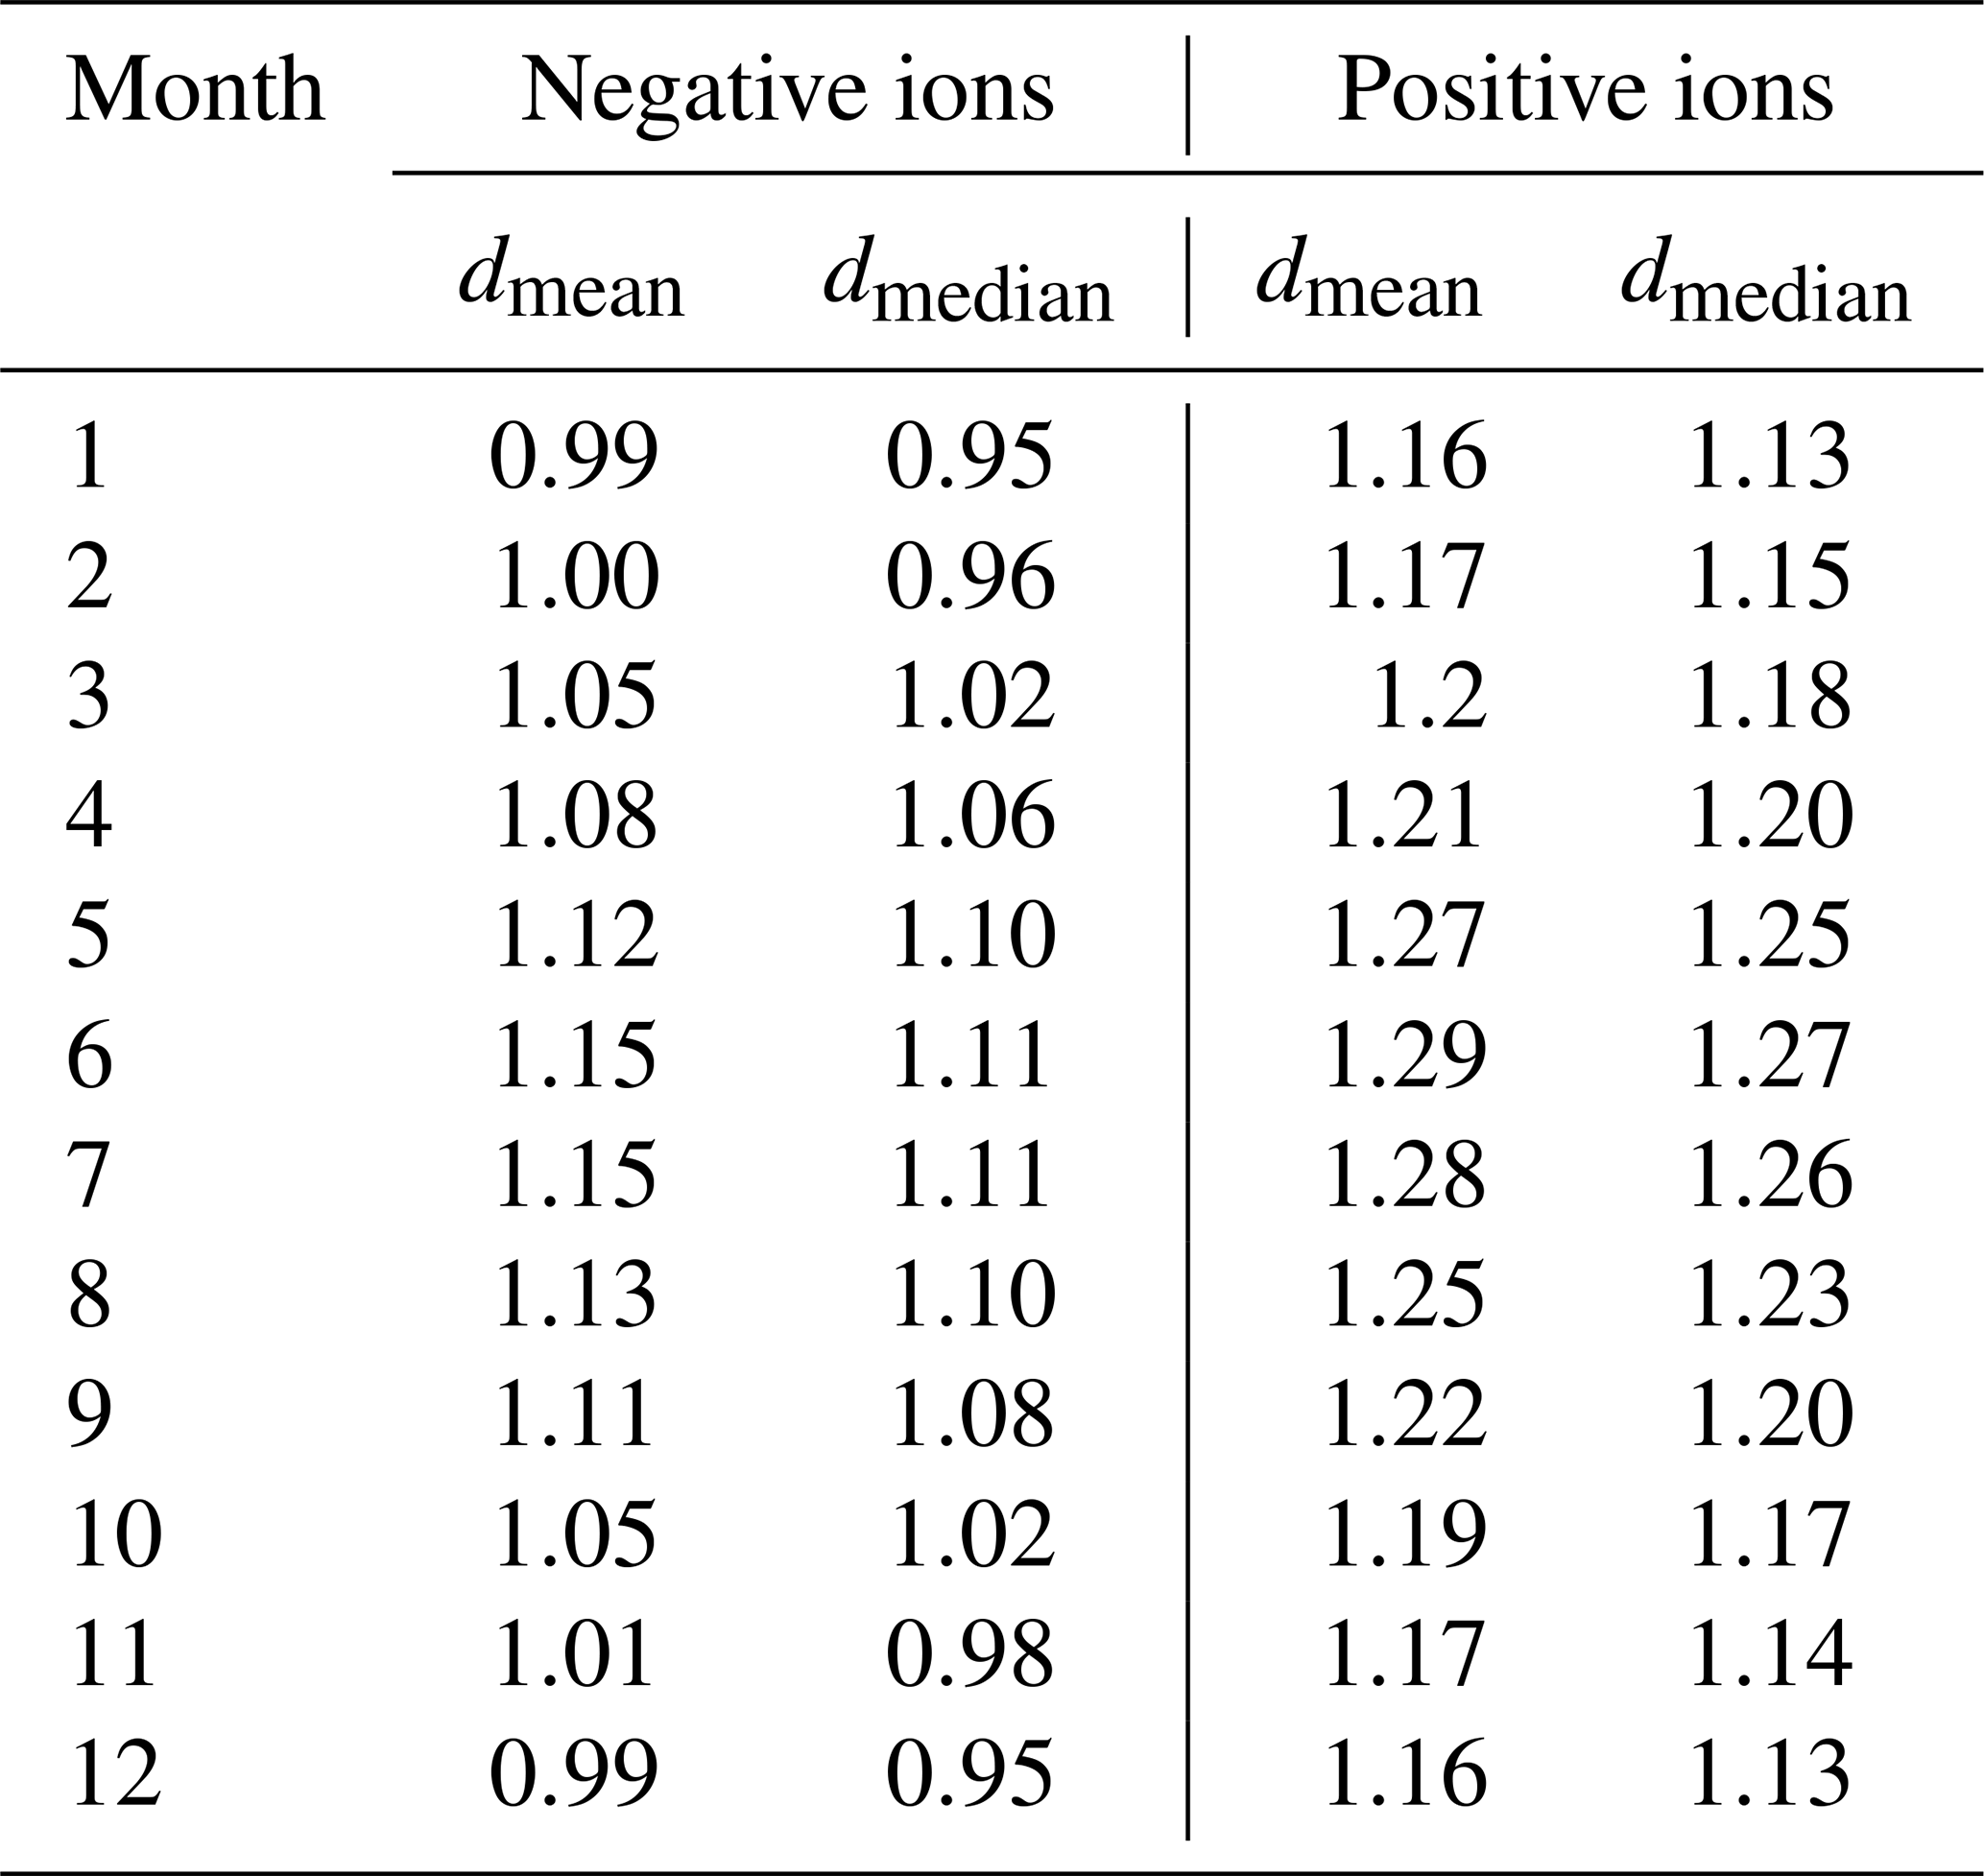
Positive ion size distributions (Fig. 2b) behave similarly to the negative ones; however, the changes are less pronounced. Above 1.4 nm and up to 2.0 nm, the concentrations are roughly twice as high, or less, during summer compared to winter. For positive small ions, the smallest value of dmean = 1.16 nm and dmedian = 1.13 nm (December and January), with the largest value of dmean = 1.29 nm and dmedian = 1.27 nm (June). The difference between the average diameters of negative and positive small ions was around 0.15 nm, in line with previous studies (e.g., Hõrrak et al., 2000).
The observed seasonal behavior of the size distributions in Hyytiälä follow expectations: during spring and summer, the concentrations of low-volatility vapors are much higher due to increased solar radiation and organic emissions (Sulo et al., 2021). Therefore, small ions should be able to grow to larger diameters due to the uptake of these vapors. We will look further into how the small ion size distribution varies with respect to low volatile vapor concentrations in Sect. 3.2.
Figure 2c and d show the monthly median negative (Fig. 2c) and positive (Fig. 2d) ion distributions between 0.8 and 2.0 nm in Beijing, while Table 2 records the monthly dmean and dmedian. As expected, due to the high CoagS (Eqs. 1, 2, and Fig. A1), the concentrations are lower than in Hyytiälä. For negative ions (Fig. 2c), the concentrations during summer are higher than in other seasons below 1.6 nm and lower than in other seasons close to 2.0 nm. During spring, the concentrations of negative ions below 1.4 nm are lower than in other seasons. The smallest value of negative dmean and dmedian are in November: dmean = 1.04 nm and dmedian = 1.01 nm. The largest values are during June: dmean = 1.16 nm and dmedian = 1.12 nm.
Table 2Mean and median monthly diameters (nm) of ions between 0.8 and 2.0 nm in Beijing.
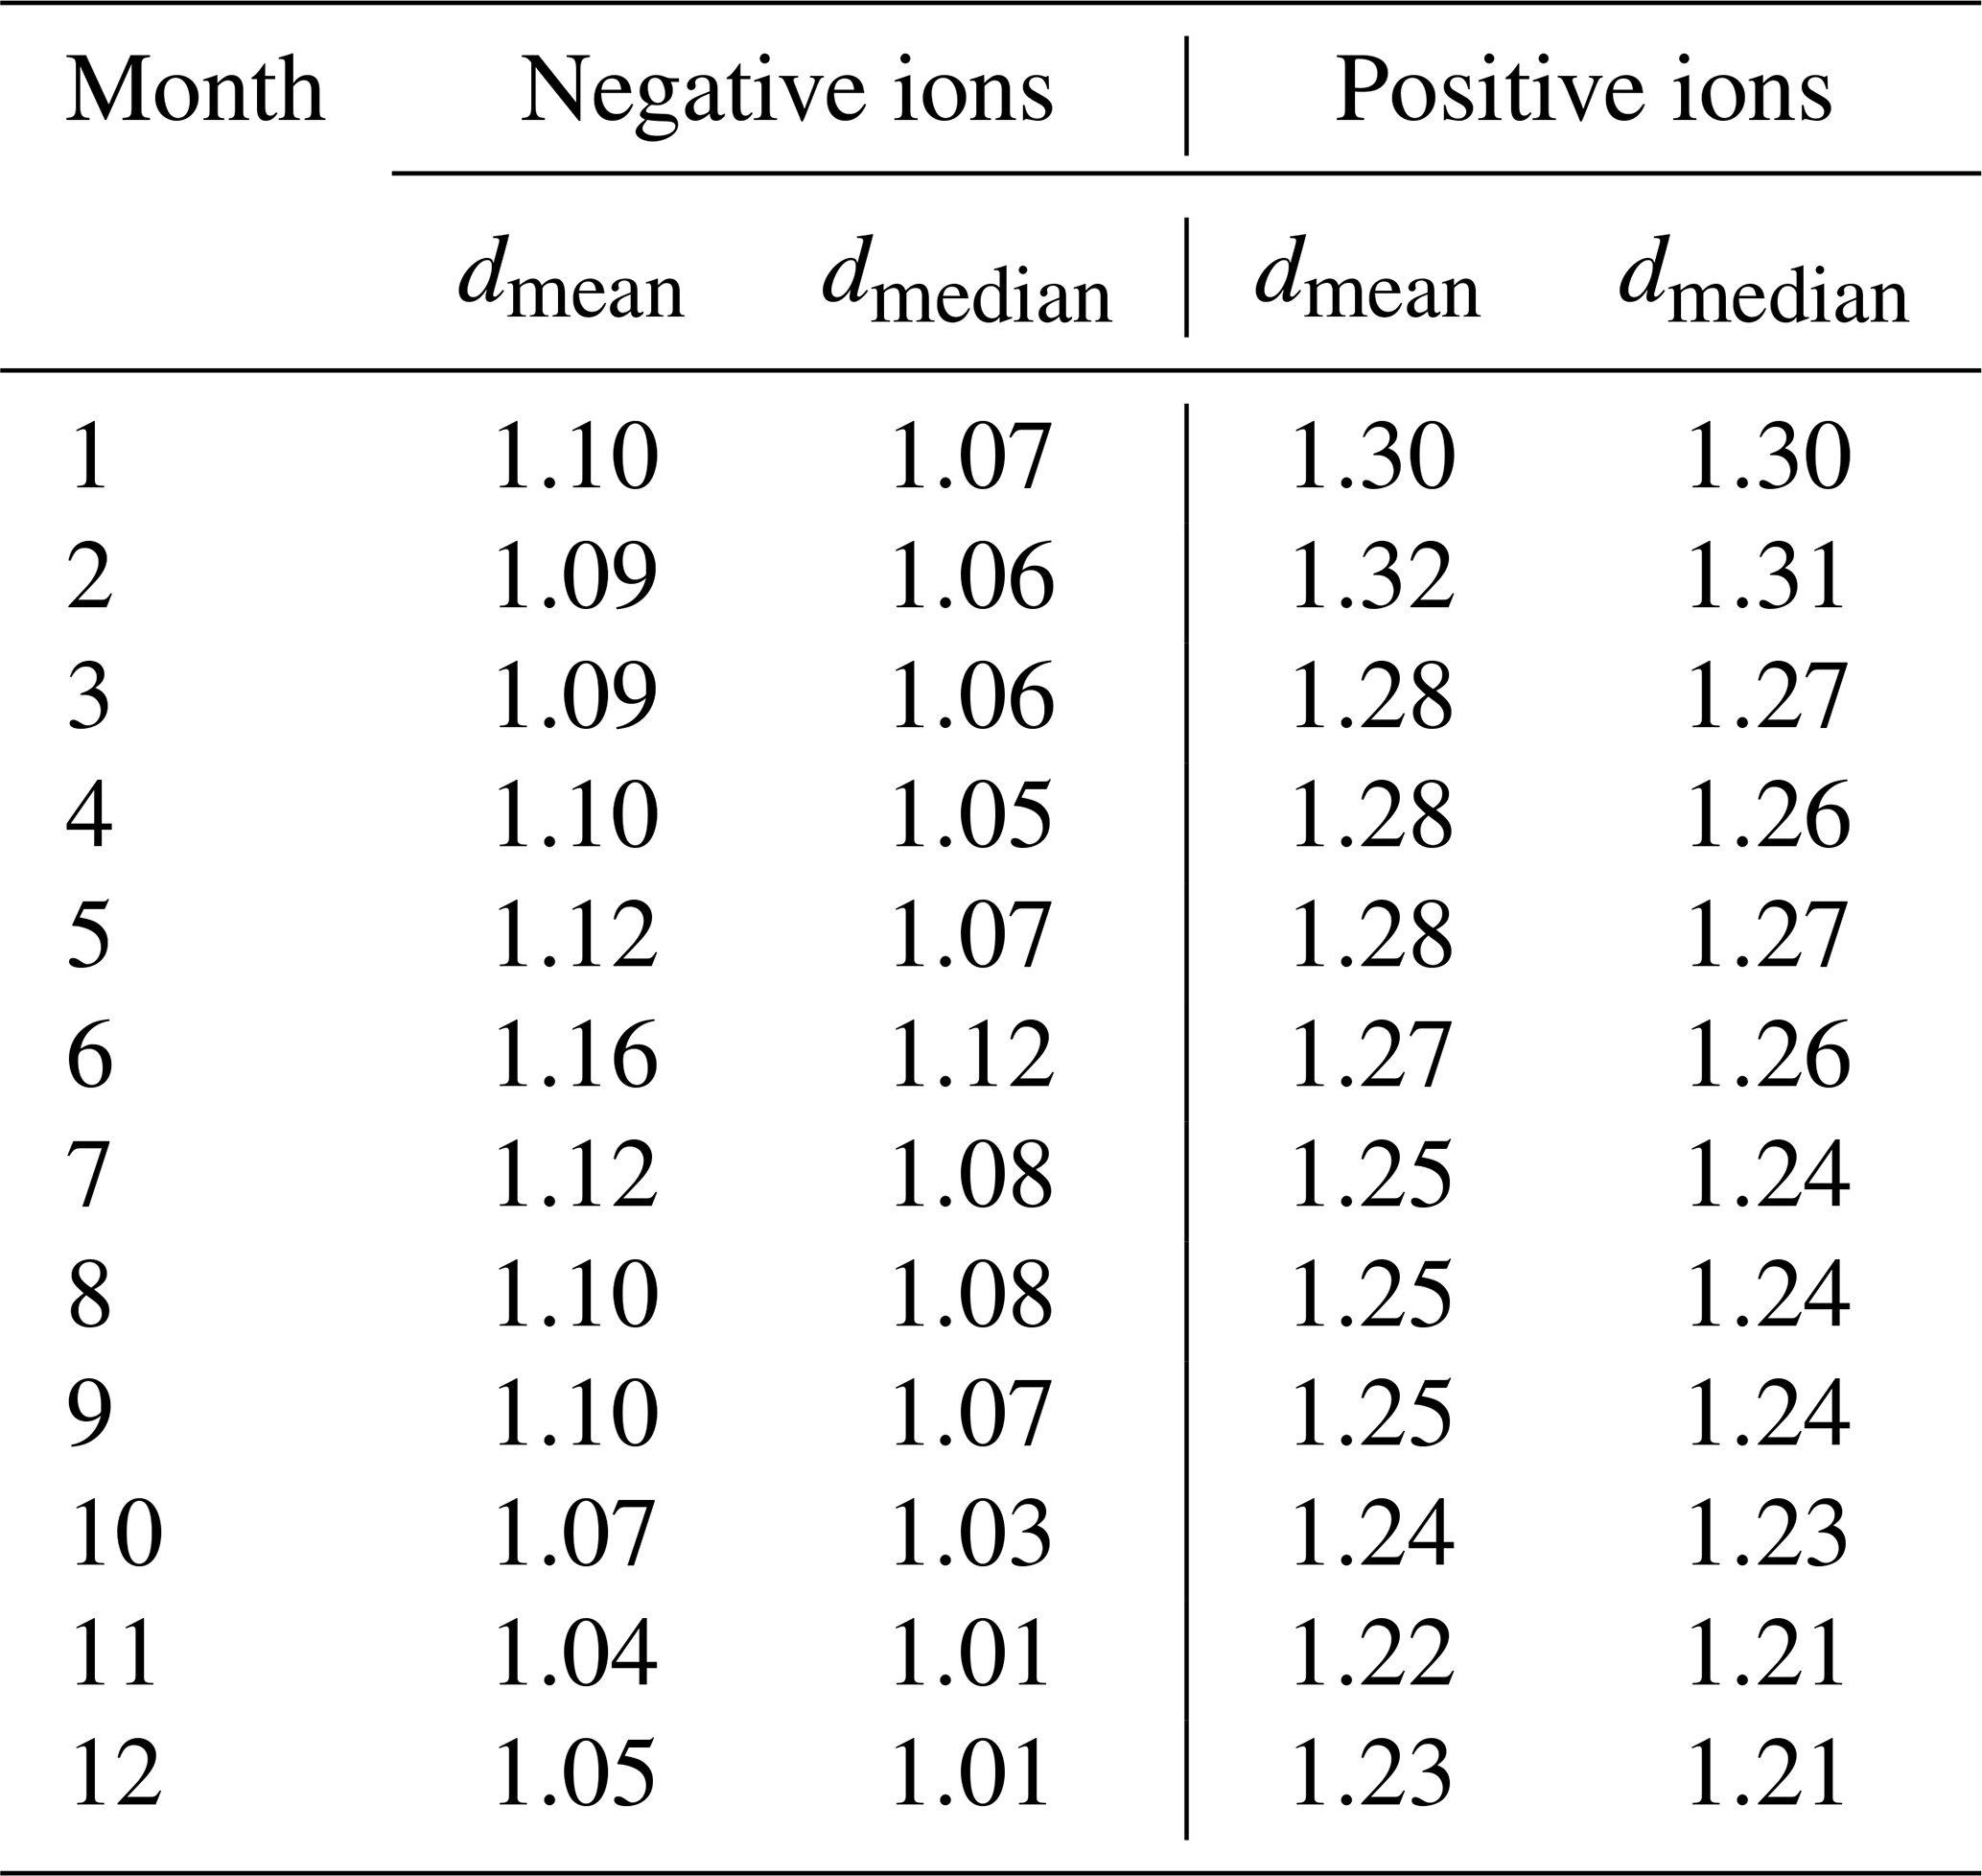
For positive small ions in Beijing (Fig. 2d), the concentrations of both the smallest and the largest ions in the 0.8 to 2.0 nm range are both considerably lower from January to March compared to the later months. Otherwise, it is hard to identify a clear seasonal pattern. The largest positive average diameter is during February (dmean = 1.32 nm, and dmedian = 1.31 nm), while the smallest values are in November, (dmean = 1.22 nm and dmedian = 1.21 nm).
Compared to Hyytiälä, the seasonal trends in Beijing are not as clear or strong, which implies that the factors controlling the small ion size distribution are less seasonal in Beijing than in Hyytiälä, where the small ion size distribution shows a strong seasonal variation. However, we note that because there are less data from Beijing compared to Hyytiälä, variation between years can have a larger impact on the results than in Hyytiälä.
3.2 Potential impact of low-volatility vapors to small ion size distribution in Hyytiälä
3.2.1 Highly oxidized organic molecules (HOMs)
Figure 3 shows the median ion number size distributions between 0.8 and 2.0 nm in Hyytiälä with respect to varying neutral highly oxidized organic molecule (HOM) concentration. HOM monomers, HOM dimers, and total HOM are considered separately. Results for daytime (10:00–16:00) and evening (18:00–00:00) are both presented (Fig. 3a and b, respectively). The HOM concentrations are divided into percentiles.
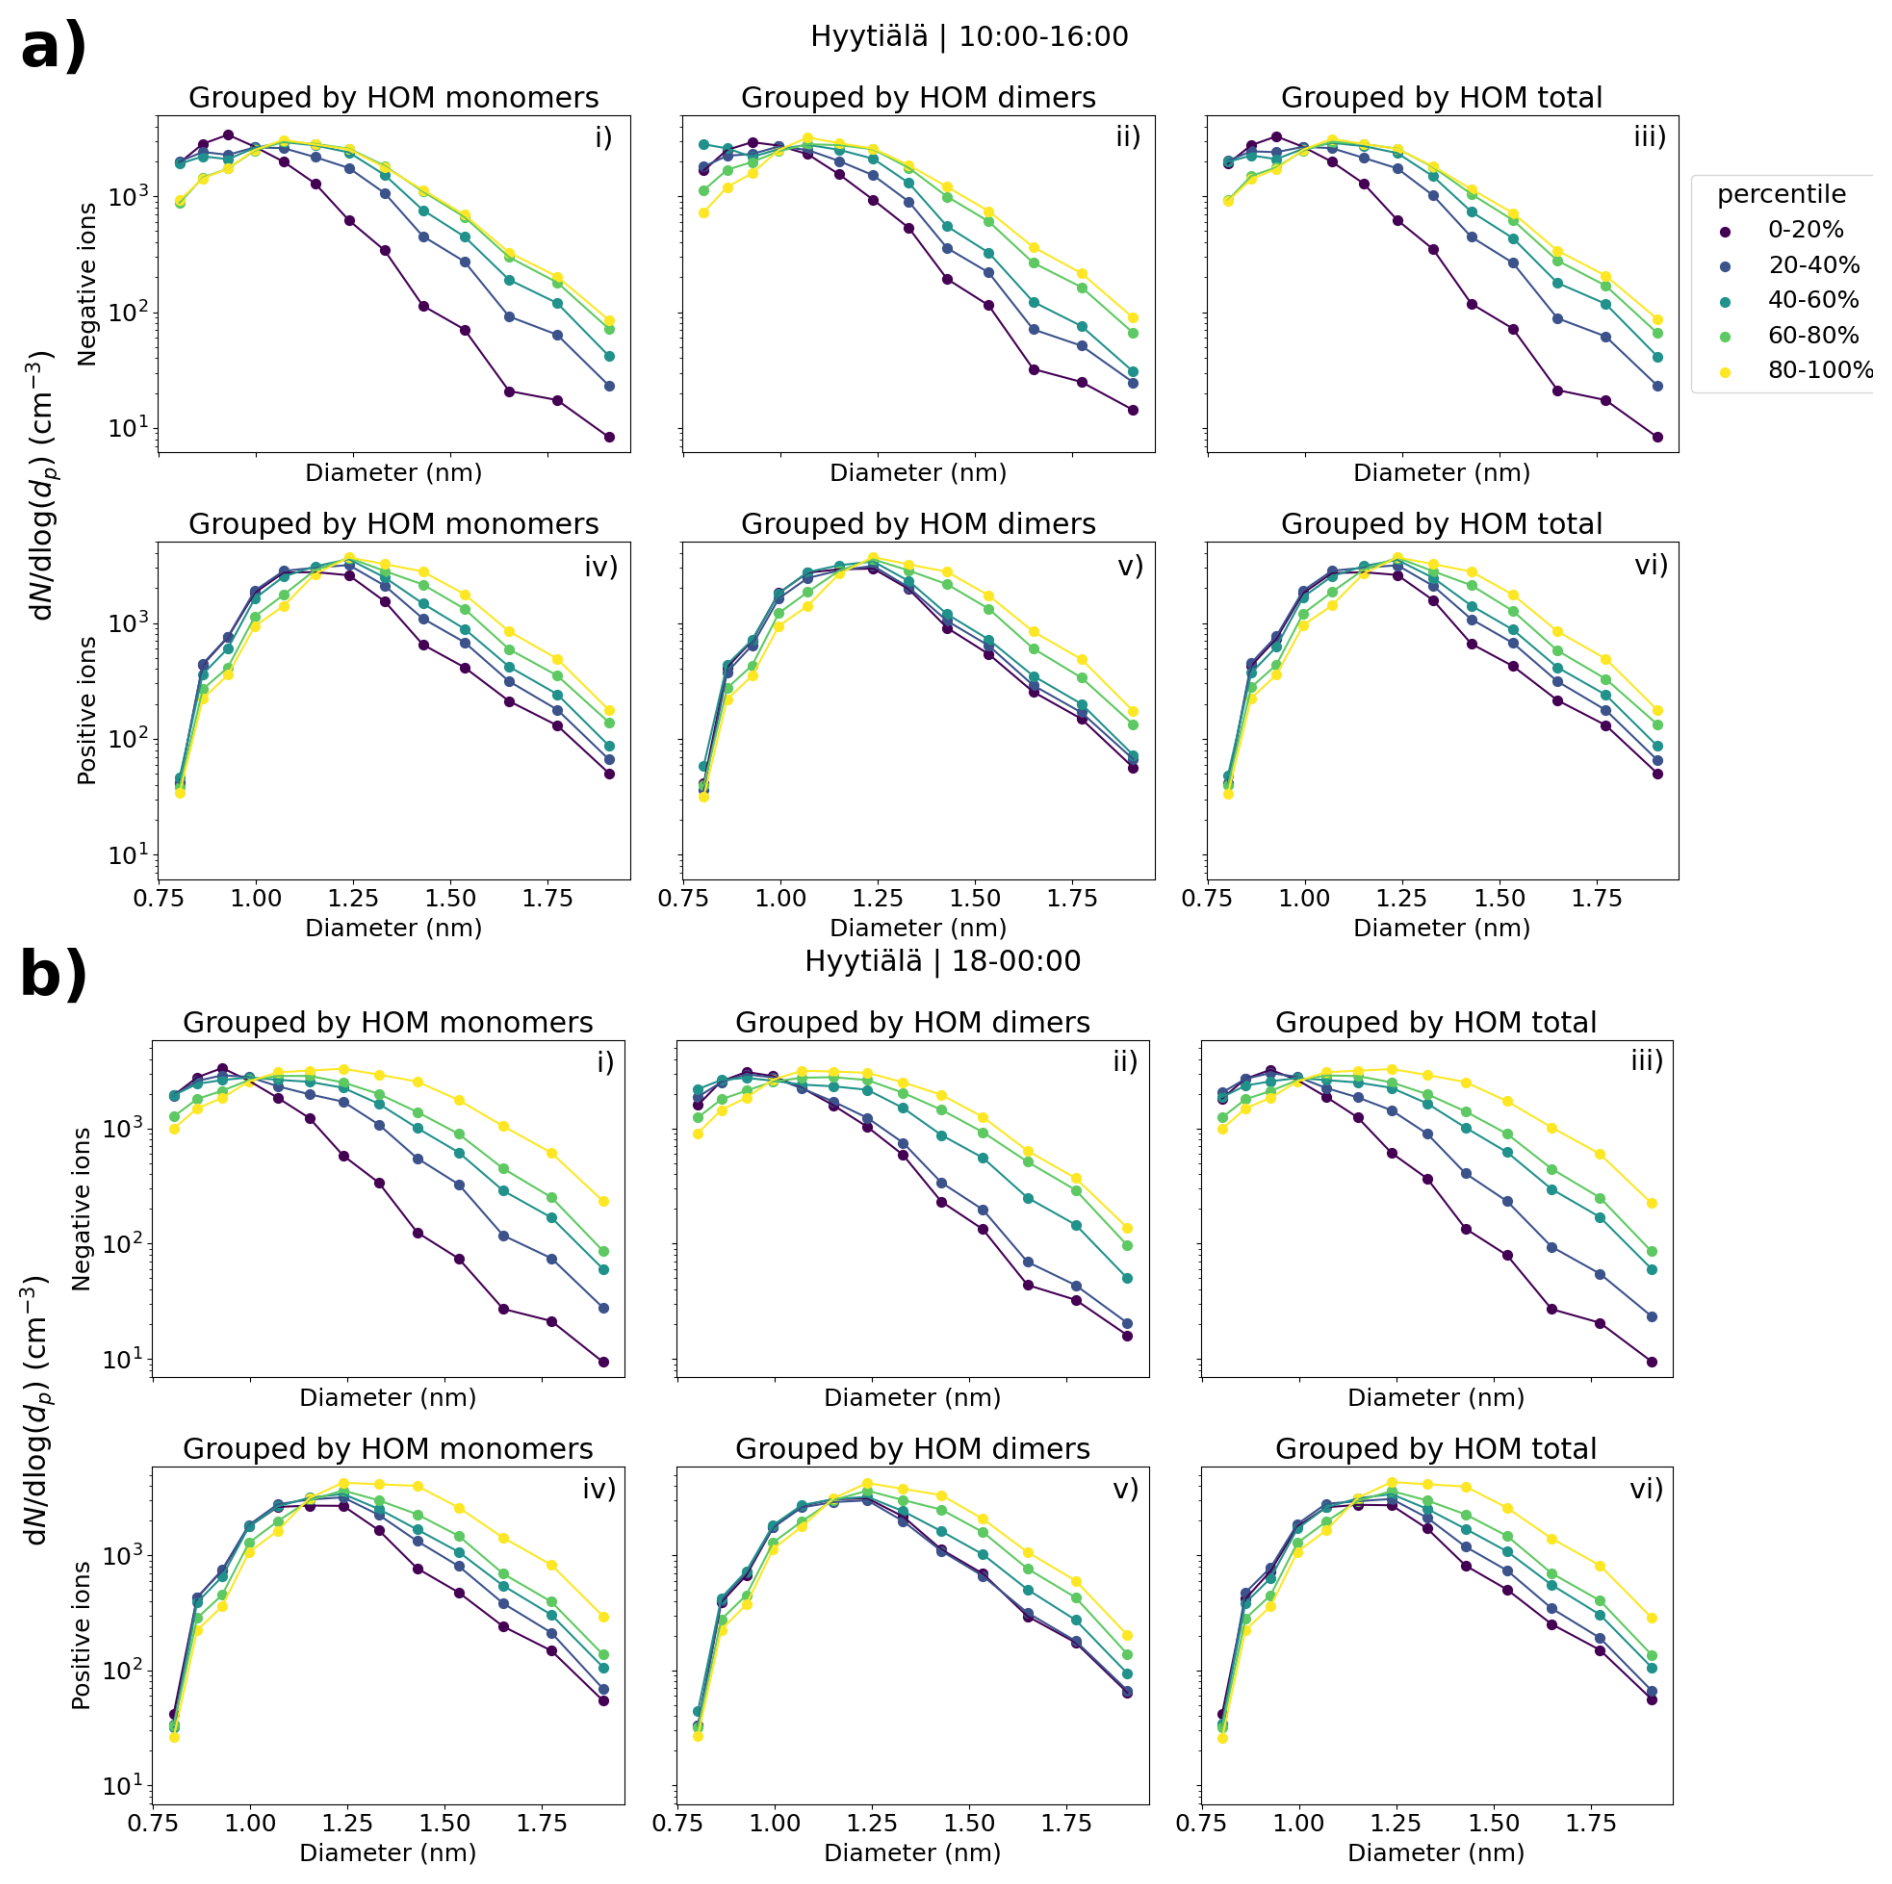
Figure 3The median negative (i–iii) and positive (iv–vi) small ion (sub-2 nm) size distributions in Hyytiälä, Finland, grouped by the percentiles of neutral HOM monomer (i, iv), HOM dimer (ii, v), and total HOM (iii, vi) concentrations. Both the evening (18:00–00:00) size distributions (b) and daytime (10:00–16:00) size distributions (a) are shown. Daytime percentiles for HOM monomers, dimers, and total are 20 %: 4.30 × 10⁶, 5.93 × 10⁵, and 5.10 × 106 cm−3; 40 %: 1.34 × 10⁷, 1.45 × 10⁶, and 1.50 × 107 cm−3; 60 %: 4.00 × 10⁷, 2.44 × 10⁶, and 4.18 × 107 cm−3; 80 %: 9.70 × 10⁷, 7.62 × 10⁶, and 1.05 × 108 cm−3, respectively. Evening percentiles for HOM monomers, dimers, and total are 20 %: 3.00 × 10⁶, 4.94 × 10⁵, and 3.75 × 106 cm−3; 40 %: 8.40 × 10⁶, 1.50 × 10⁶, and 1.03 × 107 cm−3; 60 %: 3.17 × 10⁷, 2.95 × 10⁶, and 3.65 × 107 cm−3; 80 %: 7.52 × 10⁷, 7.70 × 10⁶, and 8.46 × 107 cm−3, respectively.
A clear increase in the number of negative ions (Fig. 3a, i–iii, Fig. 3b, i–iii) above approx. 1.05 nm, and for positive ions (Fig. 3a, iv–vi, Fig. 3b, iv–vi) slightly larger than that, is seen with an increasing HOM concentration for all three HOM categories. The differences are the largest for HOM monomers (i, iv) and HOM total (iii, vi), which is mainly dominated by the HOM monomers. The differences are also stronger for negative ions than positive ions, and are stronger during the evening (Fig. 3b) compared to the daytime (Fig. 3a).
Comparing the negative ion size distributions between the HOM percentiles of 0 %–20 % and 80 %–100 %, we see that the difference in the concentrations increases with an increasing diameter; close to 2.0 nm, this difference is approximately 1 order of magnitude during the daytime (Fig. 3a, i–iii) and a bit more during the evening (Fig. 3b, i–iii). Comparing the similar negative ion concentrations when HOM monomer concentration during the evening is in the 80 %–100 % percentile compared to 0 %–20 %, there is an approx. 0.5 nm shift in the diameters (Fig. 3b, i), which is a big difference for the sub-2 nm ion population.
In line with the large differences in the small ion size distributions in Fig. 3 with respect to HOM concentration, a strong correlation between the small ion dmean and the HOM concentrations was seen (Fig. 4). The Spearman correlation coefficients (rs) between dmean and HOMs were 0.6 or above, for both daytime and evening. For daytime, the best correlation was between dmean of positive ions and HOM monomer concentration: rs = 0.74 (Fig. 4e). During nighttime, the strongest correlation was between dmean of negative ions and HOM monomer concentration: rs = 0.73 (Fig. 4c).
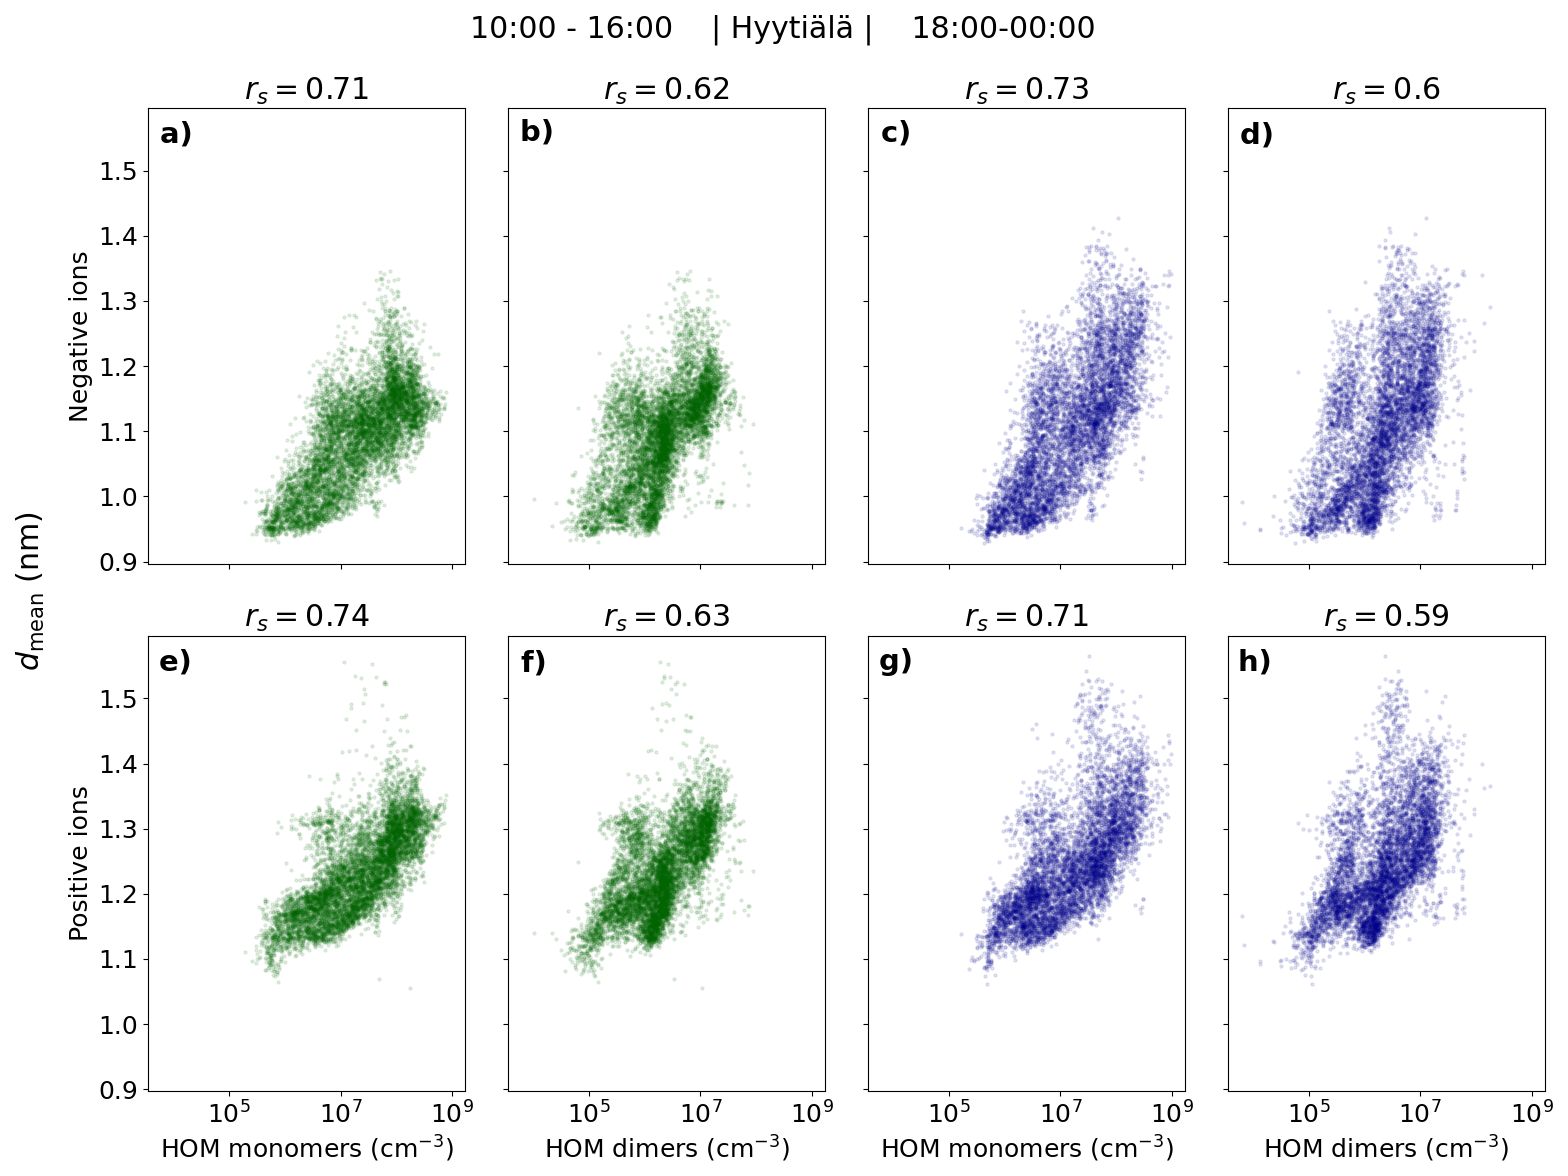
Figure 4Mean diameter (dmean) of negative (a–d) and positive (e–h) small (sub-2 nm) ions as a function of HOM (monomer, dimer, and total) concentration in Hyytiälä. The individual points are hourly medians, and the daytime (10:00–16:00, marked in green) and evening (18:00–00:00, marked in dark-blue) are shown separately. Spearman correlation coefficients (rs) are shown.
The clear correlation between HOMs and the small ion size distribution in Hyytiälä suggests a strong impact of organic compounds to the small ion population. This interpretation, as opposed to the correlation being due to a correlation with another variable, such sulfuric acid concentration is supported by the observation of the correlation being stronger during the evening when the concentrations of other precursors such as sulfuric acid are lower and organic ion-cluster formation is known to take place in Hyytiälä (Mazon et al., 2016; Rose et al., 2018). We note that part of the increase in the diameters of the small ions when HOMs are abundant could be due to the large size of organic molecules when compared to sulfuric acid molecules. However, the clear increase in concentrations even close to 2.0 nm suggests that the impact is mainly due to the growth of small ions by the uptake of organic vapors.
While the concentrations of larger small ions of both polarities increase with increasing HOM percentile, the differences are larger for the negative ions (Fig. 3). This could be due to the uptake of organics being more effective for the negatively charged ions. However, the equally strong correlation between dmean of positive small ions and HOM concentrations does not support this interpretation. A possible explanation is the size difference between the negative and positive small ions: due to the larger diameter of positive small ions, it might be that the impact of the growth to the diameters of the positive ions is not as large. For a larger cluster (ion), more molecules are needed to increase the diameter equally than for a smaller one.
3.2.2 Sulfuric acid
Figure 5 shows the median daytime negative and positive small ion (0.8–2.0 nm) size distributions grouped by the percentiles of neutral sulfuric acid (SA) concentration (Fig. 5a and b). In addition, the daytime hourly mediandmean values are shown as a function of the SA concentration (Fig. 5c and d). We see a clear increase in the concentrations of negative (positive) small ions larger than approximately 1.05 (1.1) nm when comparing SA concentrations in the lower percentiles to the higher percentiles, until the behavior seems to stall so that the 60 %–80 % and 80 %–100 % percentiles show similar size distributions. From previous studies, we know that while sulfuric acid is often needed for the initial cluster formation, organic compounds tend to drive the cluster growth (e.g., Kulmala et al., 2013). This could explain the lack of differences in the size distributions between the 60 %–80 % and 80 %–100 % percentiles of the SA concentration.
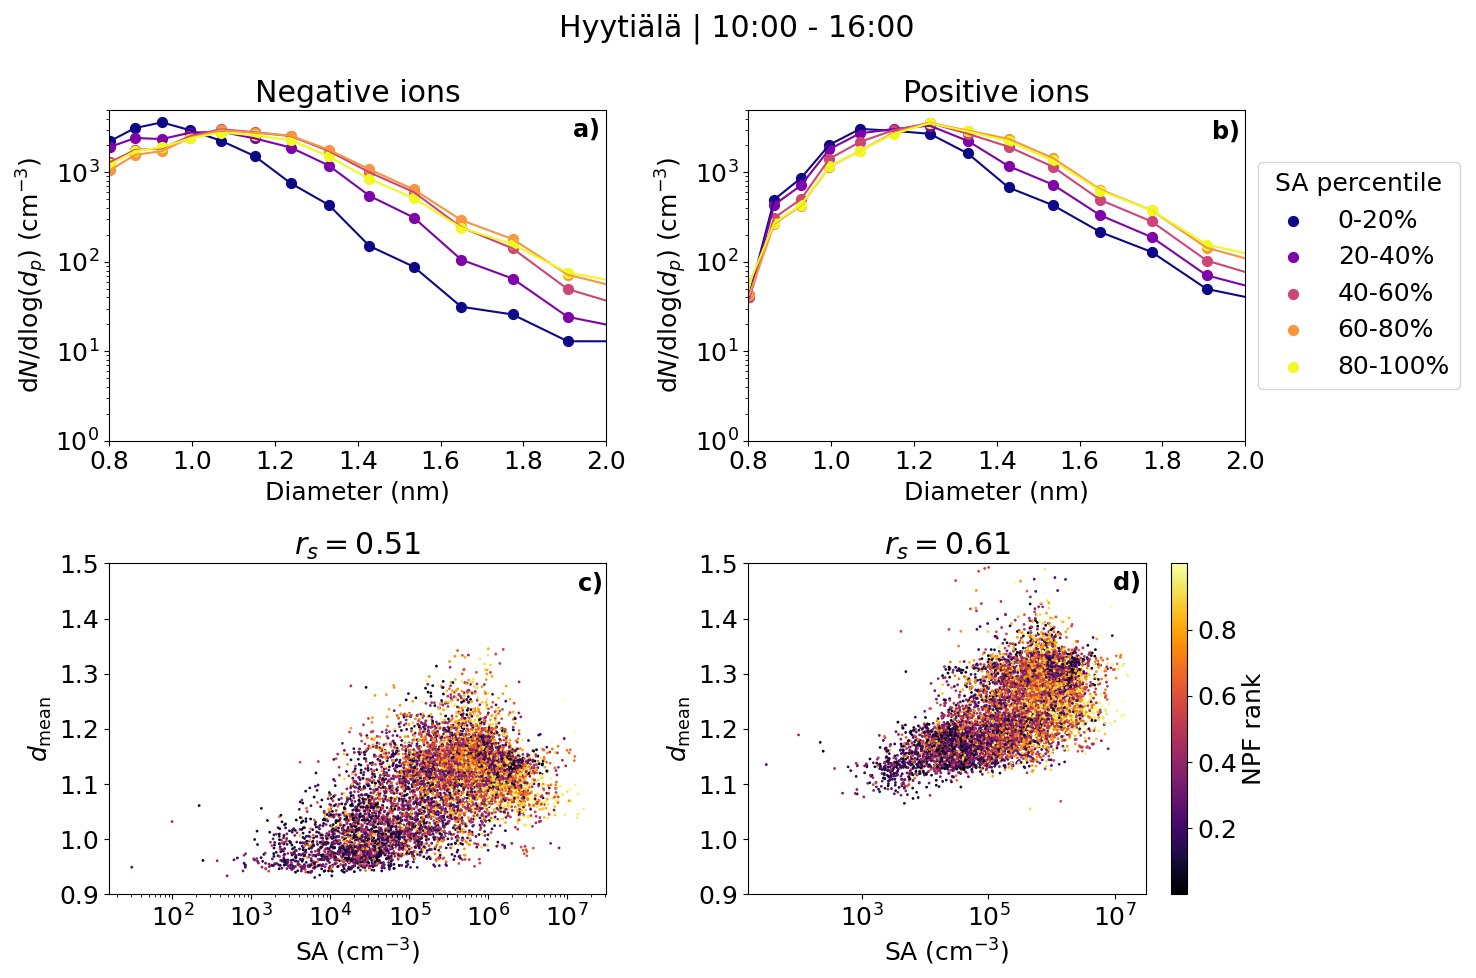
Figure 5The median number size distributions of small ions between 0.8 and 2.0 nm grouped by percentiles of neutral sulfuric acid concentration (a) negative and (b) positive ions, scatter plots, and Spearman correlation coefficients (rs) of hourly mean diameter of small ions (dmean) and sulfuric acid concentration (c) negative and (d) positive ions in Hyytiälä. In the scatter plot, the color indicates the respective NPF rank of the day. Only daytime (10:00–16:00) values are included. The percentile values for sulfuric acid are 20 %: 4.22 × 104 cm−3, 40 %: 1.79 × 105 cm−3, 60 %: 5.06 × 105 cm−3 and 80 %: 1.08 × 106 cm−3.
A good positive correlation was seen between dmean and SA concentration for both polarities: rs = 0.51 (0.61) for negative (positive) ions (Fig. 5c and d). The correlation is slightly weaker than what was observed between dmean and HOM concentrations. The majority of dmean values above 1.1 nm correspond to days with a high NPF ranking, while most values of dmean below 1.1 nm correspond to days with low NPF rank values below 0.5. Notably, for dmean of negative small ions above approx. 1.1 nm, the values of dmean do not seem to increase with an increasing SA concentration as clearly as they do with an increasing HOM concentration (Fig. 4). As discussed above, organic compounds might be needed to drive the growth of small ions further, and thus dependency of dmean on SA is not seen as clearly when dmean is above 1.1 nm.
3.3 Relationship of small ion size distribution with low-volatility vapors in Beijing
Figure 6a shows the number size distributions of small ions grouped by percentiles of neutral sulfuric acid, sulfuric acid dimer, and total oxidized organic molecule (OOM) concentration in Beijing. We can see that, especially compared to results already for Hyytiälä, the differences in the size distributions with respect to the different values of sulfuric acid or OOMs are small for both polarities. The concentration of negative ions below approx. 1.2 nm slightly decreases with increasing sulfuric acid (Fig. 6a, i) or sulfuric acid dimer (Fig. 6a, ii) concentration, while the concentrations above approx. 1.2 nm increase, indicating a weak but positive relationship between the sulfuric acid and the negative small ion growth. Close to 2.0 nm, where the increase is the highest, the concentration of negative ions is higher by around a factor of 2 when sulfuric acid concentration is in the 80 %–100 % percentile compared to when it is in the 0 %–20 % percentile (Fig. 6a, i). For both polarities, the concentrations below approx. 1.75 nm appear higher when the total OOM concentration is in the 80 %–100 % percentile compared to other times (Fig. 6a, iii, and vi). However, the concentrations close to 2.0 nm are not simultaneously higher, indicating that despite the increased concentration of the small ions, a larger number of them is not growing into intermediate ions.
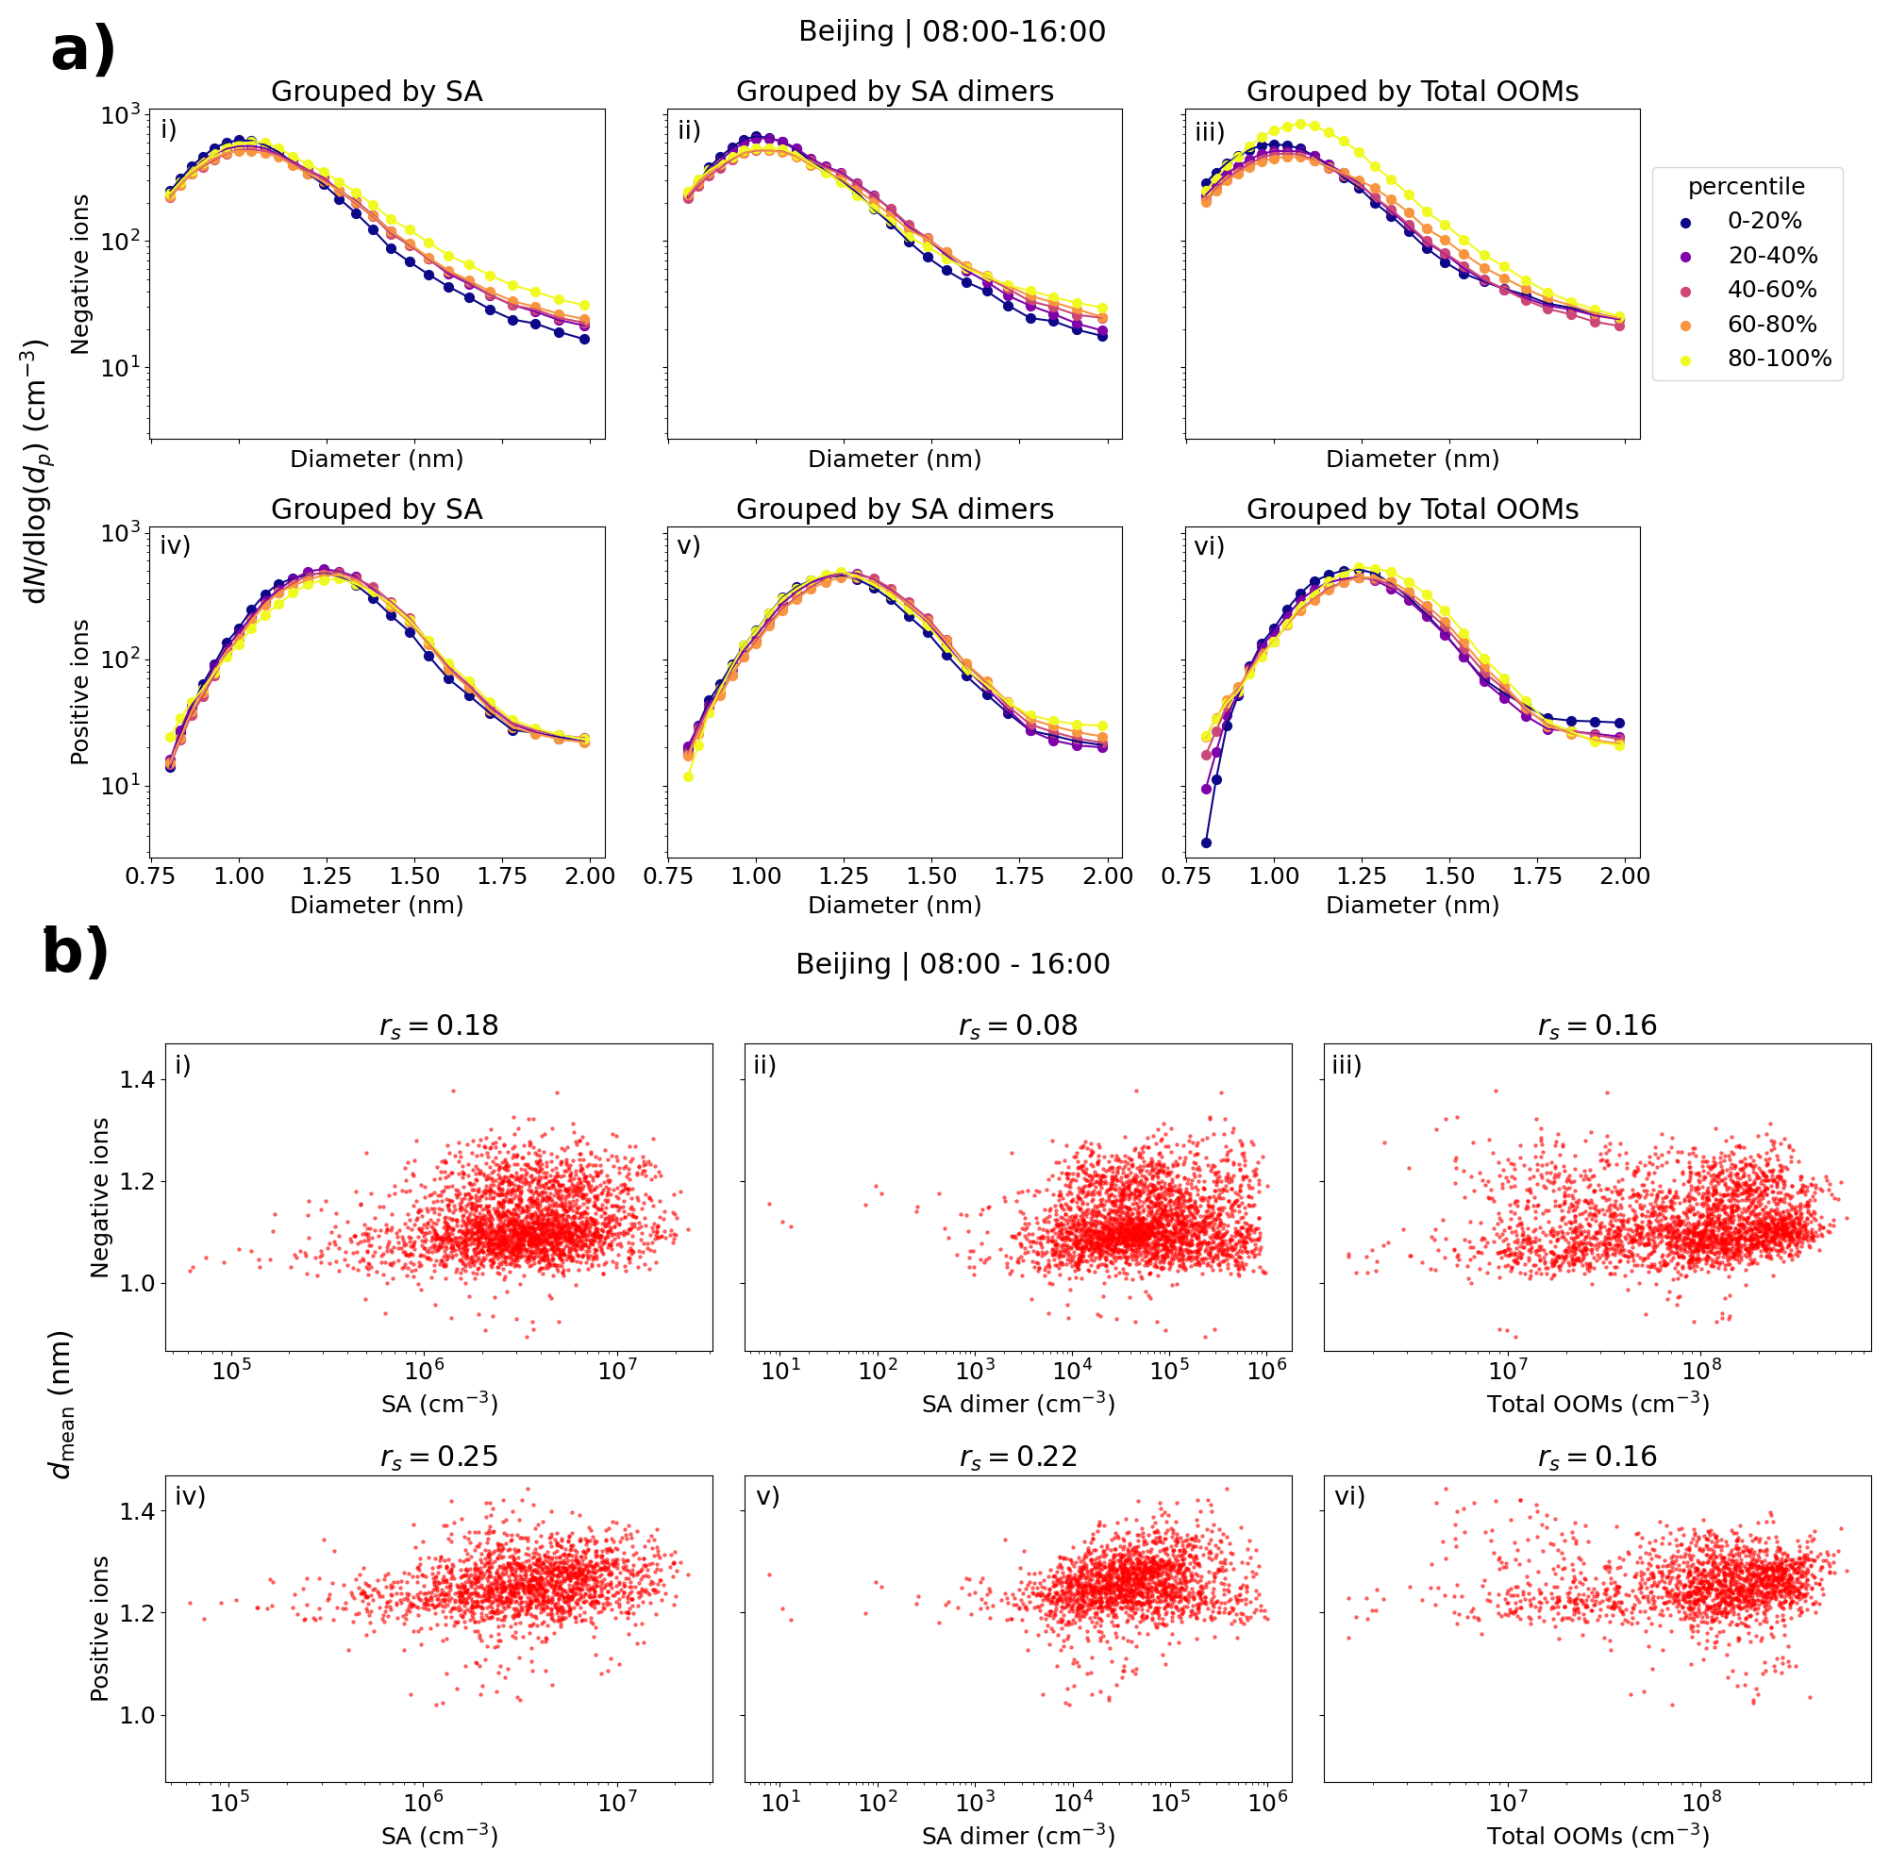
Figure 6(a) Small ion median daytime (08:00–16:00) number size distributions in Beijing, grouped by percentiles of sulfuric acid (SA), SA dimer, or total oxidized organic molecule (OOM) concentrations. (b) Hourly daytime mean diameter (dmean) of small ions versus SA, SA dimer, and total OOM concentrations. Panels (i)–(iii) are for negative polarity and panels (iv)–(vi) are for positive, and the figures with SA, SA dimer, and OOMs are in the respective order. Spearman correlation coefficients (rs) are included. The percentile limits of SA, SA dimer, and total OOM are 20 %: 1.64 × 10⁶, 1.26 × 10⁴, and 2.19 × 107 cm−3; 40 %: 2.53 × 10⁶, 3.11 × 10⁴, and 5.89 × 107 cm−3; 60 %: 3.66 × 10⁶, 6.01 × 10⁴ and 1.23 × 108 cm−3; and 80 %: 5.17 × 10⁶, 1.32 × 10⁵, and 2.15 × 108 cm−3.
Figure 6b shows the scatter plots of dmean and sulfuric acid, sulfuric acid dimer, and total OOM concentrations. A weak positive correlation is seen, and the Spearman correlation coefficients (rs) are between 0.08 and 0.25. The differences in the values of dmean are small. The relationship between the small ion size distribution or dmean, and the low-volatility vapor concentrations in Beijing appears weaker compared to Hyytiälä.
3.4 Impact of coagulation scavenging on the small ion size distribution
Figure 7 shows the median small ion number size distributions in Hyytiälä and Beijing corresponding to the respective percentile values of condensation sink (CS). We see that the changes in the small ion size distribution with respect to changing CS are relatively small. In Hyytiälä (Fig. 7a, b), the concentration of small ions, especially that of the smallest in diameter, decreases slightly with an increasing CS. The sink is relatively low in Hyytiälä, and therefore this result is not unexpected.
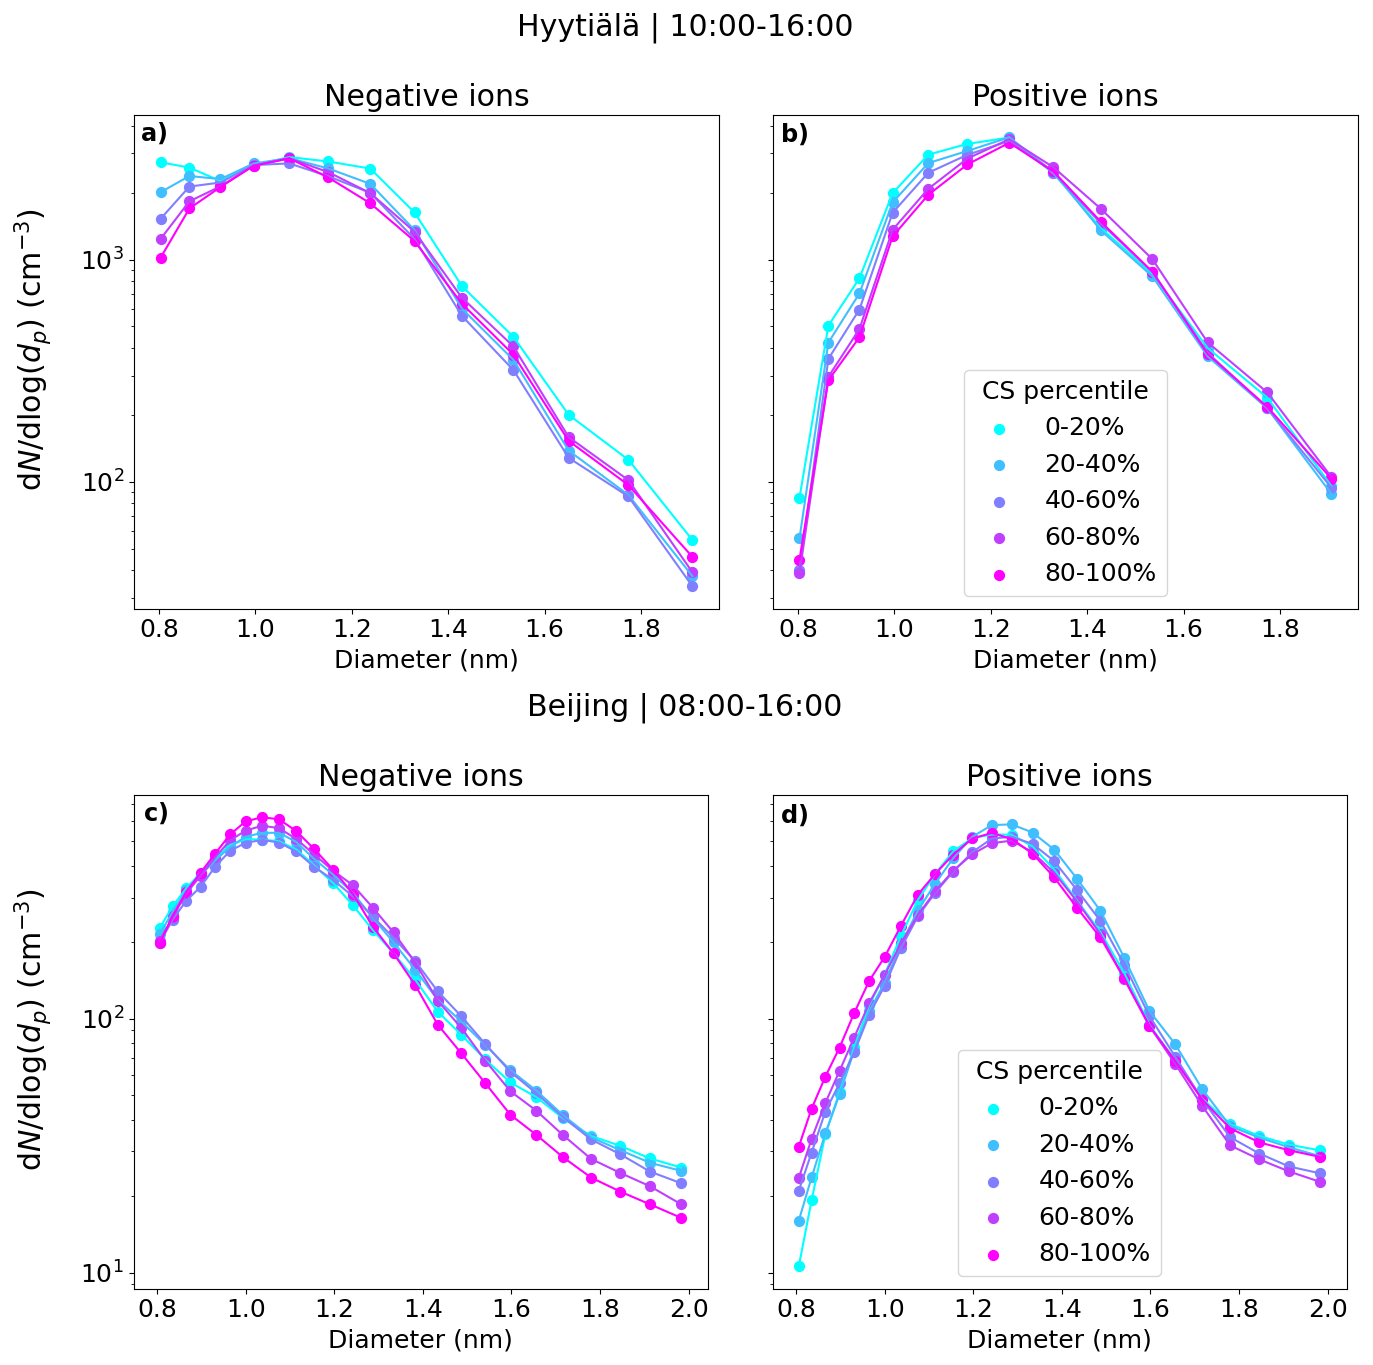
Figure 7The median small ion size distributions grouped by the respective percentile of the condensation sink (CS) values for Hyytiälä (a, b) and Beijing (c, d). The percentile value limits for CS for Hyytiälä are 1.3 × 10⁻³, 2.3 × 10⁻³, 3.5 × 10⁻³, and 5.5 × 10⁻³ s−1. For Beijing, the percentile value limits for CS are 9.3 × 10⁻³, 1.9 × 10⁻², 3.1 × 10⁻², and 4.5 × 10⁻² s−1.
Based on Fig. A1, which shows the approximate values of the different terms in Eq. (2), we would expect CoagS to have a much stronger impact on the small ion dynamics in Beijing than in Hyytiälä. The impact should be most clear for the smallest diameters. Surprisingly, this was not observed. Figure 7c shows that in Beijing, the negative small ion size distribution below approx. 1.3 nm stays unchanged and the concentrations above decrease with an increasing CS. The larger positive small ion concentrations (Fig. 7d) also seem to slightly decrease with increasing sink, while the concentrations of the small ions close to 0.8 nm actually increase. Figure A2a also shows that the total sub-2 nm concentration barely changes with a changing CS. These results suggest that there could be a source of unknown nature for small ion-cluster formation that is higher when CS is high, which would compensate for the increased coagulation scavenging of the ions.
Figure A2d–f show the concentrations of the different low-volatility vapors as a function of CS. We see that the concentration of sulfuric acid (Fig. A2d) and sulfuric acid dimers (Fig. A2e) decreases with an increasing sink, as expected. However, the concentration of OOMs (Fig. A2f) increases with an increasing sink. While this is purely speculation, if organic compounds are forming small ion clusters when the sink is higher, the weak apparent impact of CS on the small ion size distribution could be explained. An alternative potential explanation could be if there is a positive correlation between CS and the concentration of bases, which stabilizes the small clusters. Regardless, the impact of CS on the statistics of the small ion size distribution in Beijing appears to be very small.
3.5 Correlation of small ion size distribution with sulfuric acid clusters and NPF in Hyytiälä
Figure 8a shows the median number size distribution of negative small ions grouped by the percentiles of the signals of SA ion clusters HSO (monomer), H2SO4 × HSO (dimer), and (H2SO4)2 × HSO (trimer), and their ratios in Hyytiälä. The median distributions are determined from daytime (10:00–16:00) values. We observe a clear increase in the number of small ions with diameters above approx. 1.2 nm, with an increased signal of SA ion monomers (Fig. 8a, i) and dimers (Fig. 8a, ii). The increase is especially clear for dimers and the dimer to monomer ratio (Fig. 8a, iv). The concentration of small ions close 2.0 nm, where the differences are highest, is an order of magnitude higher when the dimer signal is in the 80 %–100 % percentile compared to when the signal is in the 0 %–20 % percentile. These results show that the dimer signal is a strong indicator for both the cluster formation and the growth of clusters to larger sizes in Hyytiälä.
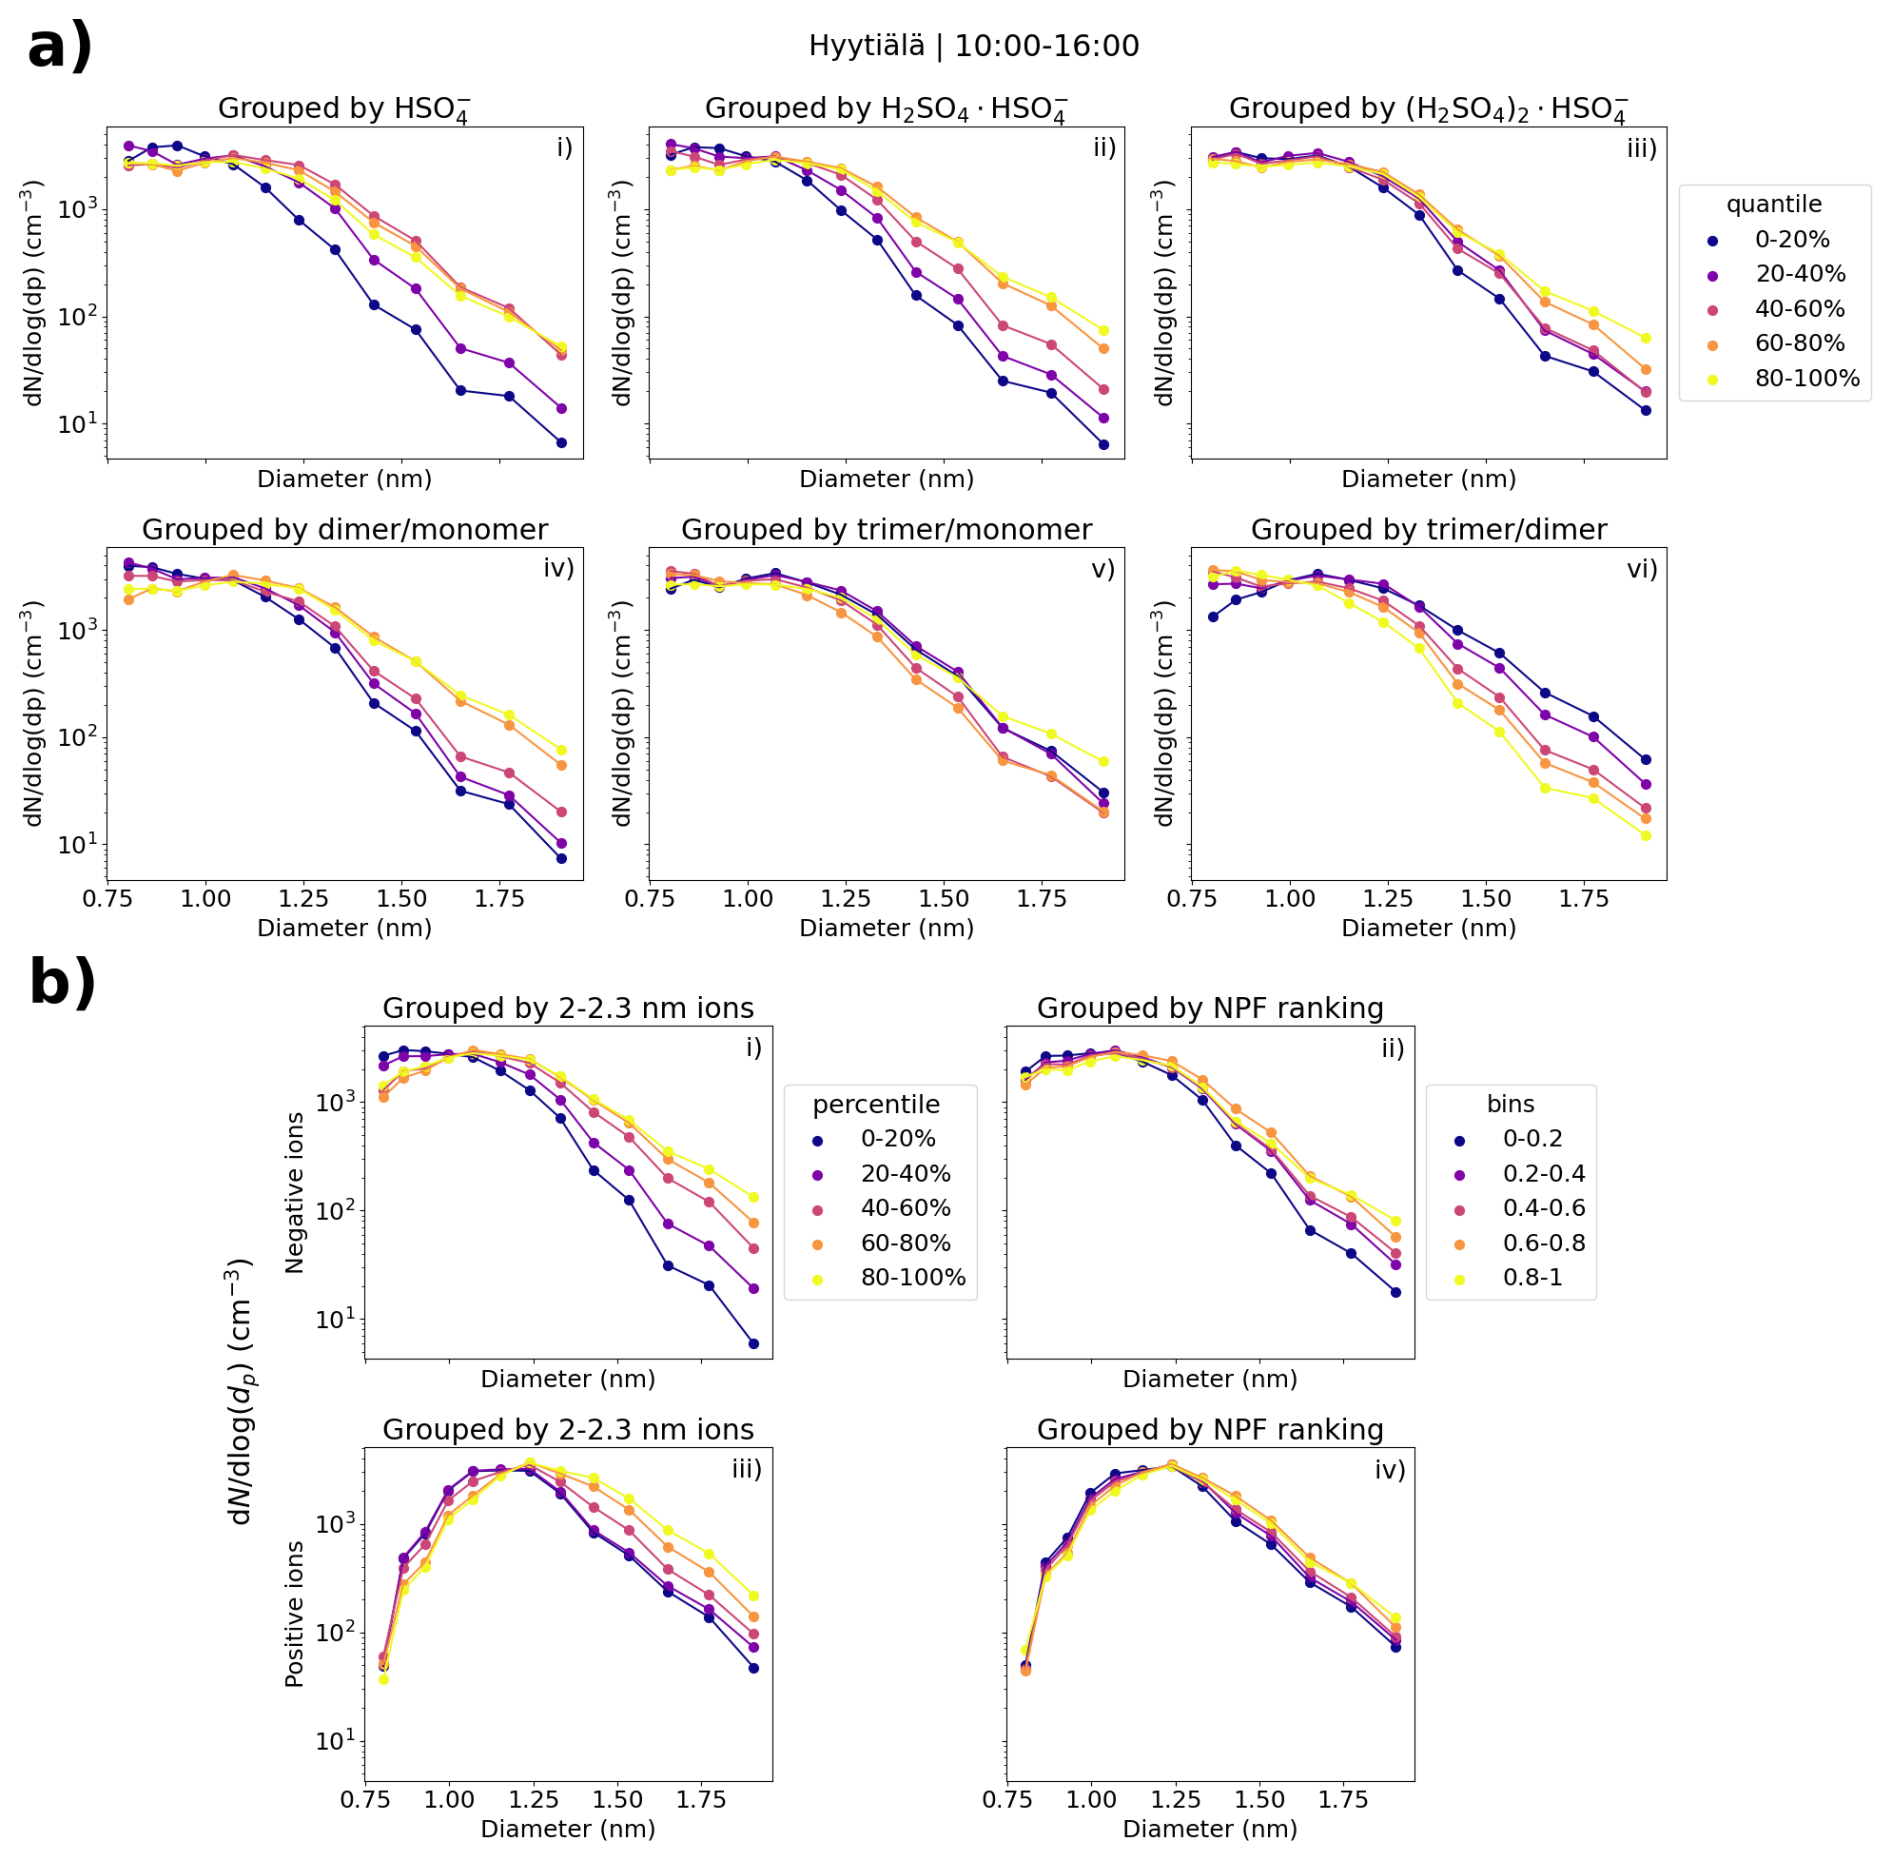
Figure 8(a) Hyytiälä daytime median negative small ion number size distributions grouped by percentile of the signals of HSO, H2SO4 × HSO, or (H2SO4)2 × HSO ions (i, ii, iii, respectively), and their ratios (iv–vi). (b) Daytime median small ion size distributions for both polarities grouped by the percentile of 2.0–2.3 nm ion concentrations (i, iii) of the respective polarity or by NPF ranking (ii, iv). The percentile limits for negative (positive) 2.0–2.3 nm ion concentrations are 20 %: 0.48 (1.75) cm−3, 40 %: 1.01 (2.34) cm−3, 60 %: 1.94 (3.49) cm−3, and 80 %: 3.39 (5.35) cm−3.
We used the 2.0–2.3 nm ion concentrations and NPF ranking (Aliaga et al., 2023) as proxies for conditions that were favorable for cluster formation and growth. Figure 8b shows the median daytime (10:00–16:00) size distributions for both polarities with respect to the percentiles of 2.0–2.3 nm ion concentrations and bins of NPF ranking in Hyytiälä. When the 2.0–2.3 nm ion concentration is higher, a clear increase in concentrations is seen above approx. 1.2 nm (Fig. 8b, i and iii). The difference in negative small ion concentrations close to 2.0 nm between 80 %–100 % and 0 %–20 % is over 1 order of magnitude (Fig. 8b, i). The small ion size distribution for both polarities shows this growth of small ions up to 2.0 nm, when local-scale intermediate ion formation is taking place.
Similar observations can be made from the small ion size distributions with respect to the different NPF ranking values. However, the differences are smaller than with respect to 2.0–2.3 nm ions, and especially for positive small ions, such differences are very small (Fig. 8b, iv). There is likely a combination of factors at play here. First of all, NPF ranking was determined for total particles between 2.5 and 5 nm, and there might be differences stemming both from the ranking being less sensitive for local NPF and for 2.0–2.3 nm ion concentrations being more sensitive for ion-induced clustering or NPF. In addition, differences between what is observed in the total particles versus ions can be caused by a variation in the chemical compounds, which take up the available charges (Bianchi et al., 2017).
We note that the differences in the number size distribution of positive small ions are once again smaller than for negative small ions. Similarly to Sect. 3.2.1, we hypothesize that this is due to the size difference between the polarities.
Figure 9 shows the scatter plot of hourly daytime negative (a) and positive (c) small ion dmean and the concentration of 2.0–2.3 nm ions. As expected, a strong positive trend is seen between dmean and 2.0–2.3 nm ion concentrations. The correlation coefficient is rs = 0.54 (0.67) for negative (positive) ions. Figure 9 also shows the box plots of dmean with NPF ranking, with negative small ions in panel (b) and positive in panel (d). The median of dmean increases with increasing NPF ranking, as expected. However, the variance for lower rankings is much higher, resulting overall in quite a low correlation between dmean and NPF ranking, with 35 rs = 0.22 (0.26) for negative (positive small) ions.
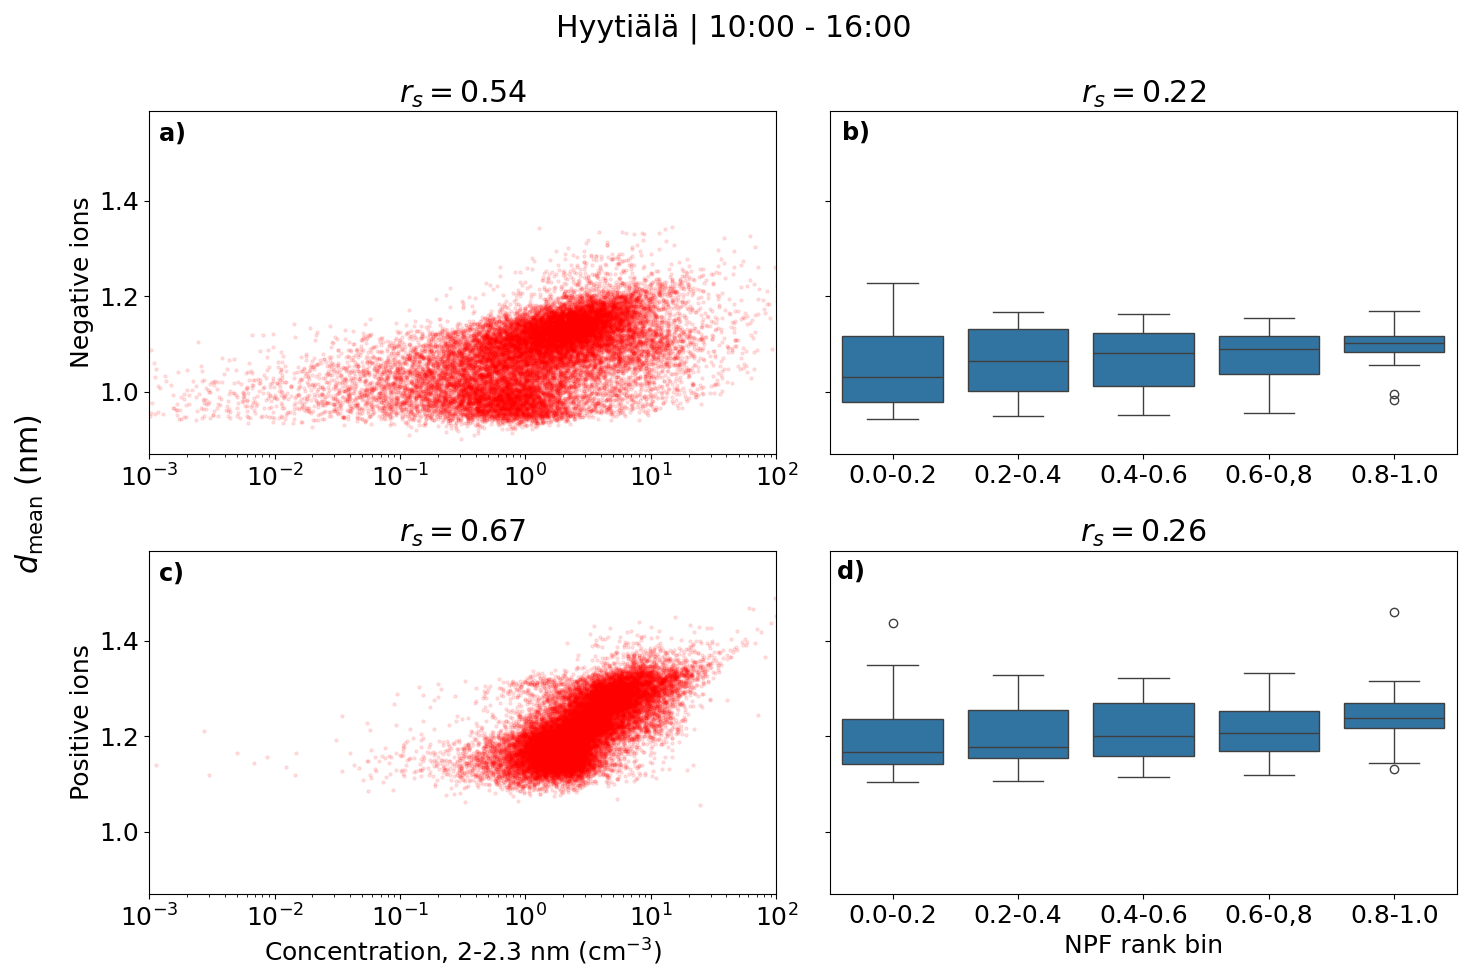
Figure 9Hourly daytime negative (a, b) and positive (c, d) small ion diameter versus a concentration of 2.0–2.3 nm ions of respective polarity (a, c) or NPF ranking (b, c) in Hyytiälä. Correlation coefficients (rs) are also shown. The middle line of the box plots for dmean and NPF rank are the median values, while the boxes show the 25 % and 75 % percentiles, and the lines are the 10 % and 90 % percentiles.
3.6 Impact of NPF on small ion distribution in Beijing
Figure 10a shows the small ion size distributions with respect to the concentration of 2.0–2.3 nm ions (i, ii) or NPF ranking (iii, iv) in Beijing. Negative ions are in panels (i)–(ii) and positive in panels (iii)–(iv). For both polarities, clear differences are seen in the distributions, depending on the percentile of the 2.0–2.3 nm ion concentration. When the 2.0–2.3 nm ion concentrations are higher, the concentration of negative (positive) small ions above approx. 1.0 (1.3) nm is increased. The differences are largest close to 2.0 nm. Comparing the 0 %–20 % and 80 %–100 % percentiles, the difference in the concentrations is around 1 order of magnitude when the diameter is approaching 2.0 nm, comparable to what was observed in Hyytiälä. Similar observations are seen with respect to NPF ranking, although to a lesser extent. For negative small ions (Fig. 10a, ii), the concentration at around 2.0 nm is four to five times higher when the NPF ranking is above 0.80 compared to when it is below 0.20. For positive ions, the concentration is less than two times higher (Fig. 10a, iv).
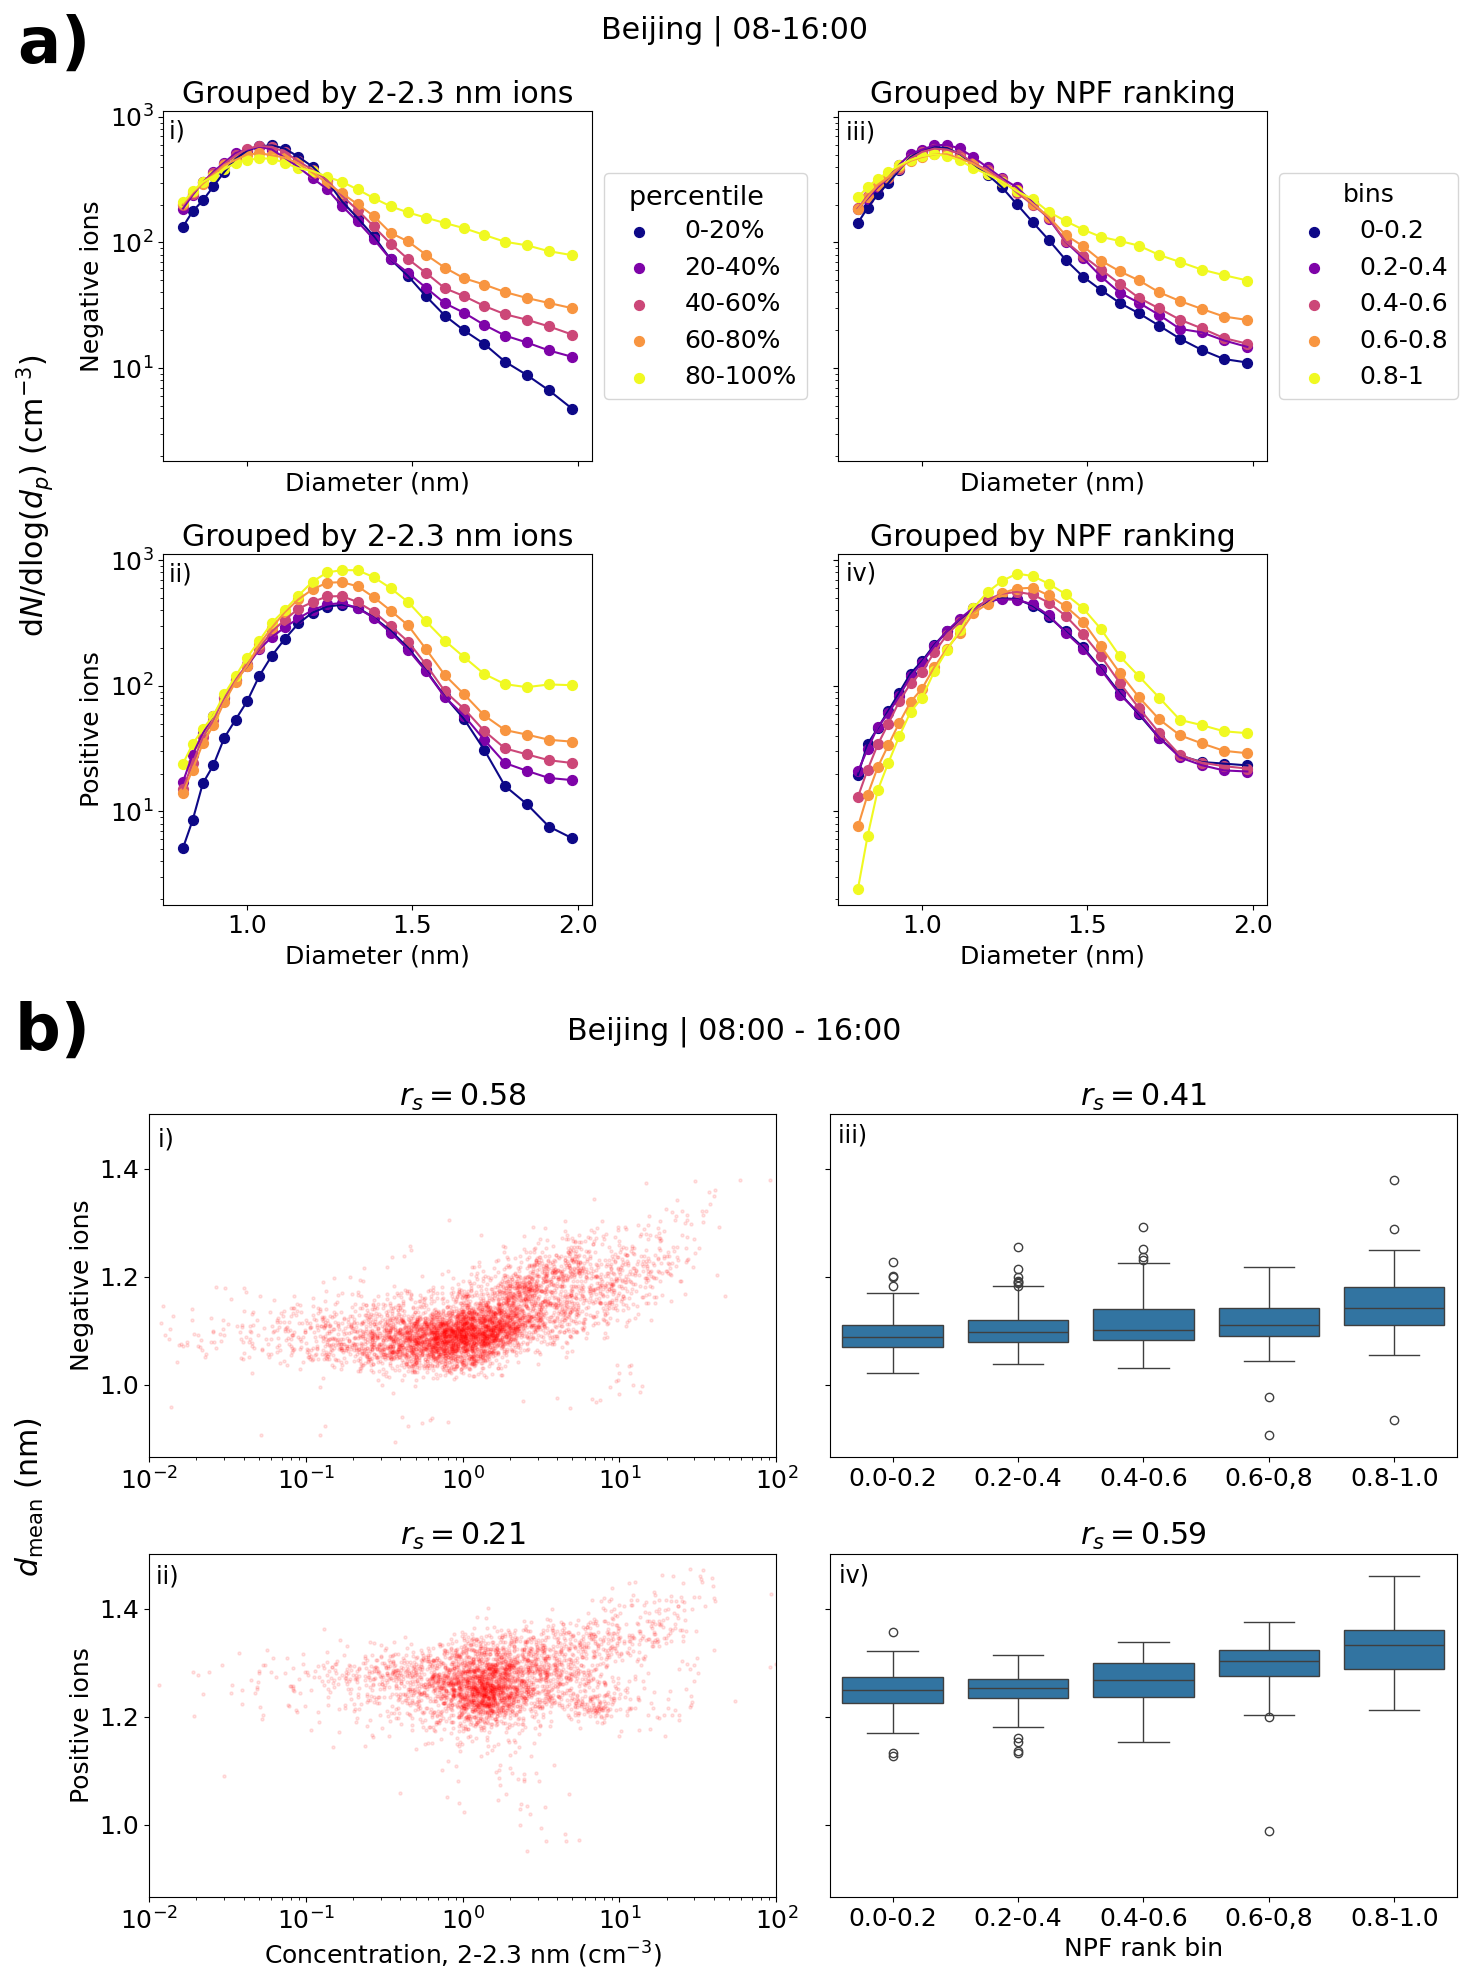
Figure 10(a) Median negative and positive small ion number size distributions in Beijing grouped by percentiles of 2.0–2.3 nm ion concentrations (b). Scatter plots of mean diameter and 2.0–2.3 nm ion concentrations (of respective polarity) or NPF ranking. Panels (i)–(ii) are for negative polarity and panels (iii)–(iv) for positive. Values are for daytime (08:00–16:00). The percentile limits of 2.0–2.3 nm concentration for negative (positive) ions are 20 %: 0.51 (0.85) cm−3, 40 %: 0.92 (1.27) cm−3, 60 %: 1.33 (1.72) cm−3, and 80 %: 2.47 (3.22) cm−3.
When looking at the small ion distributions in Beijing with respect to different 2.0–2.3 nm ion concentrations or NPF ranking, unlike for low-volatility vapor concentrations, we are able to see the growth of small ions to intermediate ions in the size distribution. These results show that the growth of small ions to larger diameters in Beijing is not limited by the availability of sulfuric acid or oxidized organic vapors, unlike in Hyytiälä. In addition, based on our analysis, it does not appear to be strongly limited by CS either. This is supported by the relatively weak correlation between CS and the NPF ranking or 2.0–2.3 nm ions (Fig. A2b, c). Therefore, we speculate that the small ion growth could be limited more by the availability of bases. However, due to the lack of long-term base concentration data, this question remains unanswered.
Figure 10b shows the scatter plots of dmean and 2.0–2.3 nm ion concentration, and the box plots of dmean and NPF ranking. The correlation coefficients for negative ions are as expected – rs = 0.58 and rs = 0.41 between dmean and 2.0–2.3 nm ion concentration or NPF ranking, respectively. For positive ions, the correlation coefficient between dmean and NPF ranking is rs = 0.59, while it is only 0.21 between dmean and 2.0–2.3 nm ion concentration. From Fig. 10a we see that the concentrations of positive small ions below 1.0 nm also increase to some extent with increasing 2.0–2.3 nm ion concentration, which likely impacts the values of dmean, resulting in a relatively poor overall correlation.
Notably, the differences in the size distributions with respect to NPF ranking are clearer, and the correlation between dmean and the ranking is stronger in Beijing than in Hyytiälä for both polarities. One of the explaining factors could be the fact that intense NPF in Beijing is more common than in Hyytiälä (e.g., Dada et al., 2017; Deng et al., 2020), impacting the statistics of the ranking. Another possibility is that local clustering events, where ions or particles grow close to 2.0 nm but not much further, could be more common in Hyytiälä.
3.7 Case studies
Next, some case studies on the development of negative small ion size distributions, and other investigated variables, are presented for Hyytiälä and Beijing. These cases show that we are able to observe the cluster growth, driven by daytime NPF or evening clustering, from the ion number size distributions of individual days and not only from the statistics of the size distributions. Based on the analysis presented in this study, the behavior of negative and positive small ion populations is mostly similar, and therefore, for simplicity, we have limited the analysis here to negative polarity.
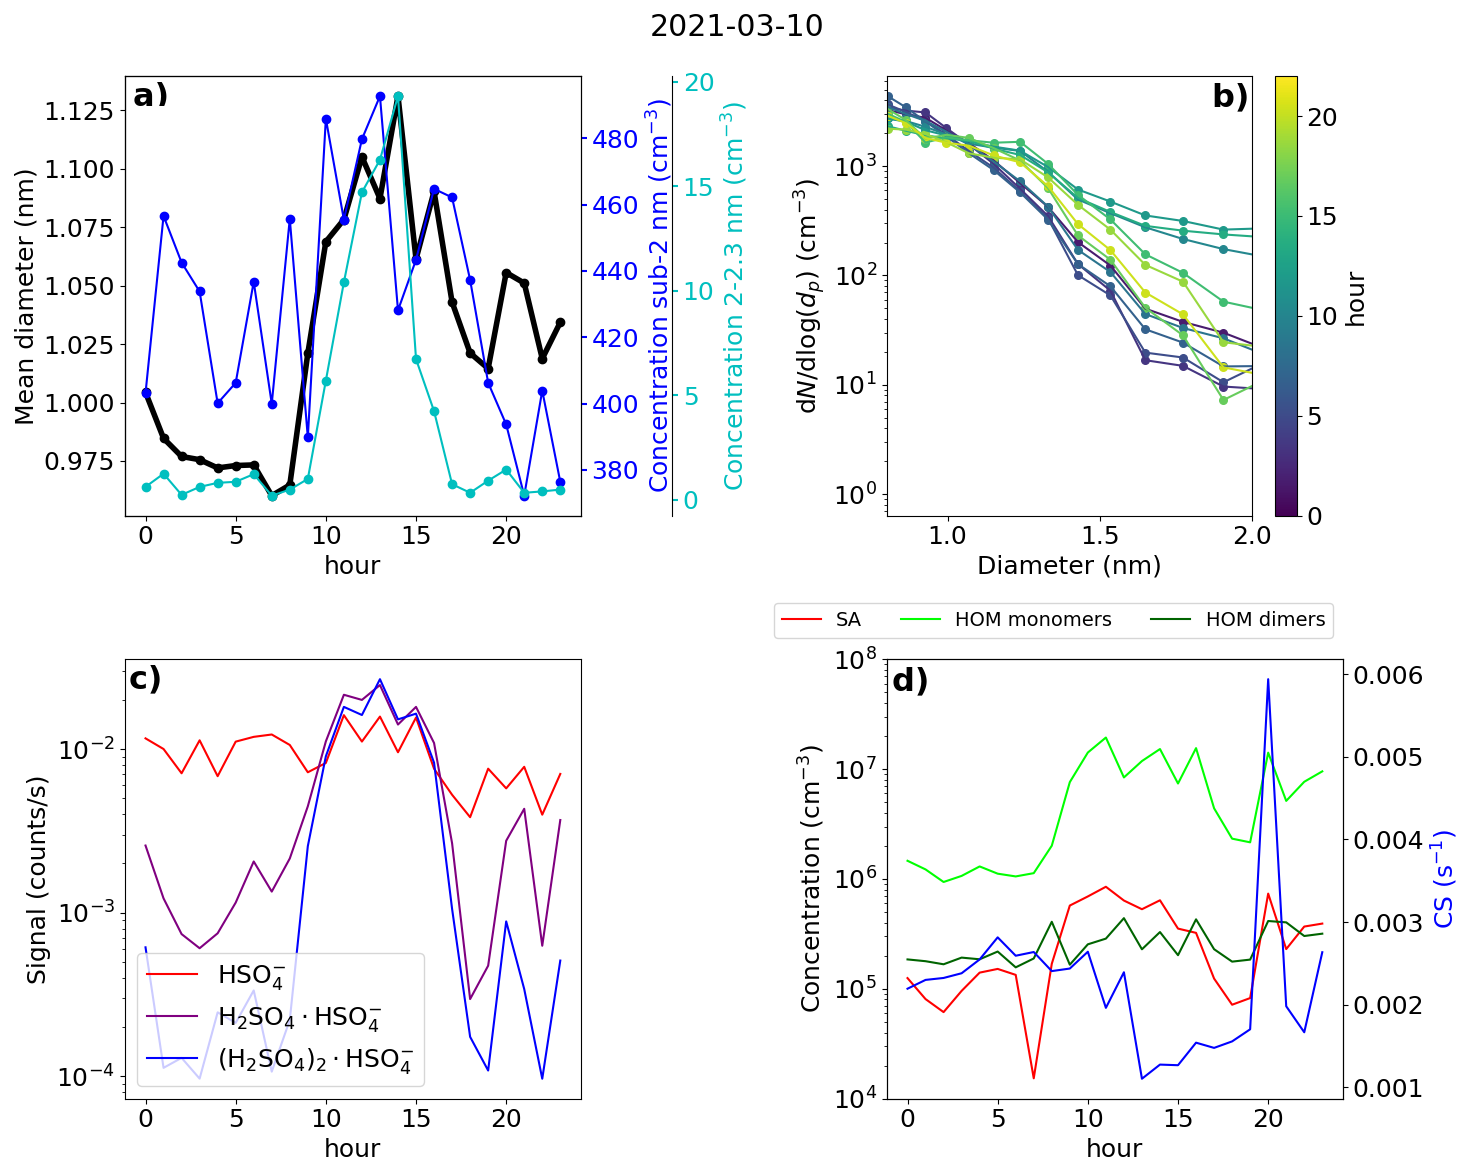
Figure 11Data from Hyytiälä, 10 March 2021. (a) Hourly mean diameter of negative small ions (0.8–2.0 nm), total concentration of small ions, and concentration of 2.0–2.3 nm negative ions. (b) 2 h median number size distribution of negative small ions. (c) Hourly signals of HSO, H2SO4 × HSO, and (H2SO4)2 × HSO ions. (d) Hourly median concentrations of neutral sulfuric acid (SA) and highly oxidized molecule (HOM) monomers and dimers, and the condensation sink (CS).
3.7.1 Hyytiälä case 1 – an early spring day with NPF
First of the investigated days was 10 March 2021 and is presented in Fig. 11. During this day, a strong NPF event was observed, with clear growth observed both in the total particle and the ion number size distribution (see Fig. A3). In the morning, a strong increase in the SA ion dimer and trimer signals was detected after 07:00 (Fig. 11c), which occurred simultaneously with an increase in the concentration of neutral sulfuric acid. Shortly after, at around 08:00, neutral HOM monomer concentration started to increase (Fig. 11d). A strong increase in the concentration of 2.0–2.3 nm negative ions was observed after 09:00, indicating intense NPF on a local scale (Fig. 11a). Approximately 1 h before an increase in the concentration of 2.0–2.3 nm ions was first observed, the small ion dmean started to increase from below 1.0 nm (Fig. 11a), showing that the growth of clusters in the small ion population to larger sizes had begun. We can also see this from the negative ion number size distributions (0.8–2.0 nm; Fig. 11b): in the early hours of the day, the concentrations of the smallest ions are at their highest, while the concentration of ions above approx. 1.1 nm are at their lowest. Throughout the morning hours, we can see that the concentration of ions above approx. 1.1 nm increases, and in the afternoon, at around 14:00, the concentration of ions close to 2.0 nm is over a order of magnitude higher than during the night before. At around 14:00, the concentration of 2.0–2.3 nm ions and small ion dmean also reach their peaks. At the same time, CS is at its lowest (Fig. 11d). Then, the concentrations of larger small ions (2.0–2.3 nm) and SA ion clusters start to decrease, alongside the concentration of HOM monomers.
We also took a look at the diameter specific concentrations in a smaller time frame (Fig. A6), which clearly shows how clear increase concentrations are observed for the diameters above 1.2 nm. A time delay between the increasing concentration of larger ions and smaller ions was seen, showing the growth of ions between 1.2 and 2.0 nm. Using the appearance time method (Lehtipalo et al., 2014), GR between 1.24 to 2.05 nm was estimated: GR = 0.40 nm h−1. This value is somewhat lower than typical GRs reported in Hyytiälä (Hirsikko et al., 2005; Yli-Juuti et al., 2011), as expected due to the small size of the considered ions. Regardless, it shows that the growth of ions below 2.0 nm is non-negligible on this particular day. We note that this GR, or the ones presented for the Hyytiälä case 2 and the Beijing case, is not a representative of the whole range of GRs for similar cases in the same location and that there can be considerable variability.
This day clearly shows how the sulfuric acid and HOM-driven particle formation is seen as the growth of the small ions to larger diameters. With the ion size distribution data, we have been able to get insight on when the cluster growth starts and how it progresses throughout this day.
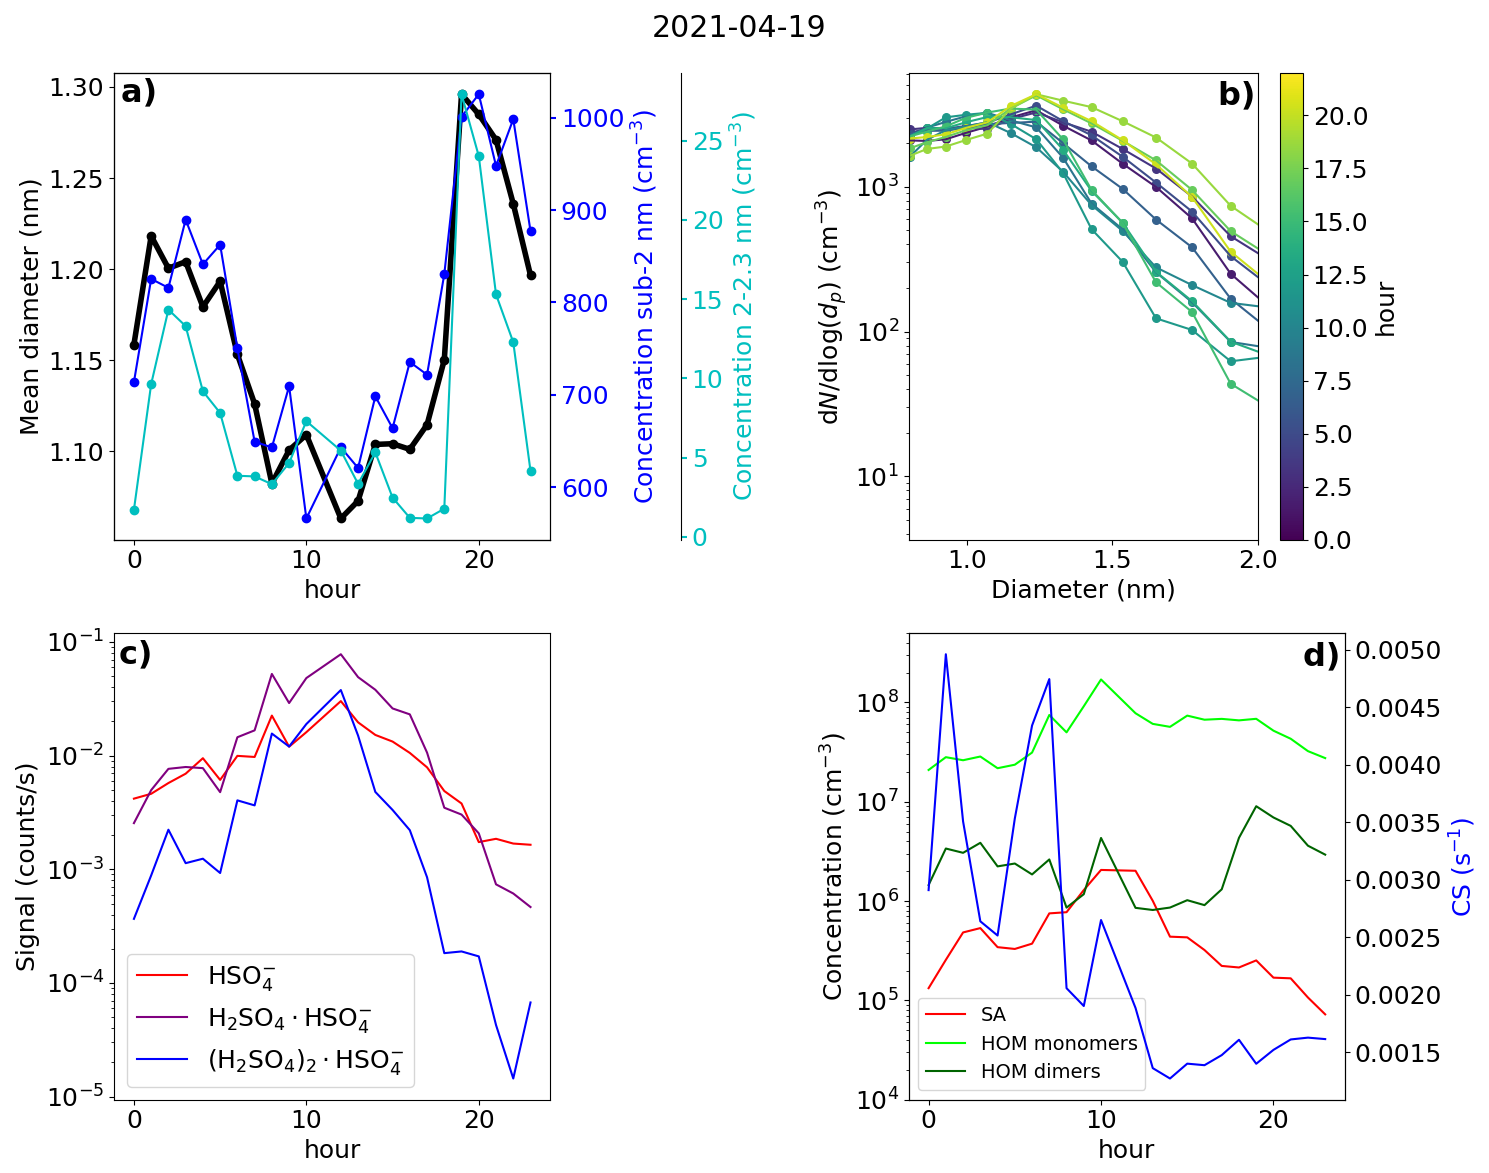
Figure 12Data from Hyytiälä, 19 April 2021. (a) Hourly mean diameter of negative small ions (0.8–2.0 nm), total concentration of small ions, and concentration of 2.0–2.3 nm negative ions. (b) 2 h median number size distribution of negative small ions. (c) Hourly signals of HSO, H2SO4 × HSO, and (H2SO4)2 × HSO ions. (d) Hourly median concentrations of neutral sulfuric acid (SA) and highly oxidized molecule (HOM) monomers and dimers, and the condensation sink (CS).
3.7.2 Hyytiälä case 2 – a spring day with strong evening clustering
The second of the chosen days for Hyytiälä was 19 April 2021 (Fig. 12). The NPF ranking of this day was high, over 0.9; however, the growth in the negative ion and total particle mode was discontinuous, with the clearest growth observed above 5.0 nm, suggesting that the fraction of growing locally formed neutral clusters or ions was low (Fig. A4). However, strong evening ion-cluster formation was observed on this day. Therefore, case 2 illustrates both the contribution of organic vapors to initiate the growth of larger particles and the evening ion-cluster formation attributable to HOM dimers (Mazon et al., 2016).
Starting from the early hours of the day, the signals of SA ions and neutral SA concentration increase (Fig. 12c and d), reaching their maxima around 13:00 in the early afternoon. Compared to Hyytiälä case 1, the signal from trimers is lower in relation to the signal from the monomer and dimer. At the same time, CS decreases (Fig. 12d). From the negative ion number size distributions (Fig. 12b), we see that the concentration of negative ions below approx. 1.2 nm increases, and the concentration of small ions above approx. 1.2 nm strongly decreases, starting from the early hours of the day until the afternoon. This is reflected in the value of dmean, which decreases from over 1.2 nm to below 1.1 nm (Fig. 12a). The concentration of 2.0–2.3 nm negative ions decreases until 08:00 in the morning, after which it increases briefly before decreasing again (Fig. 12a). The small ion total concentration also strongly decreases from over 800 to 600 cm−3 (Fig. 12a). Unlike in case 1, on this day, the growth of small ions during the daytime is negligible, and an increased fraction of the available charge is taken up by small (below 1.2 nm) ions, many of which are likely composed of sulfuric acid monomers or dimers. This explains the behavior of the ion size distributions (dmean) and the total small ion concentration.
After 14:00 in the afternoon, the concentration of neutral HOM dimers starts to increase, and reaches a peak at around 19:00 (Fig. 12d). Compared to case 1, the HOM dimer concentration is over 1 order of magnitude higher. Notably, at the same time as the HOM dimer concentration starts to increase, clear growth of total particles above 5.0 nm is observed (Fig. A4). The concentration of small ions larger than approx. 1.2 nm (Fig. 12b) and the 2.0–2.3 nm ion concentration (Fig. 12a) strongly increase. Small ion dmean increases from approx. 1.1 to 1.3 nm, while the total negative small ion concentration increases from around 600 to 1000 cm−3. The negative ion GR between 1.43 to 2.05 nm was estimated to be 1.28 nm h−1 (Fig. A6), which is over twice as high as the GR estimated for case 1, likely due to the high concentration of lower volatility HOMs driving the small ion growth during this particular evening.
3.7.3 Beijing case – a day with intense NPF
Figure 13 presents data from Beijing on 20 January 2019. This day was characterized by an intense NPF event, observed both in the ion and the total particle size distribution (Fig. A5). We see that from 00:00 until 05:00 in the morning, the negative small ion concentrations seem to increase, which is apparent for the whole sub-2 nm size range (Fig. 13a and b). Simultaneously, dmean of the small ions increases (Fig. 13a). The concentration of 2.0–2.3 nm negative ions stays low (Fig. 13a), indicating that there is no significant growth of small ions to intermediate ions. CS is similar throughout the night and the early morning. Based on the data presented here, we hypothesize that the increase in small ion concentration is attributed to a larger fraction of the ions being detected by the instrument as dmean increases.
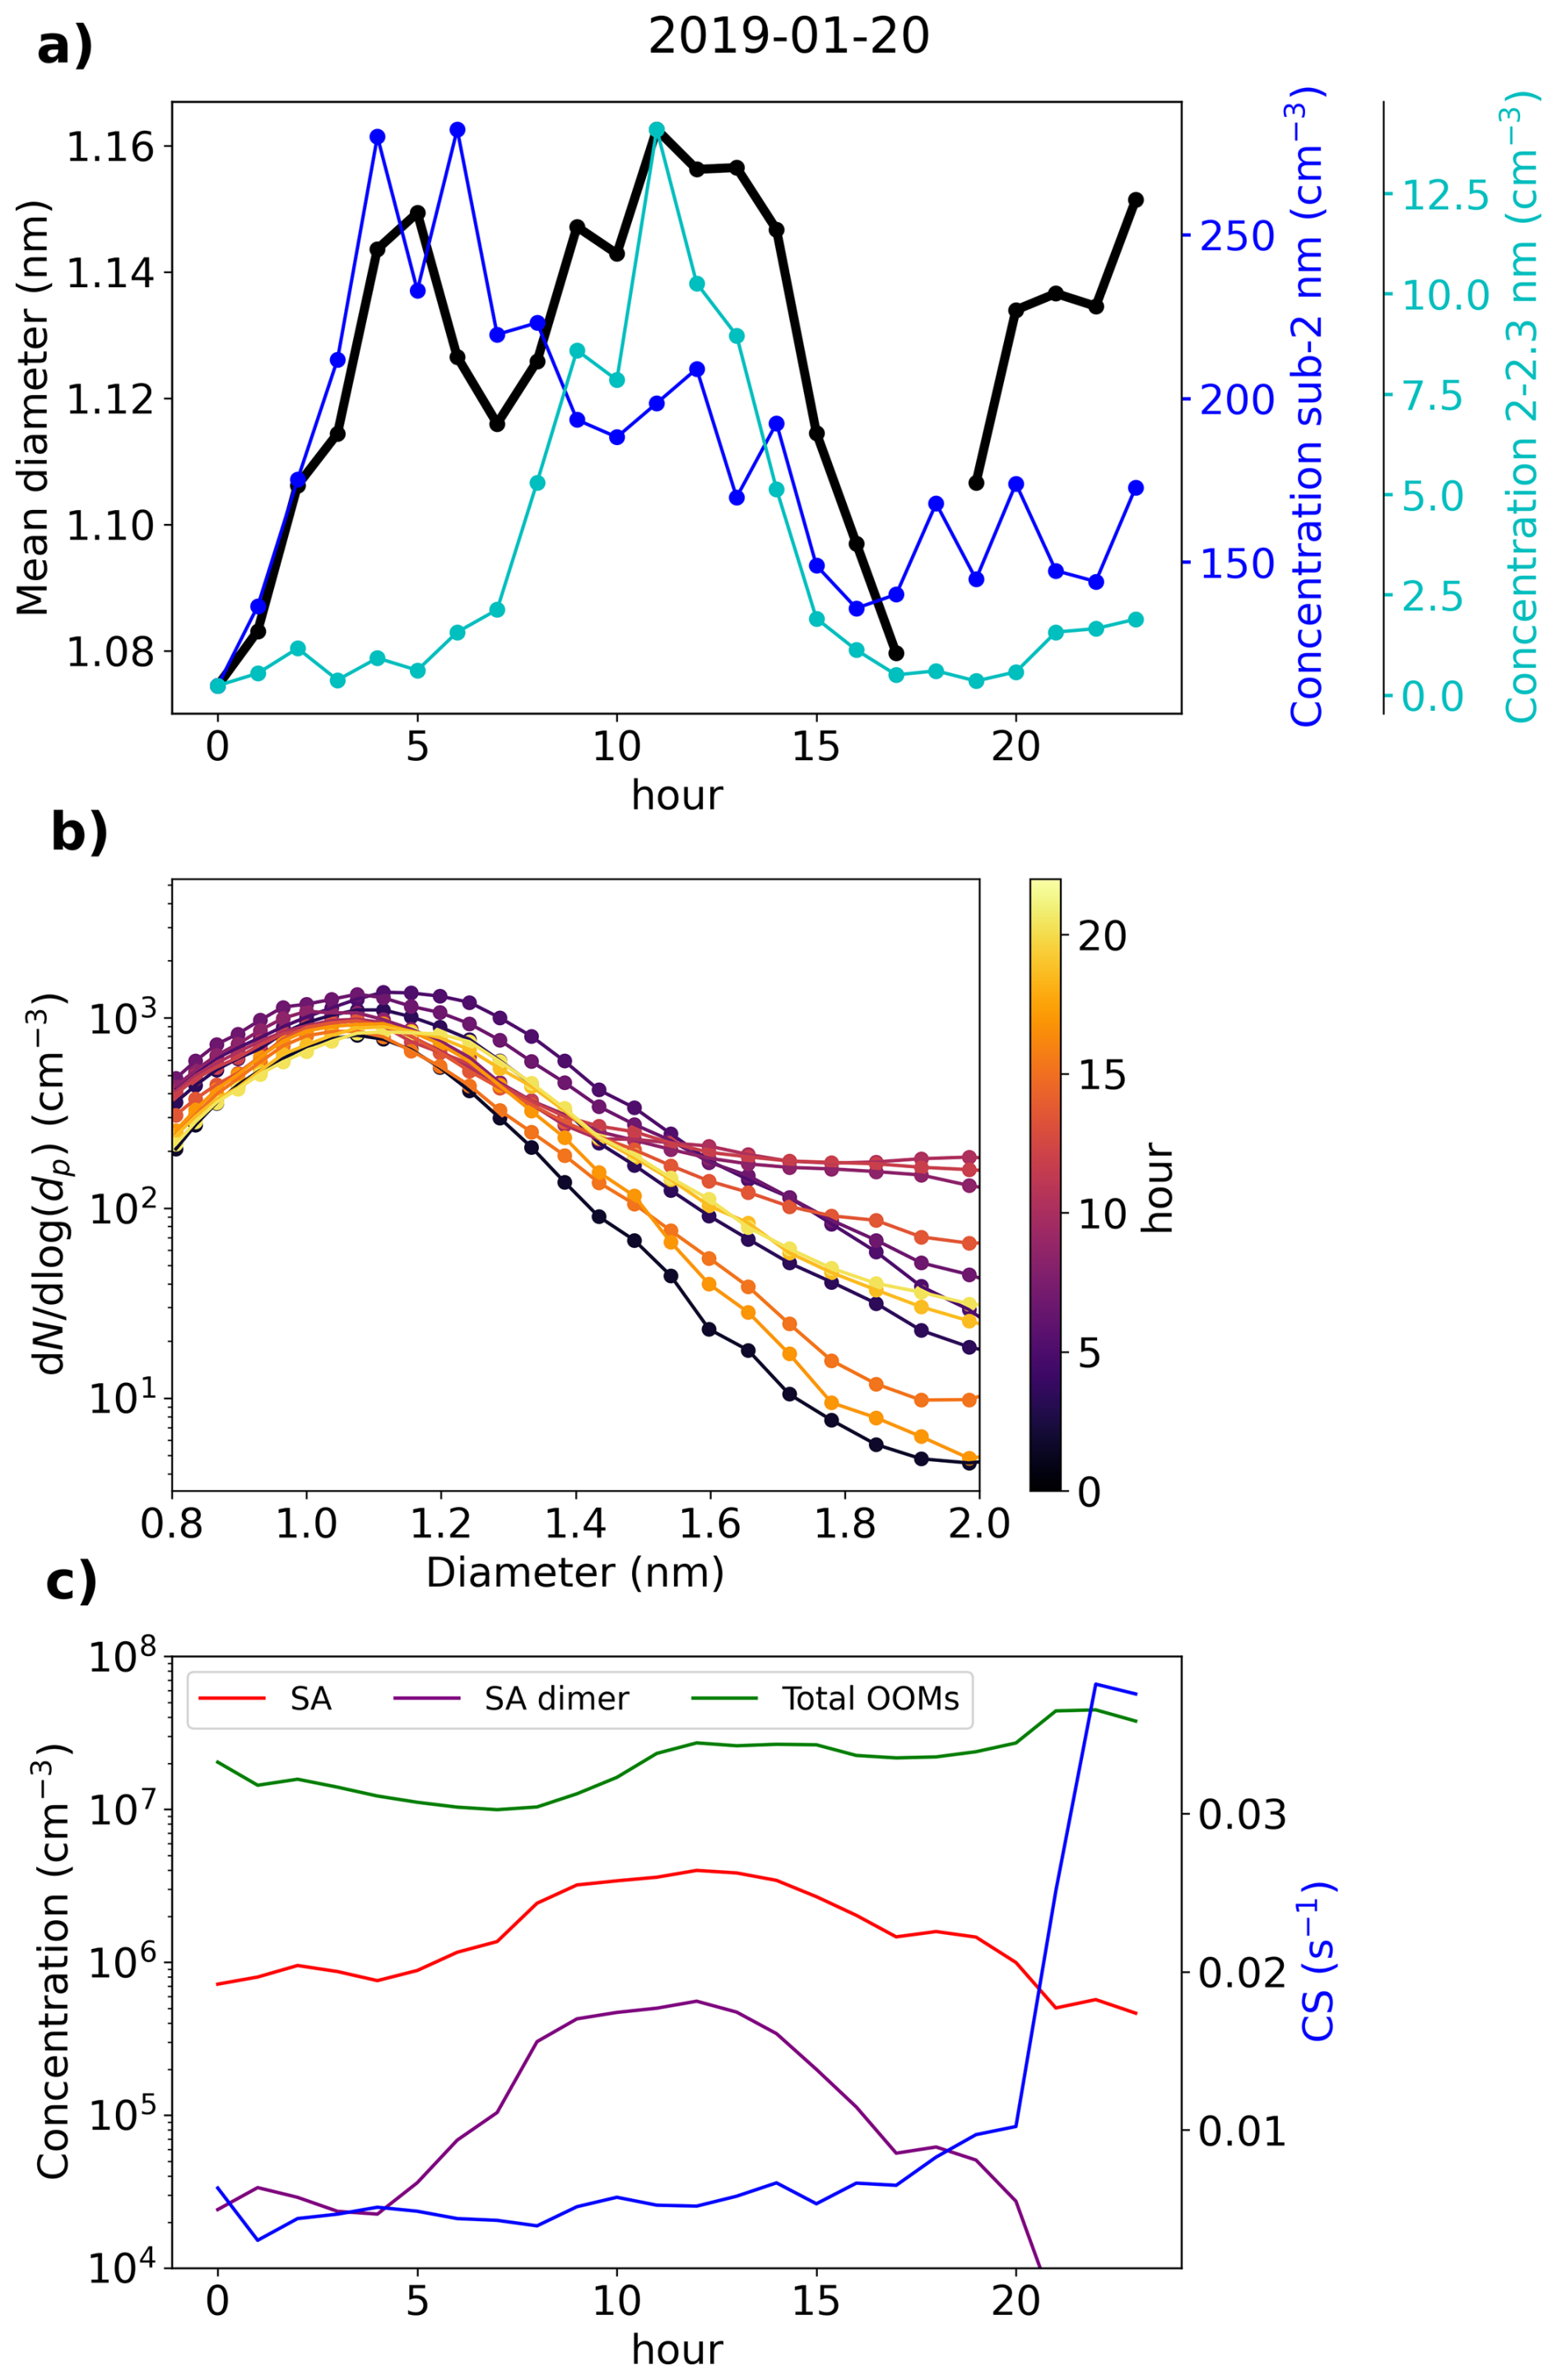
Figure 13Data from Beijing, 20 January 2019. (a) Hourly mean diameter of negative small ions (0.8–2.0 nm), total concentration of small ions, and concentration of 2.0–2.3 nm negative ions. (b) 2 h median number size distribution of negative small ions. (c) Hourly median concentrations of neutral sulfuric acid (SA), SA dimer, and total oxidized organic molecules (OOMs), and condensation sink (CS).
After 05:00 in the morning, an increase in neutral sulfuric and sulfuric acid dimer concentration is observed (Fig. 13c). Simultaneously, the concentration of 2.0–2.3 nm ions increases sharply, indicating the formation of intermediate ions. Two changes in the small ion size distribution are shown: first, the concentration of small ions below approx. 1.5 nm ions decreases; second, the concentration of small ions above that increases. The increasing growth of small ions to larger sizes causes a shift in their size distribution. Notably, no growth in the surface plots (Fig. A5) is observed yet, likely due to locality of or insufficient intensity of the ion formation. After 12:00, the concentrations of small ions larger than approx. 1.5 nm start to decrease, as does the concentration of 2.0–2.3 nm ions. While the growth of ions and particles at larger diameters continues, the intensity of the cluster growth decreases.
In this case, the negative small ion GR was estimated to be 0.24 nm h−1 from 1.72 to 2.06 nm (Fig. A7), which is lower than the values determined for the two Hyytiälä cases and is on the lower range of values of particle GRs for Beijing (Deng et al., 2020). Another noteworthy observation can be made from the diameter specific concentrations (Fig. A7): as already seen from the size distributions and more clearly here, the concentrations of ions up to around 1.5 nm decrease, while the concentrations above increase at the same time. This implies that the ions, which actually start to grow to larger sizes, are close to 1.5 nm in diameter, although at such a low GR that their survival probability to larger sizes is likely very low (Kulmala et al., 2017).
In Sect. 3.3, we saw how in Beijing there does not seem to be a correlation between the small ion number size distribution and the concentration of sulfuric acid. On this day, the increased concentrations of sulfuric acid occurred approx. simultaneously with the observed small ion growth. Previous studies have shown the importance of sulfuric acid in particle formation in Beijing (Yao et al., 2018; Cai et al., 2021; Yan et al., 2021). As a result, it seems likely that the growing small ions seen on this day are composed of sulfuric acid. However, while sulfuric acid forms these growing clusters, their growth also requires other ingredients.
We studied the seasonality of the small ion number size distribution and the relationship of the small ion size distribution with low-volatility organic vapors, sulfuric acid, coagulation sink (CoagS), and NPF in the rural boreal forest location of Hyytiälä, Finland, and the urban megacity location of Beijing, China. Both analysis of long-time series of data and daily case studies were carried out. We found a clear seasonality of the small ion size distribution in Hyytiälä, where the small ions of both polarities were the smallest in size during winter and the largest during late spring and summer. In Beijing, while there were month-to-month variations in the size distribution, no clear seasonal pattern was identified.
We found that in Hyytiälä, the small ion size distribution strongly varied with respect to the concentration of organic, especially highly oxidized organic (HOM) monomer, compounds and that the concentration of small ions above approx. 1.2 nm increased strongly with increasing HOM monomer concentration. This was observed more strongly for negative polarity and during the evening, which was found to be connected to the evening ion-cluster formation driven by organics in Hyytiälä. The small ion size distribution also showed a clear increase in the size of the small ions in Hyytiälä with respect to neutral sulfuric acid and ionized sulfuric acid dimers, associated with daytime cluster formation and growth. In contrast, there was no clear relationship between the concentration of either organic vapor or sulfuric acid, and the size of the small ions in Beijing. The reason for this remains to be identified, but we hypothesize that the concentration of bases is the limiting factor determining if the growth of small ions is seen in Beijing.
We found that the small ion size distribution in either location did not change strongly with changing CoagS. In Hyytiälä, small decrease in the concentration of especially the smallest ions was seen, as expected. However, despite our expectations, this was not observed in Beijing. The reason for this remains to be answered in future research.
When the concentration of ions in the range 2.0–2.3 nm increased, indicating the occurrence of local NPF, we observed clear signs of growth in the small ion size distribution. This was seen in both locations, even in Beijing, where no clear association of small ion size with organic vapor or sulfuric acid was found. To a lesser extent, an increase in the small ion size was also seen with respect to NPF rank, a parameter that characterizes the intensity of NPF. These results support the conclusion that in Beijing the concentration of sulfuric acid or organic vapor does not determine whether small ions grow to intermediate ions.
Overall, we have shown in a novel way how the atmospheric cluster formation and growth processes impact the number size distribution of small ions. The sub-2 nm size range is integral for understanding the first steps of new particle formation and the activation of the clusters to grow into particles. Our results can be applied to research on the dynamics of charged clusters and how they grow from clusters to particles.
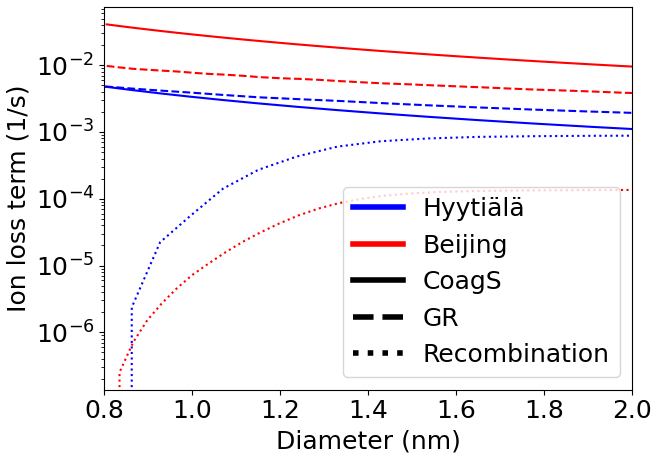
Figure A1A rough approximation of the different loss terms of negative ions as a function of ion diameter based on Eq. (2) in both Hyytiälä and Beijing. The concentration of positive ions was based on the median number size distributions. GR was assumed to equal 1 nm h−1 and was assumed to be constant regarding diameter. CoagS was scaled based on the median CS assuming that the charge enhancement of the sink was by a factor of 2. The median CSs were CS = 2.9 × 10⁻³ and 2.5 × 10⁻² s−1 for Hyytiälä and Beijing, respectively.
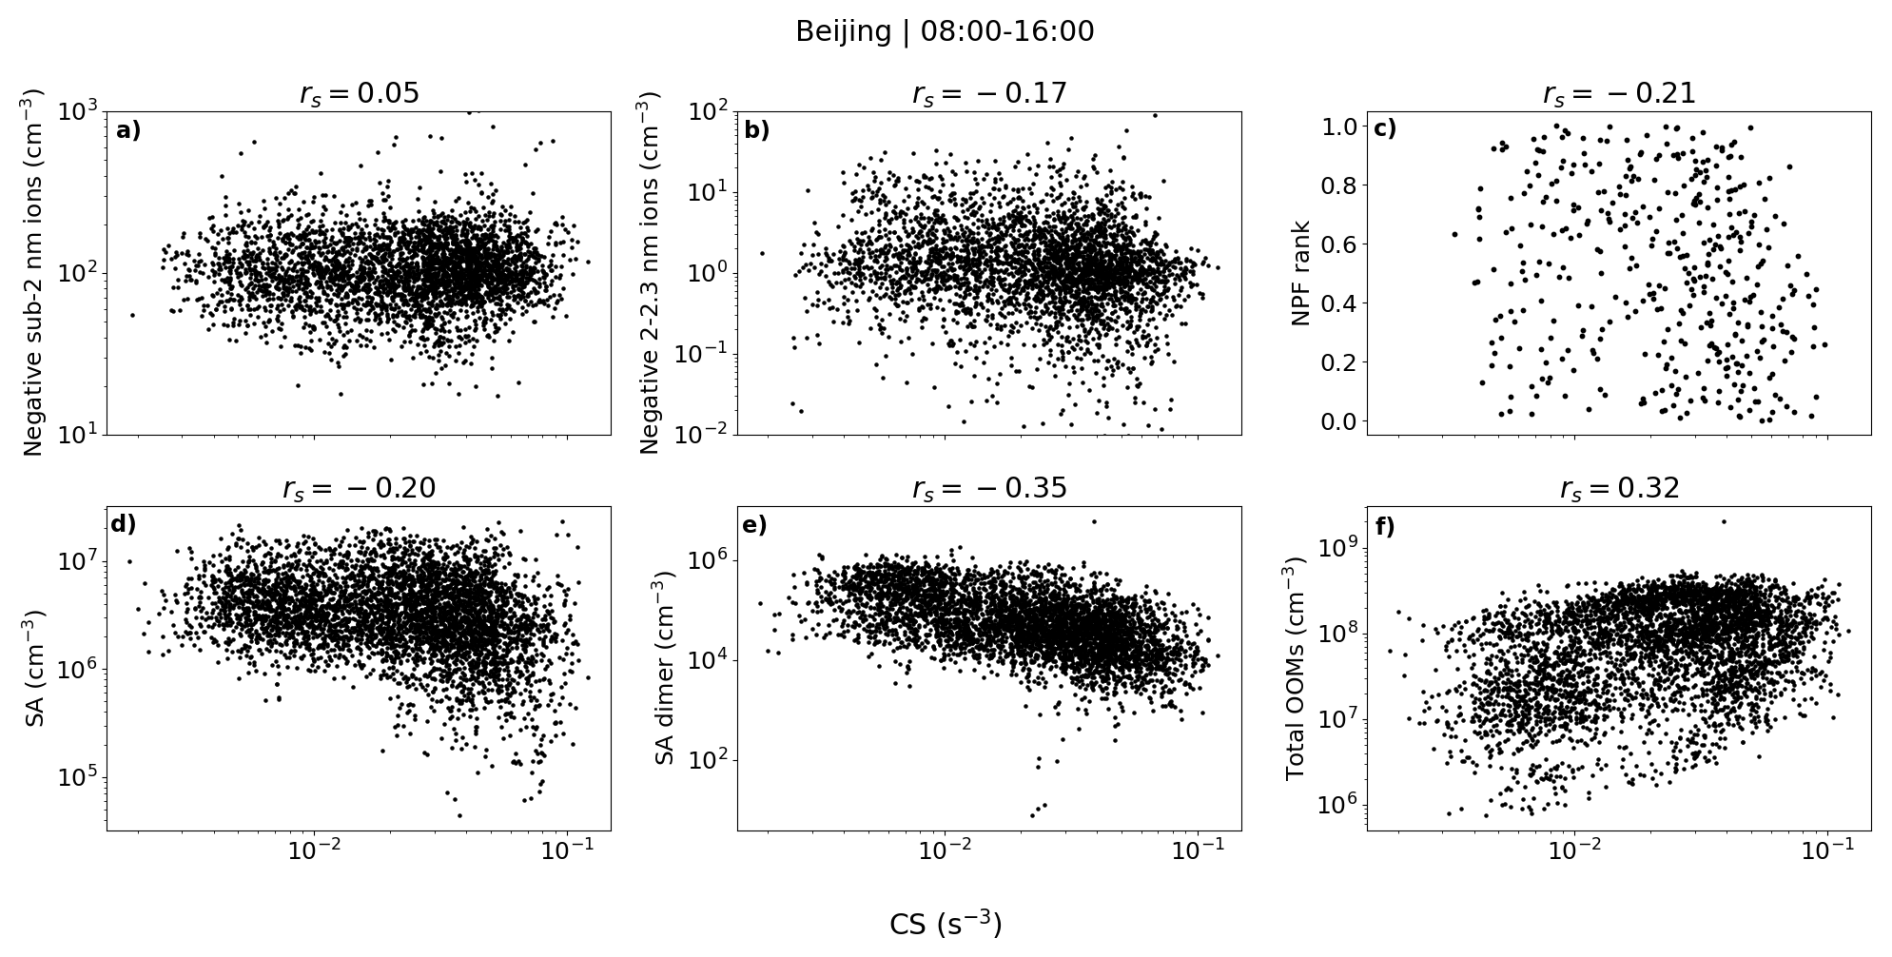
Figure A2The concentrations of negative sub-2 nm (a) and 2.0–2.3 nm (b) ions; NPF ranking values (c); and the concentrations of neutral sulfuric acid (SA)(d), SA dimer (e), and total oxidized organic molecules (OOMs) (f) with respect to condensation sink (CS) in Beijing. The values are hourly medians, except for panel (c), where NPF ranking is a daily parameter and CS is the daytime median. The Spearman correlation coefficients (rs) are also shown.
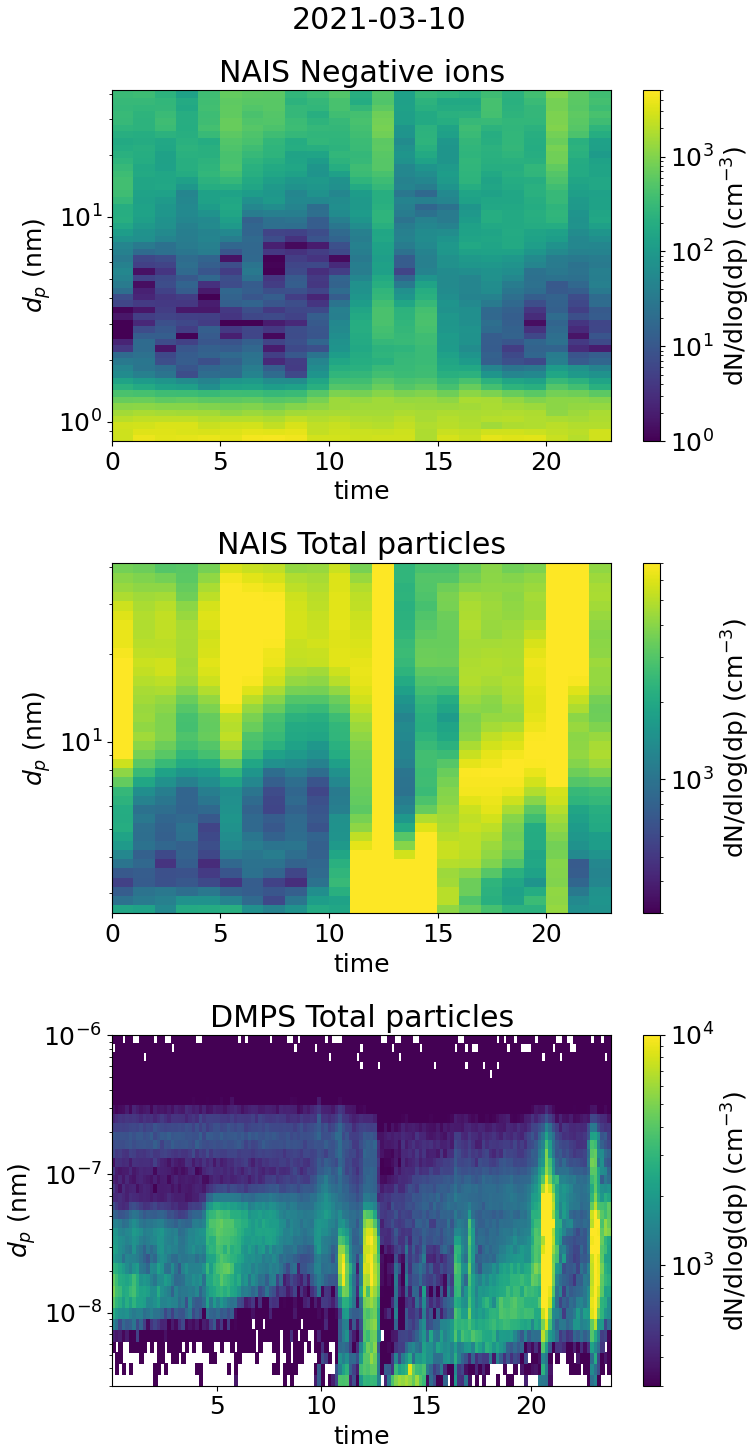
Figure A3Surface plots of negative ion number size distribution and total particle number size distribution measured by NAIS and DMPS in Hyytiälä on 10 March 2021.
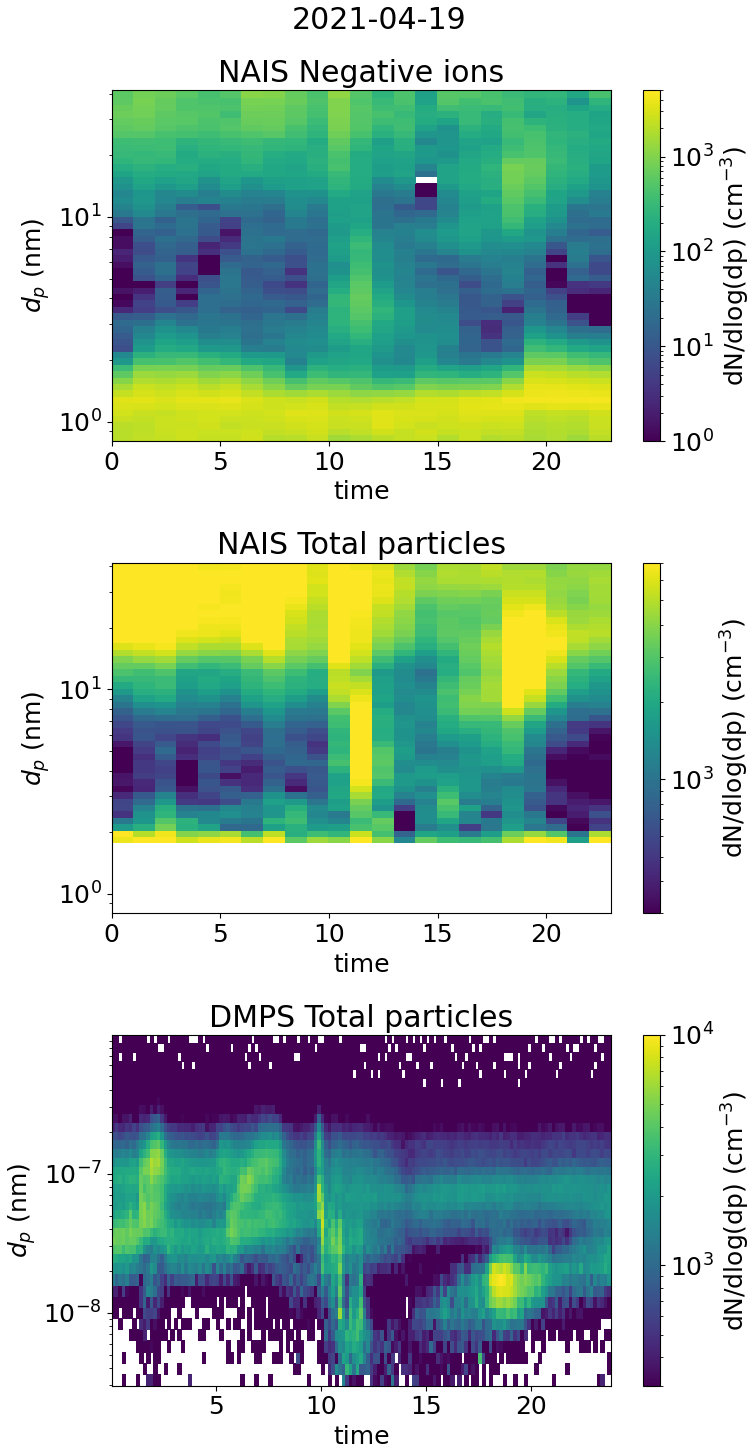
Figure A4Surface plots of negative ion number size distribution and total particle number size distribution measured by NAIS and DMPS in Hyytiälä on 19 April 2021.
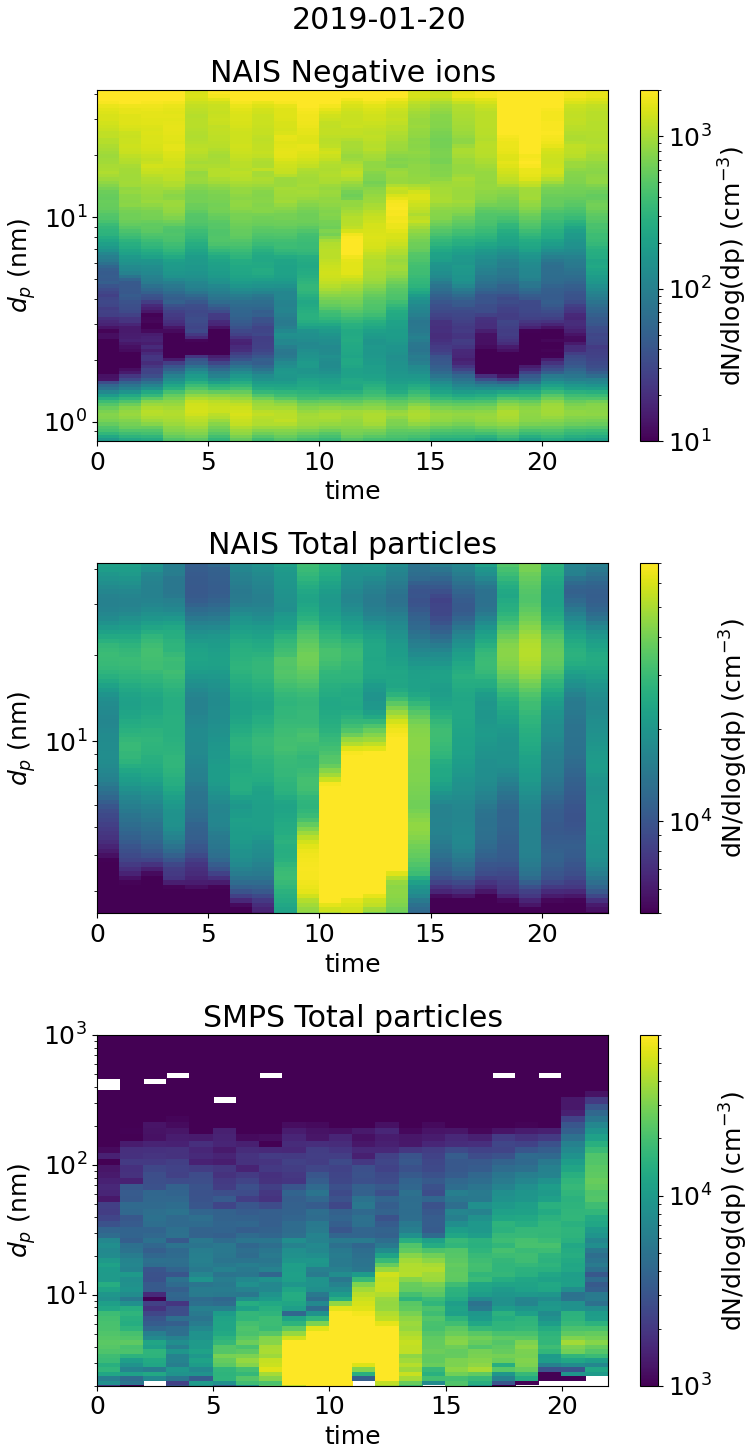
Figure A5Surface plots of negative ion number size distribution and total particle number size distribution measured by NAIS and SMPS (see Liu et al., 2016, for more information) in Beijing on 20 January 2019.
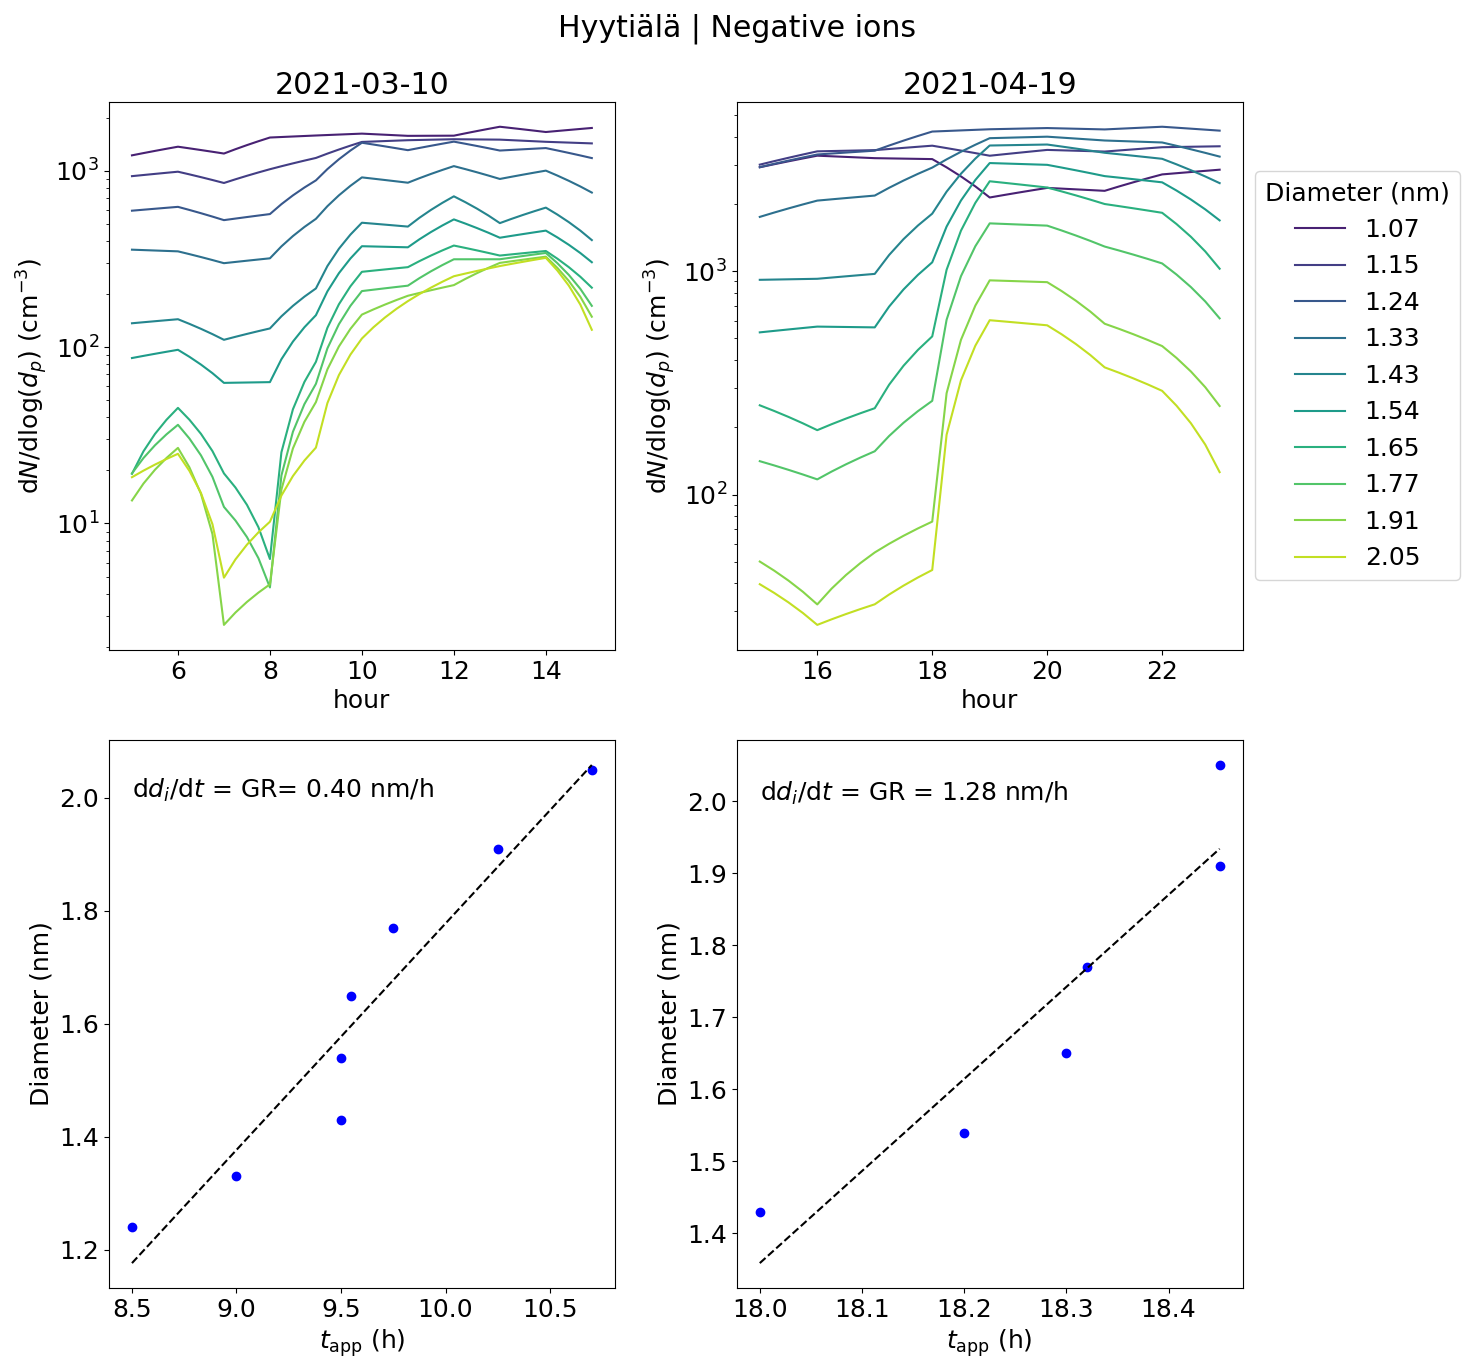
Figure A6The upper panels show concentrations of ions of a certain diameter with the hour of the day on 10 March and 19 April 2021 in Hyytiälä, Finland. The different colors of the lines indicate the respective ion diameter (di). The bottom panels show the appearance time, defined as the time that the concentration reaches 50 % of its maximum, and the respective di. The ion growth rate (GR), derived from these values as a slope of linear regression, is shown. For 10 March, the GR was determined from 1.24 to 2.05 nm and for 19 April from 1.43 to 2.05 nm.
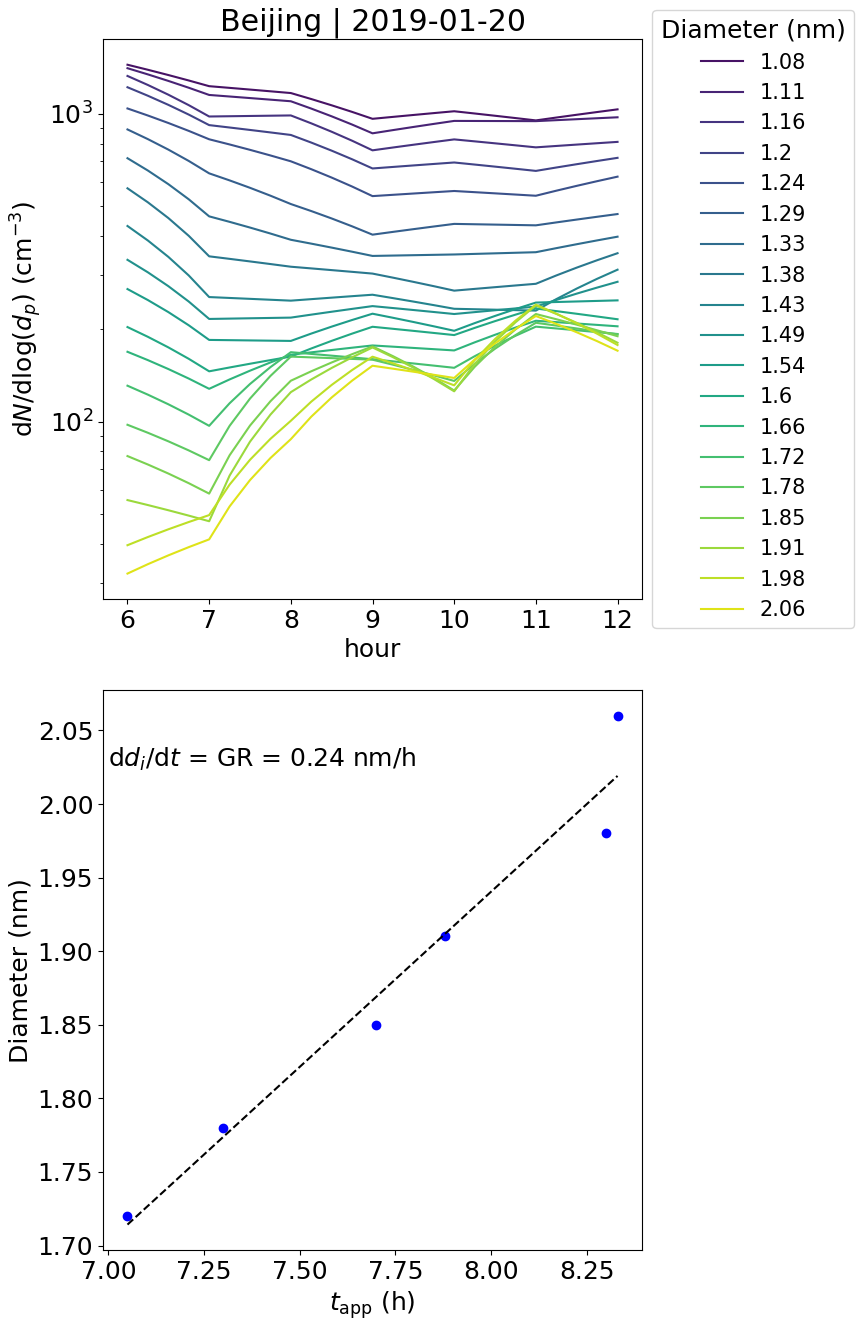
Figure A7The upper panel shows the concentrations of ions of a certain diameter with the hour of the day on 20 January 2019 in Beijing, China. The different colors of the lines indicate the respective ion diameter (di). The bottom panel shows the appearance time, defined as the time that the concentration reaches 50 % of its maximum, and the respective di. The ion growth rate (GR), derived from these values as a slope of linear regression, is shown. The GR was determined from 1.72 to 2.06 nm.
The Hyytiälä DMPS dataset can be accessed through the SmartSMEAR data portal at https://smear.avaa.csc.fi/ (last access: 31 August 2025). Other data and the codes used to produce the figures in this paper are available upon request from the authors.
ST analyzed the data and wrote the paper. JL was responsible for the ion measurements in Hyytiälä. CL and NS were responsible for the measurements of low-volatility vapors and ion clusters. YL was responsible for the measurements in Beijing. MK, VMK, and ST conceptualized the study. All authors contributed to reviewing and editing the paper.
At least one of the (co-)authors is a member of the editorial board of Aerosol Research. The peer-review process was guided by an independent editor, and the authors also have no other competing interests to declare.
Publisher's note: Copernicus Publications remains neutral with regard to jurisdictional claims made in the text, published maps, institutional affiliations, or any other geographical representation in this paper. The authors bear the ultimate responsibility for providing appropriate place names. Views expressed in the text are those of the authors and do not necessarily reflect the views of the publisher.
We acknowledge the SMEAR II and AHL/BUCT technical and scientific staff.
This work has been supported by the ACCC Flagship funded by the Academy of Finland under grant nos. 337549 (UH) and 337552 (FMI), and the “Gigacity” project funded by the Jenny and Antti Wihuri Foundation.
This paper was edited by Jose Castillo and reviewed by two anonymous referees.
Aalto, P., Hämeri, K., Becker, E., Weber, R., Salm, J., Mäkelä, J. M., Hoell, C., O'dowd, C. D., Hansson, H.-C., Väkevä, M., Koponen,I. K., Buzorius, G., and Kulmala, M.: Physical characterization of aerosol particles during nucleation events, Tellus B, 53, 344–358, https://doi.org/10.1034/j.1600-0889.2001.530403.x, 2001.
Aliaga, D., Tuovinen, S., Zhang, T., Lampilahti, J., Li, X., Ahonen, L., Kokkonen, T., Nieminen, T., Hakala, S., Paasonen, P., Bianchi, F., Worsnop, D., Kerminen, V.-M., and Kulmala, M.: Nanoparticle ranking analysis: determining new particle formation (NPF) event occurrence and intensity based on the concentration spectrum of formed (sub-5 nm) particles, Aerosol Research, 1, 81–92, https://doi.org/10.5194/ar-1-81-2023, 2023.
Arfin, T., Pillai, A. M., Mathew, N., Tirpude, A., Bang, R., and Mondal, P.: An overview of atmospheric aerosol and their effects on human health, Environ. Sci. Pollut. R., 30, 125347–125369, https://doi.org/10.1007/s11356-023-29652-w, 2023.
Atkinson, R. W., Mills, I. C., Walton, H. A., and Anderson, H. R.: Fine particle components and health – a systematic review and meta-analysis of epidemiological time series studies of daily mortality and hospital admissions, J. Expo. Sci. Env. Epid., 25, 208–214, https://doi.org/10.1038/jes.2014.63, 2015.
Bianchi, F., Garmash, O., He, X., Yan, C., Iyer, S., Rosendahl, I., Xu, Z., Rissanen, M. P., Riva, M., Taipale, R., Sarnela, N., Petäjä, T., Worsnop, D. R., Kulmala, M., Ehn, M., and Junninen, H.: The role of highly oxygenated molecules (HOMs) in determining the composition of ambient ions in the boreal forest, Atmos. Chem. Phys., 17, 13819–13831, https://doi.org/10.5194/acp-17-13819-2017, 2017.
Boucher, O., Randall, D., Artaxo, P., Bretherton, C., Feingold, G., Forster, P., Kerminen, V.-M., Kondo, Y., Liao, H., Lohmann, U., Rasch, P., Satheesh, S., Sherwood, S., Stevens, B., and Zhan, X.: Clouds and Aerosols, in: Climate Change 2013: The Physical Science Basis. Contribution of Working Group I to5 the Fifth Assessment Report of the Intergovernmental Panel on Climate Change, edited by: Stocker, T., Qin, D., Plattner, G., Tignor, M., Allen, S., Boschung, J., Nauels, A., Xia, Y., Bex, V., and Midgley, P., Cambridge University Press, Cambridge, United Kingdom and New York, NY, USA, 571–657, https://doi.org/10.1017/CBO9781107415324, 2013.
Cai, R., Yan, C., Yang, D., Yin, R., Lu, Y., Deng, C., Fu, Y., Ruan, J., Li, X., Kontkanen, J., Zhang, Q., Kangasluoma, J., Ma, Y., Hao, J., Worsnop, D. R., Bianchi, F., Paasonen, P., Kerminen, V.-M., Liu, Y., Wang, L., Zheng, J., Kulmala, M., and Jiang, J.: Sulfuric acid–amine nucleation in urban Beijing, Atmos. Chem. Phys., 21, 2457–2468, https://doi.org/10.5194/acp-21-2457-2021, 2021.
Dada, L., Paasonen, P., Nieminen, T., Buenrostro Mazon, S., Kontkanen, J., Peräkylä, O., Lehtipalo, K., Hussein, T., Petäjä, T., Kerminen, V.-M., Bäck, J., and Kulmala, M.: Long-term analysis of clear-sky new particle formation events and nonevents in Hyytiälä, Atmos. Chem. Phys., 17, 6227–6241, https://doi.org/10.5194/acp-17-6227-2017, 2017.
Deng, C., Fu, Y., Dada, L., Yan, C., Cai, R., Yang, D., Zhou, Y., Yin, R., Lu, Y., Li, X., Qiao, X., Fan, X., Nie, W., Kontkanen, J., Kangasluoma, J., Chu, B., Ding, A., Kerminen, V., Paasonen, P., Worsnop, R. D., Bianchi, F., Liu, Y., Zheng, J., Wang, L., Kulmala, M., and Jiang, J.: Seasonal characteristics of new particle formation and growth in urban Beijing, Environ. Sci. Technol., 54, 8547–8557, https://doi.org/10.1021/acs.est.0c00808, 2020.
Ehn, M., Junninen, H., Petäjä, T., Kurtén, T., Kerminen, V.-M., Schobesberger, S., Manninen, H. E., Ortega, I. K., Vehkamäki, H., Kulmala, M., and Worsnop, D. R.: Composition and temporal behavior of ambient ions in the boreal forest, Atmos. Chem. Phys., 10, 8513–8530, https://doi.org/10.5194/acp-10-8513-2010, 2010.
Ehn, M., Junninen, H., Schobesberger, S., Manninen, H., Franchin, A., Sipilä, M., Petäjä, T., Kerminen, V.-M., Tammet, H., Mirme, A., Mirme, S., Hõrrak, U., Kulmala, M., and Worsnop, D. R.: Aninstrumental comparison of mobility and mass measurements of atmospheric small ions, Aerosol Sci. Tech., 45, 522–532, https://doi.org/10.1080/02786826.2010.547890, 2011.
Fdez-Arroyabe, P., Salcines, C., Kassomenos, P., Santurtún, A., and Petäjä, T.: Electric charge of atmospheric nanoparticles and its potential implications with human health, Sci. Total Environ., 808, 152106, https://doi.org/10.1016/j.scitotenv.2021.152106, 2022.
Finlay, W. H.: Deposition of aerosols in the lungs: Particle characteristics, J. Aerosol Med. Pulm. D., 34, 213–216, https://doi.org/10.1089/jamp.2021.29040.whf, 2021.
Hari, P. and Kulmala, M.: Station for measuring ecosystem-atmosphere relations, Boreal Environ. Res., 10, 315–322, 2005.
Harrison, R. G. and Carslaw, K. S.: Ion-aerosol-cloud processes in the lower atmosphere, Rev. Geophys., 41, 1012, https://doi.org/10.1029/2002RG000114, 2003.
Harrison, R. G. and Tammet, H.: Ions in Terrestrial Atmosphere and Other Solar System Atmospheres, Space Sci. Rev., 137, 107–118, https://doi.org/10.1007/s11214-008-9356-x, 2008.
Hirsikko, A., Laakso, L, Hõrrak, U., Aalto, P. P., Kerminen, V.-M., and Kulmala, M.: Annual and size dependent variation of growth rates and ion concentrations in boreal forest, Boreal Environ. Res., 10, 357–369, 2005.
Hirsikko, A., Bergman, T., Laakso, L., Dal Maso, M., Riipinen, I., Hõrrak, U., and Kulmala, M.: Identification and classification of the formation of intermediate ions measured in boreal forest, Atmos. Chem. Phys., 7, 201–210, https://doi.org/10.5194/acp-7-201-2007, 2007.
Hirsikko, A., Nieminen, T., Gagné, S., Lehtipalo, K., Manninen, H. E., Ehn, M., Hõrrak, U., Kerminen, V.-M., Laakso, L., McMurry, P. H., Mirme, A., Mirme, S., Petäjä, T., Tammet, H., Vakkari, V., Vana, M., and Kulmala, M.: Atmospheric ions and nucleation: a review of observations, Atmos. Chem. Phys., 11, 767–798, https://doi.org/10.5194/acp-11-767-2011, 2011.
Hõrrak, U., Salm, J., and Tammet, H.: Statistical characterization of air ion mobility spectra at Tahkuse Observatory: Classification of air ions, J. Geophys. Res., 105, 9291–9302, 2000.
Hõrrak, U., Aalto, P. P., Salm, J., Komsaare, K., Tammet, H., Mäkelä, J. M., Laakso, L., and Kulmala, M.: Variation and balance of positive air ion concentrations in a boreal forest, Atmos. Chem. Phys., 8, 655–675, https://doi.org/10.5194/acp-8-655-2008, 2008.
Jokinen, T., Sipilä, M., Junninen, H., Ehn, M., Lönn, G., Hakala, J., Petäjä, T., Mauldin III, R. L., Kulmala, M., and Worsnop, D. R.: Atmospheric sulphuric acid and neutral cluster measurements using CI-APi-TOF, Atmos. Chem. Phys., 12, 4117–4125, https://doi.org/10.5194/acp-12-4117-2012, 2012.
Kirkby, J., Amorim, A., Baltensperger, U., Carslaw, K. S., Christoudias, T., Curtius, J., Donahue, N. M., Haddad, I. E., Flagan, R. C., Gordon, H., Hansel, A., Harder, H., Junninen, H., Kulmala, M., Kürten, A., Laaksonen, A., Lehtipalo, K., Lelieveld, J., Möhler, O., Riipinen, I., Stratmann, F., Tomé, A., Virtanen, A., Volkamer, R., Winkler, P. M., and Worsnop, D. R.: Atmospheric new particle formation from the CERN CLOUD experiment, Nat. Geosci., 16, 948–957, https://doi.org/10.1038/s41561-023-01305-0, 2023.
Kulmala, M., Lehtinen, K. E. J., and Laaksonen, A.: Cluster activation theory as an explanation of the linear dependence between formation rate of 3 nm particles and sulphuric acid concentration, Atmos. Chem. Phys., 6, 787–793, https://doi.org/10.5194/acp-6-787-2006, 2006.
Kulmala, M., Riipinen, I., Sipila, M., Manninen, H., Petaja, T., Junninen, H., Dal Maso, M., Mordas, G., Mirme, A., Vana, M., Hirsikko, A., Laakso, L., Harrison, R., Hanson, I., Leung, C., Lehtinen, K., and Kerminen, V.: Toward direct measurement of atmospheric nucleation, Science, 318, 89–92, https://doi.org/10.1126/science.1144124, 2007.
Kulmala, M., Petäjä, T., Nieminen, T., Sipilä, M., Manninen, H. E., Lehtipalo, K., Dal Maso, M., Aalto, P. P., Junninen, H., Paasonen, P., Riipinen, I., Lehtinen, K. E. J., Laaksonen, A., and Kerminen, V.-M.: Measurement of the nucleation of atmospheric aerosol particles, Nat. Protoc., 7, 1651–1667, https://doi.org/10.1038/nprot.2012.091, 2012.
Kulmala, M., Kontkanen, J., Junninen, H., Lehtipalo, K., Manninen, H. E., Nieminen, T., Petäjä, T., Sipilä, M., Schobesberger, S., Rantala, P., Franchin, A., Jokinen, T., Järvinen, E., Äijälä, M., Kangasluoma, J., Hakala, J., Aalto, P. P., Paasonen, P., Mikkilä, J., Vanhanen, J., Aalto, J., Hakola, H., Makkonen, U., Ruuskanen, T., Mauldin, R. L., Duplissy, J., Vehkamäki, H., Bäck, J., Kortelainen, A., Riipinen, I., Kurtén, T., Johnston, M. V., Smith, J. N., Ehn, M., Mentel, T. F., Lehtinen, K. E. J., Laaksonen, A., Kerminen, V.-M., and Worsnop, D. R.: Direct Observations of Atmospheric Aerosol Nucleation, Science, 339, 943–946, https://doi.org/10.1126/science.1227385, 2013.
Kulmala, M., Kerminen, V. M., Petaja, T., Ding, A. J., and Wang, L.: Atmospheric gas-to-particle conversion: why NPF events are observed in megacities?, Faraday Discuss., 200, 271–288, https://doi.org/10.1039/c6fd00257a, 2017.
Kulmala, M., Ezhova, E., Kalliokoski, T., Noe, S., Vesala, T., Lohila, A., Liski, J., Makkonen, R., Bäck, J., Petäjä, T., and Kerminen, V.-M.: CarbonSink+ – Accounting for multiple climate feedbacks from forests, Boreal Environ. Res., 25, 145–159, 2020.
Kulmala, M., Tuovinen, S., Mirme, S., Koemets, P., Ahonen, L., Liu, Y., Junninen, H., Petäjä, T., and Kerminen, V.-M.: On the potential of the Cluster Ion Counter (CIC) to observe local new particle formation, condensation sink and growth rate of newly formed particles, Aerosol Research, 2, 291–301, https://doi.org/10.5194/ar-2-291-2024, 2024a.
Kulmala, M., Ke, P., Lintunen, A., Peräkylä, O., Lohtander, A., Tuovinen, S., Lampilahti, J., Kolari, P., Schiestl-Aalto, P., Kokkonen, T., Nieminen, T., Dada, L., Ylivinkka, I., Petäjä, T., Bäck, J., Lohila, A., Heimsch, L., Ezhova, E., and Kerminen, V. M.: A novel concept for assessing the potential of different boreal ecosystems to mitigate climate change (CarbonSink+ Potential), Boreal Environ. Res., 29, 1–16, 2024b.
Kulmala, M., Wei, D., Zhang, X., Zhang, T., Xia, M., Wang, Y., Zou, Z., Zheng, F., Zhang, Y., Yang, C., Wu, J., Li, Y., Zha, Q., Yan, C., Feng, W., Wang, Z., Hua, C., Xie, J., Ma, W., Guo, Y., Chen, X., Liu, T., Li, J., Pang, H., Zhao, G., Chen, K., Zhao, Z., Zhong, W., Gao, S., Zhang, W., Yuan, Q., Qi, L., Petäjä, T., Sarnela, N., Ylivinkka, I., Aliaga, D., Cai, R., Agro, M., Ahonen, L., Schiestl-Aalto, P., Tuovinen, S., Cai, J., Kujansuu, J., Ciarelli, G., Cheng, Y., Ding, A., Dällenbach, K., Dada, L., Worsnop, D., Bianchi, F., Jiang, J., Liu, Y., Kerminen, V.-M., and Kokkonen, T.: Understanding atmospheric processes: insights from the comparison between Beijing and Hyytiälä, npj Clean Air, 1, 26, https://doi.org/10.1038/s44407-025-00020-x, 2025.
Lehtipalo, K., Leppä, J., Kontkanen, J., Kangasluoma, J., Franchin, A., Wimmer, D., Schobesberger, S., Junninen, H., Petäjä, T., Sipilä, M., Mikkilä, J., Vanhanen, J., Worsnop, D. R., and Kulmala, M.: Methods for determining particle size distribution and growth rates between 1 and 3 nm using the Particle Size Magnifier, Boreal Environ. Res., 19, 215–236, 2014.
Lehtipalo, K., Yan, C., Dada, L., Bianchi, F., Xiao, M., Wagner, R., Stolzenburg, D., Ahonen, L. R., Amorim, A., Baccarini, A., Bauer, P. S., Baumgartner, B., Bergen, A., Bernhammer, A.-K., Breitenlechner, M., Brilke, S., Buckholz, A., Mazon, S. B., Chen, D., Chen, X., Dias, A., Dommen, J., Draper, D. C., Duplissy, J., Ehn, M., Finkenzeller, H., Fisher, L., Frege, C., Fuchs, C., Garmash, O., Gordon, H., Hakala, J., He, X. C., Heikkinen, L., Heinrizi, M., Helm, J. C., Hofbauer, V., Hoyle, C. R., Jokinen, T., Kangasluoma, J., Kerminen, V.-M., Kim, C., Kirkby, J., Kontkanen, J., Kürten, A., Lawler, M. J., Mai1, H., Mathot, S., Mauldin III, R. L., Molteni, U., Nichman, L., Nie, W., Nieminen, T., Ojdanic, A., Onnela1, A., Passananti, M., Petäjä, T., Piel, F., Pospisilova, V., Quéléver, L. L. J., Rissanen, M. P., Rose, C., Sarnela, N., Schallhart, S., Sengupta, K., Simon, M., Tauber, C., Tomé, A., Tröst, J., Väisänen, O., Voge, A. L., Volkamer, R., Wagner, A. C., Wang, M., Weitz, L., Wimmer, D., Ye, P., Ylisirniö, A., Zha, Q., Carslaw, K., Curtius, J., Donahue, N., Flagan, R. C., Hansel, A., Riipinen, I., Virtanen, A., Winkler, P. M., Baltensperger, U., Kulmala, M., and Worsnop, D. R.: Multi-component new particle formation from sulfuric acid, ammonia and biogenic vapors, Sci. Adv., 4, eaau5363, https://doi.org/10.1126/sciadv.aau5363, 2018.
Li, J., Carlson, B. E., Yung, Y. L., Lv, D., Hansen, J., Penner, J. E., Liao, H., Ramaswamy, V., Kahn, R. A., Zhang, P., Dubovik, O., Ding, A., Lacis, A. A., Zhang, L., and Dong, Y.: Scattering and absorbing aerosols in the climate system, Nature Reviews Earth & Environment, 3, 363–379, https://doi.org/10.1038/s43017-022-00296-7, 2022.
Liu, J. Q., Jiang, J. K., Zhang, Q., Deng, J. G., and Hao, J. M.: A spectrometer for measuring particle size distributions in the range of 3 nm to 10 µm, Front. Env. Sci. Eng., 10, 63–72, https://doi.org/10.1007/s11783-014-0754-x, 2016.
Liu, Y., Yan, C., Feng, Z., Zheng, F., Fan, X., Zhang, Y., Li, C., Zhou, Y., Lin, Z., Guo, Y., Zhang, Y., Ma, L., Zhou, W., Liu, Z., Dada, L., Dällenbach, K., Kontkanen, J., Cai, R., Chan, T., Chu, B., Du, W., Yao, L., Wang, Y., Cai, J., Kangasluoma, J., Kokkonen, T., Kujansuu, J., Rusanen, A., Deng, C., Fu, Y., Yin, R., Li, X., Lu, Y., Liu, Y., Lian, C., Yang, D., Wang, W., Ge, M., Wang, Y., Worsnop, D. R., Junninen, H., He, H., Kerminen, V.-M., Zheng, J., Wang, L., Jiang, J., Petäjä, T., Bianchi, F., and Kulmala, M.: Continuous and comprehensive atmospheric observations in Beijing: a station to understand the complex urban atmospheric environment, Big Earth Data, 4, 295–321, https://doi.org/10.1080/20964471.2020.1798707, 2020.
Manninen, H. E., Franchin, A., Schobesberger, S., Hirsikko, A., Hakala, J., Skromulis, A., Kangasluoma, J., Ehn, M., Junninen, H., Mirme, A., Mirme, S., Sipilä, M., Petäjä, T., Worsnop, D. R., and Kulmala, M.: Characterisation of corona-generated ions used in a Neutral cluster and Air Ion Spectrometer (NAIS), Atmos. Meas. Tech., 4, 2767–2776, https://doi.org/10.5194/amt-4-2767-2011, 2011.
Mazon, S. B., Kontkanen, J., Manninen, H. E., Nieminen, T., Kerminen, V.-M., and Kulmala, M.: A long-term comparison of nighttime cluster events and daytime ion formation in a boreal forest, Boreal Environ. Res., 21, 242–261, 2016.
Mirme, S. and Mirme, A.: The mathematical principles and design of the NAIS – a spectrometer for the measurement of cluster ion and nanometer aerosol size distributions, Atmos. Meas. Tech., 6, 1061–1071, https://doi.org/10.5194/amt-6-1061-2013, 2013.
Mirme, S., Balbaaki, R., Manninen, H. E., Koemets, P., Sommer, E., Rörup, B., Wu, Y., Almeida, J., Ehrhart, S., Weber, S. K., Pfeifer, J., Kangasluoma, J., Kulmala, M., and Kirkby, J.: Design and performance of the Cluster Ion Counter (CIC), Atmos. Meas. Tech., 18, 5717–5728, https://doi.org/10.5194/amt-18-5717-2025, 2025.
Quaas, J., Ming, Y., Menon, S., Takemura, T., Wang, M., Penner, J. E., Gettelman, A., Lohmann, U., Bellouin, N., Boucher, O., Sayer, A. M., Thomas, G. E., McComiskey, A., Feingold, G., Hoose, C., Kristjánsson, J. E., Liu, X., Balkanski, Y., Donner, L. J., Ginoux, P. A., Stier, P., Grandey, B., Feichter, J., Sednev, I., Bauer, S. E., Koch, D., Grainger, R. G., Kirkevåg, A., Iversen, T., Seland, Ø., Easter, R., Ghan, S. J., Rasch, P. J., Morrison, H., Lamarque, J.-F., Iacono, M. J., Kinne, S., and Schulz, M.: Aerosol indirect effects – general circulation model intercomparison and evaluation with satellite data, Atmos. Chem. Phys., 9, 8697–8717, https://doi.org/10.5194/acp-9-8697-2009, 2009.
Quéléver, L. L. J., Kristensen, K., Normann Jensen, L., Rosati, B., Teiwes, R., Daellenbach, K. R., Peräkylä, O., Roldin, P., Bossi, R., Pedersen, H. B., Glasius, M., Bilde, M., and Ehn, M.: Effect of temperature on the formation of highly oxygenated organic molecules (HOMs) from alpha-pinene ozonolysis, Atmos. Chem. Phys., 19, 7609–7625, https://doi.org/10.5194/acp-19-7609-2019, 2019.
Rose, C., Zha, Q., Dada, L., Yan, C., Lehtipalo, K., Junninen, H., Mazon, S. B., Jokinen, T., Sarnela, N., Sipilä, M., Petäjä, T., Kerminen, V.-M., Bianchi, F., and Kulmala, M.: Observations of biogenic ion-induced cluster formation in the atmosphere, Sci. Adv., 4, 1–11, https://doi.org/10.1126/sciadv.aar5218, 2018.
Schmale, J., Zieger, P., and Ekman, A. M. L.: Aerosols in current and future Arctic climate, Nat. Clim. Change, 11, 95–105, https://doi.org/10.1038/s41558-020-00969-5, 2021.
Shiraiwa, M., Ueda, K., Pozzer, A., Lammel, G., Kampf, C. J., Fushimi, A., Enami, S., Arangio, A. M., Fröhlich-Nowoisky, J., Fujitani, Y., Furuyama, A., Lakey, P. S. J., Lelieveld, J., Lucas, K., Morino, Y., Pöschl, U., Takahama, S., Takami, A., Tong, H., Weber, B., Yoshino, A., and Sato, K.: Aerosol health effects from molecular to global scales, Environ. Sci. Technol., 51, 13545–13567, https://doi.org/10.1021/acs.est.7b04417, 2017.
Shuman, N. S., Hunton, D. E., and Viggiano, A. A.: Ambient and modified atmospheric ion chemistry: from top to bottom, Chem. Rev., 115, 4542–4570, https://doi.org/10.1021/cr5003479, 2015.
Sulo, J., Sarnela, N., Kontkanen, J., Ahonen, L., Paasonen, P., Laurila, T., Jokinen, T., Kangasluoma, J., Junninen, H., Sipilä, M., Petäjä, T., Kulmala, M., and Lehtipalo, K.: Long-term measurement of sub-3 nm particles and their precursor gases in the boreal forest, Atmos. Chem. Phys., 21, 695–715, https://doi.org/10.5194/acp-21-695-2021, 2021.
Tammet, H.: Size and mobility of nanometer particles, clusters and ions, J. Aerosol Sci., 26, 459–475, 1995.
Tammet, H., Hõrrak, U., Laakso, L., and Kulmala, M.: Factors of air ion balance in a coniferous forest according to measurements in Hyytiälä, Finland, Atmos. Chem. Phys., 6, 3377–3390, https://doi.org/10.5194/acp-6-3377-2006, 2006.
Tammet, H., Komsaare, K., and Horrak, U.: Intermediate ions in the atmosphere, Atmos. Res., 135–136, 263–273, https://doi.org/10.1016/j.atmosres.2012.09.009, 2014.
Tuovinen, S., Lampilahti, J., Kerminen, V.-M., and Kulmala, M.: Intermediate ions as indicator for local new particle formation, Aerosol Research, 2, 93–105, https://doi.org/10.5194/ar-2-93-2024, 2024.
Yan, C., Yin, R., Lu, Y., Dada, L., Yang, D., Fu, Y., Kontkanen,J., Deng, C., Garmash, O., Ruan, J., Baalbaki, R., Schervish, M., Cai, R., Bloss, M., Chan, T., Chen, T., Chen, Q., Chen, X., Chen, Y., Chu, B., Dällenbach, K., Foreback, B., He, X., Heikki-nen, L., Jokinen, T., Junninen, H., Kangasluoma, J., Kokkonen, T., Kurppa, M., Lehtipalo, K., Li, H., Li, H., Li, X., Liu, Y., Ma, Q., Paasonen, P., Rantala, P., Pileci, R. E., Rusanen, A., Sarnela, N., Simonen, P., Wang, S., Wang, W., Wang, Y., Xue, M., Yang, G., Yao, L., Zhou, Y., Kujansuu, J., Petäjä, T., Nie, W., Ma, Y., Ge, M., He, H., Donahue, N. M., Worsnop, D. R., Veli-Matti, K., Wang, L., Liu, Y., Zheng, J., Kulmala, M., Jiang, J., and Bianchi, F.: The Synergistic Role of Sulfuric Acid, Bases, and Oxidized Organics Governing New-Particle Formation in Beijing, Geophys. Res. Lett., 48, e2020GL091944, https://doi.org/10.1029/2020gl091944, 2021.
Yao, L., Garmash, O., Bianchi, F., Zheng, J., Yan, C., Kontkanen, J., Junninen, H., Mazon, S. B., Ehn, M., Paasonen, P., Sipilä, M., Wang, M., Wang, X., Xiao, S., Chen, H., Lu, Y., Zhang, B., Wang, D., Fu, Q., Geng, F., Li, L., Wang, H., Qiao, L., Yang, X., Chen, J., Kerminen, V.-M., Petäjä, T., Worsnop, D. R., Kulmala, M., and Wang, L.: Atmospheric new particle formation from sulfuric acid and amines in a Chinese megacity, Science, 361, 278–281, https://doi.org/10.1126/science.aao4839, 2018.
Yli-Juuti, T., Nieminen, T., Hirsikko, A., Aalto, P. P., Asmi, E., Hõrrak, U., Manninen, H. E., Patokoski, J., Dal Maso, M., Petäjä, T., Rinne, J., Kulmala, M., and Riipinen, I.: Growth rates of nucleation mode particles in Hyytiälä during 2003−2009: variation with particle size, season, data analysis method and ambient conditions, Atmos. Chem. Phys., 11, 12865–12886, https://doi.org/10.5194/acp-11-12865-2011, 2011.
Zha, Q., Huang, W., Aliaga, D., Peräkylä, O., Heikkinen, L., Koenig, A. M., Wu, C., Enroth, J., Gramlich, Y., Cai, J., Carbone, S., Hansel, A., Petäjä, T., Kulmala, M., Worsnop, D., Sinclair, V., Krejci, R., Andrade, M., Mohr, C., and Bianchi, F.: Measurement report: Molecular-level investigation of atmospheric cluster ions at the tropical high-altitude research station Chacaltaya (5240 m a.s.l.) in the Bolivian Andes, Atmos. Chem. Phys., 23, 4559–4576, https://doi.org/10.5194/acp-23-4559-2023, 2023.