the Creative Commons Attribution 4.0 License.
the Creative Commons Attribution 4.0 License.
 | 04 Nov 2026
Inhalation of small particles (PM2.5) in urban road tunnels and underground in Madrid (Spain) – a citizen science project

Esther Gil Cid
Luis Miguel Pozo Coronado
Some public infrastructures do not routinely monitor air pollution, particularly in semi-enclosed transport environments such as road tunnels and metro systems. Low-cost sensors (LCSs) may complement official monitoring by providing accessible exposure data.
This study aimed to validate LCS performance and to assess PM2.5 concentrations in urban transport microenvironments in a large city with the active participation of various citizens.
LCS measurements were compared with reference station data using Pearson correlation coefficients. The device was mounted outside a vehicle while driving through road tunnels, and additional measurements were conducted on metro platforms and inside subway carriages. All measurements were carried out by different citizens who had been previously trained.
The correlation between LCS and the reference station was high (r=0.9301; 95 % CI: 0.926–0.934), supporting device reliability. In road tunnels, mean PM2.5 increased from 12.62 µg m−3 (standard deviation (SD) 11.3) in the first half of the journey to 16.6 µg m−3 (SD 15.2) in the second half (p<0.001). On metro platforms, concentrations exceeded 10 µg m−3 (mean 20 µg m−3; range 10–32), while inside carriages, levels remained above 5 µg m−3 (mean 10 µg m−3; range 5.8–17.8).
These results have been reviewed, assessed, and discussed by all participating citizens from the signatory associations. As no safe threshold for PM2.5 exposure has been established, systematic monitoring and the integration of low-cost technologies into public health surveillance are needed to inform regulation and urban transport policies.
- Article
(5273 KB) - Full-text XML
-
Supplement
(978 KB) - BibTeX
- EndNote


Small-sized particles present in inhaled air are responsible for numerous respiratory and systemic diseases, even at low concentrations and within short exposure times – ranging from hours to days (Yu et al., 2024; Orellano et al., 2020; Sun et al., 2024). Among respiratory illnesses, their association with asthma, chronic obstructive pulmonary disease (COPD), and lung cancer is particularly noteworthy (Kampa and Castanas, 2008). Moreover, due to their small size, these particles can penetrate the alveolar–capillary membrane, enter the bloodstream, and reach distant organs such as the heart, brain, and kidneys (Vanbrabant et al., 2024). Exposure to fine particles (e.g. PM2.5) is a recognized risk factor for premature death, pulmonary or cardiac disease, pregnancy complications, cancer, diabetes, and neurological disorders (Manisalidis et al., 2020; World Health Organization, 2025).
Although efforts are made to control their concentrations in large cities through fixed or mobile air quality monitoring stations, there remains variability in the available data on their concentrations inside urban tunnels (Advisory Committee on Tunnel Air Quality, 2018; Svartengren et al., 2000; Jiang et al., 2024; Zhao et al., 2021; Wang et al., 2021; Skerker, 2017; Zamorategui-Molina et al., 2021; Zhou et al., 2014; Miller and Newby, 2020) and subway systems (Luglio et al., 2023; Zhao et al., 2017; Cartenì et al., 2015; Figueroa-Lara et al., 2019; Querol et al., 2012; Van Ryswyk et al., 2017; Luglio et al., 2021; Martins et al., 2016; Nieuwenhuijsen et al., 2007; Moreno et al., 2015).
Short-term exposure to airborne particles and gases has been less studied than long-term exposure, but recent evidence suggests significant health effects. A recent literature review (Orellano et al., 2020) reported that brief exposures to cPM2.5 (hours or a few days) were associated with all-cause mortality (relative risk (RR) 1.0065; 95 % CI 1.0044–1.0086) and with respiratory, cardiovascular, and cerebrovascular mortality, with the highest certainty of evidence.
Globally, approximately 1 million premature deaths per year (2000–2019) have been attributed to short-term cPM2.5 exposure, representing 2.08 % (1.41–2.75) of all deaths per 100 000 inhabitants. Mortality estimates were similar across different exposure thresholds (5.9, 10, or 15 µg m−3) (Yu et al., 2024).
A daily increase of 10 µg m−3 in cPM2.5 concentrations is associated with a rise in daily all-cause mortality (Ma et al., 2024). These findings support the conclusion that even short-term exposure to cPM2.5 can have measurable health impacts.
There is evidence indicating that there is no safe threshold for cPM2.5 concentrations and that some health effects occur immediately after exposure and can persist for at least 3 years (Wei et al., 2024; Wei and Schwartz, 2024; Marks, 2022; Bloss, 2021; Wei et al., 2022).
In Madrid (Spain), several tunnels are used for transportation. These include the so-called M30 ring road, with 10 km of underground highway, and the extensive metro network comprising 13 lines, 303 stations, and a total length of 295 km. In 2023, approximately 374 million vehicles and 487.5 million users circulated through the M30, while 662 million passengers used the metro network during the same year. In 2025, 736 974 012 trips were made on the metro.
The M30 system includes 1000 ventilation fans and 90 pumping wells with a flow capacity of 8000 m3 d−1 (Ayuntamiento de Madrid, 2026a; EMESA M-30, 2025). According to information provided by M30 management (22 April 2024; A. López-Encuentra, personal communication), there are 19 PM2.5 particle filtration stations within the tunnels. However, limited data exist on PM2.5 concentrations (cPM2.5) inside the M30 tunnels – either within or outside vehicles. Only two publications related to the M30 were identified: one concerning the ventilation systems (del Rey Llorente et al., 2005) and another on the advantages of reducing the speed limit to 70 km h−1 (Pérez-Prada and Monzón, 2014).
In 2024, a Spanish research group examined gas and particle concentrations in a segment of the M30 (López-de Abajo et al., 2024). Their objective was to assess the potential deterioration of concrete caused by gas exposure. For PM2.5, they could only measure concentrations in the ventilation gallery, as no sensors were installed inside the traffic tunnels themselves.
Similarly, in the Madrid Metro system, there is insufficient information about cPM2.5 levels on platforms and inside train carriages. Only a few press reports exist (elDiario.es, 2025; Donostiarrak, 2025; ConBici, 2025). Recently, the initiation of a pilot study to measure cPM2.5 levels in the Madrid Metro was announced (Envira, 2025).
The concept of citizen science seeks to generate knowledge through the participation of civil society (Froeling et al., 2024; Vohland et al., 2021). Several professionals from different disciplines, together with neighbourhood organizations from Madrid's Latina District, decided to conduct a civic environmental monitoring initiative focused on air quality in various urban environments.
Few publications have used citizen science approaches involving low-cost sensors (LCSs) to measure PM2.5 in transport microenvironments (Yang, 2026), highlighting their potential usefulness. Other studies have applied this methodology in vulnerable environments (Kubis et al., 2026). Given the low cost of these sensors, they may be useful for citizen associations or groups of people susceptible to air pollution to assess their actual exposure in these environments. Using a citizen science approach, these measurements can provide complementary information on personal exposure where official monitoring data are limited or unavailable.
The objective of this study was to measure the concentration of PM2.5 (cPM2.5) levels in the M30 tunnels and the metro using a portable monitoring device.
This is an observational study examining environmental risk factors. All spot determinations of cPM2.5 in this study were performed using a portable monitoring device (AirBeam3 HabitatMap, USA) (AB3), which had been validated by comparing its measurements with those of a fixed municipal monitoring station (see Performance evaluation and utility of a low-cost particulate matter sensor for use in a citizen science context in the Supplement).
Hourly government data were obtained from the Madrid City Council's open data portal (Ayuntamiento de Madrid, 2026b). The available data on the Madrid City Council website are validated hourly averages derived from 10 min averages, rounded in both the 10 min and hourly averages. This involves applying a low-pass filter in each averaging process. In addition, we asked the Madrid City Council for the original data, and we were provided with 10 min cPM2.5 averages, therefore they were also available for analysis. The provided values are rounded to the nearest whole number.
AB3 sensor data were collected from 12:44 UTC+1 on 5 December 2023 to 15:34 on 20 January 2024, at a data collection frequency of 1 min, resulting in a total of raw 65 198 1 min records. Each record contains data on date, time, latitude, longitude, temperature (in Fahrenheit), PM1, PM10, PM2.5 concentration (in micrograms per cubic metre), and relative humidity (percentage).
Out of the 65 198 records obtained with the AB3, invalid measurements were discarded. Hourly averages of PM2.5, temperature, and relative humidity, as well as 10 min averages of these parameters, were then obtained, resulting in a total of 1054 valid hourly records and 6321 valid 10 min records.
To analyse the relationship between AB3 values and government hourly data, an initial analysis was conducted, obtaining the correlation coefficient between the hourly averages obtained from both instruments. All linear model fitting calculations were performed using RStudio (R Core Team, 2024).
An empirical model was established between 10 min averages from AB3 measurements and 10 min averages obtained by a government fixed station (TEOM). This involved a two-step process: first, studying the correlation and differences between both records, and then determining eight adjustment models through a training model, which were contrasted with the test set.
Based on this study, two models were established for subsequent observations. The first model (Model A) considers temperature and relative humidity, as well as an intercept, allowing for precise adjustment. The second model (Model B) is based solely on PM2.5 observations with an intercept, establishing confidence intervals. This second model allows for establishing minimum PM2.5 levels from future observations.
Using a different approach, to study the agreement between both datasets, the Bland and Altman method was used (Bland and Altman, 1986), which involves plotting the difference between AB3 and TEOM hourly measurements against their mean, and calculating the mean differences and their confidence intervals.
To assess the validity of AB3, its receiver operating charasteristic (ROC) curve was constructed for the TEOM 10 µg m−3 threshold (the political limit of the European Union), and predictive values for AB3 at that cutoff point were calculated using Stata v16.1 statistical software (Stata, 2025).
The data collected by the AirBeam device are transmitted via Wi-Fi or 4G cellular communication technologies. The measurements recorded by the AB3 can be viewed, mapped, and graphically displayed in real time through devices running Android or iOS operating systems, as well as via the AirCasting web platform, which is openly accessible.
The longest section of the M30 tunnel, including its access ramps, spans 16.4 km. The measurement of cPM2.5 levels was carried out by driving inside the M30 tunnels with the AB3 device mounted on the exterior of a vehicle. Multiple measurements were conducted at different times during 2024, all on working days. Only data collected between tunnel entry and exit were included.
This study was carried out by several citizens from Madrid's Latina District who voluntarily contributed to this initiative. The date, exact entry and exit times, and exposure duration were recorded for each measurement.
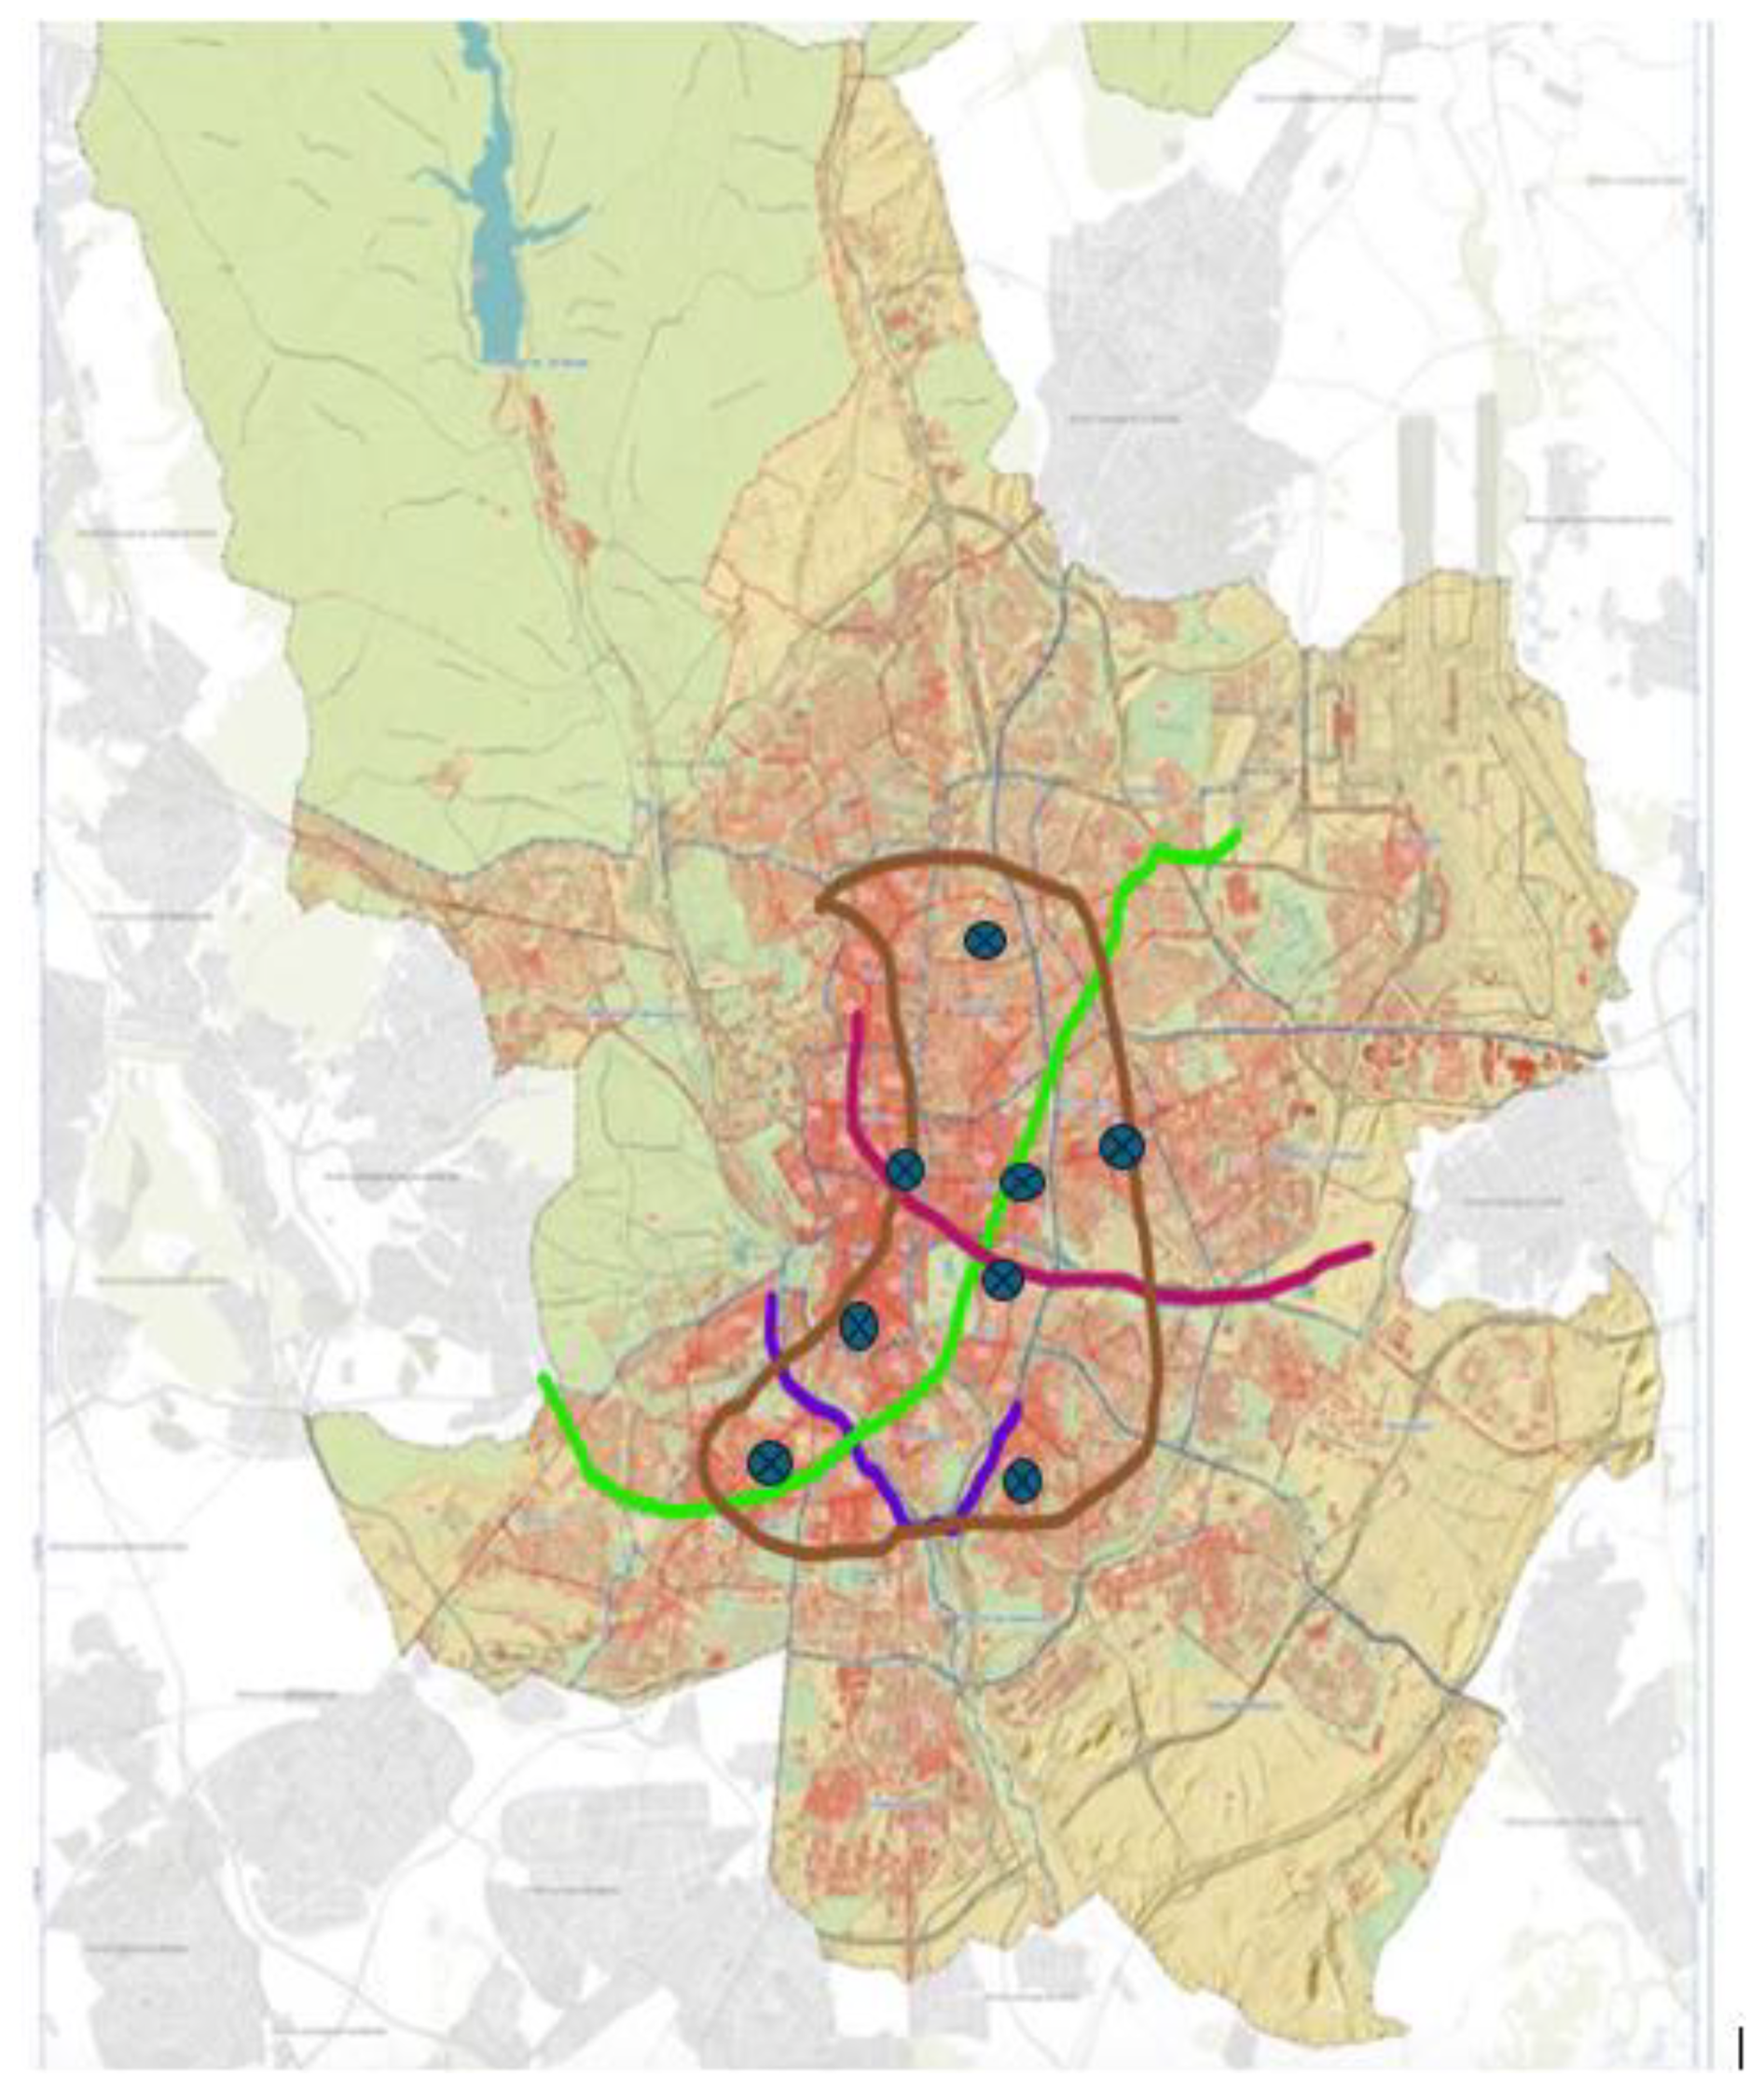
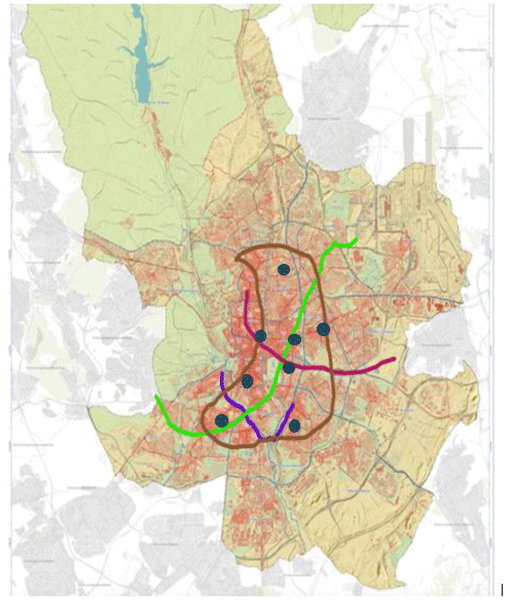
Figure 1Map of the Municipality of Madrid (Geoportal, 2026) showing the location of the M30 road tunnel (blue) and the Madrid Metro lines included in the study. The dots indicate the locations of the nearest government air quality monitoring stations to the areas investigated.
During 2024 and early 2025, additional cPM2.5 measurements were performed on metro platforms and inside train carriages of the Madrid underground network. The same AB3 device was used, handled by different volunteer citizens from the Latina District. For each measurement, the date, time, and exposure duration were documented. All measurements were taken during periods of low utilization.
Figure 1 shows the areas within the Municipality of Madrid where the M30 road tunnel and the Madrid Metro lines included in the study are located, along with the locations of the nearest government air quality monitoring stations to the areas investigated.
According to the World Health Organization (WHO) 2021 report, the recommended annual mean limit for cPM2.5 in ambient air should not exceed 5 µg m−3 (World Health Organization, 2021). In 2024, the European Union set the limit at 10 µg m−3 (Council of the European Union, 2024). The WHO guidelines explicitly state that the limits apply both outdoors and indoors worldwide, covering all environments where people spend time. Nevertheless, clinical effects have been observed even at concentrations below 5 µg m−3 (Wei et al., 2022, 2024; Wei and Schwartz, 2024; Marks, 2022; Bloss, 2021).
3.1 Performance evaluation of a low-cost particulate matter sensor
As the AB3 records data every minute and only 10 min data were available from the governmental station, 10 min averages were obtained from AB3 data using the same notation and method as for official data. A total of 6321 valid and coincident observations were obtained. Models obtained with the training test show small differences between coefficients and their standard errors, and within Pearson correlations. However, F-statistic values were significantly different and show that the optimal model was obtained with PM2.5, temperature, relative humidity (RH), and intercept (Model A). Model B only considers PM2.5 values and intercept, and was also selected because it showed a good performance and was much simpler. The correlation coefficient for 10 min data was 0.92, with a 95 % confidence interval (CI) of 0.921–0.928. The data dispersion and the regression line indicate a good graphical correlation (Fig. 2), although most cPM2.5 values are below 30 µg m−3. The adjusted R-squared was 0.865 (see Performance evaluation and utility of a low-cost particulate matter sensor for use in a citizen science context in the Supplement).

Figure 2Linear regression of PM2.5 concentration data measured concurrently by the AB3 LCS and TEOM (tapered element oscillating microbalance) method.
3.2 M30
A total of 15 routes were conducted inside the M30 tunnels. The cumulative measurement time for cPM2.5 within the tunnel amounted to 3.5 h (Table 1). The mean cPM2.5 concentration was 14.62 µg m−3 (SD 13.5), with a median of 11 µg m−3 and values ranging from 0 to 123 µg m−3.
Table 1Spot measurements of cPM2.5 into road tunnel (M30). Mean travel time through the tunnel: 14 min. SD: standard deviation. PM2.5 concentrations are in µg m−3. RH indicates relative humidity.
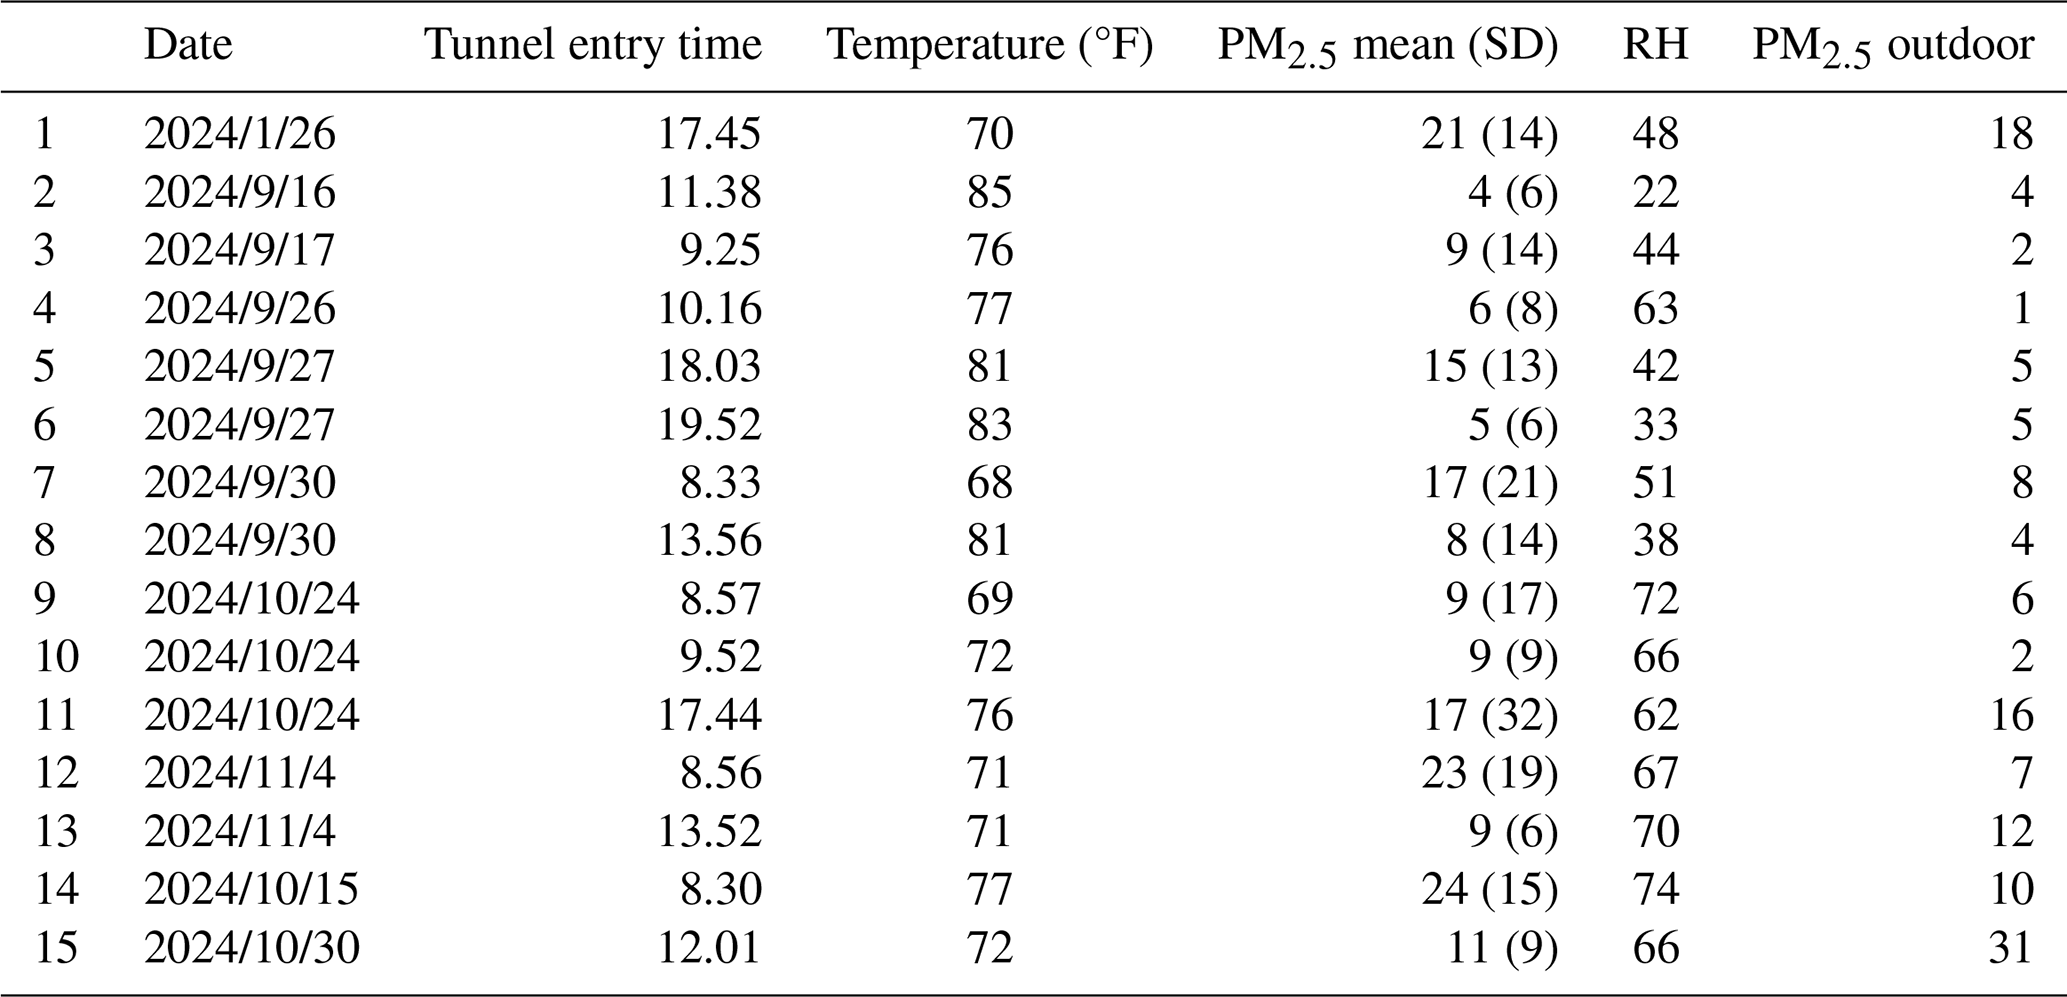
All recordings exhibited a similar pattern: an initial phase showing a mild-to-moderate increase in cPM2.5, followed by a later phase with a marked rise and a sharp decrease upon exiting the tunnel. Based on this behaviour, the cPM2.5 data were divided arbitrarily into two phases (A and B), corresponding respectively to the first and second halves of each tunnel transit. Extreme invalid data (outliers) with abnormally high figures were excluded.
Figure 3 illustrates one of the cPM2.5 measurements obtained inside the M30 (January 2025). The average value recorded was 31.3 µg m−3. At the same time, the nearest outdoor fixed station (M. Álvaro) reported a cPM2.5 level of 10 µg m−3. Throughout the entire tunnel traversal, cPM2.5 exceeded 10 µg m−3, reaching peaks above 50 µg m−3, followed by a rapid drop upon exiting the tunnel.

Figure 3PM2.5 in µg m−3. The ideal annual PM2.5 concentration level from a healthcare perspective is 5 µg m−3 (WHO, 2021). The start and end of a vehicle's journey in the M30 tunnel are marked with two red dots. cPM2.5 concentration trends in M30.
The cPM2.5 in both phases – initial and final – were mean cPM2.5 values of 12.60 (SD 11.3) and 16.64 (SD 15.2) µg m−3, respectively. These differences were statistically significant (p=.000). During 3.3 h of the total 3.8 h (87 %), cPM2.5 levels inside the M30 tunnels surpassed the limit of 5 µg m−3. For approximately 12 min of a 14 min journey, cPM2.5 remained above the limit of 5 µg m−3. Using the threshold of 10 µg m−3, concentrations exceeded this limit for 2 h (45 %) of total tunnel time – equivalent to roughly 6 min of exposure per trip.
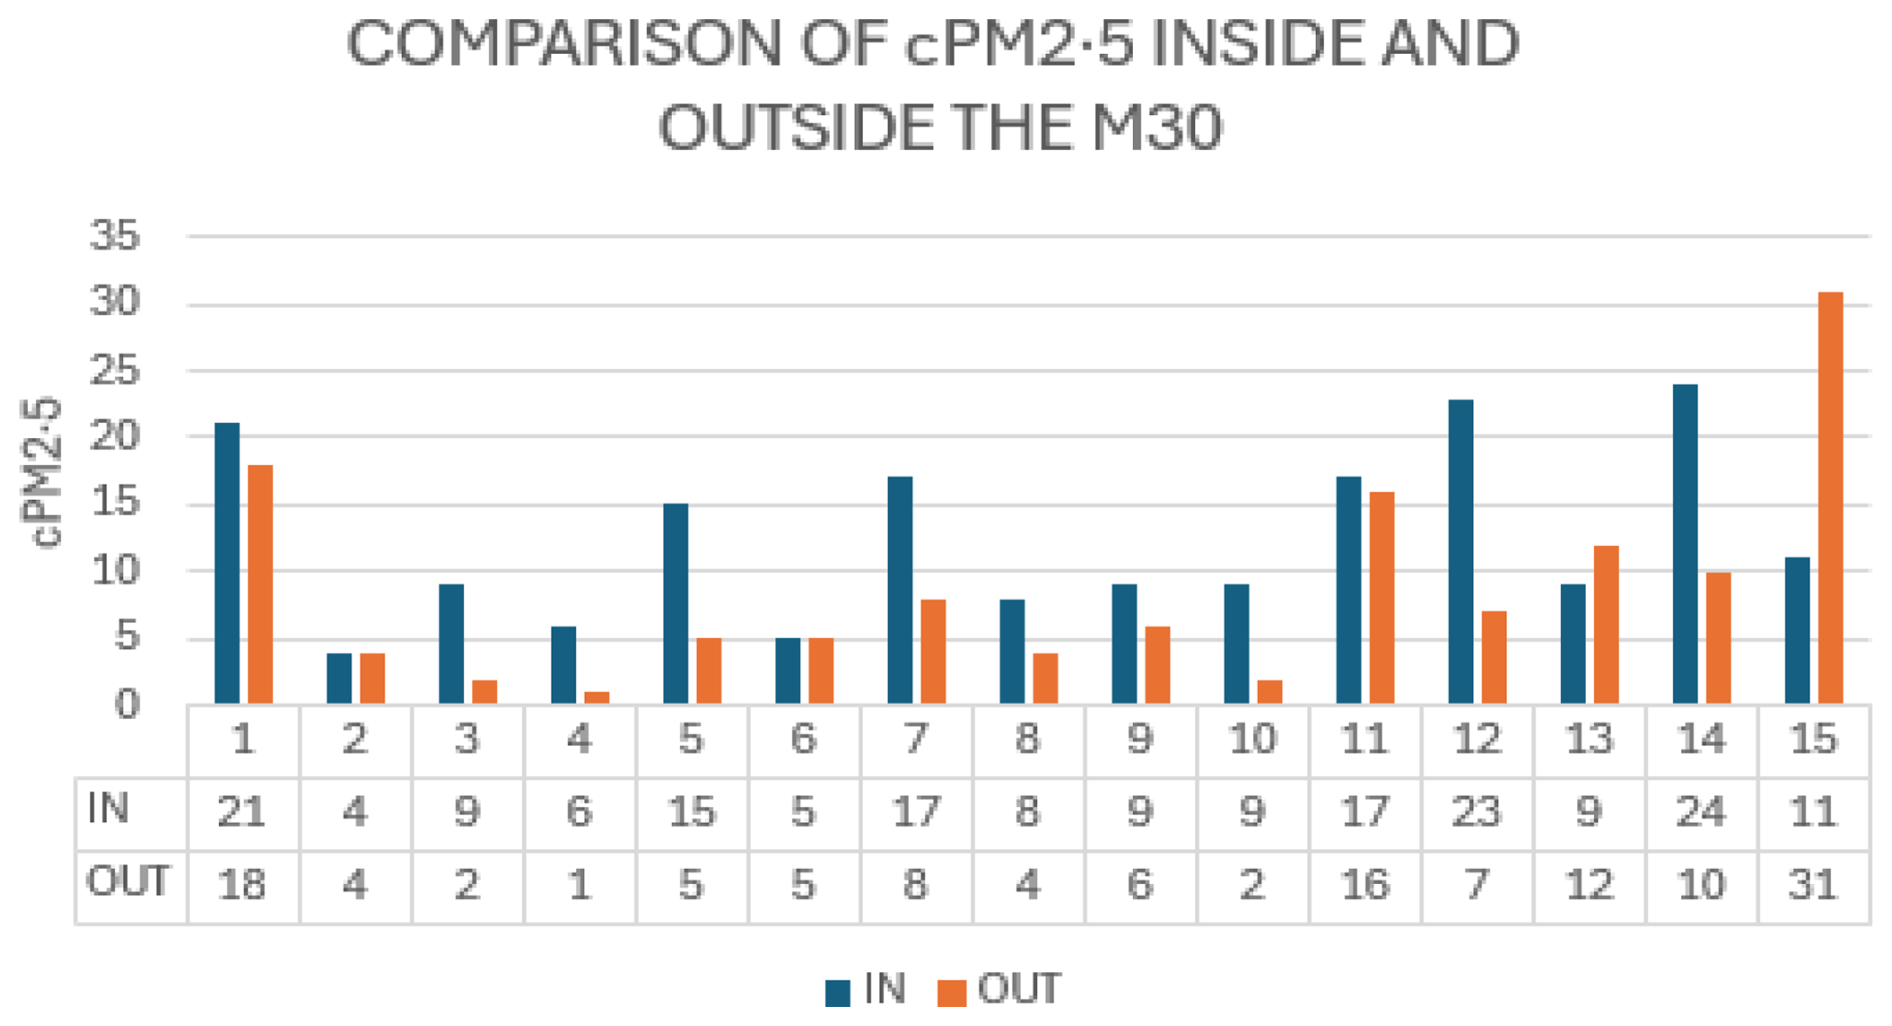
Figure 4 graphically presents the cPM2.5 values measured inside and outside the M30.
On 26 September 2024 (11:00–12:00), the AB3 monitor was placed inside a vehicle travelling along the M30 at a moderate speed, using standard cabin ventilation with windows closed, and without heating or air conditioning. The total journey lasted 21 min. For 6.5 min (31 %), cPM2.5 exceeded 10 µg m−3, and for 9.8 min (47 %), it exceeded 5 µg m−3. At the same time, the nearest external government station reported outdoor cPM2.5 concentrations of between 1 and 4 µg m−3.
On 3 November 2024, a section of the M30 was closed to vehicular traffic and opened to pedestrians. Two of the study authors walked through this section carrying the AB3 device. The measurement started at 09:00 and lasted 88 min. For 47 min (53 %), cPM2.5 levels were above 10 µg m−3, and for 71 min (81 %), at or above 5 µg m−3. Unlike the pattern observed with vehicular traffic, there was no final-phase peak followed by a sharp drop at the exit. At the same time, nearby outdoor stations reported cPM2.5 levels of between 1 and 2 µg m−3. Vehicular traffic had been halted at midnight on 3 November, suggesting that residual pollution persisted in the tunnels for at least 9–10 h afterward.
3.3 Madrid Metro
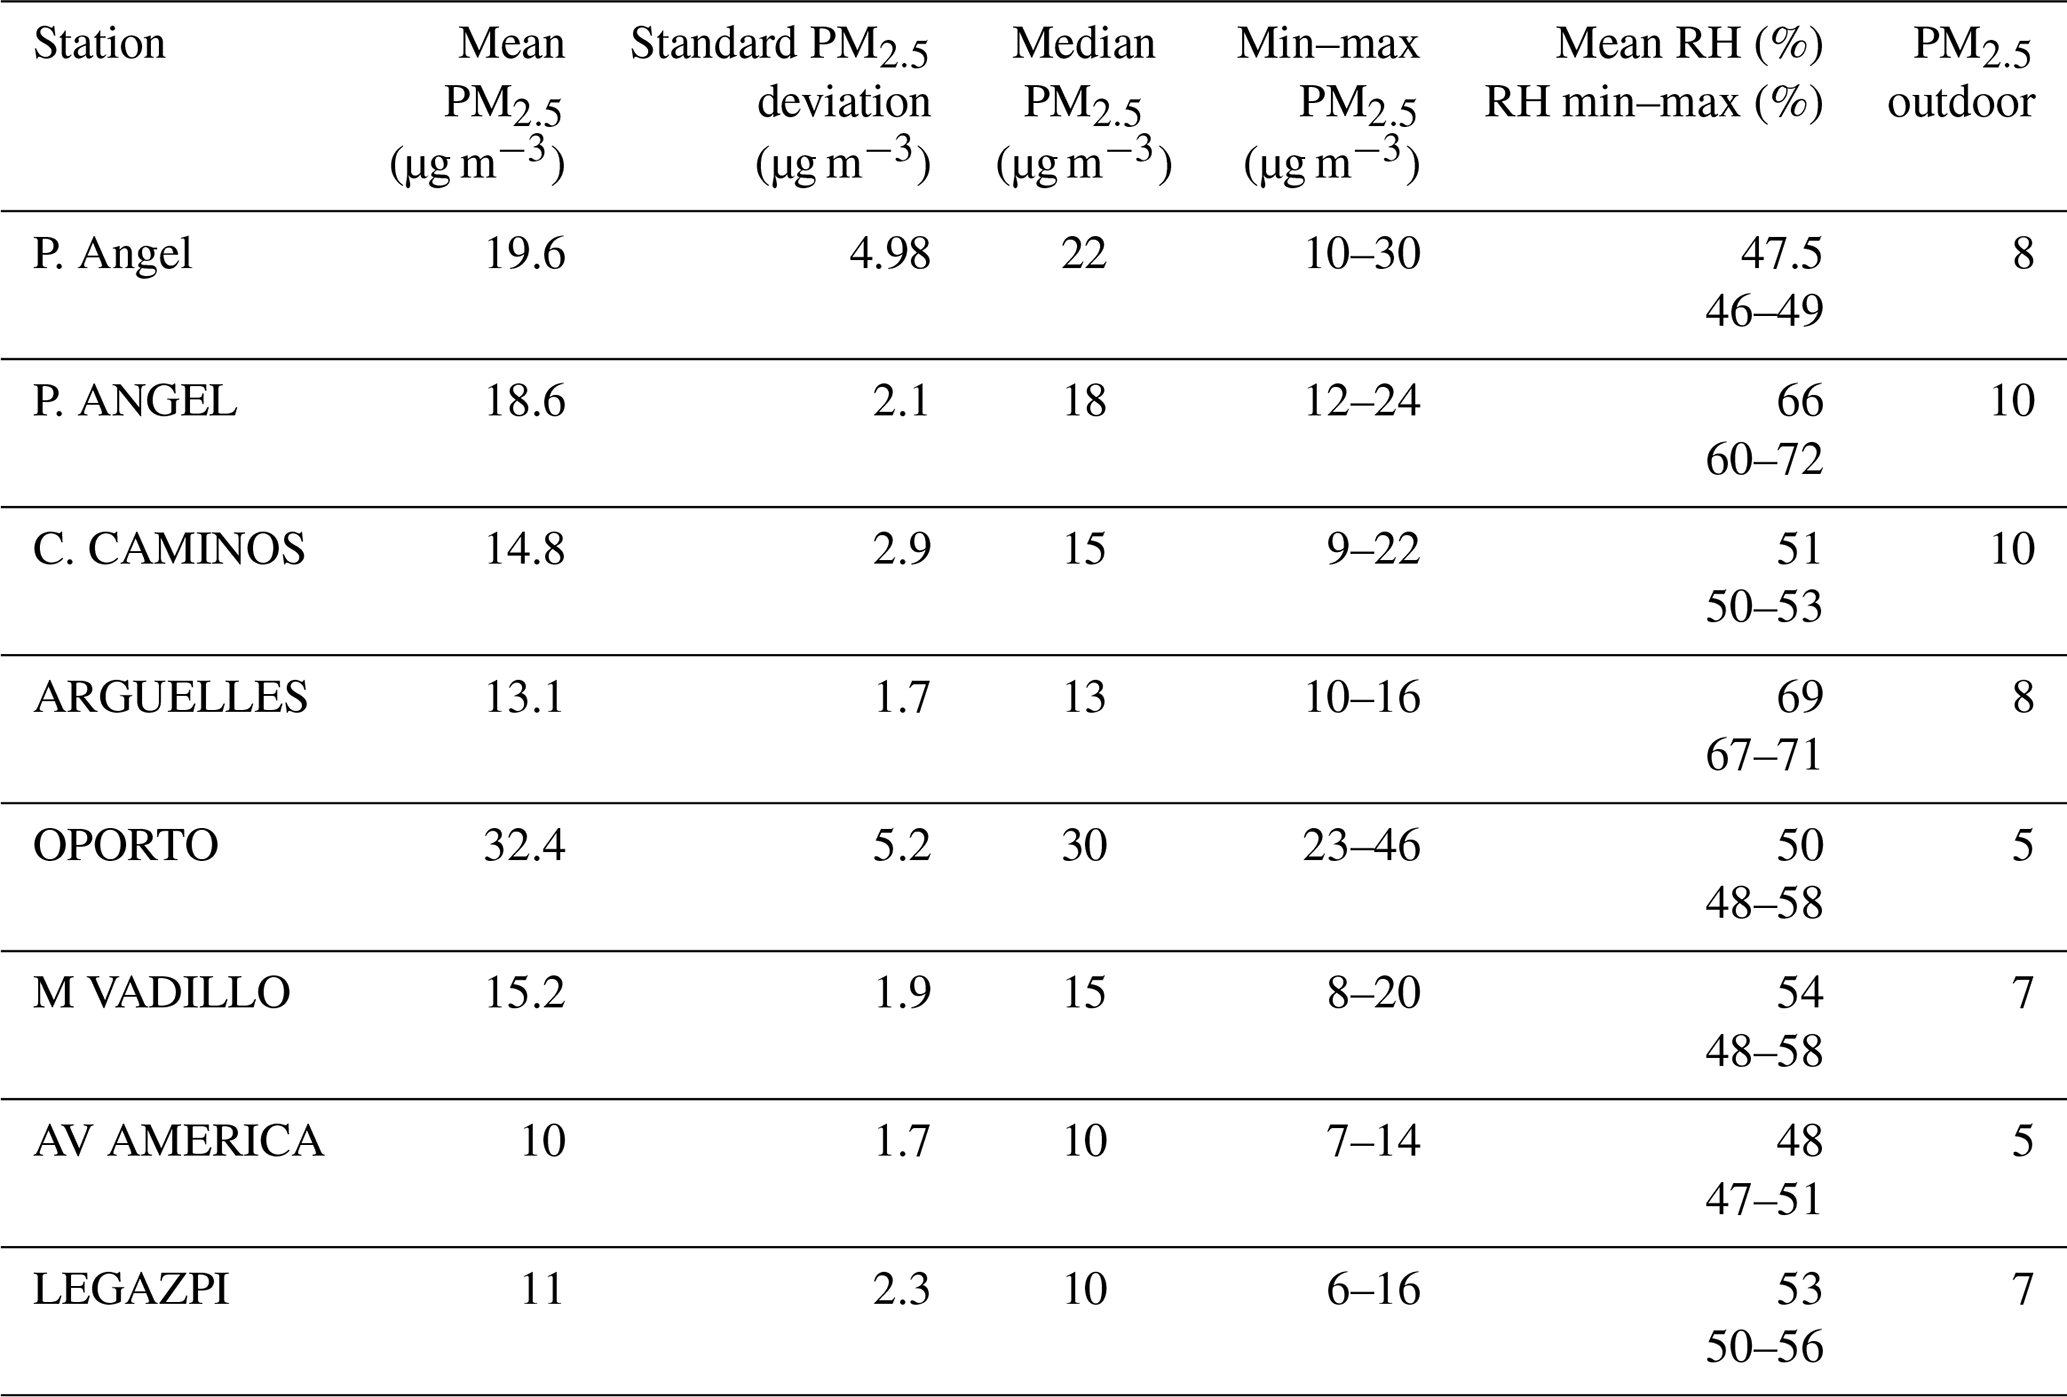
Across all analysed metro platforms in different Madrid stations, mean cPM2.5 was equal to or above 10 µg m−3 (overall mean 20 µg m−3; SD 9), with marked variability. Recorded values ranged from 10 µg m−3 at A. América to 32 µg m−3 at Oporto station (Table 2).
Table 2Spot measurements of cPM2.5 on platforms of the Madrid Metro. PM2.5 concentrations are expressed in micrograms per cubic metre (µg m−3). RH indicates relative humidity. Observation durations are in minutes.
At P. Angel station, monitoring began on the platform and continued until the AB3 reached surface level (Fig. 5). cPM2.5 values decreased from 25 µg m−3 on the platform to 9 µg m−3 upon reaching the surface.
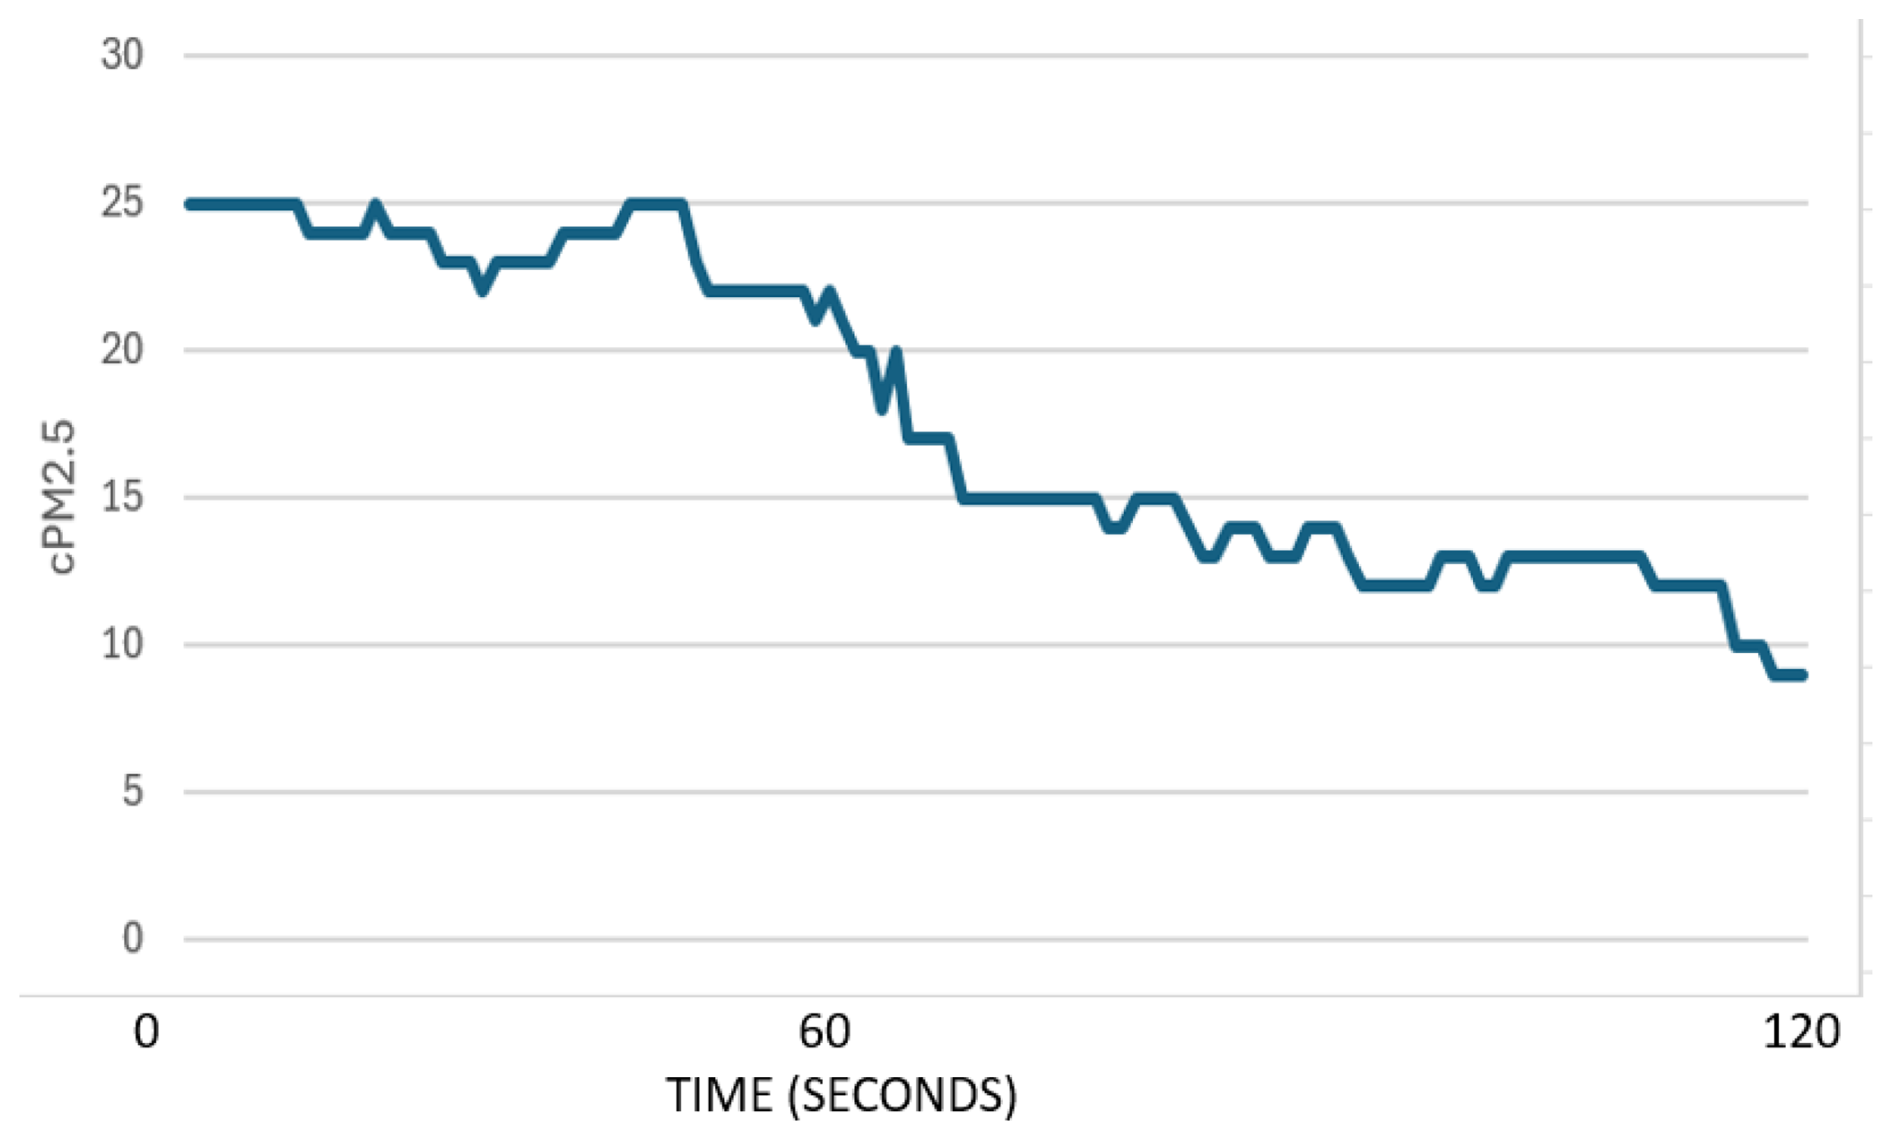
Figure 5cPM2.5 measurements from the platform to the outdoor exit. Initial cPM2.5 data on the platform: 25 µg m−3; final outdoor cPM2.5 data: 9 µg m−3.
Figure 6 graphically presents the different cPM2.5 values measured on the platforms and outdoors. Comparison of the data obtained on the platforms with those measured outdoors showed that the former were consistently higher.
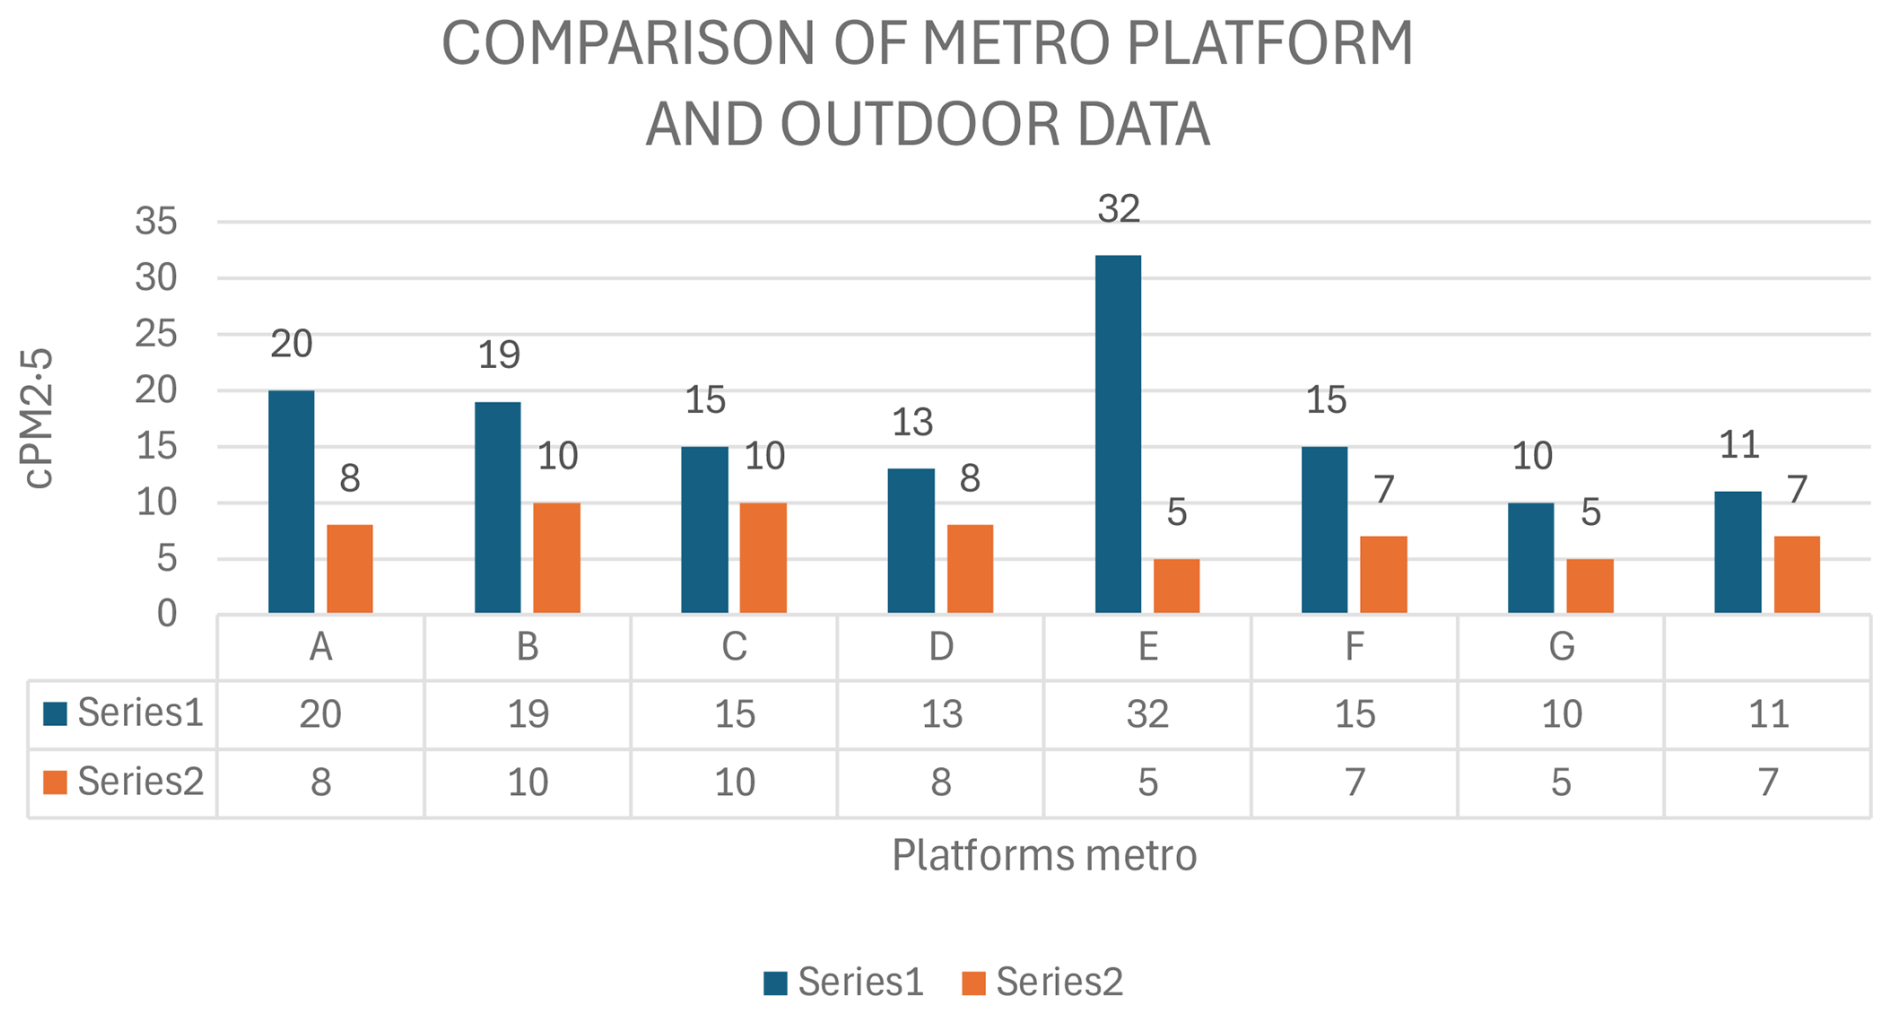
Figure 6cPM2.5 (µg m−3) at the different metro platforms (A, B, etc.) and outdoors. Series 1: Metro. Series 2: Outdoor.
Inside metro carriages, variability was also observed, even on the same day, between different train types. In a train with open inter-car connections, cPM2.5 averaged 13 µg m−3 (range 9–19 µg m−3). In another train with separated cars and excellent ventilation, the mean was 10 µg m−3 (range 8–12 µg m−3). As a reference, the nearest outdoor fixed monitoring station recorded 8 µg m−3 at that time.
A total of 13 spot measurements of varying durations were performed inside metro carriages across several lines. These results are summarized in Table 3. In all cases, concentrations exceeded the limit of 5 µg m−3 (mean 10 µg m−3; SD 5.6), with mean values ranging from 5.8 to 17.8 µg m−3.
Table 3Spot measurements of cPM2.5 inside Madrid Metro train carriages. Observation durations are in minutes. PM2.5 concentrations are in µg m−3.
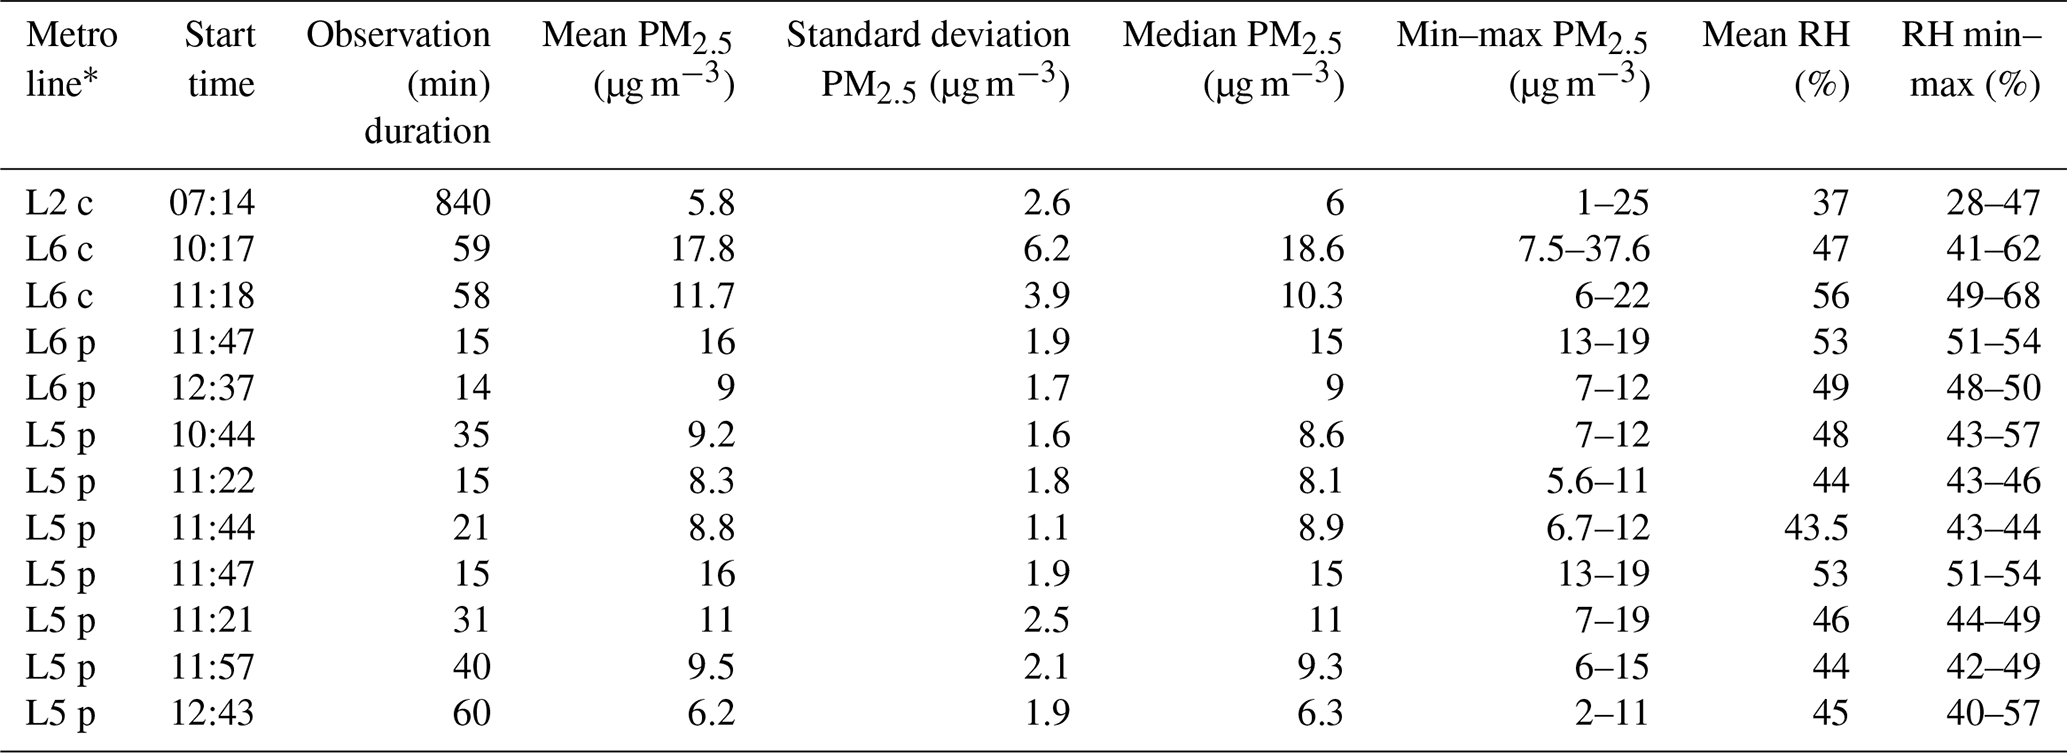
* Partial data collection on the line: p; complete data collection: c. RH: relative humidity (%).
This citizen science study presents multiple measurements of cPM2.5 across different dates and urban environments in Madrid, Spain, addressing the lack of publicly accessible data. Measurements were conducted in the M30 vehicle tunnels and the metro system.
According to the Open Data Portal of the Madrid City Council, cPM2.5 data from the M30 are currently not available for public release (A. López-Encuentra, personal communication, 17 October 2025). Similarly, the Madrid Metro Transparency Portal reports that no cPM2.5 data are available for its facilities (A. López-Encuentra, personal communication, 1 September 2024 and 5 September 2025).
A consistent finding was the variability of results across days and locations, both in the M30 and on metro platforms and inside train carriages.
4.1 M30 tunnel
The average values across multiple measurements indicated a global mean cPM2.5 concentration of 14.6 µg m−3 (SD 13.5). All M30 measurements exhibited the same pattern: an initial mild-to-moderate increase in cPM2.5, followed by a pronounced rise and a sharp decrease at the tunnel exit (Fig. 3). This “piston effect” suggests that polluted air is pushed along the tunnel in the direction of vehicular traffic, potentially exacerbated by uphill driving and acceleration at tunnel exits. These observations align with our findings, showing progressive increases from tunnel entry to exit (Wang et al., 2021).
Previous studies focusing on other objectives allowed direct measurements inside the M30 ventilation gallery (López-de Abajo et al., 2024). Gas concentrations were recorded, but cPM2.5 inside the tunnel could not be measured due to the absence of sensors. Data from the ventilation gallery, collected over 15 d in late 2019, showed cPM2.5 levels averaging 26.74 µg m−3 (max 65, min 1.80). A citizen request in December 2018 for M30 air pollution data via the City Council Open Data Portal received no response, and similar requests in 2025 have also gone unanswered.
Air inside vehicle tunnels typically exhibits higher pollutant concentrations than outdoor air. The clinical significance of short-term exposure remains poorly understood. Some studies have reported respiratory effects in asthmatics and inflammatory or cardiovascular responses after brief exposure to traffic-related tunnel air (Liu et al., 2024).
Of the 15 observations (Fig. 4), the values obtained inside the tunnel were higher than those measured outdoors in 11 cases. However, there was considerable variability in the values.
International studies have documented extremely high cPM2.5 levels in traffic tunnels: 77.2 ± 17.4 µg m−3 in China (Zhao et al., 2021), up to 468 µg m−3 in another Chinese study (Zhou et al., 2014), and 75–160 µg m−3 in Mexico (Zamorategui-Molina et al., 2021). Our values were considerably lower, although they should also be considered in relation to their potential health effects.
In hypertensive patients at high cardiovascular risk, maintaining systolic blood pressure at 120–130 mmHg (compared with 140–150 mmHg) reduces major vascular events (Hudda et al., 2021; Guo et al., 2025). A recent 2 h exposure experiment to traffic-related air pollution demonstrated dose-dependent increases in systolic and diastolic blood pressure, with early responses observable within 20 min (Young et al., 2023), an effect that was reduced with high-efficiency particulate air (HEPA) filtration (Larsson et al., 2007).
Exposure of healthy individuals to traffic-related air pollution in tunnels also induced mild lower airway inflammation and early activation of bronchial epithelial signalling pathways (Qiu et al., 2019).
4.2 Madrid Metro
For the metro, only limited press reports were found on a citizen measurement campaign in 2018 (elDiario.es, 2025; Donostiarrak, 2025; ConBici, 2025).
Our measurements inside Madrid Metro stations and carriages showed high variability, influenced by factors such as platform ventilation and train type. In general, platform concentrations were higher (100 %>10 µg m−3) than inside carriages (100 %>5 µg m−3).
Comparison of the data obtained on the platforms with those measured outdoors (Fig. 6) showed that the former were consistently higher.
Except for maintenance workers inside tunnels or metro staff, most users experience short and limited exposure each time they enter the platforms, although exposure inside metro cars is usually longer.
Air pollutant levels inside subway tunnels have been more extensively studied both within and outside Spain. Critical reviews indicate that subway tunnel air pollution can be more harmful to health than outdoor air (Zhao et al., 2017). Concentrations inside tunnels were reported as 2–14 times higher than outdoors; and inside train carriages, cPM2.5 ranged from 18 to 36 µg m−3.
cPM2.5 is higher in underground environments due to poor ventilation and frequent train traffic (Cartenì et al., 2015), with deeper stations showing higher particle levels (Figueroa-Lara et al., 2019). In Canada, studies of subway PM2.5 composition identified iron (Fe) as the dominant component (Van Ryswyk et al., 2017). In the USA, cPM2.5 levels in underground systems of various cities were extremely high: 779 ± 249, 548 ± 207, 341 ± 147, 327 ± 136, and 112 ± 46.7 µg m−3, compared with outdoor levels of 20.8 ± 9.3, 24.1 ± 9.3, 12.0 ± 7.8, 10.0 ± 2.7, and 12.6 ± 12.6 µg m−3, respectively (Luglio et al., 2021). Coal and iron accounted for approximately 80 % of subway PM2.5.
In the London Underground, annual cPM2.5 measurements are publicly available for both platforms and driver cabins (Smith et al., 2020). Mean subway concentrations were 88 µg m−3, compared with 22 µg m−3 outdoors (Smith et al., 2020), with iron oxide representing 47 % of the particulate composition.
Subway dust is considered more toxic than outdoor PM, inducing higher genotoxicity in cultured human lung cells (Loxham and Nieuwenhuijsen, 2019), likely due to its high iron content. Although in vivo evidence is limited, in vitro studies confirm significant toxicity. Its toxicity has been compared to welding fumes (Loxham and Nieuwenhuijsen, 2019; Health and Safety Executive, 2025).
Occupational exposure in the metro shows mixed results. London Underground staff exposed to high PM levels did not exhibit clear associations with absenteeism (Mak et al., 2024). However, highly exposed employees in the Stockholm underground showed elevated cardiovascular risk markers compared with low-exposure staff (Bigert et al., 2008).
In Barcelona, subway cPM2.5 levels inside trains ranged from 11 to 32 µg m−3, whereas platforms were higher, averaging 46 µg m−3 (Line 9) and 125 µg m−3 (Line 3) (Querol et al., 2012). Our results were similar to the difference between the concentrations measured on the platforms and those measured inside the carriages.
For an annual average outdoor cPM2.5 level of 19 µg m−3 (Madrid, 2003–2005), the relative risk (RR) of daily overall respiratory mortality was 1.028 (1.004–1.052), occurring at lag 1 for respiratory failure, and RR was 1.082 (1.012–1.151) (Guaita et al., 2011).
Variability in cPM2.5 may be attributed to differences in ventilation, air conditioning, wheel and braking materials, seasonal changes, and passenger density (Moreno et al., 2014), with an estimated increase of 0.4 µg m−3 per passenger during peak hours (Xu et al., 2016). Concentrations tend to be lower in summer due to increased ventilation to reduce platform temperature. Multiple regression analyses suggest that in-vehicle pollutant concentrations are mainly influenced by roadside levels, temperature, and ventilation settings (Transport for London, 2024).
Several limitations apply to this study. The most significant is the lack of continuous data across multiple days, stations, weather conditions, traffic intensity, and vehicle speeds in the M30 and metro. Instead, numerous spot measurements were collected at different times and months.
In metro environments, PM2.5 is often dominated by iron-rich dust. The AB3 sensor shows a −83 % bias when measuring welding smoke (Sousan et al., 2017), which is chemically analogous to the hematite present in tunnels. To date, no published studies have evaluated the reliability of optical sensors such as the AB3 for assessing iron-rich PM2.5, highlighting the need for future measurements to employ validated non-optical methods to ensure accuracy. If such an extreme bias truly reflects real-world conditions, the degree of underestimation in our data would be even more concerning.
The health risks of short-term exposure to cPM2.5 for 15–20 min remain uncertain due to the lack of targeted studies. Accumulation and repeated high exposures over days, weeks, or months are assumed to have a greater health impact. Epidemiologically, even short exposures can have significant public health consequences if large populations are affected. In 2023, 374 million vehicles circulated on the M30, and 662 million passengers used the Madrid Metro, including sensitive individuals such as the elderly, children, pregnant women, and individuals with chronic cardiopulmonary diseases (Hernandez et al., 2025).
To the best of our knowledge, this is the first measurement of cPM2.5 concentrations in the M30 road tunnel and the Madrid Metro (Spain). In the M30 road tunnel, mean PM2.5 increased from 12.62 µg m−3 (SD 11.3) in the first half of the journey to 16.6 µg m−3 (SD 15.2) in the second half (p<0.001). On metro platforms, concentrations exceeded 10 µg m−3 (mean 20 µg m−3; range 10–32), while inside carriages levels remained above 5 µg m−3 (mean 10 µg m−3; range 5.8–17.8).
Substantial international evidence indicates excessive cPM2.5 pollution inside urban tunnels with high vehicle traffic and within metro systems. Official data for cPM2.5 in Madrid's M30 and metro were unavailable to the authors. However, the spot measurements presented here demonstrate that cPM2.5 may have health implications, particularly for susceptible populations.
The deployment of cPM2.5 monitors in urban tunnels with heavy traffic, as well as on metro platforms and inside train carriages, is recommended. Measuring pollutant concentrations in these environments is justified by high vehicle and passenger flows, and by estimates of preventable mortality in Madrid (López-Encuentra et al., 2025). The resulting data should be publicly available to inform users and protected when necessary. If cPM2.5 exceeds thresholds, corrective measures must be implemented accordingly.
Citizen science study of fine particulate matter air pollution inside road tunnels and the Madrid Metro (Spain) https://doi.org/10.5281/zenodo.22833044 (Lopez-Encuentra, 2026).
The supplement related to this article is available online at https://doi.org/10.5194/ar-4-547-2026-supplement.
All authors contributed to the study design, data analysis and interpretation, and manu-script preparation. Angel Lopez-Encuentra coordinated the study and led the preparation and revision of the manuscript. All authors critically reviewed the manuscript, contributed to its revision, and approved the final version for publication.
The contact author has declared that none of the authors has any competing interests.
Publisher's note: Copernicus Publications remains neutral with regard to jurisdictional claims made in the text, published maps, institutional affiliations, or any other geographical representation in this paper. The authors bear the ultimate responsibility for providing appropriate place names. Views expressed in the text are those of the authors and do not necessarily reflect the views of the publisher.
Coordinadora Vecinal Distrito Latina (COVELA), Madres por el Clima Lourdes and citizen science contributors: Inés López Pérez, Elia Pozo, Alba López Tinahones, Raquel Piqueras, Francisco José García, Miguel Angel Pavón Morales, and Carlos FG.
This paper was edited by Evangelia Diapouli and reviewed by two anonymous referees.
Advisory Committee on Tunnel Air Quality: Criteria for in-tunnel and ambient air quality, NSW Chief Scientist & Engineer, November 2018, https://www.chiefscientist.nsw.gov.au/independent-reports/tunnel-air-quality (last access: 2 October 2025), 2018.
Ayuntamiento de Madrid: Calidad del aire de los túneles de la M-30, https://mc30.es/servicios/seguridad/instalaciones/ (last ccess: 1 October 2026), 2026a.
Ayuntamiento de Madrid: Portal de datos abiertos, Calidad del aire, Estaciones de control, https://datos.madrid.es/portal/site/egob/menuitem.c05c1f754a33 (last access: 26 September 2026), 2026b.
Bigert, C., Alderling, M., Svartengren, M., Plato, N., de Faire, U., and Gustavsson, P.: Blood markers of inflammation and coagulation and exposure to airborne particles in employees in the Stockholm underground, Occup. Environ. Med., 65, 655–658, https://doi.org/10.1136/oem.2007.038273, 2008.
Bland, J. M. and Altman, D. G.: Statistical methods for assessing agreement between two methods of clinical measurement, Lancet, 1, 307–310, https://doi.org/10.1016/S0140-6736(86)90837-8, 1986.
Bloss, W.: Air pollution: science shows there's no safe limit – here's how laws must change, The Conversation, https://theconversation.com/air-pollution-science-shows-theres-no-safe-limit-heres-how-laws-must-change-167223 (last access: 2 October 2025), 2021.
Cartenì, A., Cascetta, F., and Campana, S.: Underground and ground-level particulate matter concentrations in an Italian metro system, Atmos. Environ., 101, 328–337, https://doi.org/10.1016/j.atmosenv.2014.11.030, 2015.
ConBici: ¿Es saludable la calidad del aire en el Metro de Madrid?, https://conbici.org/noticias/noticias-nacionales/es-saludable-la-calidad-del-aire-en-el-metro-de-madrid, last access: 1 October 2025.
Council of the European Union: Air quality: Council ready to start talks with Parliament on new rules to strengthen standards in the EU, https://eur-lex.europa.eu/legal-content/ES/TXT/PDF/?uri=OJ:L_202402881 (last access: 2 October 2025), 2024.
del Rey Llorente, I., Espinosa Antelo, I., and Alarcón Álvarez, E.: Criterios de seguridad en los túneles de la Calle 30, Sistemas de ventilación, Rev. Obras Públicas, 3454, 59–70, 2005.
Donostiarrak: Contaminación por partículas PM2.5 en el interior del Metro y la Gran Vía de Madrid, https://www.donostiarrak.com/es/content/contaminacion-por-particulas-pm25-en-el-interior-del-metro-y-la-gran-de-madrid, last access: 1 October 2025.
elDiario.es: Los viajeros del Metro de Madrid respiran hasta cinco veces más contaminación que en el exterior, https://www.eldiario.es/madrid/viajeros-metro-madrid-respiran-contaminacion_1_1657096.html, last access: 1 October 2025.
EMESA M-30: Proyecto de renovación del Centro de Control de Madrid Calle 30, https://www.emesa-m30.es/renovacion-centro-de-control-de-madrid-calle-30/, last access: 1 October 2025.
Envira: Metro de Madrid utiliza tecnología IoT para monitorizar la calidad del aire, https://envira.es/metro-de-madrid-utiliza-tecnologia-iot-para-monitorizar-la-calidad-del-aire/, last access: 1 October 2025.
Figueroa-Lara, J. J., Murcia-González, J. M., García-Martínez, R., Romero-Romo, M., Torres Rodríguez, M., and Mugica-Álvarez, V.: Effect of platform subway depth on the presence of airborne PM2.5, metals, and toxic organic species, J. Hazard. Mater., 377, 427–436, https://doi.org/10.1016/j.jhazmat.2019.05.091, 2019.
Froeling, F., Gignac, F., Toran, R., Ortiz, R., Ficorilli, A., De Marchi, B., Biggeri, A., Kocman, D., Ftičar, J., Snoj Tratnik, J., Andrusaityte, S., Grazuleviciene, R., Errandonea, L., Vermeulen, R., Hoek, G., and Basagaña, X.: Implementing co-created citizen science in five environmental epidemiological studies in the CitieS-Health project, Environ. Res., 240, 117469, https://doi.org/10.1016/j.envres.2023.117469, 2024.
Guaita, R., Pichiule, M., Maté, T., Linares, C., and Díaz, J.: Short-term impact of particulate matter (PM2.5) on respiratory mortality in Madrid, Int. J. Environ. Heal. R., 21, 260–274, https://doi.org/10.1080/09603123.2010.544033, 2011.
Guo, X., Sun, G., Xu, Y., Zhou, S., Song, Q., Li, Y., Ouyang, N., Li, G., Cheng, Z., Ye, N., Wang, J., Zhou, Y., Yang, H., Shi, C., Wang, C., Liu, S., Zhu, W., Moran, A. E., Ning, G., Bi, Y., Wang, W., Cai, J., Li, J., and Sun, Y.: BPRULE Study Group, Benefit–harm trade-offs of intensive blood pressure control versus standard blood pressure control on cardiovascular and renal outcomes: an individual participant data analysis of randomized controlled trials, The Lancet, 406, 1009–1019, https://doi.org/10.1016/S0140-6736(25)01391-1, 2025.
Health and Safety Executive: Health risks from welding, https://www.hse.gov.uk/welding/health-risks-welding.htm, last access: 1 October 2025.
Hernandez, H., Santamaria-Garcia, H., Moguilner, S., Farina, F. R., Legaz, A., Prado, P., Cuadros, J., Gonzalez, L., Gonzalez-Gomez, R., Migeot, J., Coronel-Oliveros, C., Tagliazucchi, E., Maito, M. A., Godoy, M. E., Cruzat, J., Shaheen, A., Farombi, T., Salazar, D., Da Ros, L. U., Borelli, W. V., Zimmer, E. R., Njamnshi, A. K., Bajpai, S., Dey, A. B., Mostert, C., Merali, Z., Salama, M., Moustafa, S. A., Fittipaldi, S., Altschuler, F., Medel, V., Huepe, D., Yaffe, K., Momoh, C., Eyre, H. A., Swieboda, P., Lawlor, B., Miranda, J. J., Duran-Aniotz, C., Baez, S., C., and Ibanez, A.: The exposome of healthy and accelerated aging across 40 countries, Nat. Med., 31, 3089–3100, https://doi.org/10.1038/s41591-025-03808-2, 2025.
Hudda, N., Eliasziw, M., Hersey, S. O., Reisner, E., Brook, R. D., Zamore, W., Durant, J. L., and Brugge, D.: Effect of reducing ambient traffic-related air pollution on blood pressure: a randomized crossover trial, Hypertension, 77, 823–832, https://doi.org/10.1161/HYPERTENSIONAHA.120.15580, 2021.
Jiang, N., Lv, Z., Zhang, R., Zhu, R., and Qu, G.: Characteristics, source analysis, and health risk of PM2.5 in the urban tunnel environment associated with E10 petrol usage, Environ. Sci. Pollut. Res., 31, 30454–30466, https://doi.org/10.1007/s11356-024-33194-0, 2024.
Kampa, M. and Castanas, E.: Human health effects of air pollution, Environ. Pollut., 151, 362–367, https://doi.org/10.1016/j.envpol.2007.06.012, 2008.
Kubis, K., Edwards, J., and Ryan, P. H.: Ambient and personal air monitoring using low-cost sensors to identify elevated air pollution in vulnerable communities, Sci. Total Environ., 1032, 181837, https://doi.org/10.1016/j.scitotenv.2026.181837, 2026.
Larsson, B.-M., Sehlstedt, M., Grunewald, J., Sköld, C. M., Lundin, A., Blomberg, A., Sandström, T., Eklund, A., and Svartengren, M.: Road tunnel air pollution induces bronchoalveolar inflammation in healthy subjects, Eur. Respir. J., 29, 699–705, https://doi.org/10.1183/09031936.00035706, 2007.
Liu, J., Li, Y., Ge, J., Yan, X., Zhang, H., Zheng, X., Lu, J., Li, X., Gao, Y., Lei, L., Liu, J., Li, J., and ESPRIT Collaborative Group: Lowering systolic blood pressure to less than 120 mm Hg versus less than 140 mm Hg in patients with high cardiovascular risk with and without diabetes or previous stroke: an open-label, blinded-outcome, randomised trial, Lancet, 404, 245–255, https://doi.org/10.1016/S0140-6736(24)01028-6 2024.
Lopez-Encuentra, A.: Inhalation of small particles (PM2.5) in urban road tunnels 1 and underground in madrid (spain), a citizen science project, Zenodo [data set], https://doi.org/10.5281/zenodo.22833045, 2026.
López-de Abajo, L., Alberti, M. G., and Gálvez, J. C.: Pollutant concentration prediction from traffic data analysis for concrete durability studies in Madrid Calle 30 urban tunnels, Tunn. Undergr. Sp. Tech., 144, 105477, https://doi.org/10.1016/j.tust.2023.105477, 2024.
López-Encuentra, A., Gil Cid, E., Abraira, V., and Pozo Coronado, L. M.: Avoidable mortality burden attributable to PM2.5 in Madrid (Spain), Open Respir. Arch., 7, 100494, https://doi.org/10.1016/j.opresp.2025.100494, 2025.
Loxham, M. and Nieuwenhuijsen, M. J.: Health effects of particulate matter air pollution in underground railway systems: a critical review of the evidence, Part. Fibre Toxicol., 16, 12, https://doi.org/10.1186/s12989-019-0296-2, 2019.
Luglio, D. G., Katsigeorgis, M., Hess, J., Kim, R., Fine, J., Thurston, G., Gordon, T., and Vilcassim, M. J. R.: PM2.5 concentration and composition in subway systems in the Northeastern United States, Environ. Health Persp., 129, 027001, https://doi.org/10.1289/EHP7202, 2021.
Luglio, D. G., Huynh, T., Saporito, A., and Gordon, T.: Investigation of a river-tunnel effect on PM2.5 concentrations in New York City subway stations, Transp. Res. D Transp. Environ., 115, 103579, https://doi.org/10.1016/j.trd.2022.103579, 2023.
Ma, Y., Nobile, F., Marb, A., Dubrow, R., Stafoggia, M., Breitner, S., Kinney, P. L., and Chen K.: Short-term exposure to fine particulate matter and nitrogen dioxide and mortality in 4 countries, JAMA Netw. Open, 7, e2354607, https://doi.org/10.1001/jamanetworkopen.2023.54607, 2024.
Mak, J., Feary, J., Amaral, A. F. S., Marczylo, E., Cullinan, P., and Green, D. C.: Occupational exposure to particulate matter and staff sickness absence on the London underground, Environ. Int., 185, 108529, https://doi.org/10.1016/j.envint.2024.108529, 2024.
Manisalidis, I., Stavropoulou, E., Stavropoulos, A., and Bezirtzoglou, E.: Environmental and health impacts of air pollution: a review, Front. Public Health, 8, 14, https://doi.org/10.3389/fpubh.2020.00014, 2020.
Marks, G. B.: Misuse of pollution reference standards: no safe level of air pollution, Am. J. Resp. Crit. Care, 205, 984–985, https://doi.org/10.1164/rccm.202201-0160ED, 2022.
Martins, V., Moreno, T., Minguillón, M. C., van Drooge, B. L., Reche, C., Amato, F., de Miguel, E., Capdevila, M., Centelles, S., and Querol, X.: Origin of inorganic and organic components of PM2.5 in subway stations of Barcelona, Spain, Environ. Pollut., 208, 125–136, https://doi.org/10.1016/j.envpol.2015.07.004, 2016.
Miller, M. R. and Newby, D. E.: Air pollution and cardiovascular disease: car sick, Cardiovasc. Res., 116, 279–294, https://doi.org/10.1093/cvr/cvz228, 2020.
Moreno, T., Pérez, N., Reche, C., Martins, V., de Miguel, E., Capdevila, M., Centelles, S., Minguillón, M. C., Amato, F., Alastuey, A., Querol, X., and Gibbons, W.: Subway platform air quality: assessing the influences of tunnel ventilation, train piston effect and station design, Atmos. Environ., 92, 461–468, https://doi.org/10.1016/j.atmosenv.2014.04.043, 2014.
Moreno, T., Reche, C., Rivas, I., Cruz Minguillón, M., Martins, V., Vargas, C., Buonanno, G., Parga, J., Pandolfi, M., Brines, M., Ealo, M., Sofia Fonseca, A., Amato, F., Sosa, G., Capdevila, M., de Miguel, E., Querol, X., and Gibbons, W.: Urban air quality comparison for bus, tram, subway and pedestrian commutes in Barcelona, Environ. Res., 142, 495–510, https://doi.org/10.1016/j.envres.2015.07.022, 2015.
Nieuwenhuijsen, M., Gómez-Perales, J. E., and Colvile, R. N.: Levels of particulate air pollution, its elemental composition, determinants and health effects in metro systems, Atmos. Environ., 41, 7995–8006, https://doi.org/10.1016/j.atmosenv.2007.08.002, 2007.
Orellano, P., Reynoso, J., Quaranta, N., Bardach, A., and Ciapponi, A.: Short-term exposure to particulate matter (PM10 and PM2.5), nitrogen dioxide (NO2), and ozone (O3) and all-cause and cause-specific mortality: systematic review and meta-analysis, Environ. Int., 142, 105876, https://doi.org/10.1016/j.envint.2020.105876, 2020.
Pérez-Prada, F. and Monzón, A.: How lowering speed limits in an urban highway affects traffic performance and emissions: the case of Madrid M-30 ring-road, in: XI Congreso de Ingeniería del Transporte (CIT 2014), 1–16, https://oa.upm.es/31150/ (last access: 2 October 2025), 2014.
Qiu, Z., Liu, W., Gao, H. O., and Li, J.: Variations in exposure to in-vehicle particle mass and number concentrations in different road environments, J. Air Waste Manag. Assoc., 69, 988–1002, https://doi.org/10.1080/10962247.2019.1629357, 2019.
Querol, X., Moreno, T., Karanasiou, A., Reche, C., Alastuey, A., Viana, M., Font, O., Gil, J., de Miguel, E., and Capdevila, M.: Variability of levels and composition of PM10 and PM2.5 in the Barcelona metro system, Atmos. Chem. Phys., 12, 5055–5076, https://doi.org/10.5194/acp-12-5055-2012, 2012.
R Core Team: R: A language and environment for statistical computing, R Foundation for Statistical Computing, Vienna, Austria, https://web.mit.edu/r_v3.4.1/fullrefman.pdf (last access: 2 November 2026), 2024.
Skerker, J.: The contribution of highway tunnels to airborne particle concentrations in an urban area, Senior Honors Thesis, Tufts University, School of Engineering, Department of Civil and Environmental Engineering, 2017.
Smith, J. D., Barratt, B. M., Fuller, G. W., Kelly, F. J., Loxham, M., Nicolosi, E., Priestman, M., Tremper, A. H., and Green, D. C.: PM2.5 on the London Underground, Environ. Int., 134, 105188, https://doi.org/10.1016/j.envint.2019.105188, 2020.
Sousan, S., Koehler, K., Hallett, L., and Peters, T. M.: Evaluation of consumer monitors to measure particulate matter, J. Aerosol Sci., 107, 123–133, https://doi.org/10.1016/j.jaerosci.2017.02.013, 2017.
Sun, Y., Milando, C. W., Spangler, K. R., Wei, Y., Schwartz, J., Dominici, F., Nori-Sarma, A., Sun, S., and Wellenius, G. A.: Short-term exposure to low level ambient fine particulate matter and natural cause, cardiovascular, and respiratory morbidity among US adults with health insurance: case time series study, BMJ, 384, e076322, https://doi.org/10.1136/bmj-2023-076322, 2024.
Stata: Statistical software, https://www.stata.com/, last access: 26 October 2025.
Svartengren, M., Strand, V., Bylin, G., Järup, L., and Pershagen, G.: Short-term exposure to air pollution in a road tunnel enhances the asthmatic response to allergen, Eur. Respir. J., 15, 716–724, https://doi.org/10.1034/j.1399-3003.2000.15d15.x, 2000.
Transport for London: Airborne dust monitoring at selected London Underground train stations, https://content.tfl.gov.uk/station-dust-monitoring-july-august-2024.pdf (last access: 2 October 2025), 2024.
Van Ryswyk, K., Anastasopolos, A. T., Evans, G., Sun, L., Sabaliauskas, K., Kulka, R., Wallace, L., and Weichenthal, S.: Metro commuter exposures to particulate air pollution and PM2.5-associated elements in three Canadian cities: the Urban Transportation Exposure Study, Environ. Sci. Technol., 51, 5713–5720, https://doi.org/10.1021/acs.est.6b05775, 2017.
Vanbrabant, K., Van Dam, D., Bongaerts, E., Vermeiren, Y., Bové, H., Hellings, N., Ameloot, M., Plusquin, M., De Deyn, P. P., and Nawrot, T. S.: Accumulation of ambient black carbon particles within key memory-related brain regions, JAMA Netw. Open, 7, e245678, https://doi.org/10.1001/jamanetworkopen.2024.5678, 2024.
Vohland, K., Land-Zandstra, A., Ceccaroni, L., Lemmens, R., Perelló, J., Ponti, M., Samson, R., and Wagenknecht, K.: The science of citizen science, Springer, Cham, Switzerland, https://doi.org/10.1007/978-3-030-58278-4, 2021.
Wang, W.-C., Dat, N. D., Chi, K.-H., and Chang, M.-B.: Characterization of PM2.5 and particulate PAHs emitted from vehicles via tunnel sampling in different time frames, Aerosol Air Qual. Res., 21, 210074, https://doi.org/10.4209/aaqr.210074, 2021.
Wei, Y., Qiu, X., Sabath, M. B., Yazdi, M. D., Yin, K., Li, L., Peralta, A. A., Wang, C., Koutrakis, P., Zanobetti, A., Dominici, F., and Schwartz, J. D.: Air pollutants and asthma hospitalization in the Medicaid population, Am. J. Resp. Crit. Care, 205, 1075–1083, https://doi.org/10.1164/rccm.202107-1596OC, 2022.
Wei, Y., Feng, Y., Danesh Yazdi, M., Yin, K., Castro, E., Shtein, A., Qiu, X., Peralta, A. A., Coull, B. A., Dominici, F., and Schwartz, J.: Exposure-response associations between chronic exposure to fine particulate matter and risks of hospital admission for major cardiovascular diseases: population based cohort study, BMJ, 384, e076939, https://doi.org/10.1136/bmj-2023-076939, 2024.
Wei, Y. and Schwartz, J.: The updated WHO air quality guidelines are a big step forward but not a complete solution, BMJ, 384, q542, https://doi.org/10.1136/bmj.q542, 2024.
World Health Organization: WHO global air quality guidelines: particulate matter (PM2.5 and PM10), ozone, nitrogen dioxide, sulfur dioxide and carbon monoxide: executive summary, World Health Organization, Geneva, 2021.
World Health Organization: The Global Health Observatory, https://www.who.int/data/gho (last access: 2 October 2025), 2025.
Xu, B., Yu, X., Gu, H., Miao, B., Wang, M., and Huang, H.: Commuters' exposure to PM2.5 and CO2 in metro carriages of Shanghai metro system, Transp. Res. D Transp. Environ., 47, 162–170, https://doi.org/10.1016/j.trd.2016.05.001, 2016.
Yu, W., Xu, R., Ye, T., Abramson, M. J., Morawska, L., Jalaludin, B., Johnston, F. H., Henderson, S. B., Knibbs, L. D., Morgan, G. G., Lavigne, E., Heyworth, J., Hales, S., Marks, G. B., Woodward, A., Bell, M. L., Samet, J. M., Song, J., Li, S., and Guo, Y.: Estimates of global mortality burden associated with short-term exposure to fine particulate matter (PM2.5), Lancet Planet. Health, 8, e146–e155, https://doi.org/10.1016/S2542-5196(24)00003-2, 2024.
Yang, H.: Citizen science in air pollution monitoring: methodological approaches, effectiveness, and integration with health research, Curr. Environ. Health Rep., 13, 36, https://doi.org/10.1007/s40572-026-00559-1, 2026.
Young, M. T., Jansen, K., Cosselman, K. E., Gould, T. R., Stewart, J. A., Larson, T., Sack, C., Vedal, S., Szpiro, A. A., and Kaufman, J. D.: Blood pressure effect of traffic-related air pollution: a crossover trial of in-vehicle filtration, Ann. Intern. Med., 176, 1586–1594, https://doi.org/10.7326/M23-1309, 2023.
Zamorategui-Molina, A., Gutiérrez-Ortega, N. L., Baltazar-Vera, J. C., Del Ángel-Soto, J., and Tirado-Torres, D.: Carbon monoxide and particulate matter concentrations inside the road tunnels of Guanajuato City, Mexico, Aerosol Air Qual. Res., 21, 210039, https://doi.org/10.4209/aaqr.210039, 2021.
Zhao, L., Wang, J., Gao, H. O., Xie Y, Jiang, R., Hu, Q., and Su, Y.: Evaluation of particulate matter concentration in Shanghai's metro system and strategy for improvement, Transp. Res. D Transp. Environ., 53, 115–127, https://doi.org/10.1016/j.trd.2017.04.010, 2017.
Zhao, Y., Jiang, C., Song, X., Li, Z., and Zhang, Y.: Modelling particle diffusion patterns inside urban road tunnels in Dalian, China, employing annual field measurement, Build. Environ., 194, 107681, https://doi.org/10.1016/j.buildenv.2021.107681, 2021.
Zhou, R., Wang, S., Shi, C., Wang, W., Zhao, H., Liu, R., Chen, L., and Zhou, B.: Study on the traffic air pollution inside and outside a road tunnel in Shanghai, China, PLoS ONE, 9, e112195, https://doi.org/10.1371/journal.pone.0112195, 2014.