the Creative Commons Attribution 4.0 License.
the Creative Commons Attribution 4.0 License.
 | 10 Nov 2026
Measurements of NaCl in ambient air with a capture vaporizer-ToF-ACSM
Marije van den Born

Hengjia Ou
Jan Mulder
Jinglan Fu
Harald Saathoff
Ulrike Dusek
Sea spray aerosol is important for climate and atmospheric chemistry as it influences radiative forcing and heterogeneous reactions, but few online methods exist for quantifying sub-micron sea spray concentrations. Common chemical speciation instruments, such as aerosol mass spectrometers (AMS) and aerosol chemical speciation monitors (ACSM), are usually not used for sea salt quantification due to the incomplete evaporation of refractory sodium chloride (NaCl). This study evaluates the capability of the time-of-flight-ACSM (ToF-ACSM) equipped with a capture vaporizer (CV) to detect and quantify sea salt aerosol for the first time. Key NaCl marker ions ( 23 (Na), 58 (Na35Cl), and 60 (Na37Cl)) were identified through controlled laboratory calibration. The calibration experiments show that the ACSM response (ions s−1) at characteristic NaCl fragments scales with the available particle surface area, yielding a surface-normalized signal that is only weakly dependent on particle size for monodisperse NaCl aerosol. This indicates that the CV-ToF-ACSM provides a direct and robust measure of sea salt aerosol surface area. If a prior estimate of the NaCl size distribution is available, this signal can be converted to aerosol mass concentrations. Furthermore, controlled chamber experiments indicated that secondary organic aerosol (SOA) formed from α-pinene as a precursor and condensed on the NaCl particles does not produce significant quantities of fragments at the values characteristic for NaCl. Field experiments at a coastal site showed that conditions with onshore winds resulted in high correlations (R2 = 0.949–0.977) between the three key NaCl marker ions. By applying the laboratory-derived calibration formula to the raw CV-ToF-ACSM 23 signal, sea salt aerosol surface concentrations could be quantitatively determined in real time. However, the slope between the fragments at 23 and 58 is higher in the ambient data than in the laboratory calibration, suggesting reduced Cl relative to Na due to aging reactions of the sea salt particles in the coastal environment. Overall, these results demonstrate that the CV-ToF-ACSM can provide quantitative real-time information on submicron sea salt aerosol before aging, particularly in terms of surface area, while accurate mass concentration retrieval requires additional NaCl size distribution information. These findings highlight the potential to improve the characterization of marine aerosol sources and their role in atmospheric processes.
- Article
(2512 KB) - Full-text XML
-
Supplement
(2042 KB) - BibTeX
- EndNote


Atmospheric aerosols interact in particular with solar radiation and clouds, altering the Earth's radiation balance and therefore contributing to climate change. Uncertainties related to aerosol–cloud interactions and their effects on radiative forcing represent a primary source of variability in anthropogenic forcing estimates (Lee et al., 2016). Reducing these uncertainties necessitates reliable measurements of the spatial, physical, and chemical properties of aerosols (Bellouin et al., 2020).
Among the different aerosol types, sea salt particles, primarily composed of sodium chloride (NaCl), play a major role in the Earth's radiative balance and cloud microphysics due to their high hygroscopicity and ability to act as cloud condensation nuclei (CCN). They are a dominant component of natural aerosol mass, particularly in marine and coastal environments, and significantly influence both direct and indirect radiative forcing (O'Dowd et al., 2002). Because of their ionic nature and relatively large particle sizes, sea salt aerosols (SSA) are most commonly quantified using filter-based sampling methods, followed by ion chromatographic analysis of water-soluble inorganic species. However, while filter-based approaches offer reliable bulk composition data, they lack the temporal resolution needed to capture rapid variations in aerosol composition.
This study utilizes a time-of-flight aerosol chemical speciation monitor (ToF-ACSM), an instrument designed for routine measurement of the mass and chemical composition of non-refractory (NR) aerosol components (Fröhlich et al., 2013). Aerosol particles are focused into a high-vacuum region and impacted onto a heated vaporizer, where they are flash-vaporized prior to ionization and subsequent detection in the time-of-flight (TOF) chamber. The efficiency of the vaporization process directly affects the fraction of particle mass that is transmitted to the TOF chamber and therefore the measured aerosol mass. ACSM instruments typically use a standard vaporizer (SV). To diminish the effects of particle bounce, the capture vaporizer (CV) was developed (Xu et al., 2018). The CV contains an inner cavity to reduce the effects of particle bounce, therefore improving the collection efficiency (CE) of the instrument to ∼ 1. Although the CV improves CE compared to the SV, its structure increases aerosol particle residence time, which increases thermal decomposition and results in distinct fragmentation patterns (Zheng et al., 2020).
Sea salt is not routinely measured in ACSMs because it does not fully vaporize due to its refractory nature and vaporization temperature requirements (≳ 600 °C) (Bahreini et al., 2003; Zhang et al., 2011). Nevertheless, partial evaporation of ambient sea salt at temperatures of ∼ 600 °C had previously been demonstrated (O'Dowd and Smith, 1993). It should be noted that the vaporization efficiency in the CV may exhibit a size dependence as the process is governed by the surface-to-surface contact between particles and the vaporizer. This implies that the fraction of particle material that is effectively vaporized can depend on particle size.
At coastal measurement sites, NaCl fragments from sea salt aerosols have been detected both by the aerosol mass spectrometer (AMS) and ACSM instruments using the SV. Various studies (Mallet et al., 2016; Nuaaman et al., 2015; Ovadnevaite et al., 2012; Schmale et al., 2013) have attempted to quantify sea salt mass concentrations using AMS with mixed results, but, to our knowledge, this has not been reported previously for CV-ToF-ACSM instruments.
Freney et al. (2021) reported typical signature peaks for SSA ( fragments at 23 (Na+), 35 and 37 (35Cl−, 37Cl−), 58 and 60 (Na35Cl, Na37Cl), and 81 and 83 (NaCl2, NaCl37Cl)) during shipboard measurements, while SSA was generated using a bubble-bursting apparatus. The NaCl signals were confirmed through controlled experiments with pure NaCl aerosol particles. In another previous study an in situ particle generator was utilized aboard a ship to produce sea spray particles, which were measured by a quadrupole-AMS (Q-AMS) and a high-resolution ToF-AMS (HR-ToF-AMS), both detecting NaCl fragments (Na35Cl and Na37Cl) in the samples which had elevated SSA concentrations (Bates et al., 2012). In another study, Timonen et al. (2016) observed NaCl signature peaks ( 58 and 60) in SV-ToF-ACSM mass spectra at the Neumayer Station, Antarctica, under sea salt aerosol influence as indicated by airmass back trajectory analysis. The peaks at 58 and 60 were measured together with high chloride signals and when neither methanesulfonic acid (MSA) nor organic aerosol was elevated. In a recent study, the interference of SSA with biomass burning organic aerosol (BBOA) measurements was examined, given that BBOA is typically characterized by ion markers at 60 and 73, representing C2H4O and C3H5O ions, respectively. The presence of Na37Cl+ ions, which also have a mass-to-charge ratio of 60, can interfere with the BBOA marker at 60 when using the CV. In that study, a CV-ToF-ACSM was deployed at two coastal sites in Australia, where distinct correlations were observed between the ion signal at 60 and the secondary BBOA marker at 73. Positive matrix factorization (PMF) analysis further confirmed that the signal at 60 could originate from both NaCl in sea salt and BBOA (Sutresna et al., 2024).
Quantification of SSA mass concentrations was previously attempted by Ovadnevaite et al. (2012), who used a HR-ToF-AMS to measure sea salt concentrations as a function of wind speed at the Mace Head Atmospheric Research Station in Ireland. Utilizing Na35Cl as a proxy for SSA, they established a calibration scaling factor of 51 between AMS-reported NaCl loadings and actual sea salt present in PM1. This calibration was derived from comparisons with synthetic SSA standards and with a vaporizer temperature of ∼ 650 °C. Schmale et al. (2013) subsequently applied this scaling factor to estimate SSA mass contributions based on HR-ToF-AMS data. Petters et al. (2023) also incorporated this scaling factor in their study of nano-plastics within sea spray aerosol. Additionally, Zorn et al. (2008) reported a chloride-to-sea salt scaling factor between 150 and 220, based on comparisons between AMS and particle-into-liquid sampler measurements.
In this study, we evaluate the potential for quantifying NaCl using a CV-ToF-ACSM in a coastal environment. We investigate the most suitable marker ions for NaCl quantification, exploring the use of characteristic signal ratios to confirm the presence of NaCl in ambient data. A laboratory calibration is employed to derive NaCl concentrations from measured mass fragments. In addition, chamber experiments conducted at the Aerosol Interaction and Dynamics in the Atmosphere (AIDA) facility (Saathoff et al., 2009; Wagner et al., 2021) in 2024 investigate the formation of secondary organic aerosol (SOA) from α-pinene on NaCl seed particles in order to assess potential interferences of typical SOA fragments with the ACSM-based detection of NaCl. Finally, we also use long-term ACSM data recorded at a coastal site in the Netherlands and a more inland site in the Netherlands to study the applicability and the limits of the method that was developed.
2.1 The CV-ToF-ACSM
In this research, two CV-ToF-ACSM instruments (Aerodyne Research Inc., Billerica, MA) were deployed. One of the instruments was located at a coastal site and one at an inland site to measure ambient aerosol composition. Both instruments were operated with 10 min time resolution during ambient measurements. One of the instruments was temporarily relocated to the laboratory for a calibration experiment (detailed in Sect. 2.2), where it measured with 2 min time resolution, and it was used in the AIDA chamber experiments (detailed in Sect. 2.4), measuring with 5 min time resolution.
Both CV-ToF-ACSM instruments were equipped with PM2.5 aerodynamic lens (Xu et al., 2017), which has proven to be very effective in detecting NR-PM2.5 with very good agreement against offline filter measurements (Liu et al., 2024). The CV-ToF-ACSM underwent regular calibrations as per established procedures (Canagaratna et al., 2007; Fröhlich et al., 2013). These calibrations included flow rate, heater bias (HB) voltage, and calibrations for IE and relative ionization efficiency (RIE) for standard species (sulfate, nitrate, and ammonium). Data analysis was conducted using Tofware software (v3.2.4, Tofwerk AG, Thun, Switzerland) within the Igor Pro 8 environment.
2.2 Calibration experiment
Calibration of the ACSM with NaCl aerosol of various particle sizes was performed using the typical ACSM calibration setup as described by Ng et al. (2011). NaCl aerosol was generated by nebulizing a 5 mMol L−1 aqueous solution with a constant output atomizer (Model 3076, TSI Inc., Shoreview, MN, USA). The generated aerosol was directed through a silica gel diffusion dryer tube (Topas GmBH, DDU570 series), after which the aerosol reached a desired relative humidity of < 40 %. Monodisperse particles were generated by using the Vienna medium type differential mobility analyzer of the scanning mobility particle sizer (TROPOS-type SMPS). This SMPS is equipped with a butanol-based condensation particle counter (CPC) developed by TSI Instruments (model 3750, TSI Inc., Shoreview, MN, USA). Downstream the DMA, the desired aerosol concentration was adjusted using a diluter with a mixing tube provided by Aerodyne for the calibration of the ACSM. The CPC was connected to the sampling pump connector of the ToF-ACSM to record the particle concentration at each selected size.
Measurements were performed with different concentrations and particle diameters of the NaCl aerosol. Three different particle mobility diameters (150, 200, and 250 nm) were selected for this research. For each particle diameter, the measurements were performed with three different aerosol concentrations ranging from 4.6–26.3 µg m−3. The duration of each measurement was ∼ 15 min. However, only the data collected after the ACSM signal had stabilized were used for analysis (see Fig. S1 in the Supplement).
2.3 Instrumental setup at the ambient measurement locations
The first CV-ToF-ACSM is located at the Lutjewad coastal station, right next to the Wadden Sea dike at the northern coast of the Netherlands at 53.24° N, 6.21° E. During northerly winds, clean marine background air can reach the site. The direct surroundings of the measurement site can be considered rural and mainly consist of flat, agricultural land. Some small villages are located ±1 km south-west to south-east of the station. The nearest city is the city of Groningen, which is located 23 km south–south-west of Lutjewad.
Ambient air was sampled at a flow rate of 40 L min−1 through a 20 m vertical stainless-steel inlet equipped with a PM2.5 size-selective impactor at the inlet head. At 2 m height, a subsample of the flow is collected from the middle of the inlet at nearly isokinetic conditions and drawn into the laboratory. Upon entry into the laboratory, the airstream was dried using a 300 mm Nafion membrane dryer (TROPOS). The dried air was subsequently distributed to multiple instruments, including the CV-ToF-ACSM using a splitter developed by TROPOS (design 2019), featuring six in. outlet tubes and one in. outlet tube, with a total flow rate of 16.7 L min−1.
A second CV-ToF-ACSM is located at 51.97° N, 4.93° E, in the Cabauw Experimental Site for Atmospheric Research (CESAR) tower. The location is managed and operated by the Royal Netherlands Meteorological Institute (KNMI). The CESAR tower is located in the province of Utrecht, the Netherlands, approximately 45 km south-east of the North Sea coast. The site is located 45 km south of the city of Amsterdam, 31 km east of the city and port of Rotterdam, and 18 km south-west of the city of Utrecht. The direct surroundings of the CESAR tower can be considered rural and consist mainly of agricultural and peat land. Although the site is not situated in a direct coastal environment, marine influences can still be observed under certain wind directions.
At the CESAR tower, ambient air was sampled for the CV-ToF-ACSM using a stainless-steel inlet system equipped with a PM2.5 size-cut cyclone (URG-2000-30ED) and a Nafion dryer. The sampling was conducted at a height of 4.5 m with a flow rate of 2 L min−1.
Meteorological data were retrieved from the Integrated Carbon Observation System (ICOS) and were recorded at a height of 60 m for the Lutjewad measurement station. Hourly meteorological data for the CESAR tower site were obtained from the KNMI database, measured at 10 m above ground level.
The datasets that were used cover the months of January–August 2023 (Lutjewad) and May 2021–April 2022, excluding June 2021 (CESAR), during which period both CV-ToF-ACSM instruments were measuring almost continuously. MeteoInfo software, which makes use of the HYSPLIT model (Rolph et al., 2017; Stein et al., 2015), was used to retrieve the 72 h air back-trajectories at both measurement sites.
2.4 AIDA Chamber experiments
The AIDA chamber is an experimental facility used to study multi-phase chemical and physical processes under different atmospheric conditions, located in Karlsruhe, Germany (Bunz et al., 1996). The chamber has a volume of 84.5 m3 and a surface area of 103 m2. In January 2024, a chamber simulation campaign was conducted as part of the Cloud-Aerosol Interactions in a Nitrogen-dominated Atmosphere (CAINA) project to simulate secondary organic aerosol formation pathways under various relative humidity (RH) conditions. Two experiments where NaCl aerosol was injected as a seed using an ultrasonic nebulizer with 0.1 % aqueous solutions were selected for this research. During both experiments, a temperature of 10 °C was maintained. During the experiment of 18 January, an RH of between 0 % and 1 % was maintained, and during the experiment of 19 January, the RH was between 90 % and 95 %. After injection of NaCl, SOA was produced by α-pinene ozonolysis, followed by the injection of NH3 and NO2, resulting in a complex organic aerosol (OA) mixing with the NaCl particles. During the experiments a TOF-ACSM measured the chemical composition of the aerosols in the reaction chamber.
Both experiments were performed over a duration of 8–9 h.
3.1 Quantification of NaCl using the CV-ToF-ACSM
Figure 1a presents the ACSM signal normalized by the NaCl mass concentration as a function of particle mobility diameter. A systematic decrease in the normalized signal response with increasing particle size is observed. For NaCl aerosol particles with a diameter of 150 nm, the normalized signal is approximately a factor of 2 higher than that for particles with a diameter of 250 nm, while the relative change in surface area is a factor of 1.67. The derived slopes indicate a consistent size-dependent decrease in signal response. This trend is consistently observed across all NaCl marker fragments, suggesting a uniform reduction in ACSM response with increasing particle size. This indicates that the CE for NaCl in the CV is well below 1, which is expected due to the refractory nature of NaCl. In addition to particle size, the results suggest a slight, not entirely consistent aerosol concentration dependence. Lower concentrations generally yield marginally reduced signal responses for a given particle size and fragment ion. Notably, at NaCl concentrations below 10 µg m−3 the signal response decreases more strongly than for higher NaCl concentrations, reflecting reduced signal-to-noise ratios near the detection limit. Due to the observed size dependence, deriving ambient sea salt mass concentrations from the ACSM signal requires prior information on particle size and is otherwise subject to substantial uncertainty. To further investigate the observed size dependence, the ACSM signal was normalized by the total particle surface area concentration (µm2 cm−3) instead of mass (Fig. 1b). As shown in Fig. 1b, the normalized signal remains nearly constant across the full range of particle diameters, indicating that the ACSM response scales more closely with particle surface area than with aerosol mass. Linear regression analysis yields slopes close to zero for all NaCl marker fragments (−3.9 × 10⁻³, −1.2 × 10⁻³, and −3.8 × 10⁻⁴ for 23, 58, and 60, respectively) as well as for the summed NaCl signal (−5.4 × 10⁻³), indicating that the size dependence is substantially reduced when normalized by surface area. This behavior likely arises from incomplete evaporation of NaCl in the CV, which operates as a surface-limited process since only the particle surface area is in direct contact with the vaporizer. Particles with higher surface-to-volume ratios therefore exhibit greater relative evaporation and correspondingly stronger signals. Normalizing by total surface area thus enables the estimation of particle surface concentrations without requiring assumptions about particle size.
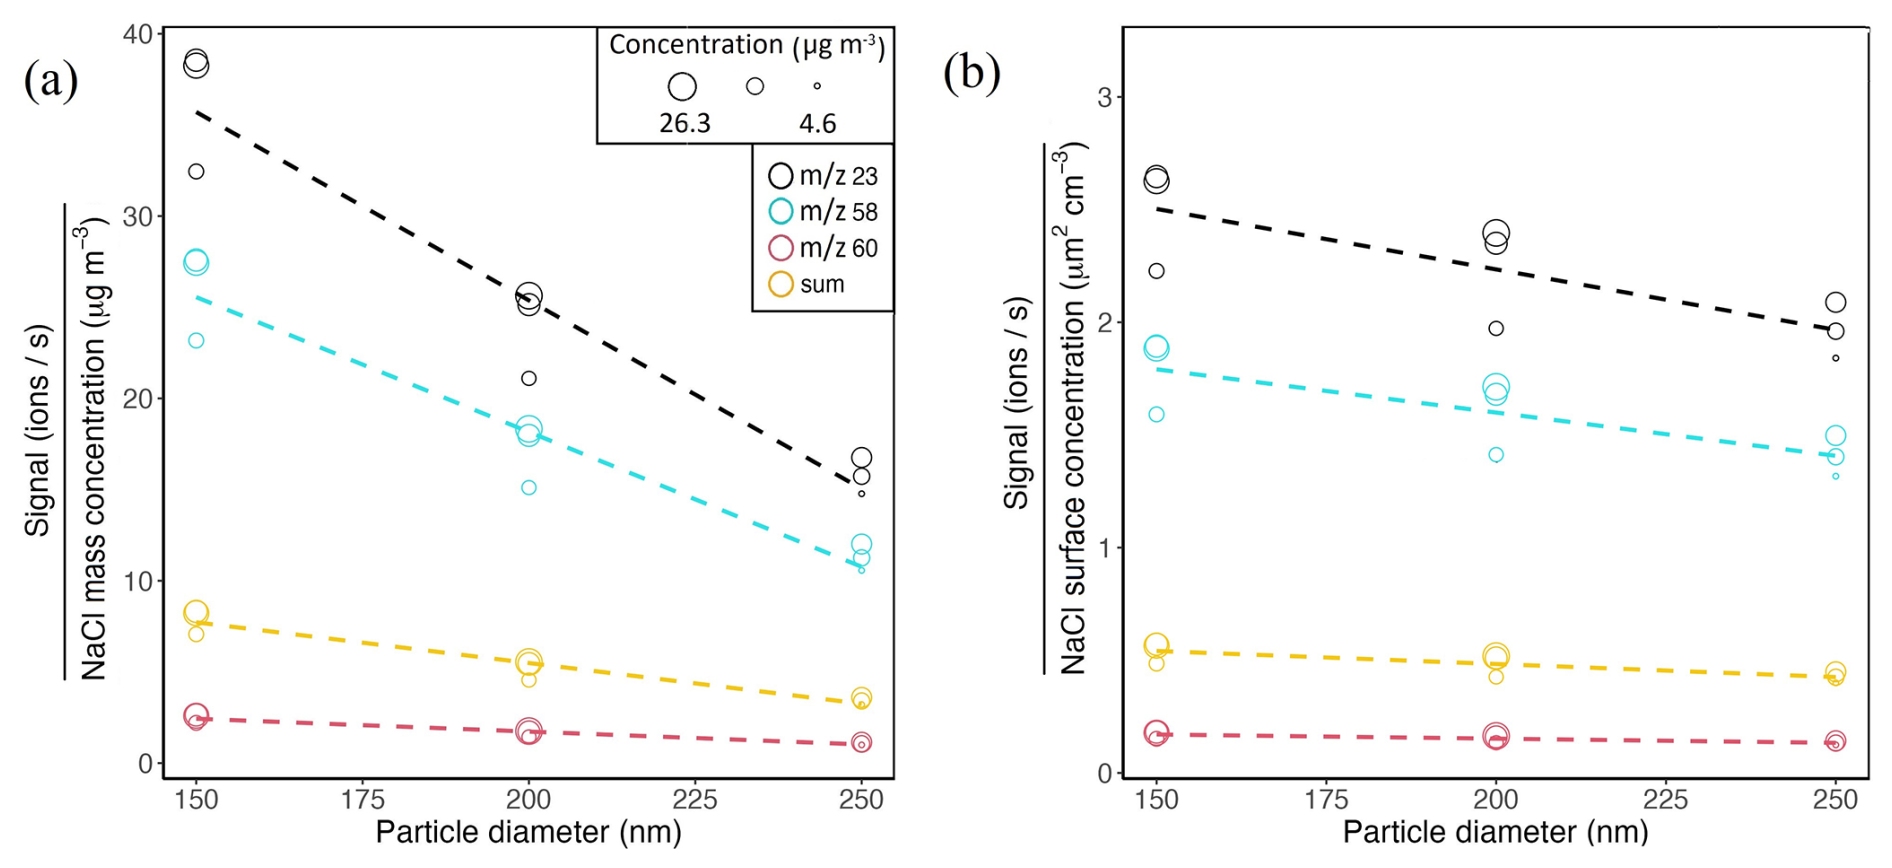
Figure 1Fragment signals normalized to NaCl mass (a) and surface concentration (b) at 23, 58, and 60 as a function of different aerosol concentrations and particle sizes. The size of the markers is proportional to the NaCl aerosol concentration ranging from 4.6 to 26.3 µg m−3. The black, light blue, red, and orange markers respectively indicate the normalized signals at 23, 58, 60 and the sum of these three signals (ions s−1).
3.2 Ambient measurements
From January to August 2023, ambient aerosol composition was measured using the CV-ToF-ACSM at the Lutjewad coastal station with 10 min time resolution. The measurement data were divided into two categories: marine air (data recorded with wind angles between 280 and 70°) and continental air (data recorded with wind angles between 110 and 240°). The wind angle of the recorded data was based on hourly local wind measurements, and the mismatch between the ACSM data time resolution and the wind measurement time resolution was handled by matching the ACSM measurements to the nearest recording of wind measurements. Furthermore the 72 h air back trajectories were investigated, and data assigned to marine air were discarded if the air back trajectory data indicated that the air had traveled over the land mass of mainland Netherlands or Germany. This allowed investigation of truly marine air, although the use of data of air having traveled over the Wadden Islands cannot be avoided, due to the location of the islands relative to the measurement location.
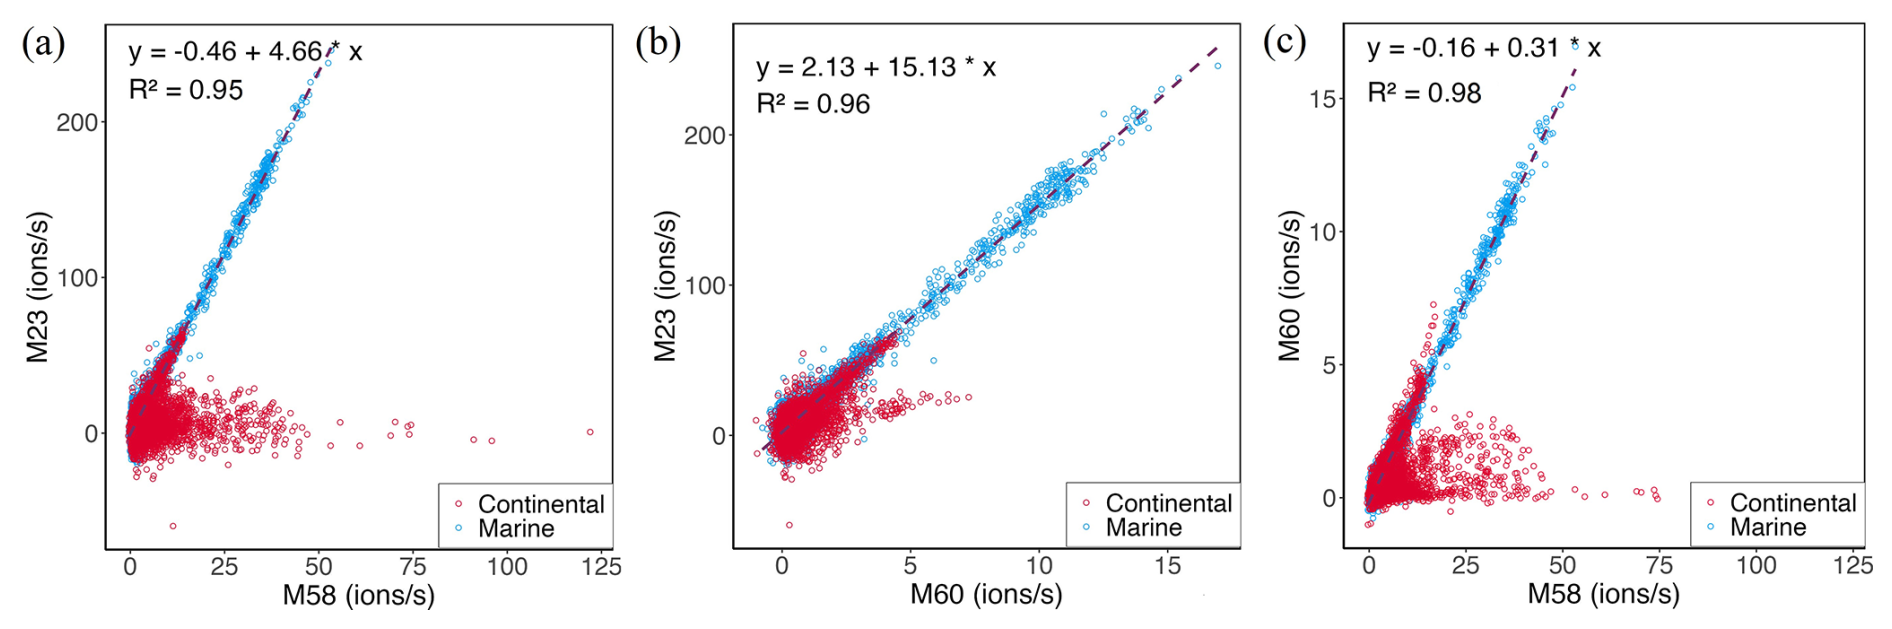
Figure 2Correlations between the signals of 23 and 58 (a), 23 and 60 (b), and 60 and 58 (c) in ions s−1 as measured at the Lutjewad measurement station. The dashed lines indicate the regression lines for the marine air data points.
Figure 2 presents correlations between the ACSM signals of 23 and 58, 23 and 60, and 60 and 58, respectively. A clear dependence on air mass origin is observed. Under marine-influenced conditions (onshore wind), absolute signal intensities are significantly higher than under continental influence (offshore wind). Furthermore, for marine air masses, the signal ratios remain highly consistent, with R2 ranging from 0.95 to 0.98. In contrast, no such correlation is observed for air masses originating from land, suggesting that the dominant source of fragments of M58, M60, and M23 are sea salt when the air sample has traveled over sea. For continental air, some of the measurements also indicate characteristic ratios of the fragments of M23, M58, and M60 associated with the presence of sea salt. This could be explained by the fact that the Lutjewad measurement station is located directly at the dike, and some sea salt aerosol can be present at the site, even with wind from the land. The signal of 23 shows scatter around 0, indicating that the measurement accuracy is lower at low aerosol concentrations than at high aerosol concentrations due to a relatively high limit of detection (LOD) for this fragment signal. This high LOD is likely influenced by an elevated instrumental background, which may be associated with vaporizer surface interactions and memory effects of semi-refractory sodium-containing species. Finally, the behavior of the signals at 58 and 60 suggests a source distinct from NaCl for continental air masses. While 23 exhibits a stable signal ratio, 58 shows increasing intensity, independent of the other NaCl-related fragments under continental wind directions. This indicates that 58 may be influenced by organic aerosol components or sources unrelated to sea salt. The 60 signal also shows a distinct source under offshore wind directions. The 60 fragment is commonly used as a tracer for biomass burning aerosol in AMS and ACSM measurements (Alfarra et al., 2007; Schneider et al., 2006), originating mainly from levoglucosan (C6H10O5), which is a pyrolysis product of cellulose formed during biomass combustion. A time series for the ion fragments at 23, 58, and 60 at the Lutjewad station and a representative mass spectrum for a high sea salt episode can be found in Figs. S2 and S3.
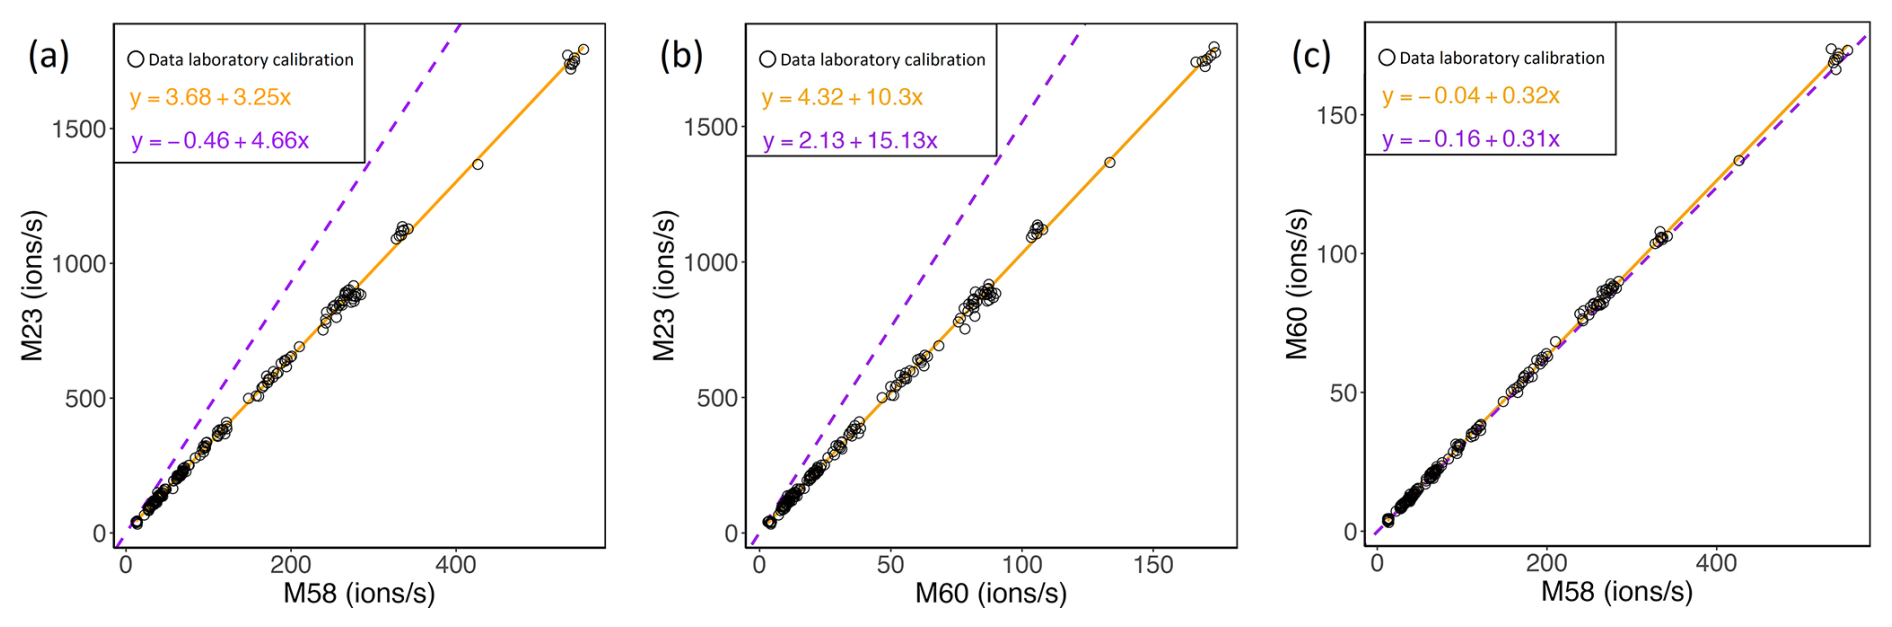
Figure 3Correlations between the signals of 23 and 58 (a), 23 and 60 (b), and 60 and 58 (c) in ions s−1 as measured during the calibration experiment (black markers). The solid orange lines represent the regression for the measured data during the calibration experiment. The dashed purple lines represent the regression for the measured ambient data at the Lutjewad measurement station under marine airmass influences.
Figure 3 shows the correlations between the ACSM signals of 23 and 58, 23 and 60, and 60 and 58 obtained during the calibration experiment as black points and the corresponding regression line from the ambient samples in purple. As expected, relative intensities of 23, 58, and 60 are highly correlated during the calibration experiment, confirming that all three signals originate from NaCl fragmentation. The slope of roughly 0.3 between 60 and 58 (Fig. 3c) corresponds well to the natural concentration ratios of the isotopologues, as the natural abundances of the 35Cl and the 37Cl isotopes (75.78 % and 24.22 %, respectively) result in an expected NaCl fragment ratio of 3.13. The ratios of 58 and 60 are nearly identical between calibration and ambient measurements (Fig. 3c), supporting the interpretation that a high correlation between these fragments reliably identifies NaCl in ambient data. In contrast, Figure 3a and b show a higher slope of the ambient measurements compared to the laboratory measurements, indicating that the relative intensity of 23 is higher in the marine samples. This reduction in NaCl compared to the Na fragment points to chloride depletion, a characteristic feature of sea salt aging. During atmospheric processing, chloride in NaCl particles is displaced by acidic species such as HNO3 or H2SO4, resulting in partial replacement of Cl− by nitrate or sulfate. The deviation of the slope from the nominal value can be used to assess the extent of chloride depletion as a characteristic feature of sea salt aging.
In order to test interferences at of the NaCl signals by organic fragments, we analyzed a situation where NaCl is not expected. Figure 4 presents the correlations between the three ACSM marker ion signals ( 23, 58, and 60) measured at the CESAR site from May 2021 to April 2022, excluding June 2021 due to instrument downtime. Only data recorded with local wind directions between 22.5–157.5° are included, representing strictly continental air masses.
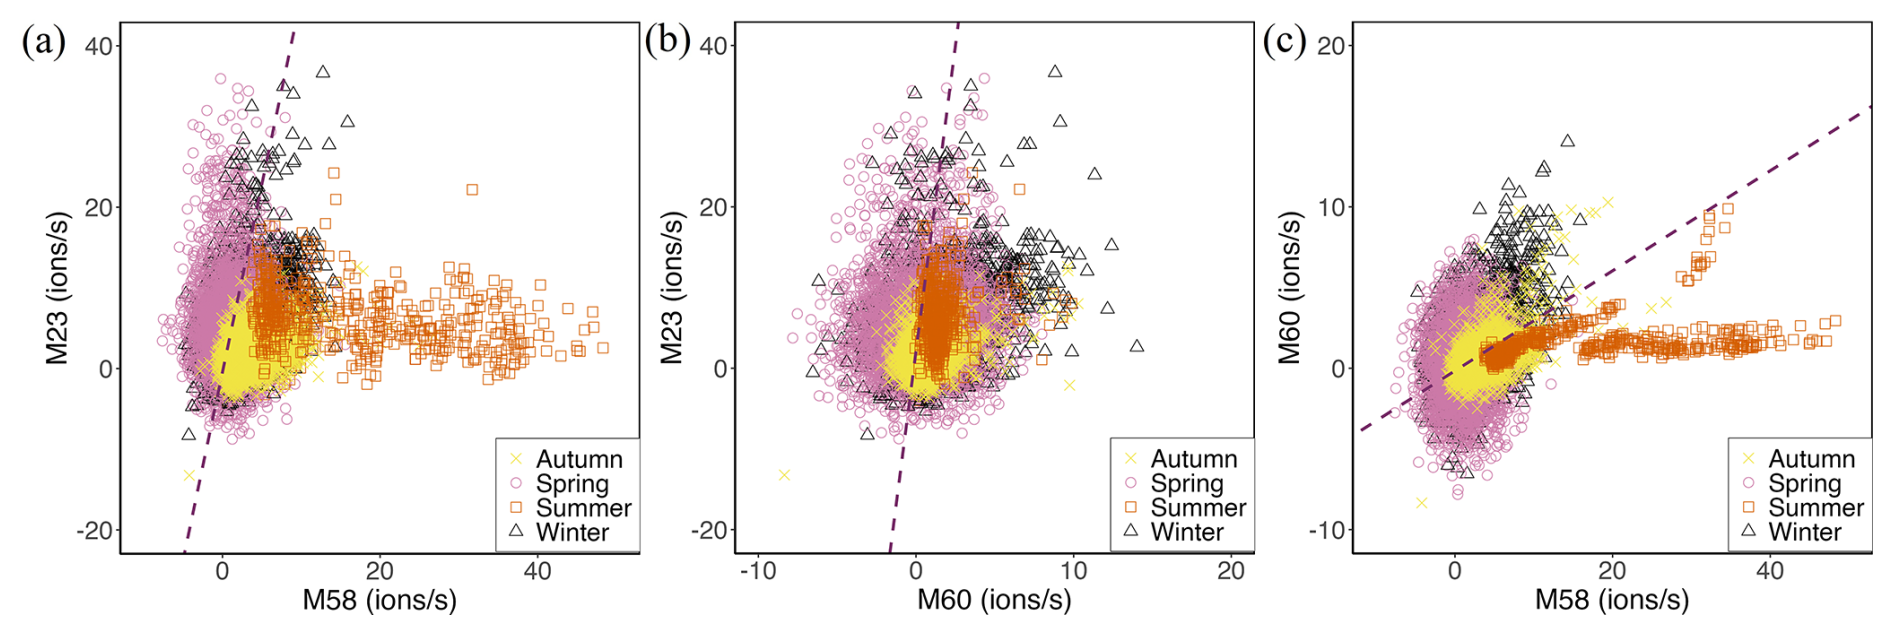
Figure 4Correlations between the signals of 58 and 23 (a), 60 and 23 (b), and 58 and 60 (c) in ions s−1, measured at the CESAR measurement site for continental air masses (defined as local wind directions between 22.5 and 157.5°). Dashed lines represent regression lines derived from marine air masses (as shown in Fig. 3), highlighting typical fragment ratios observed for marine conditions. Summer months are defined as July, August, and September, autumn months are defined as October, November, and December, winter months are defined as January, February, and March, and spring months are defined as April, May, and June.
The fragment signals in ions s−1 for continental conditions show a similar range to those observed for a coastal site (Fig. 2) for 58 and 60. Specifically, 58 generally spans from −10 to 50 ions s−1, with most values between −10 and 10 ions s−1. Similarly, 60 ranges from −10 to 15 ions s−1. However, Fig. 4c shows that 58 and 60 are not correlated with the characteristic slope of 0.3, showing that the increase in these fragments is not due to NaCl. The fragment signal of 58 reaches much higher values in summer than in other seasons, indicating a source of this fragment which is only present in the summer months and unrelated to the fragment signals at 23 and 60. Therefore, the ratio between 58 and 60 serves as a reliable indicator identifying the presence of NaCl. In contrast, 23 exhibits substantially lower intensities under continental air mass conditions, ranging from −10 to 35 ions s−1, compared to the much higher values observed for marine air masses at the coastal site, which range from −15 to 220 ions s−1 (Fig. 2). This implies that there are continental sources of organic fragments at 58 and 60, which could interfere with the NaCl signal if the air mass that is analyzed is not strictly marine. Since 23 is not affected by interfering masses and has the highest signal, it can be most reliably used to quantify the sea salt surface area concentrations. However, it is also the noisiest of all the signals, preventing quantification at very low concentrations.
Based on the laboratory calibration described in Sect. 3.1, a linear relationship was derived between the signal in ions s−1 at 23 and the NaCl particle surface area concentration SNaCl in µm2 cm−3. The NaCl surface area concentration can be calculated from the signal at 23 as follows:
The corresponding sensitivity is 0.625 µm2 cm−3 (ions s−1)−1, with an R2 of 0.995. As the background signal at 23 changes over time and is instrument specific, it must be determined individually for each CV-ToF-ACSM prior to application of this method. Equation (1) is also strictly only applicable to above-background 23 signals. Using this relationship for marine air masses at the coastal site, we show significant concentrations of NaCl up to 121 µm2 cm−3. These concentrations correspond to NaCl before any chloride depletion, assuming that each detected Na ion is paired with a Cl ion.
3.3 AIDA chamber data analysis
Figure 5 presents the time series of the aforementioned fragments and the OA signal calculated using the default fragmentation table for the ToF-ACSM during the AIDA chamber experiment conducted on 18 January 2024. Injection of NaCl particles into the chamber results in rising signals for the fragments at 23 (Na), 58 (Na35Cl), and 60 (Na37Cl). The concurrent rise in the organic mass concentration is attributed to the fact that 58 and 60 are classified as OA fragments in the standard fragmentation table and the sum of their concentrations adds up to the spurious organic signal observed, with the fragment at 58 being the most dominant contributor to the total OA signal after injection of NaCl. After the injection of α-pinene, the total OA signal increases substantially due to secondary organic aerosol formation.
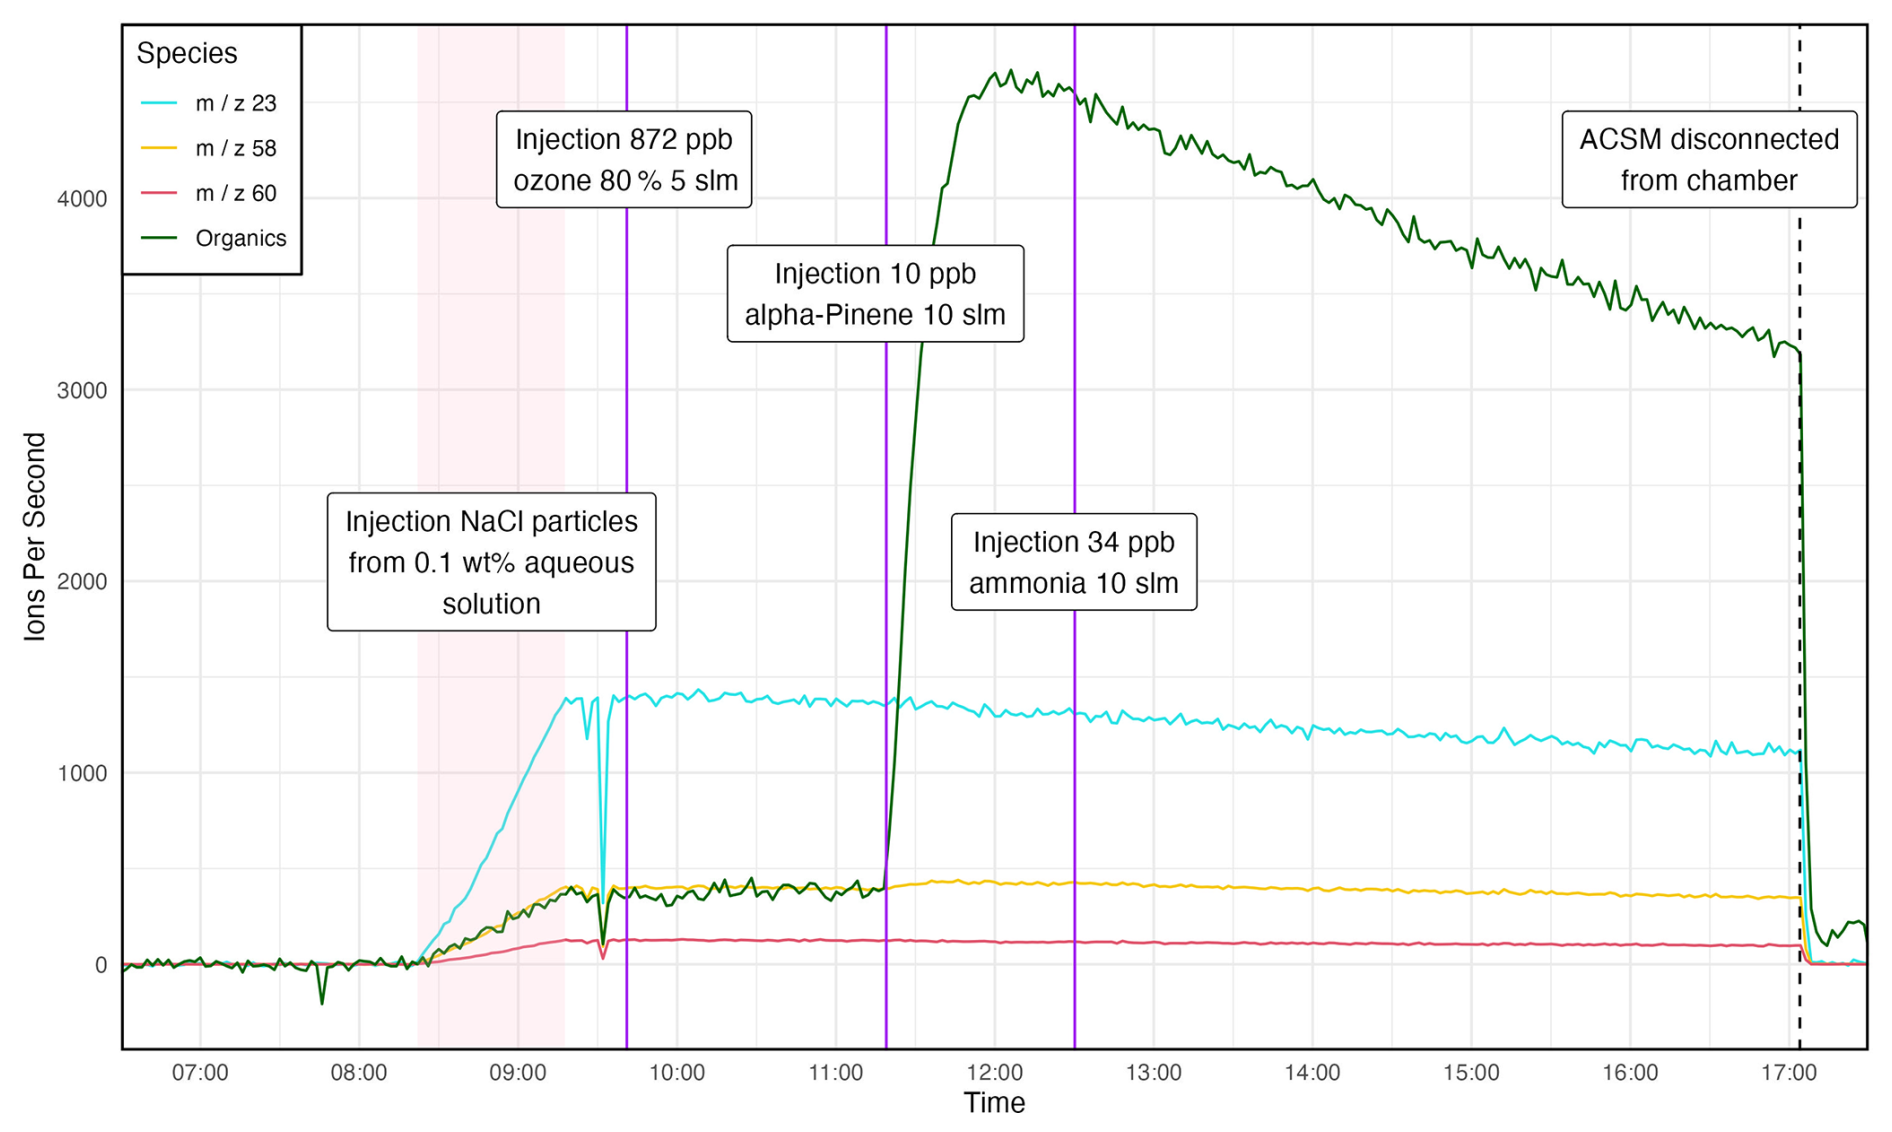
Figure 5Time series of the fragment signals at 23, 58, and 60 (light blue, yellow, and red, respectively), and the organics signal as assigned by default in the fragmentation table of the TOF-ACSM, during the AIDA chamber experiment on 18 January 2024. The pink shaded area represents the injection of NaCl particles from a 0.1 mass percent (wt %) aqueous solution. The polydisperse aerosol had an average number mode diameter of ±222 nm as derived from the measurements with the two SMPS instruments. The purple lines represent the injection of 872 ppb ozone, the injection of 10 ppb α-pinene, and the injection of 34 ppb ammonia, respectively. α-pinene and ammonia were injected with 10 standard liters per minute (slm). The dashed black line represents the time at which the ACSM was disconnected from the chamber, resulting in all signals going down.
None of the three signals under study were affected by the injection of ozone into the chamber environment. Injection of 10 ppb α-pinene resulted in a 10 % increase in the signal at 58 when considering the ions s−1 3 min prior to injection and 20 min after injection, and it left the signals at 23 and 60 unaffected. These results indicate that typical SOA does not seem to interfere significantly with the signals at which NaCl is detected. Also, the fragments at 23, 58, and 60 were all found to have sufficiently high signals to serve as markers for the presence of NaCl aerosol.
The experiment depicted in Fig. 5 was carried out under low relative humidity conditions (0 %–1 % RH). A similar experiment was conducted on 19 January 2024 under high relative humidity conditions (90 %–95 % RH). Details of this experiment are presented in Fig. S4. As in the experiment on 18 January, the signals at 23, 58, and 60 were not strongly affected by the addition of any of the injected chemicals. This further supports the conclusion that NaCl detection via these marker ions is robust against variations in humidity and the associated chemical and physical processes that occur under different RH conditions.
The addition of the CV to the ACSM significantly reduces particle bounce effects, thereby decreasing measurement uncertainties. An additional consequence of using a CV is that some refractory particles, such as sea salt, can also be detected by using instruments equipped with a CV system due to the prolonged time the particles spend in the vaporizer. This study demonstrates that the CV-ToF-ACSM can effectively detect sodium chloride (NaCl), using distinct mass fragments at 23 (Na+), 58 (Na35Cl), and 60 (Na37Cl) as reliable markers. These fragments exhibited high signal strengths and minimal interference from organic fragments during controlled chamber experiments, including α-pinene SOA formation and oxidative aging. Laboratory experiments revealed that the ACSM response to NaCl aerosol is more closely related to available particle surface area than to total aerosol mass. A slight concentration dependence of the ACSM signal normalized to aerosol surface concentration was observed, with lower aerosol concentrations resulting in proportionally weaker signals. Field measurements at a coastal site confirmed strong positive correlations between the fragment signals at 23, 58, and 60 when sampling marine air. In continental air masses, interferences from organic fragments at 58 and 60 are present but can be distinguished by a lack of correlation between 58 and 60. Based on the laboratory experiments, a quantitative relationship between the 23 signal and NaCl particle surface concentrations was established and subsequently used to derive a method for quantifying atmospheric NaCl prior to chemical aging. This approach enables the calculation of NaCl surface area concentrations directly from the CV-ToF-ACSM 23 signal using a calibration-based formula, allowing for the identification and quantification of freshly emitted sea salt aerosol. These findings highlight the CV-ToF-ACSM as an effective tool for quantifying and monitoring sea salt aerosol abundance and processing in the atmosphere, providing a solid foundation for studies of chemical aging and particle composition in marine environments.
The data supporting the findings of this study are publicly available through Zenodo at https://doi.org/10.5281/zenodo.23694652 (van den Born, 2026).
The supplement related to this article is available online at https://doi.org/10.5194/ar-4-577-2026-supplement.
JM, UD, and MvdB performed the ambient measurements. MvdB and UD analyzed the ambient data. HS, JF, HJO, JM, and UD performed the AIDA chamber experiments. HJO, JF, and MvdB analyzed the AIDA chamber data. MvdB and JM performed the laboratory experiments. MvdB and UD analyzed the laboratory data. MvdB wrote the article. HJO, JM, JF, HS, and UD reviewed and edited the article.
The contact author has declared that none of the authors has any competing interests.
Publisher's note: Copernicus Publications remains neutral with regard to jurisdictional claims made in the text, published maps, institutional affiliations, or any other geographical representation in this paper. The authors bear the ultimate responsibility for providing appropriate place names. Views expressed in the text are those of the authors and do not necessarily reflect the views of the publisher.
This work was carried out using data from the Ruisdael Observatory as part of its continuous monitoring efforts. The authors gratefully acknowledge Davide Merlo for his valuable assistance with the laboratory experiments.
This research has been supported by the Cloud-Aerosol Interactions in a Nitrogen-dominated Atmosphere (CAINA) project (grant no. OCENW.XL21.XL21.112) under the Dutch Research Council (NWO) – Netherlands Organisation for Scientific Research and the ATMO-ACCESS project (ATMO-TNA-3 – 0000000063) through the European Union's Horizon 2020 research and innovation programme. The Ruisdael Observatory is a scientific infrastructure co-financed by the Dutch Research Council (NWO, grant no. 184.034.015).
This paper was edited by Shahzad Gani and reviewed by two anonymous referees.
Alfarra, M. R., Prevot, A. S. H., Szidat, S., Sandradewi, J., Weimer, S., Lanz, V. A., Schreiber, D., Mohr, M., and Baltensperger, U.: Identification of the Mass Spectral Signature of Organic Aerosols from Wood Burning Emissions, Environ. Sci. Technol., 41, 5770–5777, https://doi.org/10.1021/es062289b, 2007.
Bahreini, R., Jimenez, J. L., Wang, J., Flagan, R. C., Seinfeld, J. H., Jayne, J. T., and Worsnop, D. R.: Aircraft-based aerosol size and composition measurements during ACE-Asia using an Aerodyne aerosol mass spectrometer, J. Geophys. Res.-Atmos., 108, https://doi.org/10.1029/2002JD003226, 2003.
Bates, T. S., Quinn, P. K., Frossard, A. A., Russell, L. M., Hakala, J., Petäjä, T., Kulmala, M., Covert, D. S., Cappa, C. D., Li, S.-M., Hayden, K. L., Nuaaman, I., McLaren, R., Massoli, P., Canagaratna, M. R., Onasch, T. B., Sueper, D., Worsnop, D. R., and Keene, W. C.: Measurements of ocean derived aerosol off the coast of California, J. Geophys. Res.-Atmos., 117, https://doi.org/10.1029/2012JD017588, 2012.
Bellouin, N., Quaas, J., Gryspeerdt, E., Kinne, S., Stier, P., Watson-Parris, D., Boucher, O., Carslaw, K. S., Christensen, M., Daniau, A. -L., Dufresne, J. -L., Feingold, G., Fiedler, S., Forster, P., Gettelman, A., Haywood, J. M., Lohmann, U., Malavelle, F., Mauritsen, T., McCoy, D. T., Myhre, G., Mülmenstädt, J., Neubauer, D., Possner, A., Rugenstein, M., Sato, Y., Schulz, M., Schwartz, S. E., Sourdeval, O., Storelvmo, T., Toll, V., Winker, D., and Stevens, B.: Bounding Global Aerosol Radiative Forcing of Climate Change, Rev. Geophys., 58, e2019RG000660, https://doi.org/10.1029/2019RG000660, 2020.
Bunz, H., Möhler, O., Naumann, K.-H., Saathoff, H., Schöck, W., and Schurath, U.: The novel aerosol chamber facility AIDA: status and first results, in: Proceedings of the 7th European Symposium on the Physico-Chemical Behaviour of Atmospheric Pollutants, edited by: Larsen, B., Versino, B., and Angeletti, G., EUR 17482, 673–677, 1996.
Canagaratna, M. R., Jayne, J. T., Jimenez, J. L., Allan, J. D., Alfarra, M. R., Zhang, Q., Onasch, T. B., Drewnick, F., Coe, H., Middlebrook, A., Delia, A., Williams, L. R., Trimborn, A. M., Northway, M. J., DeCarlo, P. F., Kolb, C. E., Davidovits, P., and Worsnop, D. R.: Chemical and microphysical characterization of ambient aerosols with the aerodyne aerosol mass spectrometer, Mass Spectrom. Rev., 26, 185–222, https://doi.org/10.1002/mas.20115, 2007.
Freney, E., Sellegri, K., Nicosia, A., Williams, L. R., Rinaldi, M., Trueblood, J. T., Prévôt, A. S. H., Thyssen, M., Grégori, G., Haëntjens, N., Dinasquet, J., Obernosterer, I., Van Wambeke, F., Engel, A., Zäncker, B., Desboeufs, K., Asmi, E., Timonen, H., and Guieu, C.: Mediterranean nascent sea spray organic aerosol and relationships with seawater biogeochemistry, Atmos. Chem. Phys., 21, 10625–10641, https://doi.org/10.5194/acp-21-10625-2021, 2021.
Fröhlich, R., Cubison, M. J., Slowik, J. G., Bukowiecki, N., Prévôt, A. S. H., Baltensperger, U., Schneider, J., Kimmel, J. R., Gonin, M., Rohner, U., Worsnop, D. R., and Jayne, J. T.: The ToF-ACSM: a portable aerosol chemical speciation monitor with TOFMS detection, Atmos. Meas. Tech., 6, 3225–3241, https://doi.org/10.5194/amt-6-3225-2013, 2013.
Lee, L. A., Reddington, C. L., and Carslaw, K. S.: On the relationship between aerosol model uncertainty and radiative forcing uncertainty, P. Natl. Acad. Sci. USA, 113, 5820–5827, https://doi.org/10.1073/pnas.1507050113, 2016.
Liu, X., Henzing, B., Hensen, A., Mulder, J., Yao, P., van Dinther, D., van Bronckhorst, J., Huang, R., and Dusek, U.: Measurement report: Evaluation of the TOF-ACSM-CV for PM1.0 and PM2.5 measurements during the RITA-2021 field campaign, Atmos. Chem. Phys., 24, 3405–3420, https://doi.org/10.5194/acp-24-3405-2024, 2024.
Mallet, M., Cravigan, L., Miljevic, B., Vaattovaara, P., Deschaseaux, E., Swan, H., Jones, G., and Ristovski, Z.: Sea spray aerosol in the Great Barrier Reef and the presence of nonvolatile organics, J. Geophys. Res.-Atmos., 121, 7088–7099, https://doi.org/10.1002/2016JD024966, 2016.
Ng, N. L., Herndon, S. C., Trimborn, A., Canagaratna, M. R., Croteau, P. L., Onasch, T. B., Sueper, D., Worsnop, D. R., Zhang, Q., Sun, Y. L., and Jayne, J. T.: An Aerosol Chemical Speciation Monitor (ACSM) for Routine Monitoring of the Composition and Mass Concentrations of Ambient Aerosol, Aerosol Sci. Technol., 45, 780–794, https://doi.org/10.1080/02786826.2011.560211, 2011.
Nuaaman, I., Li, S.-M., Hayden, K. L., Onasch, T. B., Massoli, P., Sueper, D., Worsnop, D. R., Bates, T. S., Quinn, P. K., and McLaren, R.: Separating refractory and non-refractory particulate chloride and estimating chloride depletion by aerosol mass spectrometry in a marine environment, Atmos. Chem. Phys. Discuss., 15, 2085–2118, https://doi.org/10.5194/acpd-15-2085-2015, 2015.
O'Dowd, C. D. and Smith, M. H.: Physicochemical properties of aerosols over the northeast Atlantic: Evidence for wind-speed-related submicron sea-salt aerosol production, J. Geophys. Res.-Atmos., 98, 1137–1149, https://doi.org/10.1029/92JD02302, 1993.
O'Dowd, C. D., Jimenez, J. L., Bahreini, R., Flagan, R. C., Seinfeld, J. H., Hämeri, K., Pirjola, L., Kulmala, M., Jennings, S. G., and Hoffmann, T.: Marine aerosol formation from biogenic iodine emissions, Nature, 417, 632–636, https://doi.org/10.1038/nature00775, 2002.
Ovadnevaite, J., Ceburnis, D., Canagaratna, M., Berresheim, H., Bialek, J., Martucci, G., Worsnop, D. R., and O'Dowd, C.: On the effect of wind speed on submicron sea salt mass concentrations and source fluxes, J. Geophys. Res.-Atmos., 117, https://doi.org/10.1029/2011JD017379, 2012.
Petters, S. S., Kjærgaard, E. R., Hasager, F., Massling, A., Glasius, M., and Bilde, M.: Morphology and hygroscopicity of nanoplastics in sea spray, Phys. Chem. Chem. Phys., 25, 32430–32442, https://doi.org/10.1039/D3CP03793B, 2023.
Rolph, G., Stein, A., and Stunder, B.: Real-time Environmental Applications and Display sYstem: READY, Environ. Model. Softw., 95, 210–228, https://doi.org/10.1016/j.envsoft.2017.06.025, 2017.
Saathoff, H., Naumann, K.-H., Möhler, O., Jonsson, Å. M., Hallquist, M., Kiendler-Scharr, A., Mentel, Th. F., Tillmann, R., and Schurath, U.: Temperature dependence of yields of secondary organic aerosols from the ozonolysis of α-pinene and limonene, Atmos. Chem. Phys., 9, 1551–1577, https://doi.org/10.5194/acp-9-1551-2009, 2009.
Schmale, J., Schneider, J., Nemitz, E., Tang, Y. S., Dragosits, U., Blackall, T. D., Trathan, P. N., Phillips, G. J., Sutton, M., and Braban, C. F.: Sub-Antarctic marine aerosol: dominant contributions from biogenic sources, Atmos. Chem. Phys., 13, 8669–8694, https://doi.org/10.5194/acp-13-8669-2013, 2013.
Schneider, J., Weimer, S., Drewnick, F., Borrmann, S., Helas, G., Gwaze, P., Schmid, O., Andreae, M. O., and Kirchner, U.: Mass spectrometric analysis and aerodynamic properties of various types of combustion-related aerosol particles, Int. J. Mass Spectrom., 258, 37–49, https://doi.org/10.1016/j.ijms.2006.07.008, 2006.
Stein, A. F., Draxler, R. R., Rolph, G. D., Stunder, B. J. B., Cohen, M. D., and Ngan, F.: NOAA's HYSPLIT Atmospheric Transport and Dispersion Modeling System, B. Am. Meteorol. Soc., 96, 2059–2077, https://doi.org/10.1175/BAMS-D-14-00110.1, 2015.
Sutresna, A., Keywood, M., Paton-Walsh, C., Simmons, J., Mynard, C., Dang, Q., Mochida, M., Ohata, S., Afsana, S., Kunwar, B., Kawamura, K., Humphries, R., Dunne, E., Ward, J., Harnwell, J., Reisen, F., Emmerson, K., Griffiths, A., Williams, A., Schofield, R., and Rayner, P.: Interference of sea salt in capture vaporizer-ToF-ACSM measurements of biomass burning organic aerosols in coastal locations, Environ. Sci. Atmospheres, 4, 634–644, https://doi.org/10.1039/D3EA00171G, 2024.
Timonen, H., Cubison, M., Aurela, M., Brus, D., Lihavainen, H., Hillamo, R., Canagaratna, M., Nekat, B., Weller, R., Worsnop, D., and Saarikoski, S.: Applications and limitations of constrained high-resolution peak fitting on low resolving power mass spectra from the ToF-ACSM, Atmos. Meas. Tech., 9, 3263–3281, https://doi.org/10.5194/amt-9-3263-2016, 2016.
van den Born, M.: Dataset for “Measurements of NaCl in Ambient Air with a Capture Vaporizer-ToF-ACSM”, Zenodo [data set], https://doi.org/10.5281/zenodo.23694652, 2026.
Wagner, R., Ickes, L., Bertram, A. K., Els, N., Gorokhova, E., Möhler, O., Murray, B. J., Umo, N. S., and Salter, M. E.: Heterogeneous ice nucleation ability of aerosol particles generated from Arctic sea surface microlayer and surface seawater samples at cirrus temperatures, Atmos. Chem. Phys., 21, 13903–13930, https://doi.org/10.5194/acp-21-13903-2021, 2021.
Xu, W., Croteau, P., Williams, L., Canagaratna, M., Onasch, T., Cross, E., Zhang, X., Robinson, W., Worsnop, D., and Jayne, J.: Laboratory characterization of an aerosol chemical speciation monitor with PM2.5 measurement capability, Aerosol Sci. Technol., 51, 69–83, https://doi.org/10.1080/02786826.2016.1241859, 2017.
Xu, W., Lambe, A., Silva, P., Hu, W., Onasch, T., Williams, L., Croteau, P., Zhang, X., Renbaum-Wolff, L., Fortner, E., Jimenez, J. L., Jayne, J., Worsnop, D., and Canagaratna, M.: Laboratory evaluation of species-dependent relative ionization efficiencies in the Aerodyne Aerosol Mass Spectrometer, Aerosol Sci. Technol., 52, 626–641, https://doi.org/10.1080/02786826.2018.1439570, 2018.
Zhang, Q., Jimenez, J. L., Canagaratna, M. R., Ulbrich, I. M., Ng, N. L., Worsnop, D. R., and Sun, Y.: Understanding atmospheric organic aerosols via factor analysis of aerosol mass spectrometry: a review, Anal. Bioanal. Chem., 401, 3045–3067, https://doi.org/10.1007/s00216-011-5355-y, 2011.
Zheng, Y., Cheng, X., Liao, K., Li, Y., Li, Y. J., Huang, R.-J., Hu, W., Liu, Y., Zhu, T., Chen, S., Zeng, L., Worsnop, D. R., and Chen, Q.: Characterization of anthropogenic organic aerosols by TOF-ACSM with the new capture vaporizer, Atmos. Meas. Tech., 13, 2457–2472, https://doi.org/10.5194/amt-13-2457-2020, 2020.
Zorn, S. R., Drewnick, F., Schott, M., Hoffmann, T., and Borrmann, S.: Characterization of the South Atlantic marine boundary layer aerosol using an aerodyne aerosol mass spectrometer, Atmos. Chem. Phys., 8, 4711–4728, https://doi.org/10.5194/acp-8-4711-2008, 2008.