the Creative Commons Attribution 4.0 License.
the Creative Commons Attribution 4.0 License.
 | 22 Jul 2024
Vertical concentrations gradients and transport of airborne microplastics in wind tunnel experiments
Eike Maximilian Esders
Christoph Georgi
Wolfgang Babel
Andreas Held
Christoph Karl Thomas
Microplastics are an ubiquitous anthropogenic material in the environment, including the atmosphere. Little work has focused on the atmospheric transport mechanisms of microplastic nor its dispersion, despite it being a potential pollutant. We study the vertical transport of airborne microplastics in a wind tunnel, a controllable environment with neutral stability, to identify the necessary conditions for the long-range atmospheric transport of microplastics. An ultrasonic disperser generated airborne water droplets from a suspension of polystyrene microsphere microplastics (MPs) with a diameter of 0.51 µm. The water droplets were injected into the airflow, evaporating and releasing single airborne MPs. The disperser allowed for time-invariant and user-controlled concentrations of MPs in the wind tunnel. MPs were injected at 27, 57, and 255 mm above the ground. A single GRIMM R11 optical particle counter (OPC) and three Alphasense OPCs measured time-averaged MP concentration profiles (27, 57, and 157 mm above the ground). These were combined with turbulent airflow characteristics measured by a hotwire probe to estimate vertical particle fluxes using the flux-gradient similarity theory. The GRIMM R11 OPC measured vertical concentration profiles by moving its sampling tube vertically. The three Alphasense OPCs measured particle concentrations simultaneously at three distinct heights. Results show that maximum concentrations are not measured at the injection height but are rather shifted to the surface by gravitational settling. The MPs experience higher gravitational settling while they are part of the larger water droplets. For the lowest injection at 27 mm, the settling leads to smaller MP concentrations in the wind tunnel, as MPs are lost to deposition. Increasing the wind speed decreases the loss of MPs by settling, but settling is present until our maximum friction velocity of 0.14 m s−1. For the highest injection at 255 mm and laminar flow, the settling resulted in a net MP emission, challenging the expectation of a net MP deposition for high injection. Turbulent flows reverse the MP concentration profile giving a net MP deposition with deposition velocities of 3.7 ± 1.9 cm s−1. Recognizing that microplastics share deposition velocities with mineral particles bridges the gap in understanding their environmental behavior. The result supports the use of existing models to evaluate the transport of microplastics in the accumulation mode. The similar deposition velocities suggest that microplastics transported in the atmosphere can be found in the same places as mineral particles.
- Article
(1486 KB) - Full-text XML
- BibTeX
- EndNote


The introduction of plastic products started in the 1950s and had a great impact on the medical, industrial, and agricultural sectors (Ostle et al., 2019). Yearly production of plastic was 280×106 t in 2012 and is expected to rise to 33×109 t in 2050 (Rochman et al., 2013). Commonly, microplastics (MPs) are defined as plastic particles with a diameter of less than 5 mm. Studies have indicated that residual plastic particles can be found in every environmental compartment on our planet (Allen et al., 2022), including remote locations such as national parks (Brahney et al., 2020) and the Arctic (Bergmann et al., 2022). Especially for remote locations, atmospheric transport is a main pathway (Evangeliou et al., 2020) that had been neglected until Dris et al. (2015) detected MPs in deposition samples in Greater Paris. Since then, more studies have investigated the atmospheric deposition (Klein and Fischer, 2019; Kernchen et al., 2022), the emission to the environment (Chen et al., 2021), and the environmental MP life cycle inventories (Croxatto Vega et al., 2021), covering various aspects of long-scale transport. On smaller scales, air–land interface processes of MP emission and deposition can be investigated in the field (Rezaei et al., 2019) or in the laboratory (Bullard et al., 2021; Esders et al., 2022) using a wind tunnel as an idealized and controllable environment. Bullard et al. (2021) pointed out the distinct behavior of mineral particles and MPs, while Rezaei et al. (2019) investigated the erosivity of low-density MPs. While MP properties are important, the characteristics of the wind flow and turbulence also play a major role in the vertical transport and, therefore, resuspension rates of MPs into the air (Esders et al., 2022). This study focuses on small-scale vertical transport of accumulation-mode (0.1–1 µm diameter) MPs. Particles of this mode are able to remain suspended in the air for extended periods and, hence, strongly influence air quality. We introduce a time-invariant concentration of MPs in a controlled wind tunnel environment and measure the vertical particle concentration gradients using multiple optical particle counters. Further, the flow conditions are varied to study their influence on vertical transport. We address the following research questions:
-
How do vertical particle concentration profiles vary with flow conditions and particle injection heights?
-
Are vertical particle fluxes derived from particle concentration gradients consistent with the commonly applied parameterization of turbulent vertical particle transport?
As previous experiments in the wind tunnel have given statistically robust estimates for the suspension potential of larger particles (Esders et al., 2022), we perform additional particle transport experiments, expecting that vertical particle transport induced by turbulence is consistent with theoretical deposition velocities. To our knowledge, this is the first study to observe the vertical gradients and deposition velocities of airborne MPs under controlled conditions.
2.1 Wind tunnel
The experiments were carried out in a suction-type wind tunnel with a total length of 5.3 m, width of 0.6 m, height of 1.2 m, and contraction zone cross-section of 270 mm × 540 mm (width × height) (see Fig. 1; Esders et al., 2022). Twelve fans (RAB O TURBO 250, Dalap GmbH, Germany) were operated at one end of the wind tunnel to adjust the airflow. Four different flow conditions with a mean horizontal wind speed ranging from 0.38 to 2.17 m s−1 at a height of 157 mm above the wind tunnel surface were used in the experiments. A honeycomb structure ensured laminar flow conditions at the inflow section of the wind tunnel, followed by a defined pattern of cones and roughness elements that generated shear-driven turbulence. Turbulence measurements were performed using a 3D constant temperature anemometer (Model 55P95, controller, Model 54T42, Dantec Dynamics, Skovlunde, Denmark; hereafter referred as hotwire). The hotwire was mounted to a remotely controlled traverse at the end of the contraction zone. Horizontal mean wind speed (U) and friction velocity (u*) were measured at six heights of 13, 16, 27, 57, 128, and 157 mm above the wind tunnel surface using the eddy-covariance technique. The raw data were processed with the bmmflux software package (see Appendix in Thomas et al., 2009). MPs were introduced to the airflow in the inflow section of the contraction zone and measured at the end of the contraction zone.
Figure 1Concept of the wind tunnel with roughness elements, a nebulizer, optical particle counters (OPCs) with three variable inlet heights, and a three-dimensional constant temperature anemometer. The airflow is straightened before entering the wind tunnel by a honeycomb structure.
2.2 Aerosol generation
Factory-fresh polystyrene microsphere microplastics (hereafter referred to as MPs) with a nominal diameter of 0.51 µm (Polybead microspheres, Polysciences, Hirschberg an der Bergstraße, Germany) were provided in a suspension (2.7 % mass) and further diluted to a concentration of 3.9 × 10⁹ particles per milliliter. The nebulizer consisted of a glass reservoir filled with the MP suspension and a submerged 24 V ultrasonic nebulizing unit operating at about 1.7 MHz (Mist Fogger, FITNATE, PR China). Nebulizing the MP suspension at 1.0 mL min−1, approximately 3.9 × 10⁹ airborne particles were generated per minute. After 1 h, the glass reservoir was refilled with 60 mL of the MP suspension to maintain the water column within 1 cm of the optimum level for stable particle generation. Three air pumps with a flow rate of 1.2 L min−1 (connected in parallel) generated a flow rate of 3.6 L min−1. The air pumps introduced filtered air to the reservoir and, thus, advected airborne MPs into the wind tunnel. The tubing of the nebulizer was made of copper with an inner diameter of 5 mm and conductive silicone tubing with an inner diameter of 6 mm, minimizing electrostatic particle losses. The generated aerosol was injected at three different heights above the wind tunnel surface, at 27, 57, and 255 mm. In the wind tunnel, the generated droplets quickly dried while traveling in the airflow at a relative humidity < 25 %, yielding dry MPs with a diameter of 0.51 µm. In a control experiment, the nebulizer was run with only demineralized water to obtain a baseline of particles generated from residual impurities in the water.
2.3 Particle measurement
Two types of optical particle counters (OPCs) were used to detect airborne MPs. A 32-channel optical particle spectrometer (Model R11, GRIMM Aerosol Technik, Ainring, Germany) was attached to a remotely controlled laboratory jack to sample at different heights. The GRIMM R11 was operated with a sample flow rate of 1.2 L min−1 and a measurement interval of 6 s. Additionally, a set of three low-cost OPCs (OPC-N3, Alphasense, Essex, United Kingdom) was installed at 27, 57, and 157 mm above the wind tunnel surface. The Alphasense OPC-N3 used a total flow rate of 5.5 L min−1, a sample flow rate of about 0.28 L min−1, and a measurement interval of 1 s. Preliminary experiments indicated that the particles with a nominal diameter of 0.51 µm were detected in channels 6 to 8 of the GRIMM R11, which cover particle diameters from 0.45 to 0.65 µm. This corresponds to the second channel of the Alphasense N3 with a nominal diameter range from 0.46 to 0.66 µm. Air was sampled from the wind tunnel through copper tubing with a circular bend towards the horizontal wind direction and directly connected to the inlets of the particle counters. The inner diameter of the tubing used for the GRIMM OPC was 3 mm with a total length of 150 mm, while the inner diameter for the Alphasense OPC was 5 mm with a total length of 180 mm. Particle concentrations measured by the Alphasense OPCs are in good agreement with the GRIMM OPC data (see Fig. A1 in Appendix A). With a slope of 1.03 and a coefficient of determination of R2 = 0.91, the linear regression model indicates a small bias. We conclude that the Alphasense OPC data are physically meaningful, despite the Alphasense OPC being a low-cost sensor.
2.4 Injection height and flow conditions
Experiments covered three MP injection heights, 27, 57, and 255 mm, and four flow conditions. We define the flow conditions by the voltage supplied to the wind tunnel fans. A minimum voltage of 20 V was necessary for steady rotation of the fans and was defined as flow condition A (FC-A). Flow conditions B, C, and D were defined by voltages of 30, 40, and 60 V (FC-B, FC-C, and FC-D), respectively. The setup resulted in about 10 min of data per sampling height for the three Alphasense OPCs and about 3 min at each of the three sampling heights for the GRIMM OPC, as the latter cycled through all three sampling heights. During all experiments, live particle concentration data were displayed to identify potential problems with particle injection. Some runs had to be aborted when concentrations fell. We suspect that the nebulizer produced a few big droplets that clogged the tubing, as a subtle wet trail was visible on the roughness elements in front of the nebulizer's outlet after an extended period of operation. This occurred twice before finishing a measurement cycle, and residual MP was cleaned off before the restart.
2.5 Particle flux estimation
The vertical concentration profile, derived from particle concentrations at different heights, allows for the estimation of the vertical particle flux using flux-gradient similarity theory. This estimation is only valid in the lower part of boundary layer, the surface layer, where turbulent fluxes are constant with height. For example, the turbulent momentum flux and the wind speed gradient are related as
where Fm is the momentum flux (m2 s−2), Km is the eddy diffusivity of the momentum flux (m2 s−1), U is the mean horizontal wind speed (m s−1), and z is the measurement height (m) (Kaimal and Finnigan, 1994). Assuming neutral stratification, the eddy diffusivity Km can be parameterized as
where κ is the von Karman constant (= 0.4) and u* is the friction velocity. Using Eq. (2) and integrating Eq. (1) between z1 and z2, we obtain
As , Eq. (3) can be rewritten as follows:
The mean wind speed becomes 0 at height z0, the so-called momentum roughness length. With U1 = 0 at z1 = z0, we obtain the logarithmic wind profile:
In analogy to Eq. (3), the turbulent particle flux Fc (m−2 s−1) is
where cz is the particle concentration at the respective height z. Here, we implicitly assume that the eddy diffusivity of scalar particle transport Kc is equal to the eddy diffusivity of momentum transport Km. Note that scalar eddy diffusivity is expected to be larger than for momentum transport, e.g., up to 1.35 times larger for heat transport (Foken, 2016). Thus, our flux values are lower estimates.
3.1 Flow conditions
For the slowest fan settings, wind speeds are vertically uniform with U = 0.39 m s−1 (FC-A), representing laminar flow conditions (see Fig. 2). Starting with FC-B, a boundary-layer profile starts to develop in the wind tunnel. The wind speed gradient increases from FC-B to FC-D. Regressing a linear model to the data, representing ln (z) as a function of mean wind speed U, yields the friction velocity u* and the roughness length z0, both summarized in Table 1.
Figure 2The logarithmic height (ln (z)) as a function of the mean wind speed (U) for the four flow conditions (FC-A to FC-D). The inverse of the slope times the van Karman constant (κ = 0.4) yields the friction velocity (u*). Extrapolating the data to U = 0 yields the roughness length (z0).
Table 1Friction velocity (u*) and roughness length (z0) values depending on the flow conditions (FCs). Values are calculated according to Eqs. (4) and (5). Horizontal turbulence intensity (tiu) and mean horizontal velocity increase from FC-A to FC-D. The tiu is the standard deviation of the horizontal velocity deviations divided by the mean horizontal velocity.
n/a: not applicable.
From FC-A to FC-D, u* increases. The roughness length varies from z0 = 0.3 mm to z0 = 0.5 mm, which corresponds with approximately 1/20 of the height of the roughness elements, which is about 10 mm. We measured at low wind speeds to observe the effect of laminar flow and turbulent flow on the vertical particle transport.
3.2 Vertical particle concentrations
In the control experiments without MP injection, the median particle concentration in the observed diameter bins related to the nominal MP diameter of 0.51 µm was 0.2 cm−3 (GRIMM). In contrast, in experiments with MP injection, the particle concentration ranged from 0.49 to 166 cm−3, considering all measurements at all different heights. We corrected observed concentrations in experiments with MP injection by subtracting the median baseline concentration. Note that particle concentrations smaller than the baseline concentrations cannot be resolved in our experiments.
Particle concentration profiles for each flow condition and three MP injection heights are shown in Fig. 3. In general, particle concentrations are higher at low wind speeds compared with higher wind speeds due to lower dilution. Injection height also influences concentrations, with injection at 27 mm exhibiting overall smaller particle concentrations than the 57 mm height. Unexpectedly, concentrations are highest at 57 mm when injected at 255 mm (FC-A) and are highest at 27 mm when injected at 57 mm, challenging previous assumptions. The nebulizer emits water droplets carrying the MPs. While the MPs are carried by the water droplet, they experience higher gravitational settling, as they are part of the relatively larger water droplets. As the water droplets descend, the MPs are released at the height at which the majority of water droplets evaporated, not at the height of injection (see Fig. 4a). Thus, the gravitational settling of the water droplet shifts the release of MPs downwards from 255 to ∼ 57 mm for laminar flow (FC-A). Further, water droplets depositing at the surface before evaporating inhibit the release of MPs into the airflow. Assuming that the settling velocity is independent of injection height, higher injection gives more time for evaporation. Hence, injection at 57 mm results in higher concentrations compared with 27 mm, as less MPs deposit. For higher wind speeds, turbulence develops and the water droplets descend less before evaporating; hence, the MPs are released higher. Thus, injection at 255 mm shows deposition for FC-B, FC-C, and FC-D (see Fig. 4b). Further, with increasing wind speed, the concentrations at the lowest position are more similar for injection at 27 and 57 mm, as the MP deposition is decreased. However, for injection at 57 mm, the downward shift is still present for FC-D. The results contradict the assumption that concentrations should be highest at the height of particle injection, but they are explained by the effects of gravitational settling on the particle distribution.
Figure 3Particle concentrations as a function of height with increasing friction velocities (0.1 to 0.14 m s−1). In the individual plots, data are colored corresponding to the injection height. Error bars represent the standard error (n = 25).
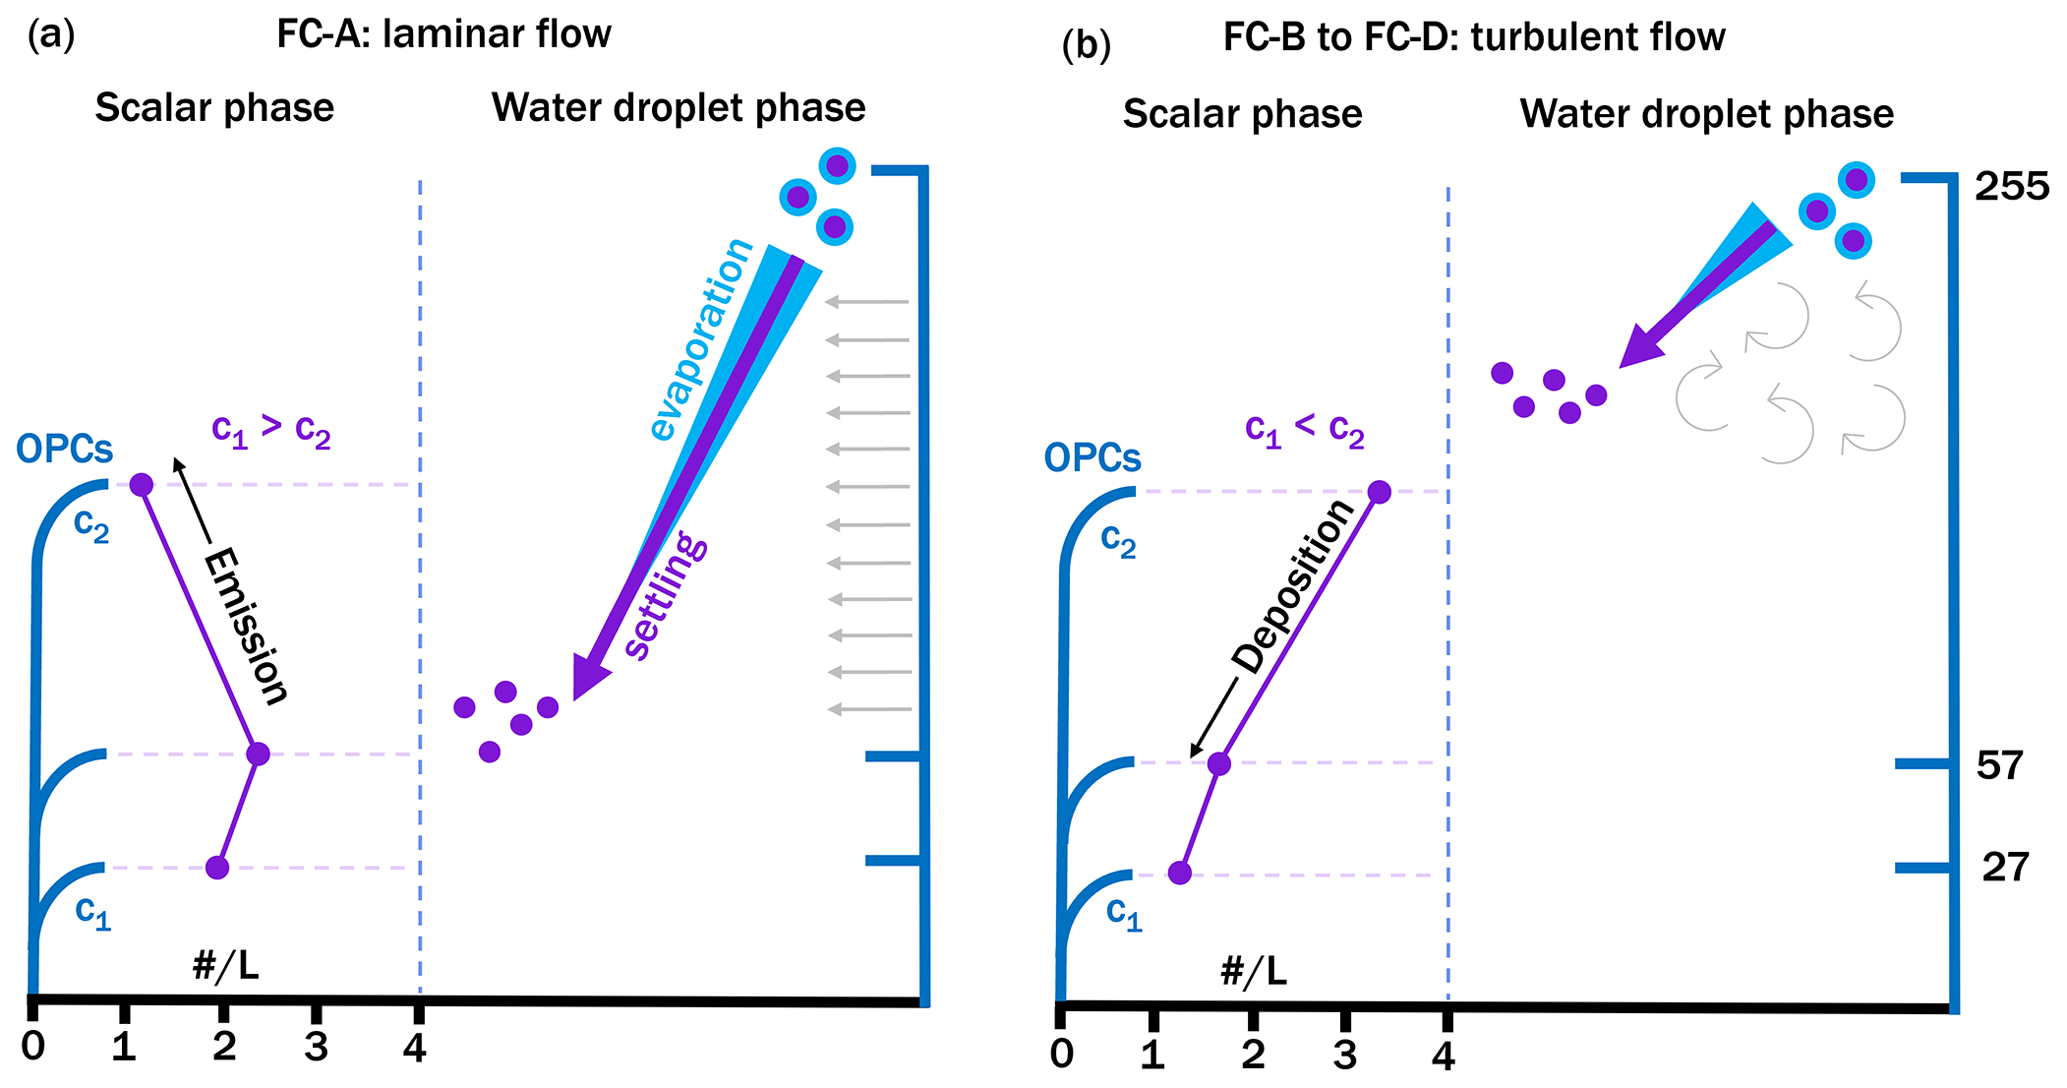
Figure 4Higher settling velocities during the water droplet phase explain the downward shift in the highest particle concentrations. Water droplets carry the polystyrene microsphere microplastics (MPs). As the water droplets descend down, the MPs are released at the height at which the majority of water droplets evaporated, not at the height of injection. Transitioning to turbulent flow, water droplets descend less and the particle concentration profile reverses.
3.3 Vertical particle fluxes
Vertical particle fluxes derived from particle concentration profiles measured by the Alphasense OPCs and the GRIMM OPC are similar (see Fig. 5). The highest injection at 255 mm results in emission for laminar flows and deposition for turbulent flows. Injection at 57 and 27 mm results in emission independent of the flow conditions. Higher wind speeds increase the vertical particle flux for injection at 27 mm. The vertical particle flux for injection at 57 and 255 mm changes slightly with increasing wind speed under turbulent conditions. Maximum emission fluxes are observed for an injection height of 57 mm, while injection at 27 mm leads to smaller fluxes. For injection at 27 mm, MPs are lost to deposition. Hence, the overall particle concentration is smaller, as is the flux. With increasing wind speed, the deposition decreases, the particle concentration increases, and the flux increases.
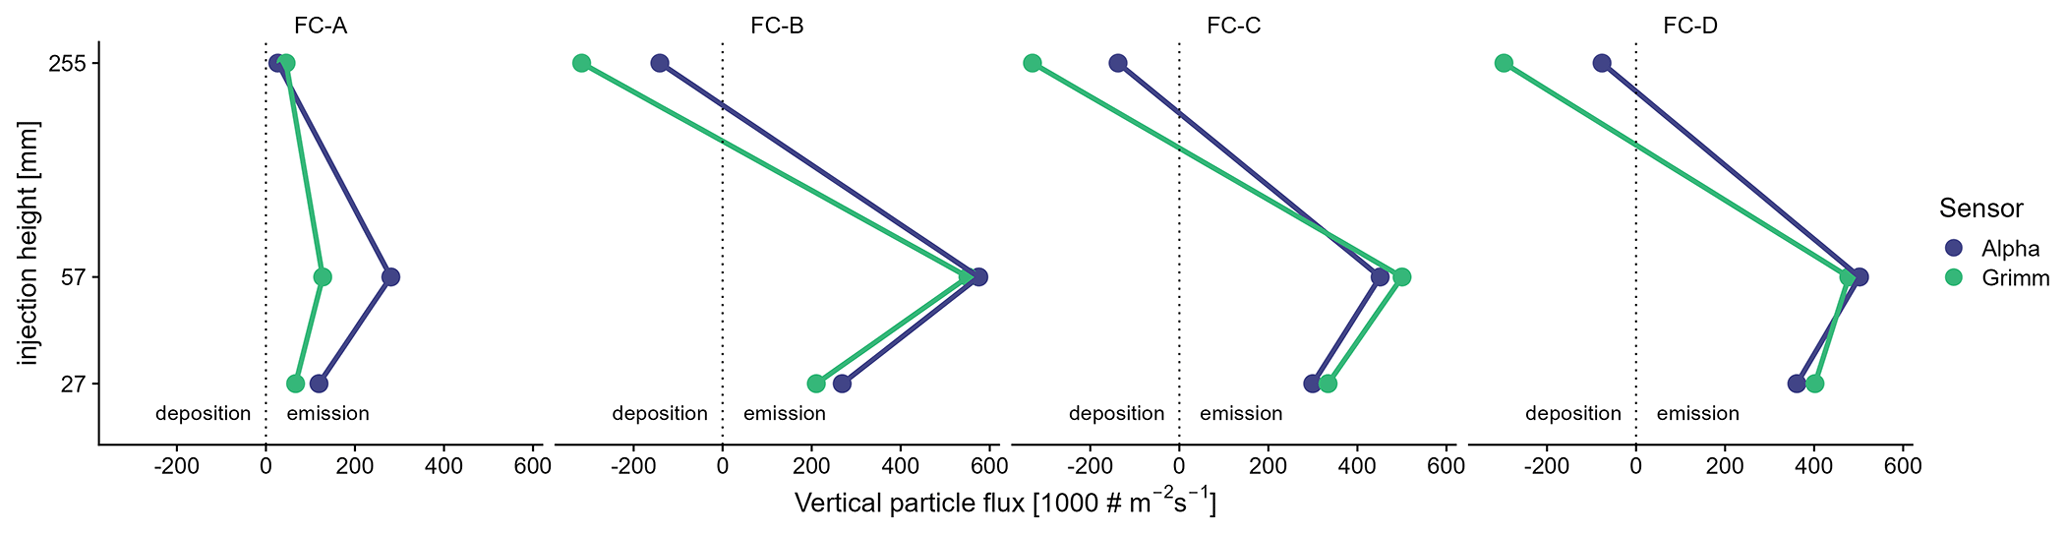
Figure 5The vertical particle flux in relation to the injection height for four flow conditions (FC-A to FC-D). The friction velocity increases from FC-A to FC-D. Positive particle fluxes mean emission, whereas negative particle fluxes mean deposition.
We calculated the deposition velocities for negative particle fluxes, which is the particle flux normalized by its particle concentration. The deposition velocities are similar to other findings for open, flat terrain and increase with increasing u* (1.8, 3.74, and 5.73 cm s−1 compared with 0.5–1 cm s−1) (e.g., Sehmel, 1980; Slinn, 1982; Saylor et al., 2019).
Hence, the results indicate that MPs in the accumulation mode are transported vertically, similar to other particles with likely higher densities in the accumulation mode. However, factory-fresh microspheres do not necessarily represent the majority of MPs found in the environment. In recent studies, fragments and fibers have been found to be the predominant shapes of deposited atmospheric MPs (Kernchen et al., 2022; Brahney et al., 2020), and it has been shown that fibers have significantly lower settling velocities (Tatsii et al., 2024). However, the aerodynamic behavior of such nonspherical particles is often described with an aerodynamic equivalent diameter. Using spherical MPs with a nominal diameter of 0.51 µm was a successful compromise between sufficiently large particle concentrations and reliable optical detection. The large volume flow rate in the wind tunnel leads to strong dilution of particle number concentrations, while the small sampling volume rate of the OPCs requires a minimum number of particles for robust measurements.
Recent findings have indicated that bubble bursting and rain droplets impacting the ocean surface transfer MPs from the ocean into the atmosphere, with estimates suggesting the emission of around 1014 particles per year (Oehlschlägel et al., 2024; Lehmann et al., 2023; Shaw et al., 2023; Shiu et al., 2022). During these processes, MPs are encapsulated in water droplets as they are emitted into the atmosphere. If the evaporation time of these droplets is shorter than their settling time, the MPs are released into the air. Consequently, the transport conditions in these natural processes are analogous to those in our experiments. Thus, our results support the hypothesis that MPs released from the ocean surface are vertically transported and can potentially travel long distances.
Vertical particle fluxes measured by the low-cost Alphasense OPCs are comparable to the GRIMM OPC. These low-cost sensors can provide meaningful results for applications where many OPCs are needed, such as concentration profile measurements. We observed the vertical transport of airborne MPs in laminar and turbulent flow. In laminar flow, gravitational settling in the water droplet phase shifted the release of the airborne MPs downward. In turbulent flow, the downward shift decreased, whereas it reversed the vertical concentration gradient for high injection, resulting in deposition of MPs. Our results suggest that MPs share deposition velocities with mineral particles, which is a first step to bridge the gap in understanding their environmental behavior. However, further experimental work over a greater range of MP particle sizes and shapes is needed. The result supports the use of existing models to evaluate the transport of MPs in the accumulation mode. We conclude that, similar to mineral particles, MPs are transported from areas of high concentration to areas of lower concentration. They are suspended in the atmosphere in regions with high wind speeds and are eventually deposited in areas where wind speeds decrease. However, under wind-still conditions, particles in the accumulation mode remain in the atmosphere and influence the local air quality. Further, the similar deposition velocities suggest that MPs transported in the atmosphere can be found in the same places as mineral particles.
A1 Cone positioning in the wind tunnel
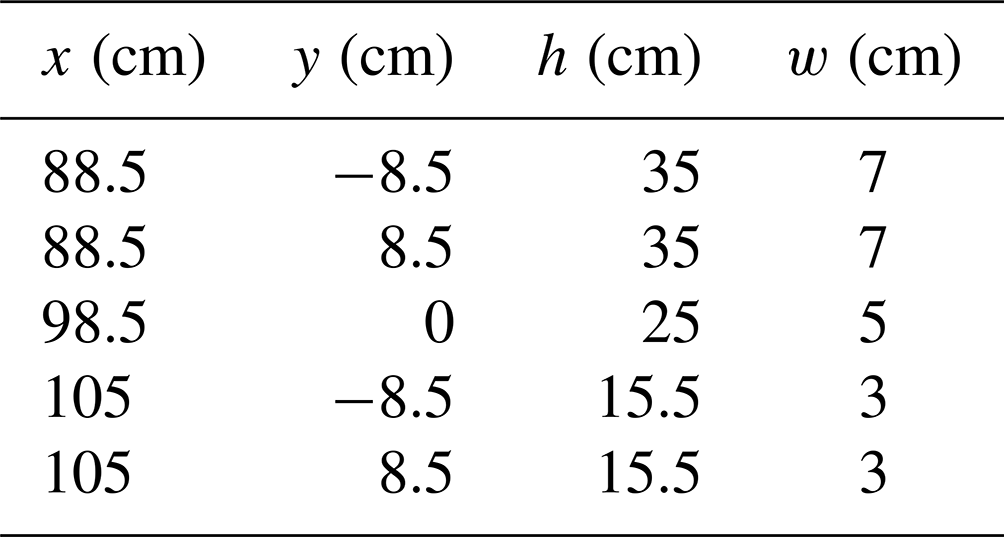
The positions of the cones installed in the wind tunnel are shown in Table A1. The x axis is aligned with the mean wind flow. The y axis is aligned with the cross wind flow. In the direction of air flow, the origin (x, y = 0, 0) is at the start of the contracted section x = 0 and in the middle of the wind tunnel's cross section y = 0.
Table A1Coordinates of the five cones installed in the wind tunnel, defined by an x and y value. The cones' dimensions are defined by height (h) and ground width (w).
A2 Alphasense and GRIMM
Particle concentrations measured by the Alphasense OPCs are in good agreement with the GRIMM OPC data (see Fig. A1). With a slope of 1.03 and a coefficient of determination of R2 = 0.91, the linear regression model indicates a small bias. We conclude that the Alphasense OPC data are physically meaningful, despite this instrument being a low-cost sensor.
The Alphasense OPCs report lower concentrations than the GRIMM OPC at low levels. Consequently, the vertical particle fluxes in Fig. 5 are consistently smaller when using Alphasense data compared with GRIMM data. During injection at 255 mm, concentrations were low at the bottom and high at the top. The Alphasense overestimates lower concentrations, resulting in a smaller gradient compared with the GRIMM.
Figure A1Particle concentrations measured by the Alphasense optical particle counters (OPCs) as a function of those measured by the GRIMM R-11 OPC. The dashed line, with a slope of 1 and intercept of 0, signifies perfect agreement. Proximity to this line indicates better agreement between the two OPC types, revealing consistency in measurements, although not necessarily accuracy with respect to the true values.
The data that support the findings of this study are available from the corresponding author, Eike Maximilian Esders, upon reasonable request.
EME planned and conducted the wind tunnel experiments, prepared the instrumental setup, and revised the manuscript with suggestions from CKT and AH; CG planned and conducted the wind tunnel experiments, prepared the instrumental setup, and wrote the manuscript; WB, CKT, and AH supervised the writing and experimental process.
At least one of the (co-)authors is a member of the editorial board of Aerosol Research. The peer-review process was guided by an independent editor, and the authors also have no other competing interests to declare.
Publisher’s note: Copernicus Publications remains neutral with regard to jurisdictional claims made in the text, published maps, institutional affiliations, or any other geographical representation in this paper. While Copernicus Publications makes every effort to include appropriate place names, the final responsibility lies with the authors.
The authors acknowledge the financial support of the Deutsche Forschungsgemeinschaft (DFG, German Research Foundation).
This research has been supported by the Deutsche Forschungsgemeinschaft (DFG, German Research Foundation; project no. 391977956 – SFB 1357).
This paper was edited by Jose Castillo and reviewed by two anonymous referees.
Allen, D., Allen, S., Abbasi, S., Baker, A., Bergmann, M., Brahney, J., Butler, T., Duce, R. A., Eckhardt, S., Evangeliou, N., Jickells, T., Kanakidou, M., Kershaw, P., Laj, P., Levermore, J., Li, D., Liss, P., Liu, K., Mahowald, N., Masque, P., Materić, D., Mayes, A. G., McGinnity, P., Osvath, I., Prather, K. A., Prospero, J. M., Revell, L. E., Sander, S. G., Shim, W. J., Slade, J., Stein, A., Tarasova, O., and Wright, S.: Microplastics and nanoplastics in the marine-atmosphere environment, Nature Reviews Earth & Environment, 3, 393–405, https://doi.org/10.1038/s43017-022-00292-x, 2022. a
Bergmann, M., Collard, F., Fabres, J., Gabrielsen, G. W., Provencher, J. F., Rochman, C. M., van Sebille, E., and Tekman, M. B.: Plastic pollution in the Arctic, Nature Reviews Earth & Environment, 3, 323–337, https://doi.org/10.1038/s43017-022-00279-8, 2022. a
Brahney, J., Hallerud, M., Heim, E., Hahnenberger, M., and Sukumaran, S.: Plastic rain in protected areas of the United States, Science, 368, 1257–1260, https://doi.org/10.1126/science.aaz5819, 2020. a, b
Bullard, J. E., Ockelford, A., O'Brien, P., and McKenna Neuman, C.: Preferential transport of microplastics by wind, Atmos. Environ., 245, 118038, https://doi.org/10.1016/j.atmosenv.2020.118038, 2021. a, b
Chen, X., Huang, G., and Dionysiou, D. D.: Editorial Overview: Emissions of Microplastics and Their Control in the Environment, J. Environ. Eng., 147, 01821002, https://doi.org/10.1061/(ASCE)EE.1943-7870.0001897, 2021. a
Croxatto Vega, G., Gross, A., and Birkved, M.: The impacts of plastic products on air pollution – A simulation study for advanced life cycle inventories of plastics covering secondary microplastic production, Sustainable Production and Consumption, 28, 848–865, https://doi.org/10.1016/j.spc.2021.07.008, 2021. a
Dris, R., Gasperi, J., Rocher, V., Saad, M., Renault, N., and Tassin, B.: Microplastic contamination in an urban area: a case study in Greater Paris, Environ. Chem., 12, 592, https://doi.org/10.1071/EN14167, 2015. a
Esders, E. M., Georgi, C., Babel, W., and Thomas, C. K.: Quantitative detection of aerial suspension of particles with a full-frame visual camera for atmospheric wind tunnel studies, Aerosol Sci. Tech., 56, 530–544, https://doi.org/10.1080/02786826.2022.2048789, 2022. a, b, c
Evangeliou, N., Grythe, H., Klimont, Z., Heyes, C., Eckhardt, S., Lopez-Aparicio, S., and Stohl, A.: Atmospheric transport is a major pathway of microplastics to remote regions, Nat. Commun., 11, 3381, https://doi.org/10.1038/s41467-020-17201-9, 2020. a
Foken, T.: Angewandte Meteorologie, Springer Berlin Heidelberg, Berlin, Heidelberg, https://doi.org/10.1007/978-3-642-25525-0, ISBN 978-3-642-25524-3, 978-3-642-25525-0, 2016. a
Kaimal, J. C. and Finnigan, J. J.: Atmospheric Boundary Layer Flows: Their Structure and Measurement, Oxford University Press, https://doi.org/10.1093/oso/9780195062397.001.0001, ISBN 978-0-19-756016-7, 1994. a
Kernchen, S., Löder, M. G. J., Fischer, F., Fischer, D., Moses, S. R., Georgi, C., Nölscher, A. C., Held, A., and Laforsch, C.: Airborne microplastic concentrations and deposition across the Weser River catchment, Sci. Total Environ., 818, 151812, https://doi.org/10.1016/j.scitotenv.2021.151812, 2022. a, b
Klein, M. and Fischer, E. K.: Microplastic abundance in atmospheric deposition within the Metropolitan area of Hamburg, Germany, Sci. Total Environ., 685, 96–103, https://doi.org/10.1016/j.scitotenv.2019.05.405, 2019. a
Lehmann, M., Häusl, F. P., and Gekle, S.: Modeling of vertical microplastic transport by rising bubbles, Microplastics and Nanoplastics, 3, 4, https://doi.org/10.1186/s43591-023-00053-7, 2023. a
Oehlschlägel, L. M., Schmid, S., Lehmann, M., Gekle, S., and Held, A.: Water–air transfer rates of microplastic particles through bubble bursting as a function of particle size, Microplastics and Nanoplastics, 4, 1, https://doi.org/10.1186/s43591-023-00079-x, 2024. a
Ostle, C., Thompson, R. C., Broughton, D., Gregory, L., Wootton, M., and Johns, D. G.: The rise in ocean plastics evidenced from a 60-year time series, Nat. Commun., 10, 1622, https://doi.org/10.1038/s41467-019-09506-1, 2019. a
Rezaei, M., Riksen, M. J. P. M., Sirjani, E., Sameni, A., and Geissen, V.: Wind erosion as a driver for transport of light density microplastics, Sci. Total Environ., 669, 273–281, https://doi.org/10.1016/j.scitotenv.2019.02.382, 2019. a, b
Rochman, C. M., Browne, M. A., Halpern, B. S., Hentschel, B. T., Hoh, E., Karapanagioti, H. K., Rios-Mendoza, L. M., Takada, H., Teh, S., and Thompson, R. C.: Classify plastic waste as hazardous, Nature, 494, 169–171, https://doi.org/10.1038/494169a, 2013. a
Saylor, R. D., Baker, B. D., Lee, P., Tong, D., Pan, L., and Hicks, B. B.: The particle dry deposition component of total deposition from air quality models: right, wrong or uncertain?, Tellus B, 71, 1550324, https://doi.org/10.1080/16000889.2018.1550324, 2019. a
Sehmel, G. A.: Particle and gas dry deposition: A review, Atmospheric Environment (1967), 14, 983–1011, https://doi.org/10.1016/0004-6981(80)90031-1, 1980. a
Shaw, D. B., Li, Q., Nunes, J. K., and Deike, L.: Ocean emission of microplastic, PNAS Nexus, 2, pgad296, https://doi.org/10.1093/pnasnexus/pgad296, 2023. a
Shiu, R.-F., Chen, L.-Y., Lee, H.-J., Gong, G.-C., and Lee, C.: New insights into the role of marine plastic-gels in microplastic transfer from water to the atmosphere via bubble bursting, Water Res., 222, 118856, https://doi.org/10.1016/j.watres.2022.118856, 2022. a
Slinn, W. G. N.: Predictions for particle deposition to vegetative canopies, Atmospheric Environment (1967), 16, 1785–1794, https://doi.org/10.1016/0004-6981(82)90271-2, 1982. a
Tatsii, D., Bucci, S., Bhowmick, T., Guettler, J., Bakels, L., Bagheri, G., and Stohl, A.: Shape Matters: Long-Range Transport of Microplastic Fibers in the Atmosphere, Environ. Sci. Technol., 58, 671–682, https://doi.org/10.1021/acs.est.3c08209, 2024. a