the Creative Commons Attribution 4.0 License.
the Creative Commons Attribution 4.0 License.
 | 22 Oct 2025
Decay-phase aerosol dynamics of an indoor particle source have a significant role in exposure analysis
Kuisma Vesisenaho
Heino Kuuluvainen
Ukko-Ville Mäkinen
Miska Olin
Panu Karjalainen
Indoor particle sources have been recognized as major contributors to aerosol particle exposure, posing a health risk, particularly to people spending much of their time indoors. Previously, most of the studies examining indoor particle sources have focused on active periods of the sources instead of the decay phase of the emitted particle concentration. This gives the motivation for this study to investigate the decay of particle lung-deposited surface area (LDSA) concentrations following indoor particle emissions, with a focus on cooking activities. Two decay functions were derived to describe these processes. The first function considers ventilation, particle deposition onto surfaces, and a stable background particle source, whereas the second function also includes coagulation. These functions were validated using measurements that covered four dwellings equipped with mechanical ventilation systems. Both decay functions accurately fit the measured data, with the more comprehensive function, including coagulation, consistently achieving lower fitting errors, particularly at high LDSA concentrations. Using urban air quality data of LDSA concentrations from the city of Tampere, the decay functions were further applied to estimate the contribution of cooking to the daily LDSA dose. The cooking-related dose fraction varied widely, from 17.2 % to 93.9 %, reflecting the influence of cooking styles and ventilation systems. Crucially, using the simpler decay function and using the coagulation-inclusive function, from 66.5 % to 80.3 % and from 72.9 % to 82.9 % of the cooking-related LDSA dose, respectively, occurred during the decay phase after active cooking. The findings highlight the importance of considering the post-cooking decay phase in total exposure assessments and demonstrate the utility of these functions for interpolating or extrapolating LDSA data. The decay functions derived in this study can be applied to describe other indoor particle sources; distinguish emissions of successive indoor emission events; and investigate factors affecting the decay process, such as ventilation.
- Article
(2231 KB) - Full-text XML
-
Supplement
(1309 KB) - BibTeX
- EndNote


Exposure to aerosol particles can cause various negative health effects, such as cardiovascular diseases, diabetes, chronic respiratory diseases, and premature mortality (Kim et al., 2015; WHO, 2021). In particular, fine particulate matter (PM2.5), consisting of particles smaller than 2.5 µm, has been strongly linked to the negative health effects of aerosol particles (Liu et al., 2017; Chen and Hoek, 2020). Globally, PM2.5 is estimated to cause 4.2 million (Cohen et al., 2017), 8.9 million (Burnett et al., 2018), or 10.2 million (Vohra et al., 2021) premature deaths annually. To prevent the negative health effects, the exposure to particles resulting from spending time under elevated particle concentrations should be reduced. One approach, currently adopted, is to regulate particle concentrations by means of guidelines (WHO, 2021) and legislation (EU, 2008; EPA, 2013). For instance, in the European Union, the reduction in PM2.5 concentration achieved by legislation and technology measures between 1970 and 2010 is estimated to have resulted in an annual financial benefit of USD 232 billion (Turnock et al., 2016).
However, the regulations and monitoring of particle concentrations mainly focus on outdoor air quality, although people living in developed countries spend approximately 80 % to 95 % of their time indoors (Hussein et al., 2012; Yoon et al., 2022; EPA, 2011). Scungio et al. (2020) have proposed that the particle dose could be underestimated by 35 % if assessed using city-scale outdoor particle concentrations rather than personal-scale measurements that account for both indoor and outdoor exposure. This underestimation could further increase as outdoor air quality improves. The finding of Scungio et al. (2020) highlights the importance of measuring indoor aerosol even though the variance of indoor particle concentrations in time and between different spaces is greater than that of outdoor concentrations, making it more challenging to measure.
Indoor particle sources are typically related to burning or thermal processes, and, because of that, cooking, smoking, candle burning, and the usage of electrical devices are considered to be the main sources of indoor particles (Hussein et al., 2006; Wallace and Ott, 2011; Isaxon et al., 2015; Zhao et al., 2021). It has been estimated that indoor sources contribute 56 % of the daily particle number dose in developed countries (Zhao et al., 2021). Often, the sources are active only for short periods, but, for example, decay of the high cooking-generated particle concentration can take from an hour to several hours (Hussein et al., 2006; Wan et al., 2011; Isaxon et al., 2015). Due to the long decay time, it has been observed that cooking-generated particles can induce significant exposure after the cooking action, for instance, during a night's sleep (Pacitto et al., 2018; Zhao et al., 2021). Pacitto et al. (2021) have reported that the contribution of cooking and eating activities to the daily particle dose varies from 13 % to 59 % in western cities and from 7 % to 14 % in cities located in low- and middle-income countries. The same study also shows that, in general, women are receiving higher doses of cooking-generated particles. Additionally, it has been shown that the particle dose received from cooking varies greatly depending on ventilation style, ingredients, cooking style, and stove type (Kang et al., 2019; Abdullahi et al., 2013; Wallace and Ott, 2011).
Morawska et al. (2013) have estimated, based on measurements carried out by Wallace and Ott (2011), that cooking produces 47 % of ultrafine particles (UFPs) indoors. Moreover, indoor UFPs have been estimated to cause 67 % (Wallace and Ott, 2011), 59 % (Bhangar et al., 2011), or 31 % (Mullen et al., 2011) of the total dose of UFPs. Ultrafine particles with a diameter of 100 nm or below have been considered to be a health risk (WHO, 2021) due to their ability to enter the bloodstream via the lungs (Nemmar et al., 2002; Ohlwein et al., 2019). Through the circulatory system, a small fraction of UFPs can deposit in distal organs, including the heart, kidneys, and liver (Oberdörster et al., 2005; Schraufnagel, 2020). Additionally, UFPs have been found to translocate to the brain via the olfactory nerve (Oberdörster et al., 2004; Kanninen et al., 2020). Studies also suggest that UFPs have higher toxicity per mass unit in comparison to larger particles, likely as a result of a greater surface area that leads to a higher oxidative potential (Donaldson et al., 2002; Monteiller et al., 2007).
When assessing exposure to aerosol particles, it is highly important that the quantity describing particle concentration correlates well with the health effects. However, the negative health responses to PM2.5 mass concentration, the most commonly used particle concentration quantity in the current regulations, vary between different cities or regions (Li et al., 2019). Therefore, in this study, particle concentration is described by lung-deposited surface area (LDSA) concentration, which combines the surface area concentration of particles and the deposition efficiency of particles into the human respiratory tract. According to Schmid and Stoeger (2016), this combination makes LDSA concentration, from the toxicological perspective, the most relevant concentration metric to indicate the negative health effects of particles. Lepistö et al. (2023) and Salo et al. (2021) have also found that, when LDSA is used as a metric instead of PM2.5, the differences in terms of the strength of the health response to particles between different geographical regions become narrower. In addition to the ability to describe health effects, LDSA concentration is relatively easy and inexpensive to measure with sensor-type instruments when the particle size is between 20 and 400 nm (Todea et al., 2017; Fierz et al., 2011, 2014). This size range is suitable for measuring the majority of particles emitted from indoor sources such as cooking (Wallace, 2006; Buonanno et al., 2009; Wan et al., 2011; Abdullahi et al., 2013). However, the downside of choosing LDSA concentration as the particle concentration unit is that there are no already-solved decay functions for the decay process of LDSA concentration.
Exposure to particles emitted from indoor sources is highly connected to the characteristics of indoor environments and ventilation. Finland is an example of a country in which mechanical supply-and-exhaust ventilation with supply air filtration and heat recovery has been required in new buildings since 2003 (Hänninen et al., 2005). According to the National Building Code of Finland (section D2, 2003), the air exchange rate should be 0.35 dm3 s−1 m−2, which, in 2.5 m high space, corresponds to a ventilation rate of 0.5 h−1, which has also been the standard in many other countries in Europe (Dimitroulopoulou, 2012). A recent study by Zukowska et al. (2021) showed that mechanical ventilation is becoming a common choice in several European countries, induced by the need to reduce the energy consumption of buildings. In developing countries, natural ventilation still dominates in residential buildings, but global mega-trends, such as climate change and urbanization, will evidently increase the need for air conditioning and air infiltration, for which the mechanical ventilation is beneficial (Ahmed et al., 2021; Niculita-Hirzel, 2022). While mechanical ventilation reduces the exposure to outdoor particles (Park et al., 2014; Silvonen et al., 2023), buildings equipped with mechanical ventilation are usually airtight, which slows down the decay process of indoor-generated particles. This offers one explanation as to why cooking-related LDSA exposure has more significance in developed countries, considered in this study, as Pacitto et al. (2021) report. Altogether, these findings emphasize the need for characterization of aerosol dynamics of the decay phase in mechanically ventilated dwellings.
The aim of this study is to first develop aerosol-dynamics-based decay functions describing the decay phase of indoor particle emission using LDSA concentration as the metric. Subsequently, the second objective is to investigate the impact of cooking, including the decay phase of cooking-generated particles, on the daily LDSA dose by applying the decay functions. The experiments are carried out using sensor-type devices to measure LDSA concentration in four different dwellings equipped with mechanical ventilation systems.
Indoor particle sources are often active for only a short period of time, yet they produce high particle concentrations which decay slowly in an indoor environment (Hussein et al., 2006; Wan et al., 2011; Isaxon et al., 2015). As a result, a measurement covering only the active time of the particle source is not enough to assess the total source-induced exposure. A decay function describing the decay phase of the particle concentration resulting from the source would provide a useful tool for extending observations outside of the measured time period and for further understanding the dilution process. In addition, the decay function could be applied to distinguish the emissions of successive emission events from one another. In this study, two decay functions are derived from the solutions of differential equations. The first function considers ventilation and particle deposition onto walls, which are the most essential aerosol processes indoors (Nazaroff, 2004). The second decay function also includes coagulation, which becomes a relevant process with high particle concentrations. Furthermore, both decay functions consider a stable background source that covers, for example, particles transferred from outdoor air.
2.1 Decay function considering ventilation and deposition
Ventilation can be categorized into mechanical, natural, and leakage ventilation that accounts for aerosol flow through cracks in the building's envelope (Nazaroff, 2004). All of these ventilation processes can be present at the same time, for instance, when a window is opened in a mechanically ventilated dwelling. In mechanical ventilation, supply air is filtered with the efficiency ηM, and, in leakage ventilation, the size and the shape of the cracks determine the penetration factor P, denoting the fraction of particles being transferred from outdoor to indoor air. Both the filter efficiency and the penetration factor depend on the particle size. Using this classification and assuming that the indoor air is well-mixed, the ventilation-related time behaviour of LDSA concentration can be described by the following differential equation:
where V is the volume of the indoor space, and QM, QN, and QL are the flow rates of mechanical, natural, and leakage ventilation, respectively. The additional subscript of the flow rates also indicates the direction of the flow. Indoor LDSA concentration CLDSA,i and outdoor LDSA concentration CLDSA,o are defined as
where CN is the particle number concentration, dp is the particle diameter, Ap is the surface area of a particle, and DFal is the size-dependent deposition fraction of particles to the alveolar region of the human lungs. Looking at the right side of Eq. (1), the first term represents the supply ventilation transporting LDSA concentration from outdoor to indoor air, and the second term stands for the exhaust ventilation transporting LDSA concentration in the opposite direction.
In addition to ventilation, deposition to the surfaces of the indoor space has an effect on the indoor LDSA concentration. According to Nazaroff (2004), diffusion and gravitational settling are the main deposition mechanisms indoors depending on the particle size. By converting the differential equation for mass concentration presented by Nazaroff and Cass (1989) into LDSA concentration, the decrease in LDSA concentration driven by deposition can be expressed as
where the index j spans the surfaces of the indoor space so that Aj is the area of a surface, and is the mean deposition velocity of LDSA. Using the particle-size-dependent deposition coefficient of LDSA βLDSA, Eq. (3) can be simplified to
It has to be noted that the values of βLDSA differ from more commonly used deposition coefficients of particle number or mass (Crump et al., 1982; Lai, 2002). This difference can be understood from Eq. (3), where the deposition velocity is for LDSA instead of mass or number. However, from the same equation, it can be seen that the deposition coefficient depends on the geometry of the studied indoor space, in which case the comparison of deposition coefficients is not useful even when the metrics of particle concentration would match.
By combining Eqs. (1) and (4) and including the supply ventilation term of Eq. (1) in the constant background source SLDSA, assuming that outdoor LDSA concentration stays constant, the time behaviour of indoor LDSA concentration can be described as a differential equation:
Because the first and the second terms on the right side of Eq. (5) are both first-order terms, they can be further combined using the dilution coefficient DLDSA so that the differential equation is written as
The solution of Eq. (6) is a time-dependent function for indoor LDSA concentration:
where is the initial indoor LDSA concentration at the start of the decay process. Looking at Eq. (7) as time approaches infinity, the time derivative of LDSA concentration approaches zero, and LDSA concentration approaches the background concentration resulting from the background source. Consequently, as time approaches infinity, Eq. (6) can be written as . Substituting this into Eq. (7), the equation can be formulated into the form
where the initial and the background indoor LDSA concentrations can be measured by making the dilution coefficient the only fitting parameter. In Sect. S1.1 of the Supplement, the equation is derived in more detail, starting from Eq. (6). Equation (8) is estimated to be functional in indoor emission events, with particle number concentrations under 104 cm−3 leading to a negligible role of coagulation (Hussein et al., 2009).
2.2 Decay function considering ventilation, deposition, and coagulation
In contrast to the above, if the indoor particle concentration rises higher than 104 cm−3, which is typical, for example, as a result of cooking (Wallace, 2006; Buonanno et al., 2009; Pacitto et al., 2018), coagulation starts to act as a notable aerosol process that has an effect on the time behaviour of indoor particle concentration. Modelling the coagulation of aerosol consisting of several size modes is feasible, but it leads to a relatively complicated form of equations (Whitby and McMurry, 1997). Therefore, in this study, straightforward assumptions that all particles of the studied aerosol are equal in size and that the coagulation coefficient stays constant as a function of time are applied. With these assumptions, the effect of coagulation on particle number concentration can be described using a differential equation:
where K is the coagulation coefficient, and the factor is a multiple of , by which calculation of one collision as two collisions between the same particles is avoided, and −1, which is the change in particle number when two particles collide and adhere, forming a larger particle. To convert Eq. (9) from particle number into LDSA, the change in LDSA when two particles of the same size coagulate, forming a larger particle, has to be evaluated. This change, ΔLDSA, can be expressed as
where , , and are the number, the surface area, and the alveolar deposition efficiency, respectively, of the initial particles with a size of dp,1. Correspondingly, and are the surface area and the alveolar deposition efficiency, respectively, of the formed particle with a size of dp,2. In Eq. (10), the expression inside brackets accounts for the final state, in which two initial particles have transformed into one larger particle, and the last term represents the initial state.
To further investigate the change in LDSA in coagulation, the alveolar deposition efficiency and the particle surface area have to be expressed as a function of the particle size. The alveolar deposition efficiency can be estimated using the human respiratory tract model of ICRP (1994). In the size range of 30 to 300 nm, the model can be parameterized using the expression , where a is 14.37 nm. The coefficient of determination (R2) for the parameterization is 0.987. By assuming that the particles are spherical, the surface area can be simply expressed as . Substituting this expression into Eq. (10), the equation can be rearranged into the form
When mass is conserved and the density of spherical particles is assumed to be equal between the initial and the formed particles, a relation between the initial particle size and the size of the formed particle is
where ρ is the density of a particle. By solving Eq. (12), the size of the formed particle can be expressed with respect to the initial particle size as . Substituting this expression into Eq. (11) gives
Another equation that is needed for converting Eq. (9) for LDSA concentration is the relationship between number concentration and LDSA concentration. In the case of particles of only one size and using the expressions and , this relationship can be solved from Eq. (2) to become
Finally, substituting the factor −1 with Eq. (13) and the number concentration with Eq. (14), Eq. (9) can be transformed to describe the effect of coagulation on LDSA concentration as
where coagulation coefficient is the same as in Eq. (9). Equation (15) can be simplified to
where KLDSA is the coagulation coefficient for LDSA, which is
When Eq. (16) is applied to indoor LDSA concentration and combined with Eq. (6), time behaviour of indoor LDSA concentration driven by ventilation, deposition onto surfaces, and coagulation is described as a differential equation:
This second-order differential equation has an analytical solution of
where an auxiliary variable is utilized. Similarly to Eq. (7), the background source term can be expressed using background LDSA concentration. The investigation of Eq. (18) as time approaches infinity gives . Using this expression, the auxiliary variable b can be written as
Now, Eq. (20) can be applied to transform Eq. (19) into a more simplified form:
where dilution and coagulation coefficients of LDSA, also included in the auxiliary variable b, are the fitting parameters as initial and background LDSA concentrations can be measured. In Sect. S1.2, the equation is derived in more detail, starting from Eq. (18). Comparing Eq. (21) to Eq. (8), the form of the function is more complex, and the number of parameters is also by higher by one. Because of this, it might be worthwhile to consider in which cases the presumably more accurate Eq. (21) is reasonable to use instead of the simpler Eq. (8).
3.1 Experiments and measurement devices
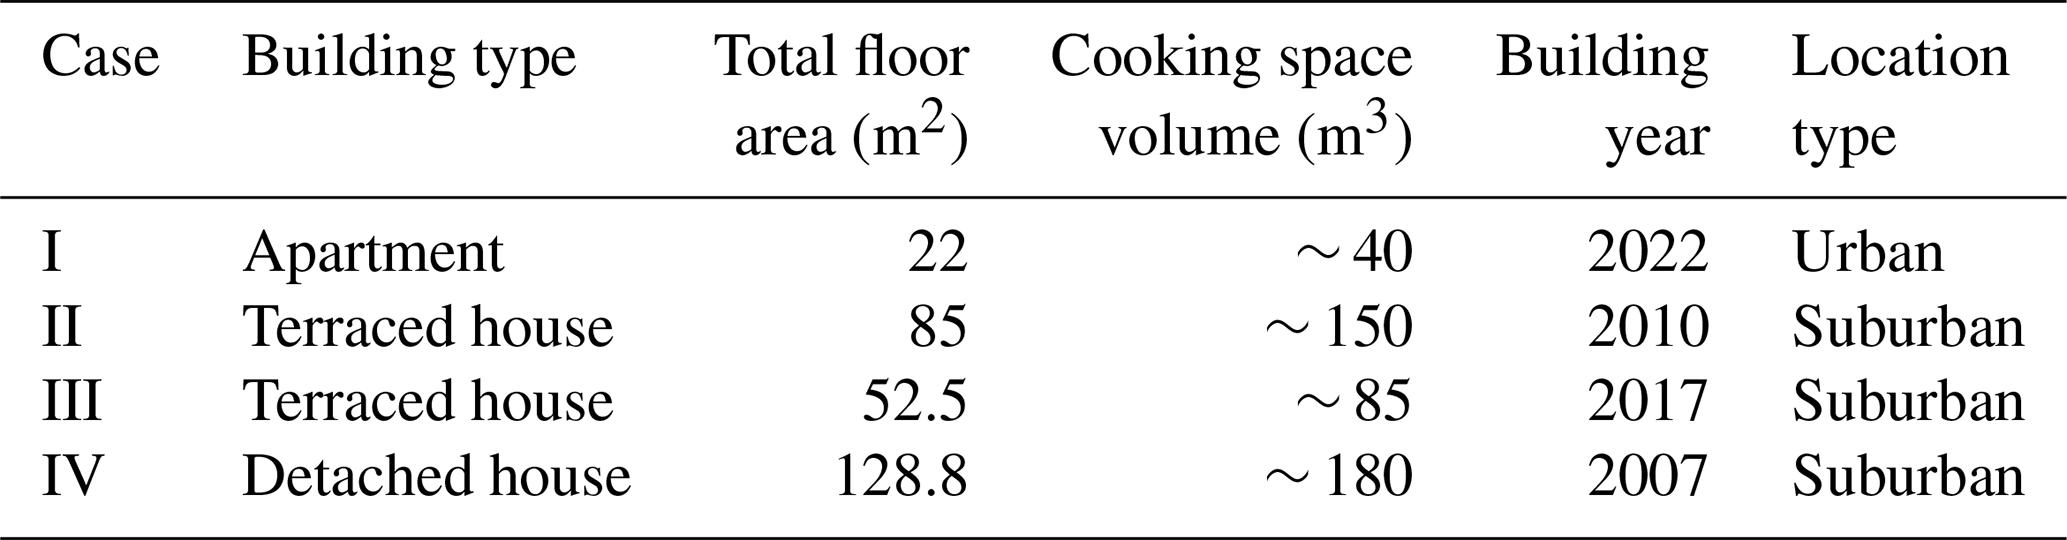
To validate the decay functions derived in Sect. 2, measurements investigating indoor particle emissions of cooking in residential buildings were conducted between 13 September 2022 and 13 October 2022. The measurements took place in the region of Tampere, Finland. With a population of approximately 244 000, Tampere represents an average European city, where the population is around 249 000, computed from the most recent population values of European cities provided by Eurostat (2024). A total of four measurements, designated as cases I to IV, were conducted in four different dwellings equipped with mechanical supply-and-exhaust ventilation systems. The measurement sites included one apartment, two terraced houses, and one detached house, with floor area ranging from 22 to 128.8 m2. The dwellings of cases II to IV are located in a suburban area, whereas the apartment of case I is located in an urban area, which might have an effect on background particle concentration. The dwellings of the measurement cases are described more precisely in Table 1. In addition, the floor plans are represented case by case in Figs. S1 to S4 in the Supplement.
Table 1The specifications of the measurement sites in cases I to IV.
In all cases, the measurement setup consisted of three Partector sensors (Naneos GmbH) measuring LDSA concentration and a DiSCmini sensor measuring geometric mean diameter (GMD), LDSA concentration, and number concentration of particles (Matter Aerosol AG). Both monitors first charge particles using a unipolar diffusion charger, followed by the measurement of the electric current caused by the charged particles. However, the Partector charges particles periodically and measures the current induced in a Faraday cage (Fierz et al., 2014), while the DiSCmini charges particles continuously and measures the current resulting from captured particles in two stages, a diffusion stage and a filter stage (Fierz et al., 2011). In both sensors, LDSA concentration is determined using the fact that, in the size range of 20 to 300 nm, LDSA concentration is approximately directly proportional to the electrical charge of particles resulting in the current. The estimate of the geometric mean diameter provided by the DiSCmini is based on a calibrated particle size distribution and the ratio of the currents of the two stages (Fierz et al., 2011).
For the LDSA concentration of the Partector and the number concentration of the DiSCmini, manufacturers report a measurement accuracy of ±30 %. According to Naneos GmbH, for the Partector, this accuracy holds in the particle size range of 20 to 400 nm, while the sensor is able to detect particles from 10 nm up to 10 µm. On the other hand, for the DiSCmini, the given accuracy is reported to apply to the whole size range of 20 to 700 nm when the mode of the size distribution is, on a number basis, between 20 and 300 nm. Todea et al. (2017) investigated the accuracy of both sensors in the accuracy size ranges reported by manufacturers with a large variety of test aerosols by comparing the results to ones measured with a scanning mobility particle sizer (SMPS) or a condensation particle counter (CPC). The study shows that, on average, the underestimation of LDSA concentration is 12 % and 7 % for the Partector and the DiSCmini, respectively. In addition, the DiSCmini is, on average, observed to overestimate the number concentration by 32 % and underestimate the mean particle size by 10 %. Based on these results, the Partector and the DiSCmini are capable of measuring the LDSA concentration of cooking-generated particles, which are dominated by UFPs in terms of number concentration and typically have a mode of surface area distribution below 400 nm (Buonanno et al., 2009; Wan et al., 2011), with reasonable accuracy for validating the derived decay functions.
In the measurement setups of this study, the first Partector and the DiSCmini were located in the living room and were kept stationary; the second Partector was carried around in a backpack, sampling aerosol from the breathing zone; and the third Partector was placed and kept stationary outside of the dwelling. An example of the locations of the stationary sensors and the stove is presented in Fig. 1, while all of the setups are presented in Figs. S1 to S4. In cases II to IV, the sensors located in the living room were placed in a opposite the stove and a metre away from the walls, but in case I, the placement differed due to furniture and the small size of the apartment. During the cooking, the backpack sensor was close to the stove as the resident wearing the backpack was in charge of the cooking. After the cooking event, the measurement backpack was carried around in different rooms to observe how the particle emissions spread across the dwelling. The outside sensor was placed in a protective bag to keep the temperature of the Partector more stable.
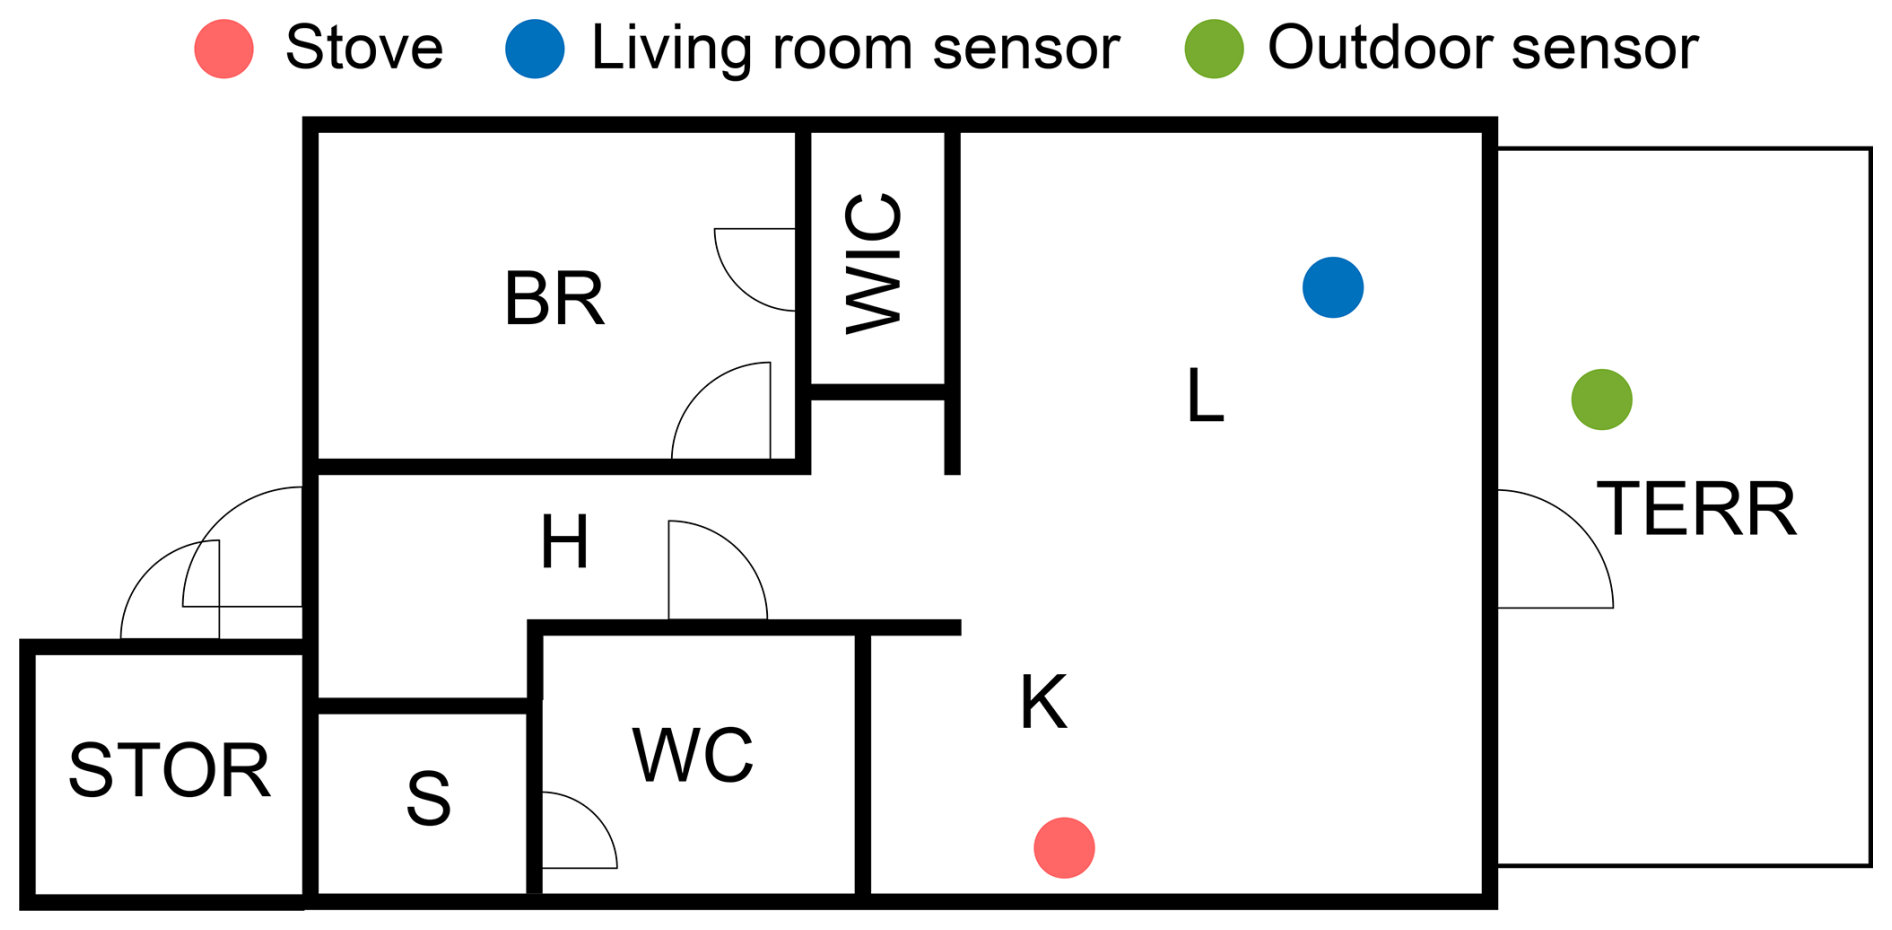
Figure 1The locations of the stove, the living-room sensor, and the outdoor sensor in case III as an example of the measurement setup in this study. The abbreviations of the floor plan are explained in Table S1.
Table 2The specification of cooking measurements in cases I to IV. Considering extra ventilation during cooking, range hoods were divided into two types. A type-1 range hood has its own exhaust channel, whereas a type-2 range hood is connected to the exhaust ventilation system of the dwelling. All listed times are UTC+3.
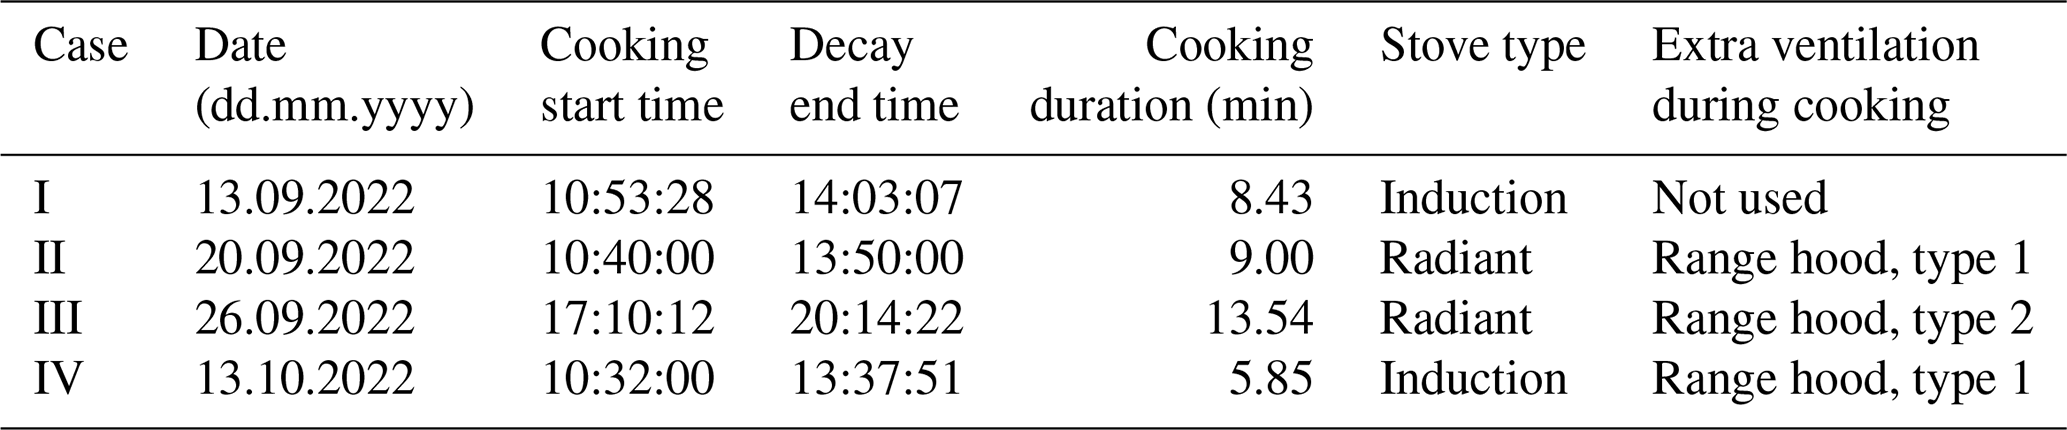
The measurement started with a zero measurement of 5 min through a high-efficiency particulate air filter (HEPA) followed by a 15 min long background measurement. In these measurements, all sensors sampled from the same pipeline. The mean LDSA concentration values of Partectors varied between 0.64 and 1.25 µm2 cm−3 during the zero measurements. Moreover, the differences between Partectors in terms of the average LDSA concentrations of the background measurements were below 1 µm2 cm−3 in all cases. After making sure that the readings of the sensors were in line, the sensors were placed in the locations described above. In those locations, an hour of background was measured before the cooking started. During the cooking, 250 g of raw chicken strips were pan fried with 15 mL of rapeseed oil. In all cases, the stove was electrical, but both induction and ceramic radiant cooktops were included, as Table 2 shows. Apart from case I, ventilation was enhanced during cooking. In cases II and IV, extra ventilation was achieved using a range hood that has its own exhaust channel, whereas, in case III, the range hood is connected to the exhaust ventilation system of the dwelling. The duration of the cooking event was widely varying, probably due to different cooking styles and stove models. The shortest cooking time was 5 min and 51 s, whereas the longest cooking event took 13 min and 32 s. Table 2 presents a more accurate description of the measurements in each case. After the cooking, the decay phase of indoor particles was measured for 3 h, during which time the measurement backpack was carried around into different rooms of each dwelling, and no extra ventilation or mixing was applied. However, the backpack measurement data were not further utilized in the computation of this study. For that reason, the movement information of the backpack measurement is only presented in the field log of the data publication to enable further analysis (Vesisenaho et al., 2025).
To evaluate the role of cooking-generated particles in the total exposure to aerosol particles, the outdoor LDSA concentrations at two measurement stations in Tampere, Epilä and Pirkankatu, were requested from the city of Tampere. The measurement station of Epilä is located in a suburban area, whereas Pirkankatu is located in an urban area. The data covered 1 year, starting from 1 November 2021, and were measured at both stations with diffusion-charging AQ Urban sensors (Pegasor Ab). The sensor is based on the Pegasor PPS-M sensor that measures the net current escaping the instrument due to the outflow of charged particles (Rostedt et al., 2014; Kuula et al., 2019). The correlation between the current of the AQ Urban sensor and LDSA concentration measured with a differential mobility particle sizer (DMPS) has been found to be strong (R2=0.93), with an error of 19 % in urban air quality measurements conducted by Kuula et al. (2019).
3.2 Algorithm for determining the length of the mixing phase
In previous studies investigating the time behaviour of cooking-generated particles indoors, it has been observed that the highest concentration could be reached after the active cooking event (Kim et al., 2018; Tang et al., 2024; Kang et al., 2019). Additionally, for the minutes following the cooking event, the variation of the concentration has been observed to be higher than average during the decay process (Kim et al., 2018; Kang et al., 2019). However, the decay functions derived in this study are not able to describe both the increase in concentration resulting from a periodic source and the decay of concentration within one fit. The functions also include assumption that the aerosol is well-mixed. Consequently, the observations of the previous studies suggest that it might not be possible to utilize the decay functions immediately after the cooking event.
To solve this challenge, a mixing phase was introduced as a time period that includes both the potential concentration increase and the mixing-related variation of concentration. The length of the mixing phase was determined by an algorithm based on the normalized root mean square error (NRMSE) of a fitted decay function following Eq. (21). According to the algorithm, the normalization is performed using the mean value of data points, and the decay function including coagulation is selected for the algorithm because the highest concentrations, where coagulation might have a substantial role, are likely to be measured in the mixing phase. Next, in the algorithm, the decay function is fitted to the time series of LDSA concentration using a non-linear least squares method and with a varying starting point. In the first fit, the starting point is the first measurement point after the cooking event, and then it is shifted 5 s forward in every fit, covering the first 20 min following the cooking event. The relative deviation from the minimum NRMSE is expected to stabilize near the minimum at a certain time, indicating the length of the mixing phase. The starting point of the first fit having an NRMSE within 10 % of the minimum NRMSE is defined as the end point of the mixing phase.
3.3 Dose calculation
In this study, the daily LDSA dose received by the population of the Tampere region was assessed by combining the results of cooking measurements, the fits of the decay functions, and the observations of outdoor air quality. The total dose of cooking-generated particles was calculated by summing the background-subtracted LDSA doses during the cooking, mixing, and extrapolated decay phases. The decay phase was extrapolated using the fitted decay function, and the LDSA doses δLDSA are determined using the following equation:
where IR is the inhalation rate (IR), while t0 and t1 are the start and the end point of the phase, respectively. The daytime IR of 16.3 L min−1 was computed as the average IR excluding the sleep or nap time of individuals aged from 21 to 60 years based on the statistics of EPA (2009). In the case of cooking and mixing phases, the integrand was the LDSA concentration of the living room subtracted from the mean indoor background concentration. The integration is performed numerically using the trapezoidal rule. The dose of the extrapolated decay phase was computed using the integral of the background-term-subtracted fits of Eqs. (8) and (21). To get the total dose of the extrapolated decay phase, the integral of Eq. (22) was calculated from the starting point of the decay phase to infinity. Despite integrating to infinity, the total dose of a single cooking event was verified to be suitable for assessing a daily dose because, in all cases, the integral increased by less than 1 ‰ after 12 h of decay.
The outdoor air quality data of Tampere were utilized to estimate the average background doses of indoor and outdoor environments. As the mean LDSA concentrations of day and night, presented in Sect. 4.3, were used to compute the background doses, Eq. (22) could be simplified to the form
where is the average LDSA concentration, and Δt is the time spent in a certain environment. The estimate for the indoor dose was computed in two parts using Eq. (23). First, the indoor dose during the night was calculated using the nighttime mean concentration of Tampere's air quality stations and an I O ratio of 0.44, which has been determined by Silvonen et al. (2023) for an office building located in Tampere.
In the calculation of the nightly indoor dose, the length of a night was assumed to be 8 h, and an average sleep or nap IR of 4.8 L min−1 (EPA, 2009) was used. Secondly, the indoor dose during the daytime was computed from the daytime mean concentration of Tampere using the I O ratio, the daytime IR, and the average time spent indoors in Finland as provided by Hussein et al. (2012). The sleep time assumed in this study, 8 h, was subtracted from the indoor-spent time of 21 h and 26 min.
4.1 Cooking measurements
In all cases, cooking was observed to induce 1 to 3 orders of magnitude higher LDSA concentrations compared to the background concentrations measured before the cooking event. This is illustrated in Fig. 2, which presents the time series of cooking experiments including the background measurements. The highest concentration was measured in case I, where the mean concentration during the cooking event was 1800 µm2 cm−3 in the living room. Regarding the cooking event and from the perspective of personal exposure, the backpack measurement would be more representative than the living-room measurement, but in case I, there was an interruption in the backpack measurement during that period. However, due to the small size of the apartment in case I, the living-room measurement was carried out within 3 m of the stove. In cases II to IV, the mean LDSA concentrations of backpack measurements during the cooking event were 9.8, 75.9, and 13.7 µm2 cm−3, respectively. The difference between the concentration levels of case I and other cases is most probably explained by a higher frying pan temperature related to cooking style in case I and the fact that extra ventilation was not used in case I. During the cooking event, the 5 min average of the geometric mean particle size presented in Fig. 2 was within the size range of UFPs in all cases, which indicates that the cooking emission is in the accurate size range of the Partector. Due to the significant oscillation of the mean particle size under low particle concentrations, the size is presented only when the mean LDSA concentration of the 5 min period is at least 5 µm2 cm−3.
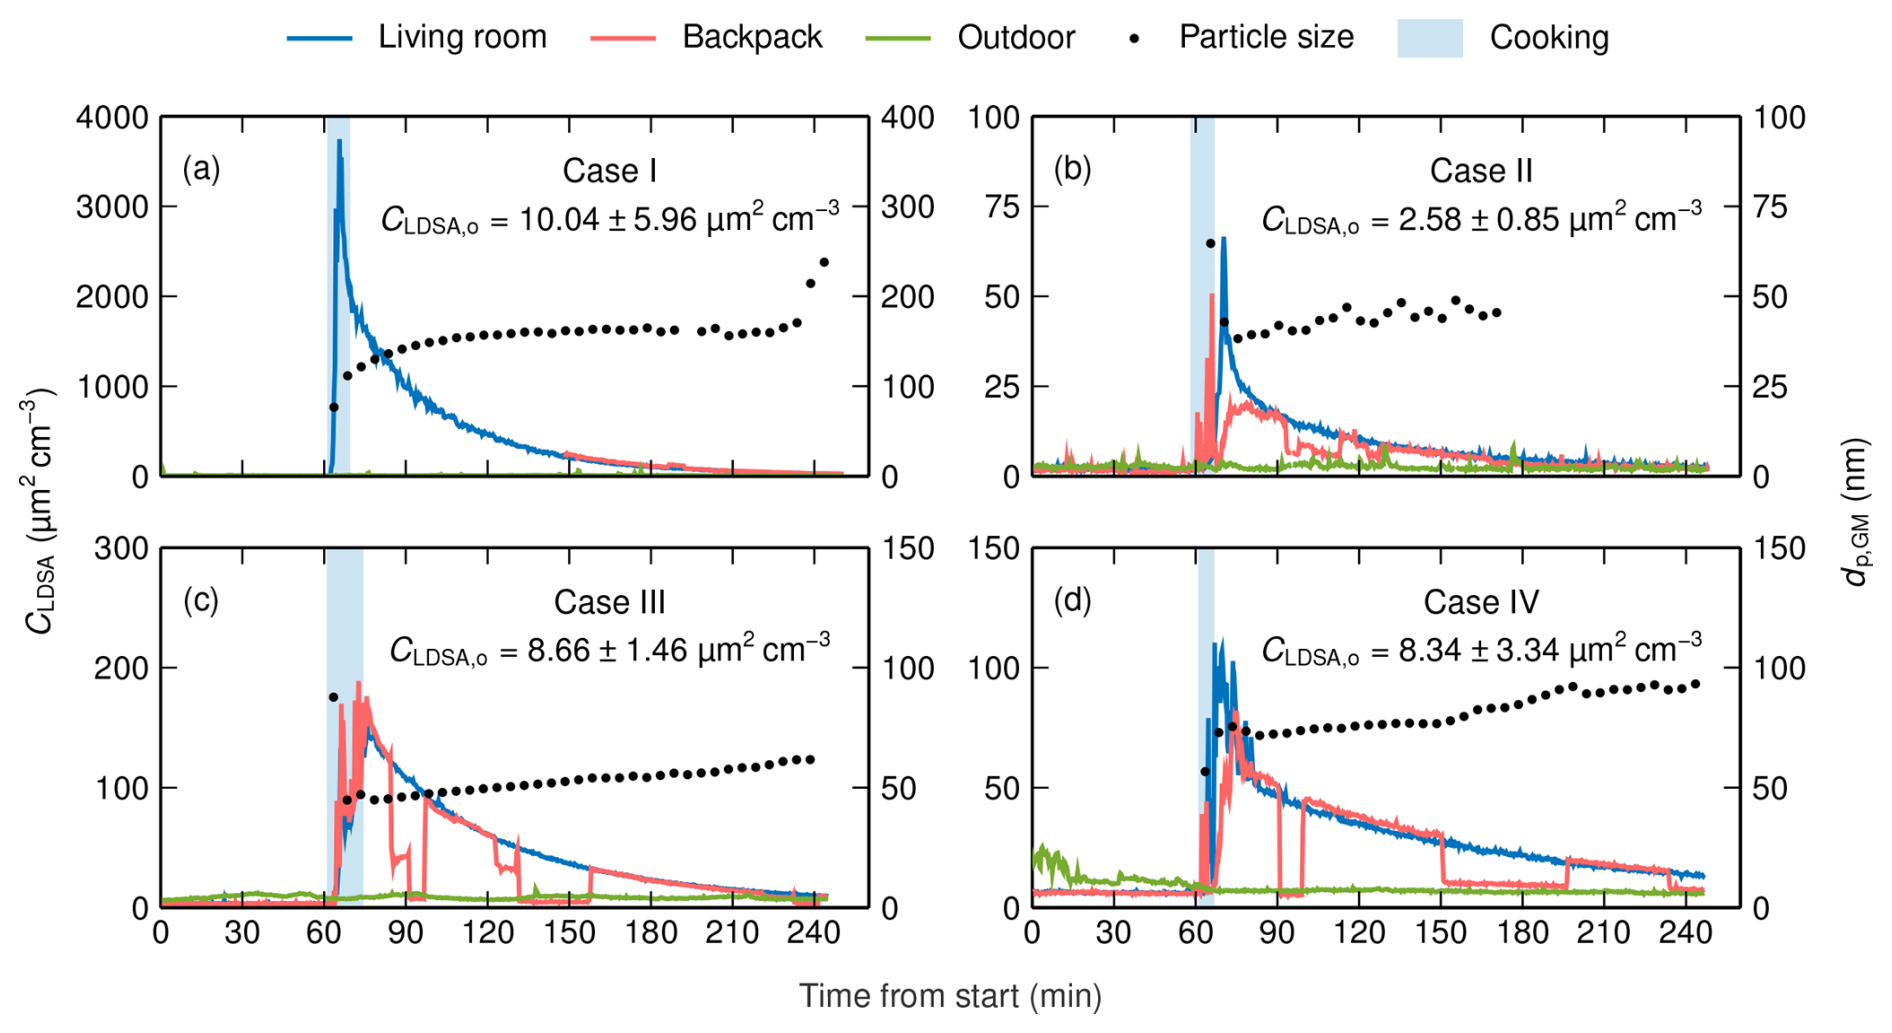
Figure 2Time series of living-room, backpack, and outdoor LDSA concentrations and particle size as GMD in cases I (a), II (b), III (c), and IV (d). The time series cover the background measurement and the whole cooking experiment including 3 h of decay. LDSA concentrations are measured using Partectors, and mean particle sizes are measured using the DiSCmini. The mean particle size is presented as a 5 min average when LDSA concentration is at least 5 µm2 cm−3. In addition, the mean and the standard deviation of outdoor LDSA concentration are presented numerically.
Compared to previous studies, the LDSA concentrations of the cooking event are relatively low in cases II to IV, whereas, in case I, the concentration is comparatively high (Geiss et al., 2016; Pacitto et al., 2018; Scungio et al., 2020; Pacitto et al., 2021). For instance, Pacitto et al. (2018) reported the median LDSA concentrations of indoor cooking events in developed countries. In that study, the highest median concentration of 1362 µm2 cm−3 was observed in Guilford, United Kingdom, and the lowest median concentration of 94.3 µm2 cm−3 was observed in Lund, Sweden. Comparing to the results of Pacitto et al. (2018), it has to be noted that, in the study in question, LDSA is defined as a surface area deposited in both the alveolar region and the tracheobronchial region of the lungs, which leads to a 15 % to 20 % increase in LDSA concentrations. The measured mean particle sizes are in line with previous research also reporting a majority of UFPs (Hussein et al., 2006; Buonanno et al., 2009).
However, in cases II to IV, the highest concentrations in the living room were observed after the cooking event. The peak number concentrations measured with DiSCmini were 1.05×10⁶, 3.06×10⁴, 6.12×10⁴, and 4.09×104 cm−3 in cases I to IV, respectively. These values can be compared to the ones determined by Yeung and To (2008) for pan-frying chicken fillets in rapeseed oil using an electric griddle. The comparison to the values of that study, ranging from 5.14×10⁵ to 8.58×105 cm−3, confirms that, apart from case I, the cooking emission was relatively low in this study. Additionally, the phenomenon in which the peak concentration is reached after the cooking event indicates that the mixing and dispersion of cooking-generated particles into the living room require time. In addition, freshly cooked food is likely to produce particles that might increase LDSA concentration notably when food is not under an actively operated range hood.
After the peak concentration, LDSA concentration starts to decay slowly, requiring several hours in all cases. Simultaneously, the geometric mean of particle diameter increases, for instance, as the deposition coefficient of UFPs is higher than that of accumulation-mode particles (Lai, 2002). In addition, coagulation increases the particle size, especially under high particle concentrations, as in case I, where the role of coagulation can be observed in the higher increase rate of particle size compared to in other cases. During the decay process, the LDSA concentration of different rooms in the dwellings, measured using the backpack, varied greatly. Mainly, the concentrations remained highest in the kitchen and the living room, but in case I, the concentration in the bathroom was observed to be the highest after approximately 2 h of decay. Throughout the measurements, outdoor LDSA concentrations were stable compared to indoor concentrations in all cases. Both the highest mean concentration and the highest standard deviation were measured in case I, as expected. Overall, the outdoor concentrations were low in comparison to globally typical outdoor LDSA concentrations (Pacitto et al., 2021; Lepistö et al., 2023).
4.2 Utilization of the decay functions
The evaluation of the decay functions derived in Sect. 2 is conducted by fitting the functions to LDSA concentrations of the living room in cases I to IV. The living-room data are chosen because these have better continuity compared to the backpack data, including measurements in different rooms. As noted in Sect. 4.1, in cases II to IV, the LDSA concentration of the living room increases after the cooking event has ended. Additionally, especially in case IV, there is a strong variation of LDSA concentration after the peak value, suggesting that the aerosol is not well-mixed. These observations confirm that the fitting of the decay functions cannot always start immediately after the cooking event, as suggested in Sect. 3.2. To find suitable starting points for the fitting of the decay functions, the algorithm introduced in Sect. 3.2 was utilized. In each case, the relative deviation from the minimum NRMSE, which determines the length of the mixing phase, is presented in Fig. 3, which shows that the NRMSEs stabilize near the minimum at a certain case-dependent time. The lengths of the mixing phases determined by the algorithm ranged from 35 s in case I to 14 min and 58 s in case IV. The mixing phases are presented with grey highlighting in Fig. 4.
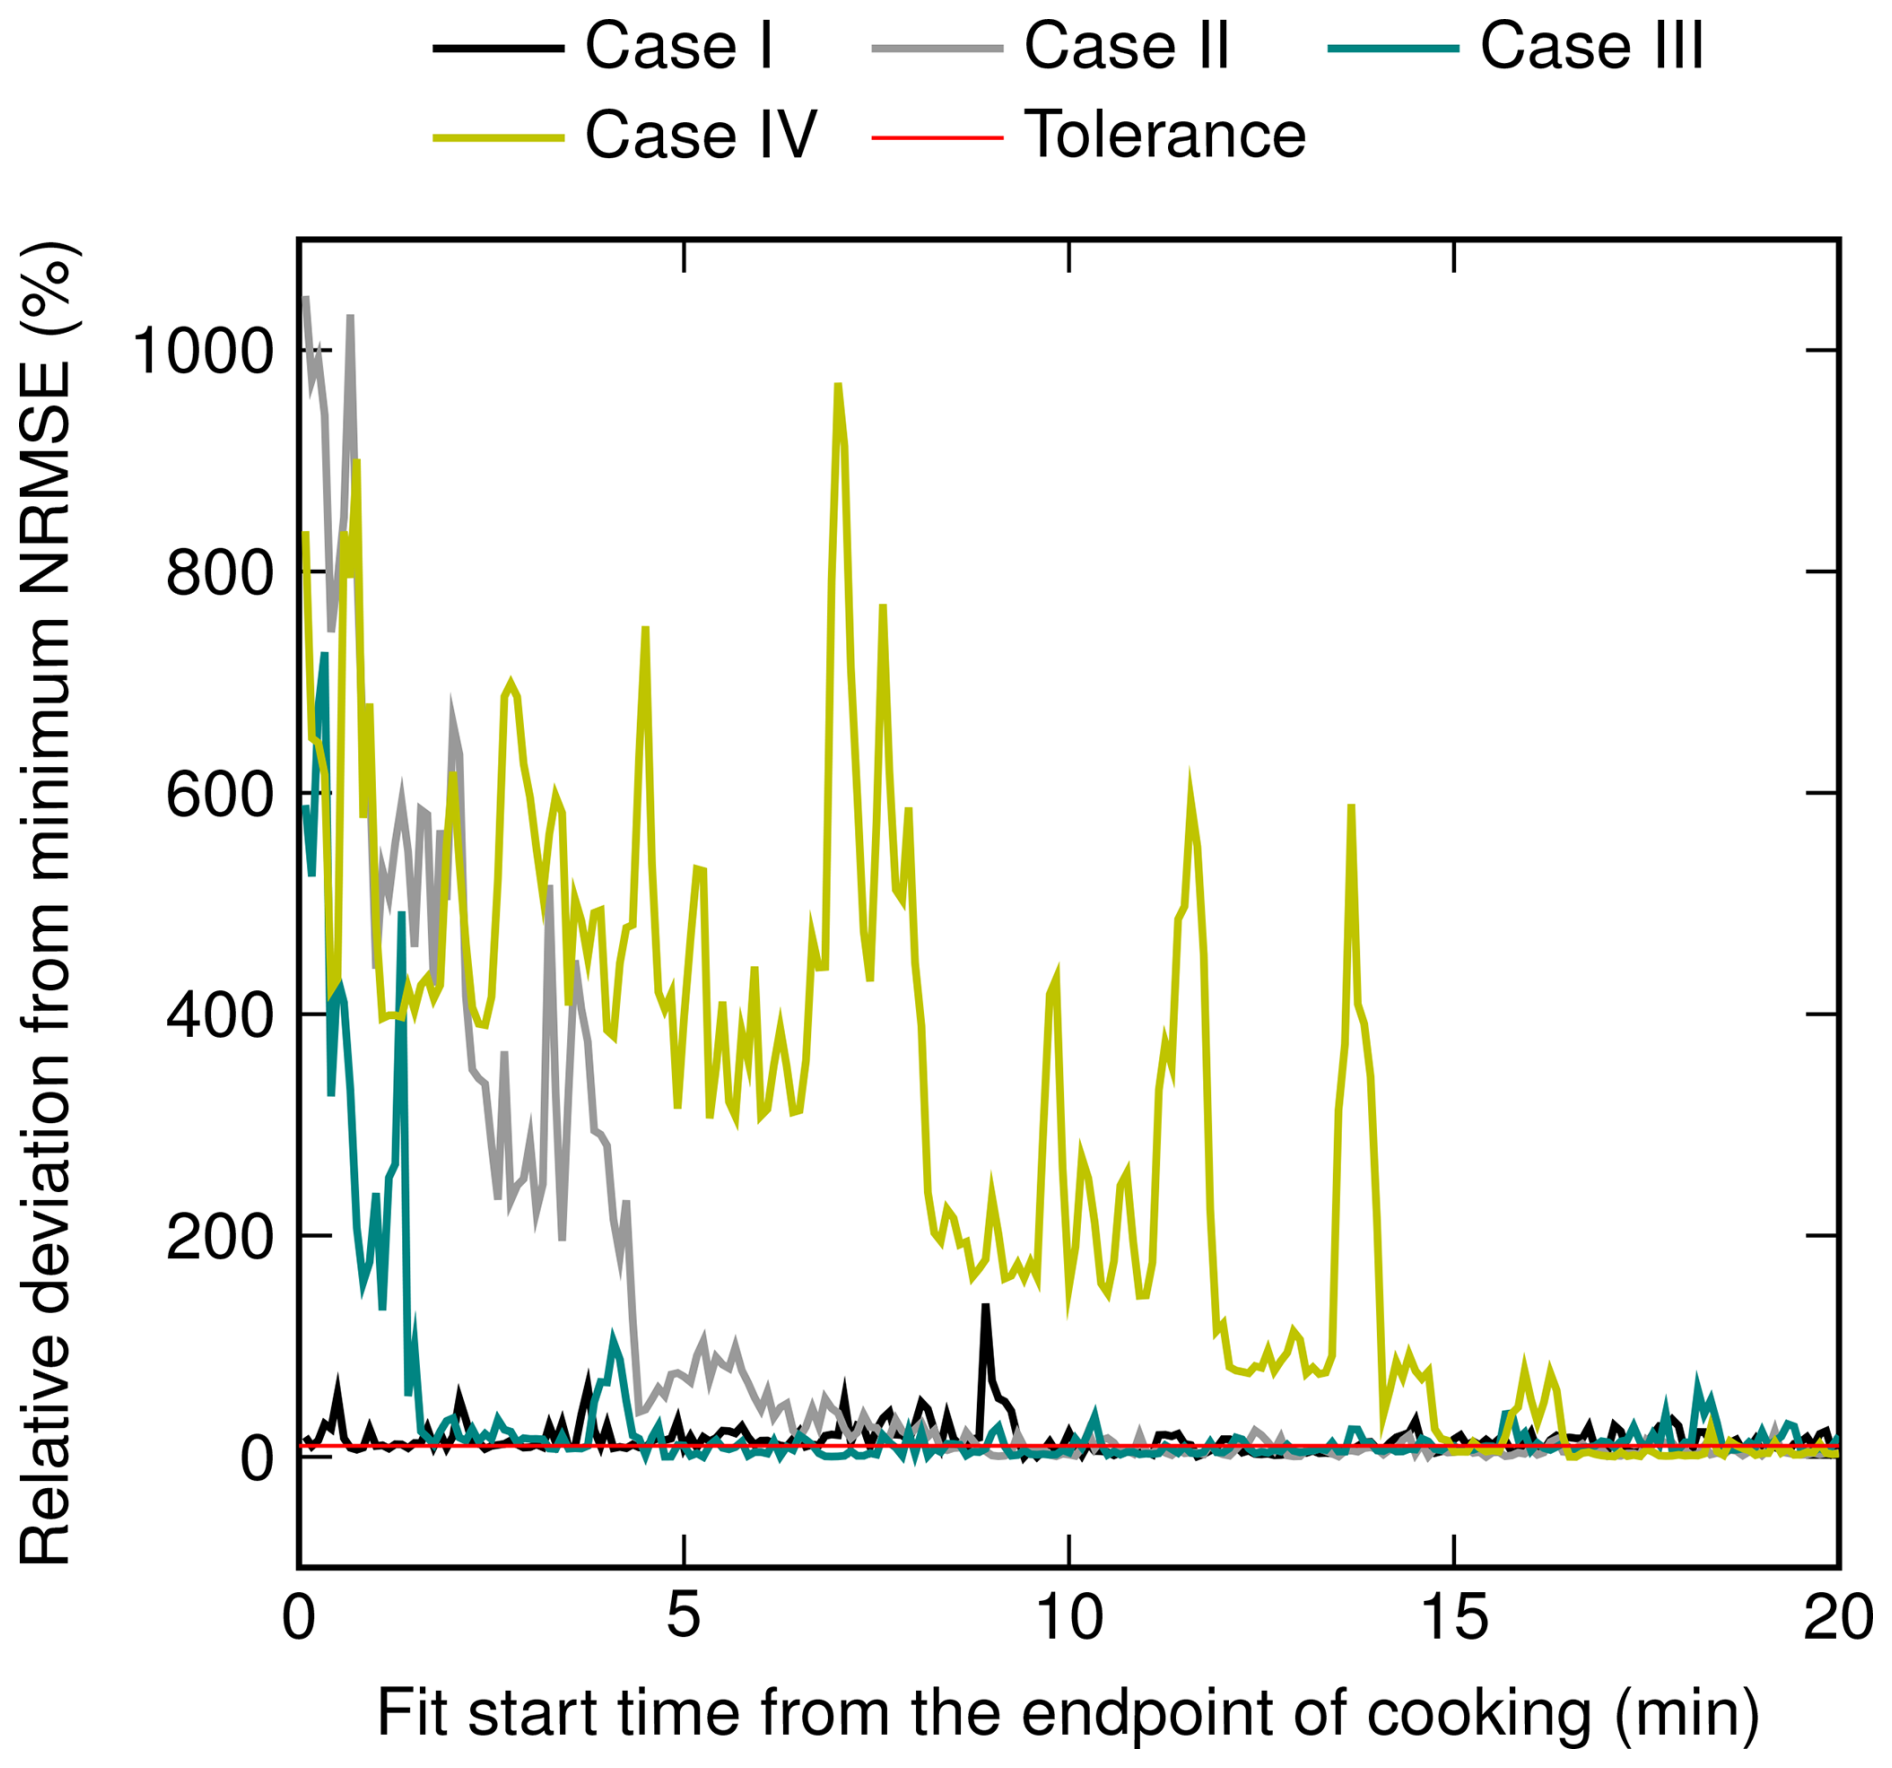
Figure 3The relative deviation of NRMSEs of the decay function, following Eq. (21), from the minimum NRMSE in cases I to IV. The first NRMSE of each case that equals or is below the tolerance of 10 % determines the end point of the mixing phase.
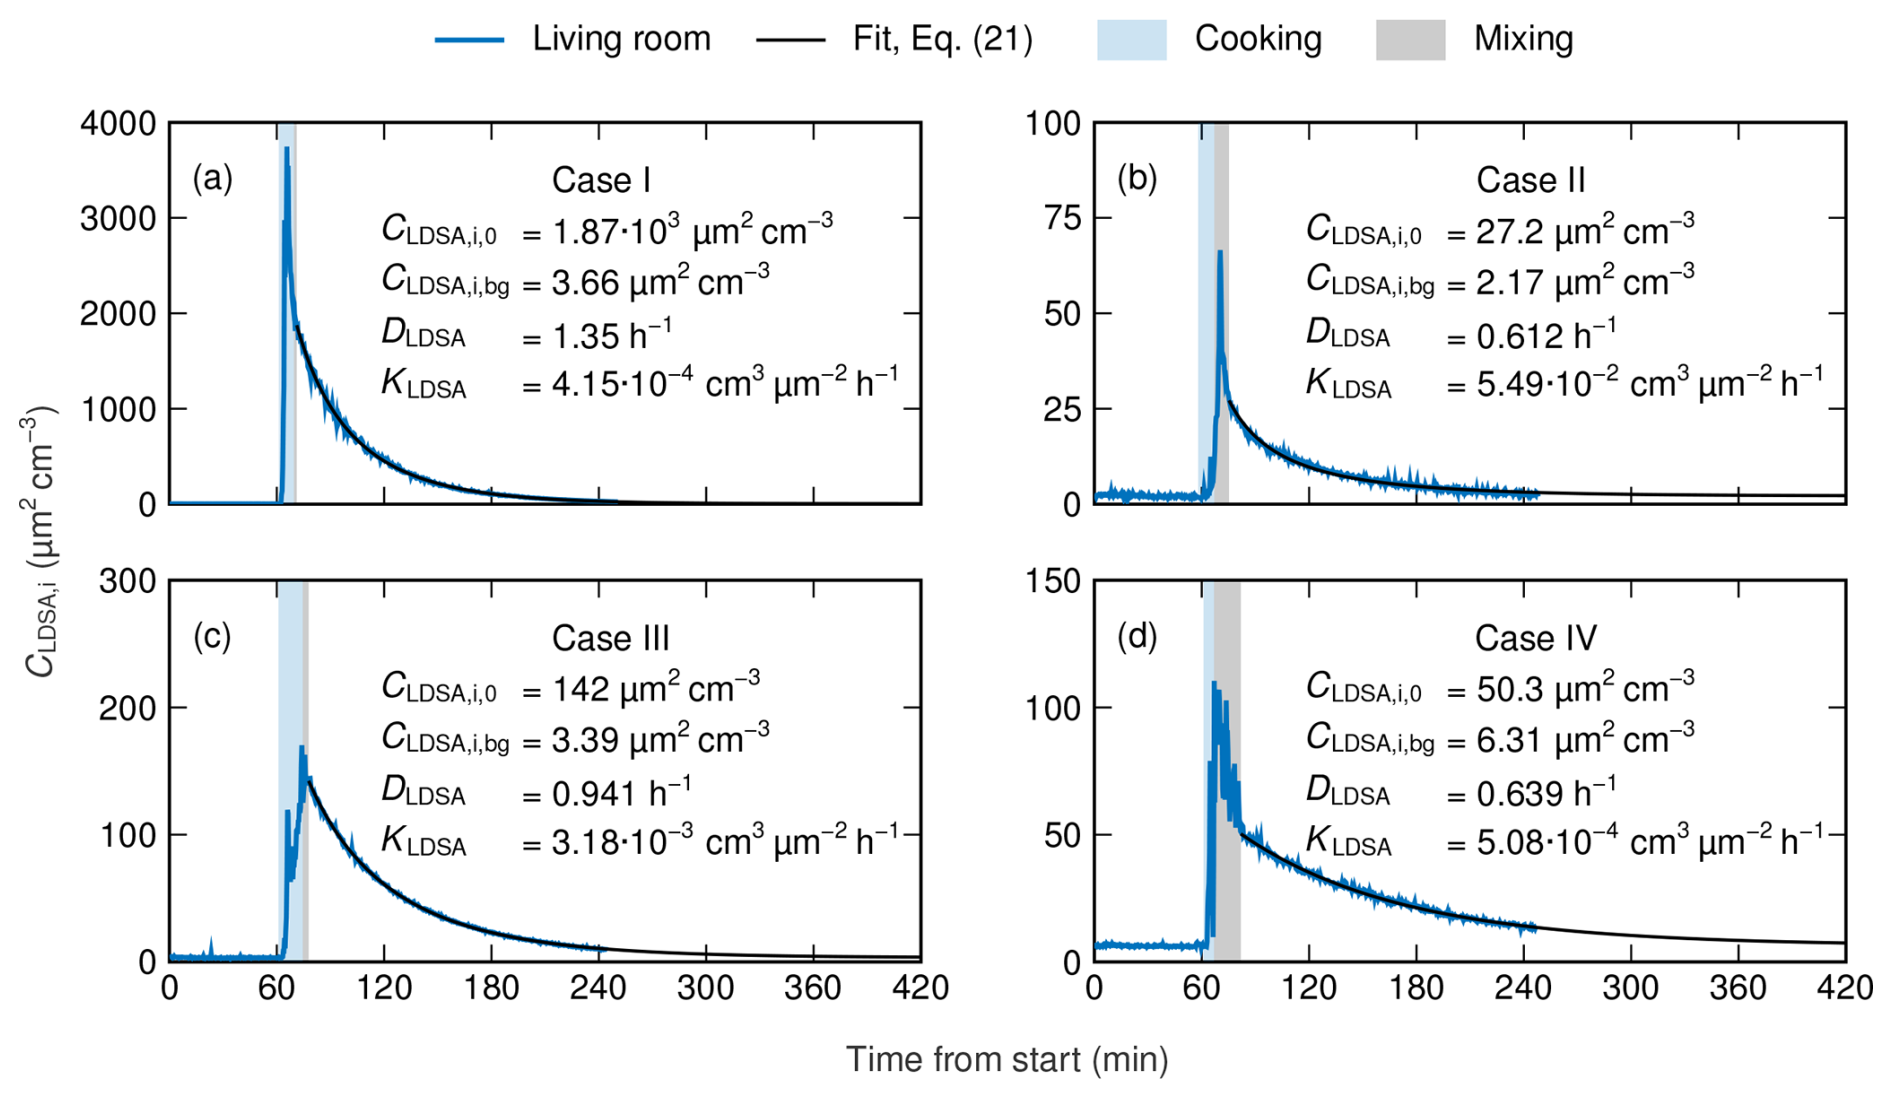
Figure 4The fits and the fitting parameters of the decay function considering coagulation and following Eq. (21) in cases I (a), II (b), III (c), and IV (d). Cooking events and mixing phases are highlighted.
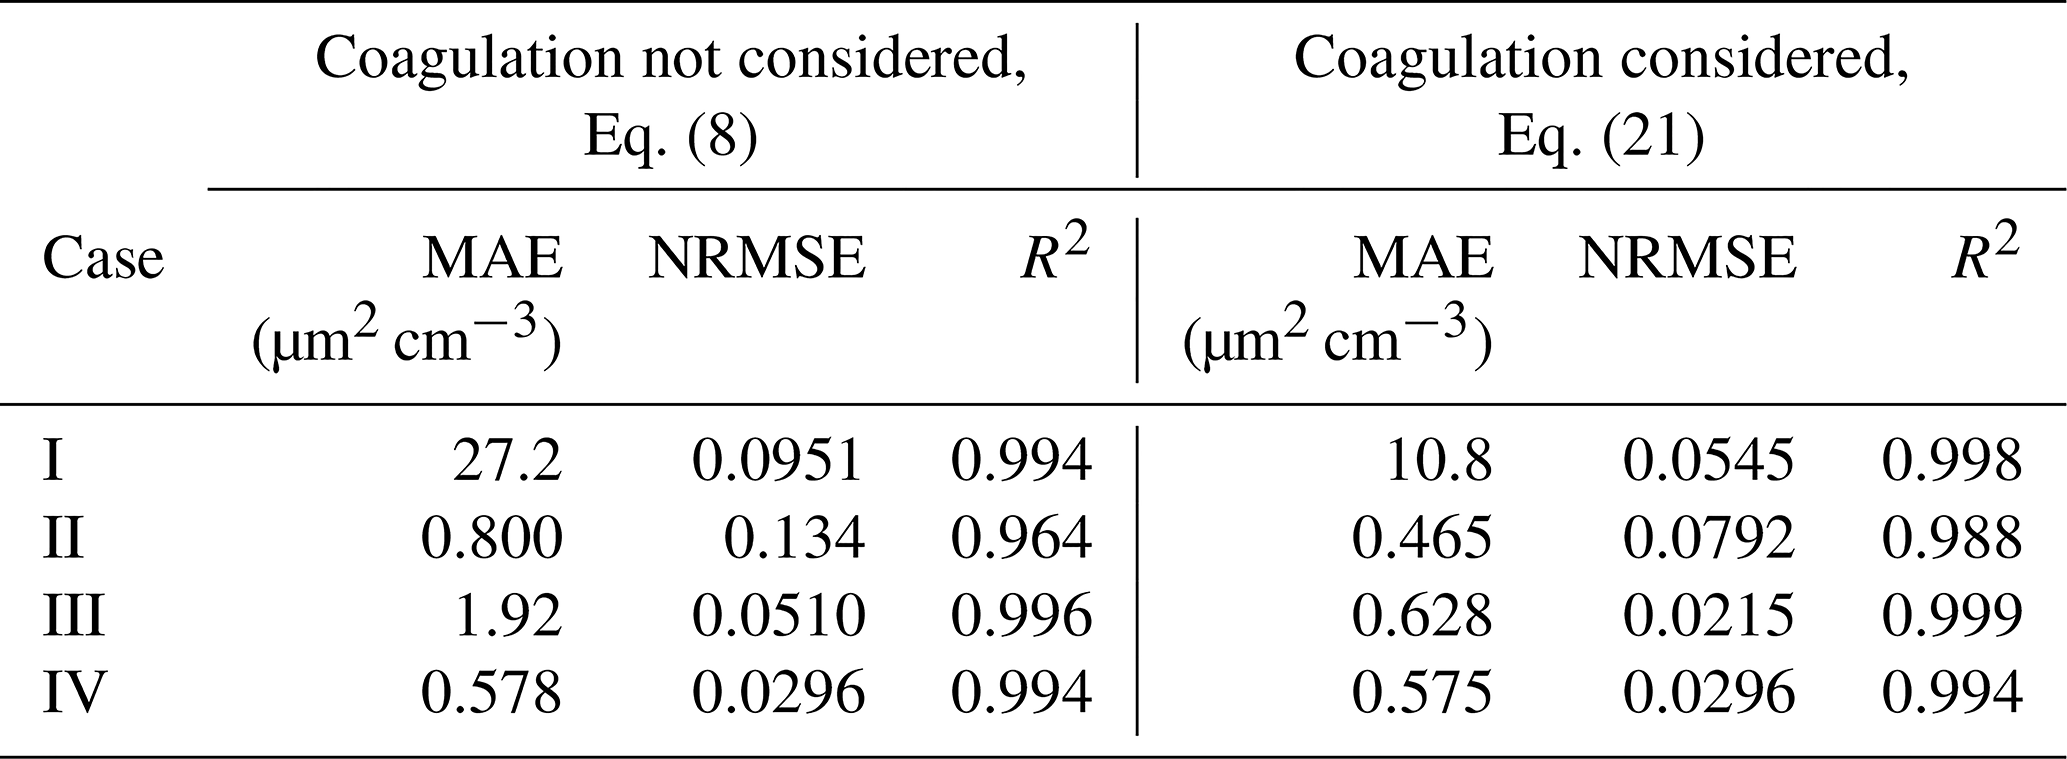
Table 3Mean absolute error (MAE), normalized root mean square error (NRMSE), and the coefficient of determination (R2) of the fits of the decay functions in cases I to IV. The decay function following Eq. (8) does not consider coagulation, whereas the function based on Eq. (21) includes coagulation.
After the determination of the mixing phase, the decay functions can be utilized using the data points of the decay phase following the mixing phase. Before fitting the functions, the background LDSA concentration and the initial LDSA concentration of the decay phase have to be determined. The background concentrations were computed as the mean concentration of the background measurement in each living room, whereas the initial concentrations were defined as the concentration of the first data point in each decay phase. Using these values, which are equal for both decay functions in each case, the decay functions following Eqs. (8) and (21) were fitted to the data of the decay phases. The fits of the decay function following Eq. (21) and, thus, considering coagulation are presented in Fig. 4 together with the initial concentrations; the background concentrations; and the fitting parameters DLDSA and KLDSA that stand for the dilution coefficient and the coagulation coefficient of LDSA concentration, respectively. The corresponding figure for the decay functions following Eq. (8) is presented in Fig. S5. In the fitting, the coefficients have to be assumed to be constant throughout the decay process, although, in reality, they would vary due to the slow increase in GMD over time. In addition, the fitting errors of both decay functions are given in Table 3.
Looking at Fig. 4 and Table 3, both decay functions are found to fit the measurement data with a high accuracy. In case I, the mean absolute errors (MAEs) of both fits are notably higher compared to in other cases, but the values of NRMSE and R2 indicate that the difference in magnitudes is explained by the overall higher level of concentration in case I. Thus, the applicability of the theoretically derived decay functions is confirmed in a real-world environment. However, the decay functions following Eq. (21), which consider coagulation in addition to ventilation and deposition, produce, systematically, an equal or lower fitting error compared to the fits based on Eq. (8), only considering ventilation and deposition. Moreover, the relative difference between the MAEs of the different decay functions is highest in cases I and III, with the highest initial concentrations. This observation is consistent with the fact that coagulation has a non-negligible role only in high number concentrations. According to the DiSCmini, in cases II and IV, the initial number concentrations of 1.04×10⁴ and 1.19×104 cm−3, respectively, are at the limit where coagulation starts to act as a notable aerosol process.
The values of the coagulation coefficient KLDSA, presented in Fig. 4, vary widely between cases. It has to be noted that, with the monodisperse approximation, the effect of coagulation on LDSA concentration depends more strongly, quadratically, on particle concentration ,as stated in Eq. (16). For instance, in case I, the effect of coagulation is approximately 40 times greater at the beginning of the decay phase compared to case II despite of the 2 orders of magnitude lower value of the coagulation coefficient. Using Eq. (17), the coagulation coefficients of this study can be compared to ones determined in relation to number concentration in earlier studies. For instance, the mean coagulation coefficient of h−1, determined by Zhao et al. (2021), corresponds to an LDSA coagulation coefficient of cm3 µ m−2 h−1, which is of the same order of magnitude as the coefficients of cases I and IV. Consequently, it remains unclear whether the fit function following Eq. (21) is able to determine the coagulation coefficient accurately, especially under low particle concentrations, in which the role of coagulation as an aerosol process is minor.
In contrast to the coagulation coefficients, the dilution coefficients are of the same order of magnitude in all cases. At the same time, even minor differences in dilution coefficients have a significant effect on the dilution rate, especially under lower concentrations. This is demonstrated by the fact that, in case IV, the LDSA concentration at 420 min as predicted by the fit of Eq. (21) is highest above the background concentration even though the initial concentration is relatively low. Although case II has the lowest dilution coefficient, the high coagulation coefficient and the initially low concentration result in faster decay near to the background level compared to case IV.
Overall, despite the differences in dilution and coagulation coefficients, the duration of the decay process is long in all cases, from I to IV, taking 231, 223, 182, and 283 min, respectively, for the concentration of the living room, predicted by the fit of Eq. (21), to decrease below the mean outdoor concentration of each case presented in Fig. 2. This observation already emphasizes the need for a decay function to assess the total exposure to cooking-generated particles instead of the exposure during the active cooking event only.
4.3 Outdoor air quality
The outdoor air quality data of Tampere were utilized in the dose calculation described in Sect. 3.3. The outdoor LDSA concentrations measured at the two measurement stations of Tampere, Epilä and Pirkankatu, are relatively low, with annual mean values of 8.4 and 9.2 µm2 cm−3, respectively. Globally, the outdoor LDSA concentrations of urban background and traffic environments are at the level of 30 µm2 cm−3 or higher, reaching up to over 300 µm2 cm−3 (Kuula et al., 2020; Salo et al., 2021; Lepistö et al., 2023). However, in Finland and Switzerland, urban background concentrations around 10 µm2 cm−3 have been reported in earlier studies (Kuula et al., 2020; Kuuluvainen et al., 2016; Fierz et al., 2011). The seasonal variation of the LDSA concentrations of both stations, illustrated in Fig. 5, is moderate as the median and the mean values of daily averages range from 5.0 to 11.5 µm2 cm−3.
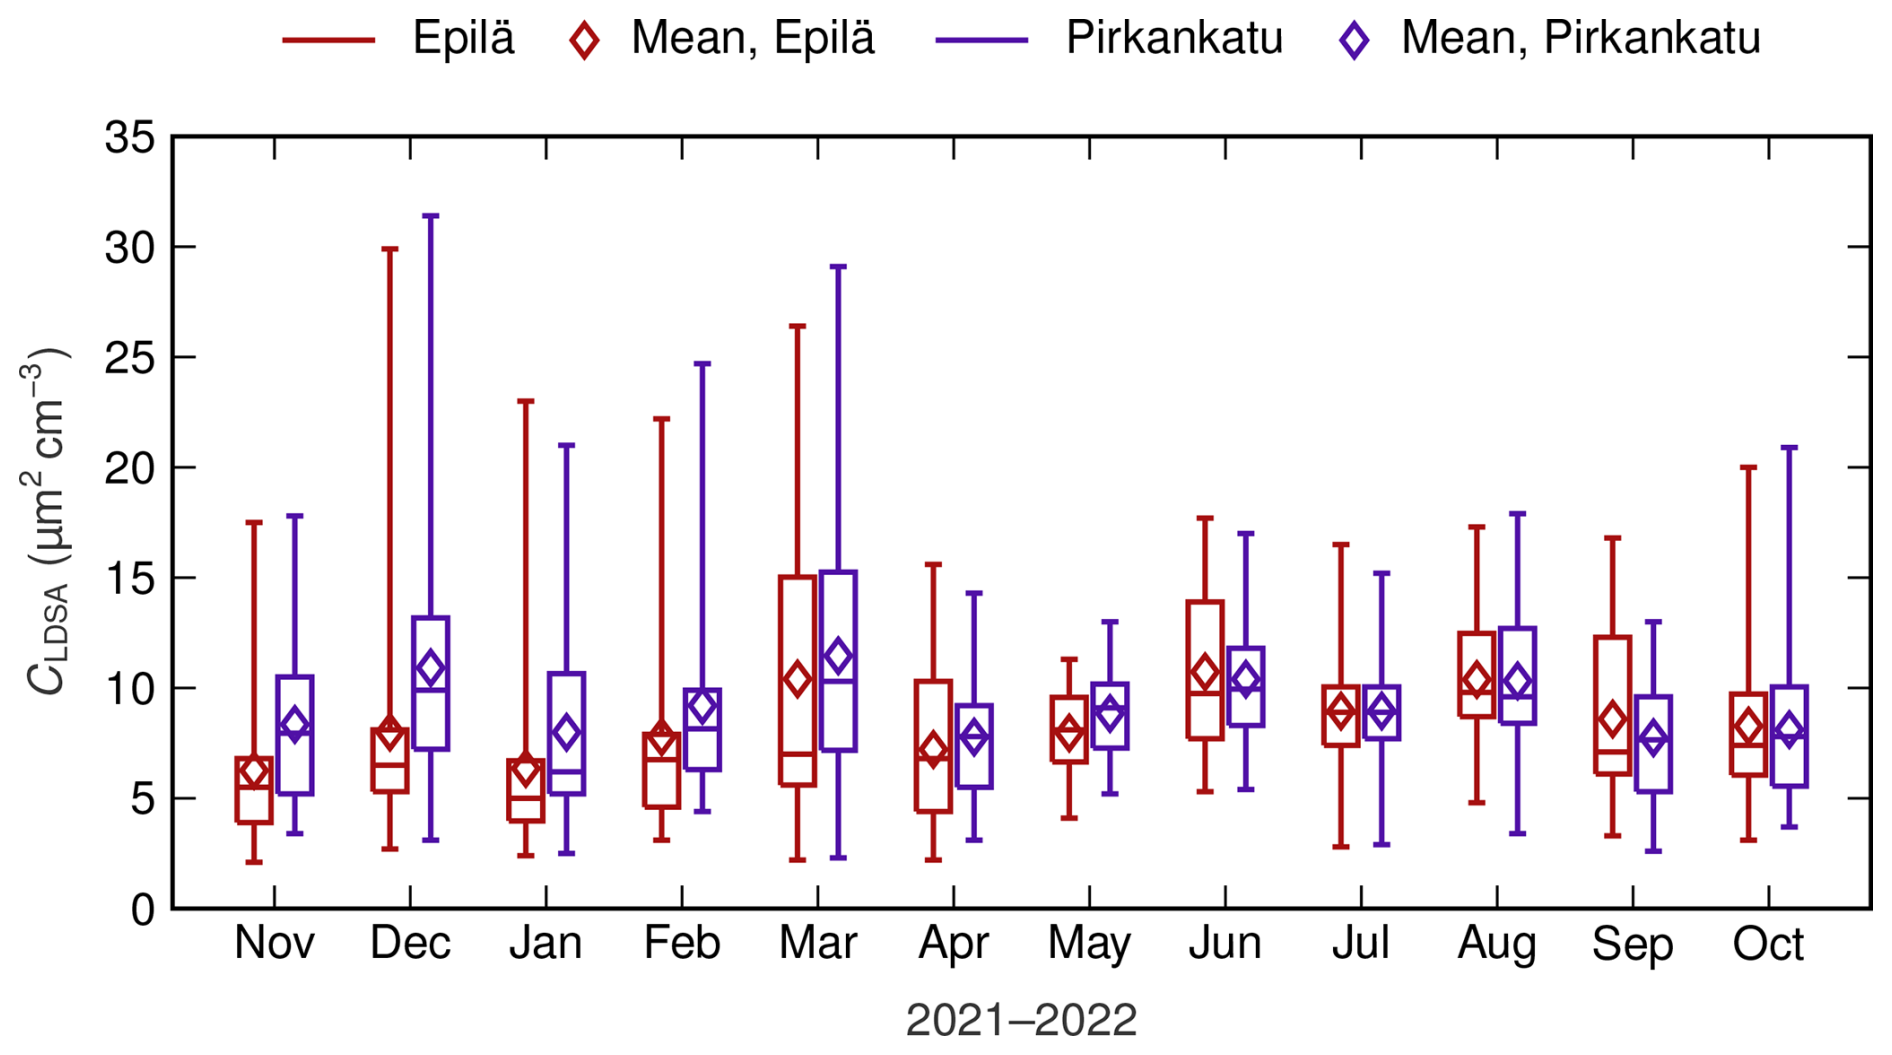
Figure 5The monthly variation of the daily averages of the LDSA concentration of two outdoor air quality measurement stations, Epilä and Pirkankatu, located in Tampere. The 25th and 75th percentiles, median values, mean values, and ranges of variation are presented as boxes, horizontal lines, diamonds, and whiskers, respectively.
The diurnal cycle of LDSA concentrations of both measurement stations shows similarity compared to earlier studies (Hama et al., 2017; Kuula et al., 2020). During weekdays, the daily time series is bi-modal, having the first peak in the morning and the second peak in the afternoon, whereas, during weekends, only the afternoon peak is observed. In both studies, these peaks have been connected to the intensity of traffic. Consequently, it is unsurprising that LDSA concentrations are lower during the nighttime, with a mean of 7.3 µm2 cm−3, while the mean daytime concentration was 9.5 µm2 cm−3. In this study, the daytime was defined as a time period between 07:00 and 23:00 LT (local time, UTC+3 between the last Sunday of March and the last Sunday of October, otherwise UTC+2), and the mean values of day and night are calculated using a year's worth of data from both measurement stations. During the daytime, the seasonal variation of the diurnal cycle is minor, but, at night, LDSA concentration decreases significantly during winter, whereas, in summer, the concentration remains close to the daytime levels. The above-described mean daytime and nighttime LDSA concentrations of Tampere were utilized in the dose calculation.
4.4 Dose assessment
The daily LDSA dose received by the population of the region of Tampere was assessed by combining the results of cooking measurements, the fits of the decay functions, and the observations of outdoor air quality according to the description in Sect. 3.3. As a result, the assessment provides knowledge of the role that cooking and, especially, the decay phase of the cooking-generated particles play in the daily particle dose. In earlier LDSA studies, only the exposure during cooking or eating is considered to be cooking-related exposure (Buonanno et al., 2011; Pacitto et al., 2018; Scungio et al., 2020; Pacitto et al., 2021), although the decay phase of cooking-generated particles may last from an hour to several hours, as demonstrated in this study and previous research (Hussein et al., 2006; Wan et al., 2011; Zhao et al., 2021).
The results of the dose assessment are presented in Fig. 6 for both decay functions. Using the decay function following Eq. (8), the total daily doses are 1389, 104.5, 215.3, and 162.5 mm2 in cases I to IV, respectively. However, in all cases, the utilization of the decay function following Eq. (21) gives slightly higher doses, with corresponding values of 1422, 105.9, 218.7, and 162.8 mm2, respectively. Apart from case IV, the fits of Eq. (8) are observed to give values lower than the measured ones at the end of the measurements, whereas the values of the fits of Eq. (21) are in better agreement with the measurements. This observation explains the differences between the decay functions in both the daily doses of Fig. 6 and the fitting errors of Table 3. Together with the fitting errors, this indicates that the decay function taking coagulation into account is likely to give a better estimate of the actual dose of cooking-generated particles. It has to be noted that the relative differences in the doses are minor, which also makes the simpler decay function applicable for assessing the total dose of a cooking event.
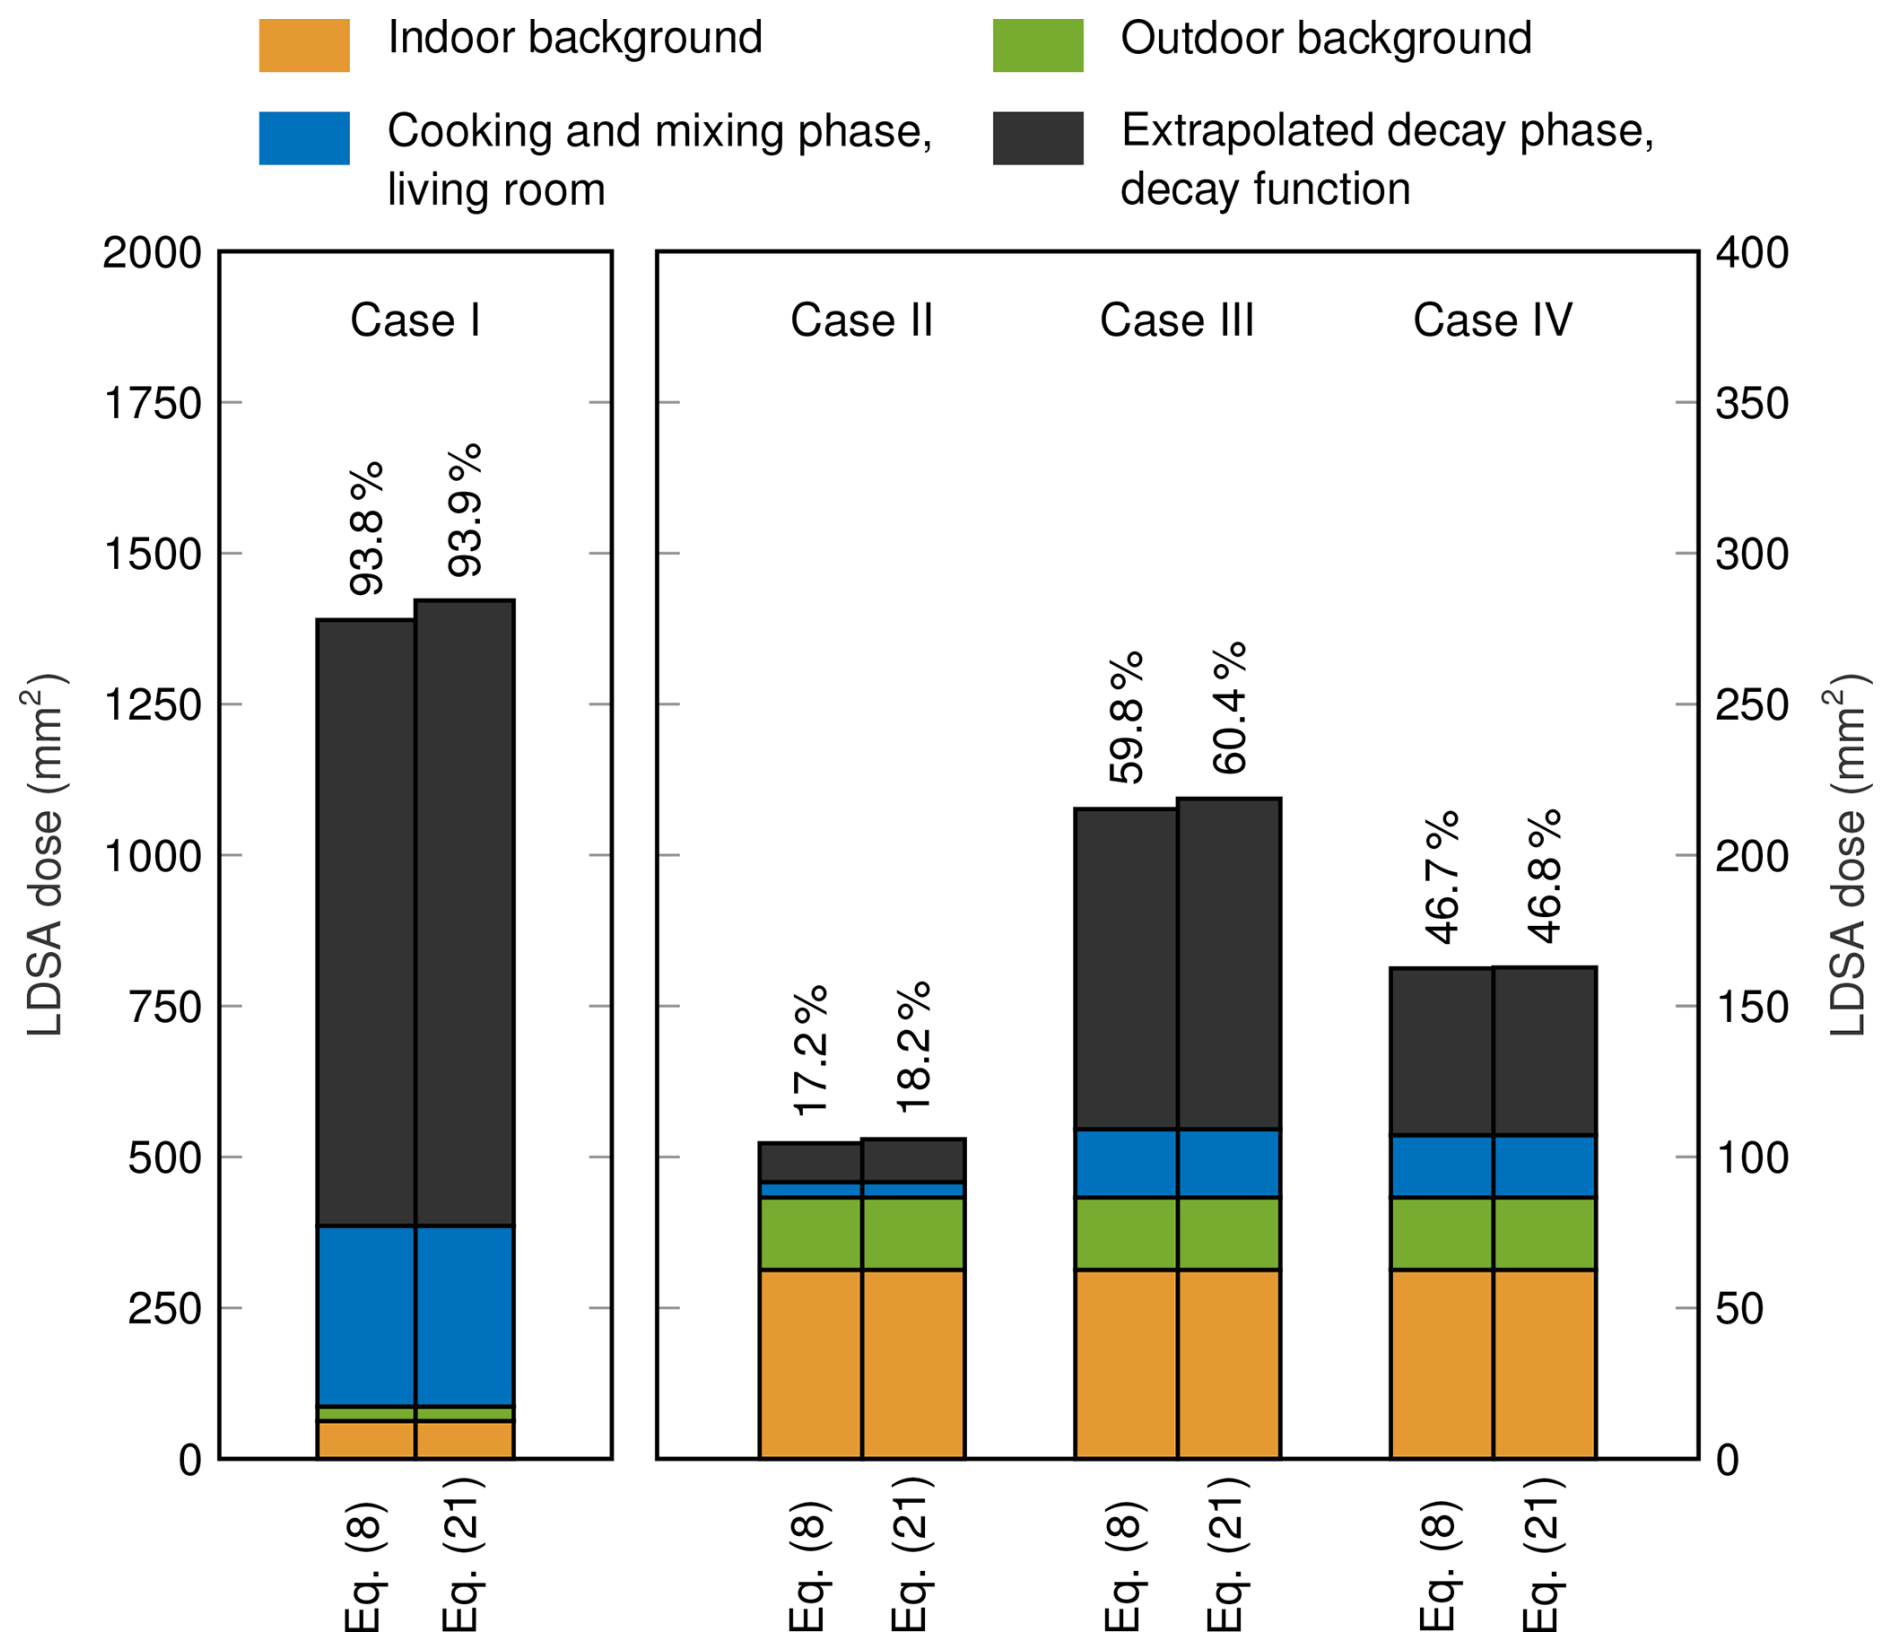
Figure 6Daily LDSA doses in cases I to IV, consisting of indoor background, outdoor background, cooking and mixing phase in the living room, and extrapolated decay phase separately, with decay functions following Eqs. (8) and (21). The fraction of cooking-related dose, including cooking, mixing, and extrapolated decay phase, is presented numerically. Note that case I has a separate y axis due to higher values.
Compared to previous studies with a higher number of measurement cases (Pacitto et al., 2018; Scungio et al., 2020; Pacitto et al., 2021), the daily doses in cases II to IV are closest to ones measured in Lund, Sweden, where the daily doses for female and male were, on average, 102 and 93 mm2, respectively. Despite differing substantially from other daily doses of this study, the daily dose of case I has similarity compared to doses determined in Guilford, United Kingdom, and Cairo, Egypt. In Guilford, the daily doses of female and male are 1408 and 1188 mm2, respectively, and in Cairo, the corresponding doses are 1306 and 1309 mm2, respectively. It has to be noted that, in those studies, unlike in this study, the particle surface area deposited at the tracheobronchial region of the lungs is also included in LDSA, leading to 15 % to 20 % higher values of LDSA (Pacitto et al., 2018).
With both decay functions, the cooking-related particle dose fraction, presented in Fig. 6, varies greatly between cases. In this study, the cooking-related particle dose considers cooking and mixing phase together with extrapolated decay phase. The highest cooking-related fraction of 93.9 % is observed in case I using the decay function following Eq. (21), while the lowest fraction of 17.2 % is determined in case II using the decay function based on Eq. (8). This variation, observed with identical ingredients, indicates that the ventilation and the style of cooking may have a significant impact on the total dose of the cooking event. Overall, the exposure assessment shows that, in the region of Tampere, a notable fraction of the daily dose relates to cooking, which even has a dominant role in two of the four cases. In all cases, most of the dose is received in the decay phase and not during the actual cooking event. The fraction of the extrapolated decay-phase dose from the total cooking dose varies from 66.5 % to 80.3 % using the decay function that follows Eq. (8) and from 72.9 % to 82.9 % using the decay function following Eq. (21). Consequently, it is clear that considering only the active cooking event is not enough to determine the total particle dose of cooking.
Because of this, the role of cooking might have been underestimated in earlier studies even though it has been recognized as a major source of particle exposure (Pacitto et al., 2018; Scungio et al., 2020; Pacitto et al., 2021). Pacitto et al. (2021) reported that, in developed countries, the average contribution of cooking and eating actions varies between 14 % (for males in Barcelona, Spain) and 59 % (for females in Cassino, Italy). However, the dose fraction is highly dependent on the dose received from other sources such as traffic and outdoor air. For instance, the average daily dose from cooking and eating for females in Cassino was assessed to be 779 mm2 (Pacitto et al., 2018, 2021), while, in case III, similar dose fractions are achieved, with cooking-related doses of approximately 130 mm2. Apart from case I, the LDSA doses related to cooking show similarity to cooking and eating doses measured in Barcelona, ranging from 61 to 178 mm2, and in Lund, ranging from 30 to 67 mm2 (Pacitto et al., 2018). However, it is challenging to assess which fraction of the dose received during the decay phase of cooking-generated particles is taken into account during eating periods. Consequently, the consideration of the whole decay phase might further increase the already significant role of cooking-related particles in the total daily dose.
In this study, two decay functions describing indoor LDSA concentration were first derived and then tested using measurement data of four cooking experiments including the decay phase of the cooking emission. Both functions were confirmed to fit the measured data with a high accuracy, but using the decay function that considers coagulation, in addition to ventilation and deposition, the fitting errors were systematically lower. The difference in the errors was emphasized in the cases of high concentration.
Together with air quality data of Tampere, the fits of the decay functions were applied to assess the role of cooking in the daily LDSA dose. The fraction of cooking-related LDSA dose varied from 17.2 % to 93.9 %, highlighting both the significance of the cooking dose to total particle dose and the great influence that cooking style and ventilation may have on the received dose. However, the primary finding was that, using the simpler decay function and using the decay function considering coagulation, from 66.5 % to 80.3 % and from 72.9 % to 82.9 % of the cooking-related dose, respectively, was received at the decay phase following the active cooking event and the mixing phase. Consequently, it is crucial to consider the particles of the decay phase to be cooking-related emissions when assessing the role of cooking in the daily particle exposure.
Using the decay functions of this study, the measurement data of a low time resolution or a short time period can also be interpolated or extrapolated, providing a useful tool for assessing the exposure at the decay phase. The decay functions could also be utilized to describe the decay processes of other indoor particle sources, noting that, in the more complex decay function, the consideration of coagulation includes the assumption that the size distribution is dominated by particles with diameters in the range of 30 to 300 nm. Consequently, as most of the indoor sources produce particles within that size range, the decay functions can be applied to distinguish the emissions of successive indoor emission events from each other. Furthermore, the factors affecting the decay process of indoor emissions, such as ventilation systems and the usage of range hoods, can be examined in more detail using the decay functions. To achieve these potential improvements in knowledge, more extensive studies of indoor LDSA concentrations including the decay phase of indoor particle emissions are required.
Data are available from Zenodo at https://doi.org/10.5281/zenodo.15471503 (Vesisenaho et al., 2025).
The supplement related to this article is available online at https://doi.org/10.5194/ar-3-461-2025-supplement.
KV: conceptualization, investigation, data curation, methodology, formal analysis, software, visualization, writing (original draft preparation, review and editing). HK and PK: conceptualization, investigation, supervision, writing (review and editing). UVM: conceptualization, investigation, data curation, writing (review and editing). MO: conceptualization, investigation, writing (review and editing).
The contact author has declared that none of the authors has any competing interests.
Publisher's note: Copernicus Publications remains neutral with regard to jurisdictional claims made in the text, published maps, institutional affiliations, or any other geographical representation in this paper. While Copernicus Publications makes every effort to include appropriate place names, the final responsibility lies with the authors. Views expressed in the text are those of the authors and do not necessarily reflect the views of the publisher.
The authors would like to thank the City of Tampere's Environmental Protection Unit for measuring LDSA concentrations as a part of Tampere's urban air quality monitoring. In addition, the authors would like to thank Pegasor Ltd for maintaining the AQ Urban sensors annually.
This paper was edited by Shahzad Gani and reviewed by Betty Molinier and one anonymous referee.
Abdullahi, K. L., Delgado-Saborit, J. M., and Harrison, R. M.: Emissions and indoor concentrations of particulate matter and its specific chemical components from cooking: A review, Atmospheric Environment, 71, 260–294, https://doi.org/10.1016/j.atmosenv.2013.01.061, 2013. a, b
Ahmed, T., Kumar, P., and Mottet, L.: Natural ventilation in warm climates: The challenges of thermal comfort, heatwave resilience and indoor air quality, Renewable and Sustainable Energy Reviews, 138, 110669, https://doi.org/10.1016/j.rser.2020.110669, 2021. a
Bhangar, S., Mullen, N., Hering, S., Kreisberg, N., and Nazaroff, W. W.: Ultrafine particle concentrations and exposures in seven residences in northern California, Indoor Air, 21, 132–144, https://doi.org/10.1111/j.1600-0668.2010.00689.x, 2011. a
Buonanno, G., Morawska, L., and Stabile, L.: Particle emission factors during cooking activities, Atmospheric Environment, 43, 3235–3242, https://doi.org/10.1016/j.atmosenv.2009.03.044, 2009. a, b, c, d
Buonanno, G., Giovinco, G., Morawska, L., and Stabile, L.: Tracheobronchial and alveolar dose of submicrometer particles for different population age groups in Italy, Atmospheric Environment, 45, 6216–6224, https://doi.org/10.1016/j.atmosenv.2011.07.066, 2011. a
Burnett, R., Chen, H., Szyszkowicz, M., Fann, N., Hubbell, B., Pope Iii, C. A., Apte, J. S., Brauer, M., Cohen, A., Weichenthal, S., Coggins, J., Di, Q., Brunekreef, B., Frostad, J., Lim, S. S., Kan, H., Walker, K. D., Thurston, G. D., Hayes, R. B., Lim, C. C., Turner, M. C., Jerrett, M., Krewski, D., Gapstur, S. M., Diver, W. R., Ostro, B., Goldberg, D., Crouse, D. L., Martin, R. V., Peters, P., Pinault, L., Tjepkema, M., Van Donkelaar, A., Villeneuve, P. J., Miller, A. B., Yin, P., Zhou, M., Wang, L., Janssen, N. A., Marra, M., Atkinson, R. W., Tsang, H., Thach, T. Q., Cannon, J. B., Allen, R. T., Hart, J. E., Laden, F., Cesaroni, G., Forastiere, F., Weinmayr, G., Jaensch, A., Nagel, G., Concin, H., and Spadaro, J. V.: Global estimates of mortality associated with longterm exposure to outdoor fine particulate matter, Proceedings of the National Academy of Sciences of the United States of America, 115, 9592–9597, https://doi.org/10.1073/pnas.1803222115, 2018. a
Chen, J. and Hoek, G.: Long-term exposure to PM and all-cause and cause-specific mortality: A systematic review and meta-analysis, Environment International, 143, https://doi.org/10.1016/j.envint.2020.105974, 2020. a
Cohen, A., Brauer, M., Burnett, R., Anderson, H. R., Frostad, J., Estep, K., Balakrishnan, K., Brunekreef, B., Dandona, L., Dandona, R., Feigin, V., Freedman, G., Hubbell, B., Jobling, A., Kan, H., Knibbs, L., Liu, Y., Martin, R., Morawska, L., Pope, C. A., Shin, H., Straif, K., Shaddick, G., Thomas, M., van Dingenen, R., van Donkelaar, A., Vos, T., Murray, C. J. L., and Forouzanfar, M. H.: Estimates and 25-year trends of the global burden of disease attributable to ambient air pollution: an analysis of data from the Global Burden of Diseases Study 2015, The Lancet, 389, 1907–1918, https://doi.org/10.1016/S0140-6736(17)30505-6, 2017. a
Crump, J. G., Flagan, R. C., and Seinfeld, J. H.: Particle wall loss rates in vessels, Aerosol Science and Technology, 2, 303–309, https://doi.org/10.1080/02786828308958636, 1982. a
Dimitroulopoulou, C.: Ventilation in European dwellings: A review, Building and Environment, 47, 109–125, https://doi.org/10.1016/j.buildenv.2011.07.016, 2012. a
Donaldson, K., Brown, D., Clouter, A., Duffin, R., MacNee, W., Renwick, L., Tran, L., and Stone, V.: The pulmonary toxicology of ultrafine particles, Journal of Aerosol Medicine: Deposition, Clearance, and Effects in the Lung, 15, 213–220, https://doi.org/10.1089/089426802320282338, 2002. a
EPA: Metabolically derived human ventilation rates: a revised approach based upon oxygen consumption rates, Tech. Rep. EPA/600/R-06/129F, U.S. Environmental Protection Agency, National Center for Environmental Assessment, EPA/600/R-06/129F, 2009. a, b
EPA: Exposure Factors Handbook 2011 Edition (Final Report), U.S. Environmental Protection Agency, EPA/600/R-09/052F, 2011. a
EPA: National Ambient Air Quality Standards for Particulate Matter, Federal Register, 78, https://www.govinfo.gov/content/pkg/FR-2013-01-15/pdf/2012-30946.pdf (last access: 13 June 2024), 2013. a
EU: Directive 2008/50/EC of the European Parliament and of the Council of 21 May 2008 on ambient air quality and cleaner air for Europe, Official Journal of the European Union, http://data.europa.eu/eli/dir/2008/50/oj (last access: 13 June 2024), 2008. a
Eurostat: Population on 1 January by age groups and sex – cities and greater cities, Eurostat [data set], https://doi.org/10.2908/URB_CPOP1, 2024. a
Fierz, M., Houle, C., Steigmeier, P., and Burtscher, H.: Design, calibration, and field performance of a miniature diffusion size classifier, Aerosol Science and Technology, 45, 1–10, https://doi.org/10.1080/02786826.2010.516283, 2011. a, b, c, d
Fierz, M., Meier, D., Steigmeier, P., and Burtscher, H.: Aerosol measurement by induced currents, Aerosol Science and Technology, 48, 350–357, https://doi.org/10.1080/02786826.2013.875981, 2014. a, b
Geiss, O., Bianchi, I., and Barrero-Moreno, J.: Lung-deposited surface area concentration measurements in selected occupational and non-occupational environments, Journal of Aerosol Science, 96, 24–37, https://doi.org/10.1016/j.jaerosci.2016.02.007, 2016. a
Hama, S. M., Ma, N., Cordell, R. L., Kos, G. P., Wiedensohler, A., and Monks, P. S.: Lung deposited surface area in Leicester urban background site/UK: Sources and contribution of new particle formation, Atmospheric Environment, 151, 94–107, https://doi.org/10.1016/j.atmosenv.2016.12.002, 2017. a
Hänninen, O. O., Palonen, J., Tuomisto, J. T., Yli-Tuomi, T., Seppänen, O., and Jantunen, M. J.: Reduction potential of urban PM2.5 mortality risk using modern ventilation systems in buildings, Indoor Air, 15, 246–256, https://doi.org/10.1111/j.1600-0668.2005.00365.x, 2005. a
Hussein, T., Glytsos, T., Ondráček, J., Dohányosová, P., Ždímal, V., Hämeri, K., Lazaridis, M., Smolík, J., and Kulmala, M.: Particle size characterization and emission rates during indoor activities in a house, Atmospheric Environment, 40, 4285–4307, https://doi.org/10.1016/j.atmosenv.2006.03.053, 2006. a, b, c, d, e
Hussein, T., Hruška, A., Dohányosová, P., Džumbová, L., Hemerka, J., Kulmala, M., and Smolík, J.: Deposition rates on smooth surfaces and coagulation of aerosol particles inside a test chamber, Atmospheric Environment, 43, 905–914, https://doi.org/10.1016/j.atmosenv.2008.10.059, 2009. a
Hussein, T., Paasonen, P., and Kulmala, M.: Activity pattern of a selected group of school occupants and their family members in Helsinki – Finland, Science of the Total Environment, 425, 289–292, https://doi.org/10.1016/j.scitotenv.2012.03.002, 2012. a, b
ICRP: Human respiratory tract model for radiological protection. A report of a Task Group of the International Commission on Radiological Protection, Annals of the ICRP, 24, 1–482, ISSN 0146-6453, 1994. a
Isaxon, C., Gudmundsson, A., Nordin, E., Lönnblad, L., Dahl, A., Wieslander, G., Bohgard, M., and Wierzbicka, A.: Contribution of indoor-generated particles to residential exposure, Atmospheric Environment, 106, 458–466, https://doi.org/10.1016/j.atmosenv.2014.07.053, 2015. a, b, c
Kang, K., Kim, H., Kim, D. D., Lee, Y. G., and Kim, T.: Characteristics of cooking-generated PM10 and PM2.5 in residential buildings with different cooking and ventilation types, Science of the Total Environment, 668, 56–66, https://doi.org/10.1016/j.scitotenv.2019.02.316, 2019. a, b, c
Kanninen, K., Lampinen, R., Rantanen, L., Odendaal, L., Jalava, P., Chew, S., and White, A.: Olfactory cell cultures to investigate health effects of air pollution exposure: Implications for neurodegeneration, Neurochemistry International, 136, 104729, https://doi.org/10.1016/j.neuint.2020.104729, 2020. a
Kim, H., Kang, K., and Kim, T.: Measurement of particulate matter (PM2.5) and health risk assessment of cooking-generated particles in the kitchen and living rooms of apartment houses, Sustainability, 10, https://doi.org/10.3390/su10030843, 2018. a, b
Kim, K.-H., Kabir, E., and Kabir, S.: A review on the human health impact of airborne particulate matter, Environment International, 74, 136–143, https://doi.org/10.1016/j.envint.2014.10.005, 2015. a
Kuula, J., Kuuluvainen, H., Rönkkö, T., Niemi, J. V., Saukko, E., Portin, H., Aurela, M., Saarikoski, S., Rostedt, A., Hillamo, R., and Timonen, H.: Applicability of optical and diffusion charging-based particulate matter sensors to urban air quality measurements, Aerosol and Air Quality Research, 19, 1024–1039, https://doi.org/10.4209/aaqr.2018.04.0143, 2019. a, b
Kuula, J., Kuuluvainen, H., Niemi, J. V., Saukko, E., Portin, H., Kousa, A., Aurela, M., Rönkkö, T., and Timonen, H.: Long-term sensor measurements of lung deposited surface area of particulate matter emitted from local vehicular and residential wood combustion sources, Aerosol Science and Technology, 54, 190–202, https://doi.org/10.1080/02786826.2019.1668909, 2020. a, b, c
Kuuluvainen, H., Rönkkö, T., Järvinen, A., Saari, S., Karjalainen, P., Lähde, T., Pirjola, L., Niemi, J. V., Hillamo, R., and Keskinen, J.: Lung deposited surface area size distributions of particulate matter in different urban areas, Atmospheric Environment, 136, 105–113, https://doi.org/10.1016/j.atmosenv.2016.04.019, 2016. a
Lai, A.: Particle deposition indoors: A review, Indoor Air, 12, 211–214, https://doi.org/10.1046/j.0905-6947.2002.1r159a.x, 2002. a, b
Lepistö, T., Lintusaari, H., Oudin, A., Barreira, L. M. F., Niemi, J. V., Karjalainen, P., Salo, L., Silvonen, V., Markkula, L., Hoivala, J., Marjanen, P., Martikainen, S., Aurela, M., Reyes, F. R., Oyola, P., Kuuluvainen, H., Manninen, H. E., Schins, R. P. F., Vojtisek-Lom, M., Ondracek, J., Topinka, J., Timonen, H., Jalava, P., Saarikoski, S., and Rönkkö, T.: Particle lung deposited surface area (LDSAal) size distributions in different urban environments and geographical regions: Towards understanding of the PM2.5 dose–response, Environment International, 180, https://doi.org/10.1016/j.envint.2023.108224, 2023. a, b, c
Li, X., Jin, L., and Kan, H.: Air pollution: a global problem needs local fixes, Nature, 570, 437–439, https://doi.org/10.1038/d41586-019-01960-7, 2019. a
Liu, Q., Xu, C., Ji, G., Liu, H., Shao, W., Zhang, C., Gu, A., and Zhao, P.: Effect of exposure to ambient PM2.5 pollution on the risk of respiratory tract diseases: A meta-analysis of cohort studies, Journal of Biomedical Research, 31, 130–142, https://doi.org/10.7555/JBR.31.20160071, 2017. a
Monteiller, C., Tran, L., MacNee, W., Faux, S., Jones, A., Miller, B., and Donaldson, K.: The pro-inflammatory effects of low-toxicity low-solubility particles, nanoparticles and fine particles, on epithelial cells in vitro: The role of surface area, Occupational and Environmental Medicine, 64, 609–615, https://doi.org/10.1136/oem.2005.024802, 2007. a
Morawska, L., Afshari, A., Bae, G., Buonanno, G., Chao, C., Hänninen, O., Hofmann, W., Isaxon, C., Jayaratne, E., Pasanen, P., Salthammer, T., Waring, M., and Wierzbicka, A.: Indoor aerosols: From personal exposure to risk assessment, Indoor Air, 23, 462–487, https://doi.org/10.1111/ina.12044, 2013. a
Mullen, N. A., Liu, C., Zhang, Y., Wang, S., and Nazaroff, W. W.: Ultrafine particle concentrations and exposures in four high-rise Beijing apartments, Atmospheric Environment, 45, 7574–7582, https://doi.org/10.1016/j.atmosenv.2010.07.060, 2011. a
Nazaroff, W. W.: Indoor particle dynamics, Indoor Air, Supplement, 14, 175–183, https://doi.org/10.1111/j.1600-0668.2004.00286.x, 2004. a, b, c
Nazaroff, W. W. and Cass, G. R.: Mathematical Modeling of Indoor Aerosol Dynamics, Environmental Science and Technology, 23, 157–166, https://doi.org/10.1021/es00179a003, 1989. a
Nemmar, A., Hoet, P., Vanquickenborne, B., Dinsdale, D., Thomeer, M., Hoylaerts, M., Vanbilloen, H., Mortelmans, L., and Nemery, B.: Passage of inhaled particles into the blood circulation in humans, Circulation, 105, 411–414, https://doi.org/10.1161/hc0402.104118, 2002. a
Niculita-Hirzel, H.: Latest trends in pollutant accumulations at threatening levels in energy-efficient residential buildings with and without mechanical ventilation: A Review, International Journal of Environmental Research and Public Health, 19, 3538, https://doi.org/10.3390/ijerph19063538, 2022. a
Oberdörster, G., Sharp, Z., Atudorei, V., Elder, A., Gelein, R., Kreyling, W., and Cox, C.: Translocation of inhaled ultrafine particles to the brain, Inhalation Toxicology, 16, 437–445, https://doi.org/10.1080/08958370490439597, 2004. a
Oberdörster, G., Oberdörster, E., and Oberdörster, J.: Nanotoxicology: An emerging discipline evolving from studies of ultrafine particles, Environmental Health Perspectives, 113, 823–839, https://doi.org/10.1289/ehp.7339, 2005. a
Ohlwein, S., Kappeler, R., Kutlar Joss, M., Künzli, N., and Hoffmann, B.: Health effects of ultrafine particles: a systematic literature review update of epidemiological evidence, International Journal of Public Health, 64, 547–559, https://doi.org/10.1007/s00038-019-01202-7, 2019. a
Pacitto, A., Stabile, L., Moreno, T., Kumar, P., Wierzbicka, A., Morawska, L., and Buonanno, G.: The influence of lifestyle on airborne particle surface area doses received by different Western populations, Environmental Pollution, 232, 113–122, https://doi.org/10.1016/j.envpol.2017.09.023, 2018. a, b, c, d, e, f, g, h, i, j, k
Pacitto, A., Stabile, L., Morawska, L., Nyarku, M., Torkmahalleh, M. A., Akhmetvaliyeva, Z., Andrade, A., Dominski, F. H., Mantecca, P., Shetaya, W. H., Mazaheri, M., Jayaratne, R., Marchetti, S., Hassan, S. K., El-Mekawy, A., Mohamed, E. F., Canale, L., Frattolillo, A., and Buonanno, G.: Daily submicron particle doses received by populations living in different low- and middle-income countries, Environmental Pollution, 269, https://doi.org/10.1016/j.envpol.2020.116229, 2021. a, b, c, d, e, f, g, h, i
Park, J., Jee, N.-Y., and Jeong, J.-W.: Effects of types of ventilation system on indoor particle concentrations in residential buildings, Indoor Air, 24, 629–638, https://doi.org/10.1111/ina.12117, 2014. a
Rostedt, A., Arffman, A., Janka, K., Yli-Ojanperä, J., and Keskinen, J.: Characterization and response model of the PPS-M aerosol sensor, Aerosol Science and Technology, 48, 1022–1030, https://doi.org/10.1080/02786826.2014.951023, 2014. a
Salo, L., Hyvärinen, A., Jalava, P., Teinilä, K., Hooda, R. K., Datta, A., Saarikoski, S., Lintusaari, H., Lepistö, T., Martikainen, S., Rostedt, A., Sharma, V. P., Rahman, M. H., Subudhi, S., Asmi, E., Niemi, J. V., Lihavainen, H., Lal, B., Keskinen, J., Kuuluvainen, H., Timonen, H., and Rönkkö, T.: The characteristics and size of lung-depositing particles vary significantly between high and low pollution traffic environments, Atmospheric Environment, 255, https://doi.org/10.1016/j.atmosenv.2021.118421, 2021. a, b
Schmid, O. and Stoeger, T.: Surface area is the biologically most effective dose metric for acute nanoparticle toxicity in the lung, Journal of Aerosol Science, 99, 133–143, https://doi.org/10.1016/j.jaerosci.2015.12.006, 2016. a
Schraufnagel, D. E.: The health effects of ultrafine particles, Experimental and Molecular Medicine, 52, 311–317, https://doi.org/10.1038/s12276-020-0403-3, 2020. a
Scungio, M., Rizza, V., Stabile, L., Morawska, L., and Buonanno, G.: Influence of methodology on the estimation of the particle surface area dose received by a population in all-day activities, Environmental Pollution, 266, https://doi.org/10.1016/j.envpol.2020.115209, 2020. a, b, c, d, e, f
Silvonen, V., Salo, L., Raunima, T., Vojtisek-Lom, M., Ondracek, J., Topinka, J., Schins, R. P., Lepistö, T., Lintusaari, H., Saarikoski, S., Barreira, L. M., Hoivala, J., Markkula, L., Kulmala, I., Vinha, J., Karjalainen, P., and Rönkkö, T.: Lung-depositing surface area (LDSA) of particles in office spaces around Europe: Size distributions, I O-ratios and infiltration, Building and Environment, 246, https://doi.org/10.1016/j.buildenv.2023.110999, 2023. a, b
Tang, R., Sahu, R., Su, Y., Milsom, A., Mishra, A., Berkemeier, T., and Pfrang, C.: Impact of Cooking Methods on Indoor Air Quality: A Comparative Study of Particulate Matter (PM) and Volatile Organic Compound (VOC) Emissions, Indoor Air, 2024, https://doi.org/10.1155/2024/6355613, 2024. a
Todea, A. M., Beckmann, S., Kaminski, H., Bard, D., Bau, S., Clavaguera, S., Dahmann, D., Dozol, H., Dziurowitz, N., Elihn, K., Fierz, M., Lidén, G., Meyer-Plath, A., Monz, C., Neumann, V., Pelzer, J., Simonow, B. K., Thali, P., Tuinman, I., van der Vleuten, A., Vroomen, H., and Asbach, C.: Inter-comparison of personal monitors for nanoparticles exposure at workplaces and in the environment, Science of the Total Environment, 605–606, 929–945, https://doi.org/10.1016/j.scitotenv.2017.06.041, 2017. a, b
Turnock, S., Butt, E., Richardson, T., Mann, G., Reddington, C., Forster, P., Haywood, J., Crippa, M., Janssens-Maenhout, G., Johnson, C., Bellouin, N., Carslaw, K., and Spracklen, D.: The impact of European legislative and technology measures to reduce air pollutants on air quality, human health and climate, Environmental Research Letters, 11, https://doi.org/10.1088/1748-9326/11/2/024010, 2016. a
Vesisenaho, K., Kuuluvainen, H., Mäkinen, U.-V., Olin, M., and Karjalainen, P.: Data related to the paper: Decay phase aerosol dynamics of an indoor particle source has a significant role in exposure analysis, Zenodo [data set], https://doi.org/10.5281/zenodo.15471503, 2025. a, b
Vohra, K., Vodonos, A., Schwartz, J., Marais, E. A., Sulprizio, M. P., and Mickley, L. J.: Global mortality from outdoor fine particle pollution generated by fossil fuel combustion: Results from GEOS-Chem, Environmental Research, 195, https://doi.org/10.1016/j.envres.2021.110754, 2021. a
Wallace, L.: Indoor sources of ultrafine and accumulation mode particles: Size distributions, size-resolved concentrations, and source strengths, Aerosol Science and Technology, 40, 348–360, https://doi.org/10.1080/02786820600612250, 2006. a, b
Wallace, L. and Ott, W.: Personal exposure to ultrafine particles, Journal of Exposure Science and Environmental Epidemiology, 21, 20–30, https://doi.org/10.1038/jes.2009.59, 2011. a, b, c, d
Wan, M.-P., Wu, C.-L., Sze To, G.-N., Chan, T.-C., and Chao, C. Y.: Ultrafine particles, and PM2.5 generated from cooking in homes, Atmospheric Environment, 45, 6141–6148, https://doi.org/10.1016/j.atmosenv.2011.08.036, 2011. a, b, c, d, e
Whitby, E. R. and McMurry, P. H.: Modal aerosol dynamics modeling, Aerosol Science and Technology, 27, 673–688, https://doi.org/10.1080/02786829708965504, 1997. a
WHO: WHO global air quality guidelines, World Health Organization, ISBN 92-4-003422-6, 2021. a, b, c
Yeung, L. and To, W.: Size distributions of the aerosols emitted from commercial cooking processes, Indoor and Built Environment, 17, 220–229, https://doi.org/10.1177/1420326X08092043, 2008. a
Yoon, H., Seo, J., Yoo, S. K., Kim, P. J., Park, J., Choe, Y., and Yang, W.: Updated general exposure factors for risk assessment in the Korean population, Journal of exposure science & environmental epidemiology, 33, 1013–1020, https://doi.org/10.1038/s41370-022-00437-6, 2022. a
Zhao, J., Birmili, W., Hussein, T., Wehner, B., and Wiedensohler, A.: Particle number emission rates of aerosol sources in 40 German households and their contributions to ultrafine and fine particle exposure, Indoor Air, 31, 818–831, https://doi.org/10.1111/ina.12773, 2021. a, b, c, d, e
Zukowska, D., Rojas, G., Burman, E., Guyot, G., Bocanegra-Yanez, M. d. C., Laverge, J., Cao, G., and Kolarik, J.: Ventilation in low energy residences–a survey on code requirements, implementation barriers and operational challenges from seven European countries, International Journal of Ventilation, 20, 83–102, https://doi.org/10.1080/14733315.2020.1732056, 2021. a