the Creative Commons Attribution 4.0 License.
the Creative Commons Attribution 4.0 License.
 | 18 Mar 2026
Results and insights from the first ACTRIS intercomparison workshop on sub-10 nm aerosol sizing instrumentation
Herbert G. Hartl
Janne Lampilahti
Rima Baalbaki
Lauri Ahonen
Tommy Chan
Tinghang Zhang
Joonas Vanhanen
Joonas Purén
Gerhard Steiner
Sebastian Schmitt
Torsten Tritscher
Amine Koched
Manuel Granzin
Petr Roztocil
Silja Häme
Tuukka Petäjä
Katrianne Lehtipalo
Sub-10 nm aerosol particles play a critical role in the atmosphere through their involvement in new particle formation, a key process influencing the availability of cloud condensation nuclei. In recognition of their significance, international observation frameworks such as the Aerosol, Clouds and Trace Gases Research Infrastructure (ACTRIS) engage in the process of integrating their observations into standardized protocols. ACTRIS aims to enhance the understanding of atmospheric processes, including those related to particle dynamics and their interactions with clouds and climate through harmonized long-term observations. To evaluate the performance of current instrumentation for sub-10 nm particle measurements, as well as the procedures for doing so, in November 2023, the ACTRIS Cluster Calibration Center in Helsinki, Finland, held its first workshop on the intercomparison of instrumentation for sub-10 nm aerosol particle number size distribution measurements.
In this workshop, three mobility-based systems (GRIMM PSMPS, TSI 1 nm SMPS and TSI 3938N56) and five activation-based systems (three Airmodus A11s and two Airmodus A12s) were evaluated. The focus lay on assessing their number concentration response and size-dependent detection efficiency – including the determination of the diameter with 50 % detection efficiency – and sizing accuracy. In addition to these parameters, the instruments were compared with each other while measuring aerosol particle number size distributions side by side from an aerosol chamber. Beyond the evaluation of instrument performance, the workshop aimed to test and assess calibration and comparison methods to identify aspects of ACTRIS compliance requiring further refinement.
Although this work highlights the key strengths of the different measurement techniques and instruments, several challenges remain. Mobility-based systems showed high sizing accuracy, especially for particles larger than 2 nm, while encountering challenges in measuring particles in the lower atmospheric concentration range. Activation-based systems proved more sensitive at lower particle number concentrations and particle sizes, with the drawback of slight unit-to-unit variability. Additionally, a systematic size shift was identified in aerosols generated by 4-way-cross glowing wire generator setups, indicating a need for further investigation on this effect and the development of calibration equipment in the sub-10 nm size range.
- Article
(3894 KB) - Full-text XML
- BibTeX
- EndNote


The major role of atmospheric aerosol particles in climatic concerns (Intergovernmental Panel on Climate Change (IPCC), 2021) and human health (Peters et al., 1997; Ibald-Mulli et al., 2002; Oberdörster et al., 2005) is widely acknowledged. Their interaction with solar radiation through the absorption and scattering of sunlight, for instance, directly affects Earth's radiative balance (IPCC, 2021) and consequently global climate patterns. Atmospheric aerosol particles of sufficient size (∼ 50 to 200 nm) also influence the radiation budget indirectly by serving as cloud condensation nuclei (CCN, Pruppacher and Klett, 1980). These nuclei provide sites that are responsible for the initiation of cloud formation processes in conditions otherwise suboptimal for condensation. In addition, their abundance increases a cloud's albedo and contributes to an overall decrease in radiative forcing, as greater fractions of extraterrestrial radiation are scattered back to space. A fundamental understanding of atmospheric aerosols is essential, as it enables accurate climate modelling, informs health impact assessments, and provides insight into cloud formation processes and aerosol life cycles. This includes knowledge of particle properties and formation processes, as well as key parameters like particle size and number size distributions. While characteristic length scales for the occurrence of aerosol-related phenomena span from a few nanometres to hundreds of micrometres, ultrafine particles (UFPs), defined as particles with diameters below 100 nm, have experienced increasing scientific interest lately due to their reactivity, high surface-to-volume ratio and ability to grow rapidly under favourable conditions.
It has been acknowledged that UFPs often dominate total particle number concentrations in many environments and are increasingly recognized as important contributors to adverse health effects (Peters et al., 1997; Ibald-Mulli et al., 2002). In this regard, particles in the sub-10 nm range are of particular relevance. While the earliest measurable stage of nucleation typically occurs at sizes of around 1 to 2 nm, the sub-10 nm size range encompasses both these initial clusters and particles that have already undergone early growth following nucleation. These particles are closely associated with the initial phases of new particle formation (NPF), a process in which low-volatility vapours – such as sulfuric acid or oxidized organic compounds – nucleate to form molecular clusters capable of further growth (Kulmala et al., 2013). The transition from these clusters to stable particles involves complex dynamics, including molecular interactions, condensation and coagulation. Despite contributing only minimally to total particle mass, particles formed during NPF events can grow efficiently by means of condensation, potentially altering atmospheric aerosol populations and CCN concentrations (Kerminen et al., 2018).
Until recently, detecting and characterizing sub-10 nm particles has been technically challenging, and measurements were typically limited to laboratory-based studies and specialized instruments (Chen et al., 1998; Kangasluoma et al., 2020). Due to their small size, these particles exhibit high diffusivity and low charging probabilities, complicating reliable measurement. However, owing to innovative methods emerging over the past decade, reliable techniques for sizing aerosol particles down to 1 nm have been developed.
Current regulatory frameworks have not fully embraced these capabilities. Both the EN 16976:2024 and EN 17434:2023 technical standards and the EU Air Quality Directive recommend starting routine aerosol number concentration and particle number size distribution measurements at 10 nm. This is primarily owing to the fact that measurement techniques below this size threshold are not yet fully mature and sufficiently long-term datasets are still lacking. Past experience has also shown that measurements in this size range tend to exhibit large variability (Wiedensohler et al., 2012).
In recognition of the importance of sub-10 nm particles and ongoing advancements in measurement techniques, international networks are incorporating specialized measurements into their monitoring frameworks. A leading example is ACTRIS (Aerosol, Clouds and Trace Gases Research Infrastructure), a pan-European research infrastructure advancing our understanding of atmospheric processes through harmonized long-term observations (Laj et al., 2024). By integrating advanced measurement techniques, ACTRIS aims to systematically monitor sub-10 nm particles and to provide insights into their formation, growth and interaction with clouds and climate. Standardized methodologies and collaboration among research institutions ensure the collection of reliable, high-precision data on aerosol properties and behaviour across diverse regions.
To ensure data integrity and comparability, ACTRIS adheres to strict guidelines and maintains a list of compliant instruments, defining performance criteria such as sensitivity thresholds, accuracy and data quality standards. These requirements are regularly reviewed to reflect advances in aerosol measurement technologies. In this context, in November 2023, the ACTRIS Cluster Calibration Center (CCC) in Helsinki, Finland (a unit of the Center for Aerosol In-Situ – European Center for Aerosol Calibration and Characterization, or CAIS-ECAC) hosted its first workshop on the intercomparison of instrumentation for measuring sub-10 nm aerosol concentrations and particle number size distributions. The workshop aimed to assess the performance of instruments deployed at the ACTRIS National Facilities, evaluate emerging technologies for potential integration, and develop suitable procedures for measurement and data evaluation.
In this article, we aim to interpret and summarize the outcomes of that workshop so as to offer a critical comparison of instrument performance and current evaluation practices. We also provide an overview of widely used systems for sub-10 nm aerosol measurements and discusses steps towards procedural harmonization across the research community. The following subsections introduce essential background on condensation particle counters and particle sizing methods.
1.1 Condensation particle counters
Condensation particle counters (CPCs) are widely used standard instruments utilizing the principle of condensational growth followed by optical particle detection, with numerous designs developed over the past decade (McMurry, 2000). A conventional optical particle detector's applicability ends where the size of particles approach the inbuilt detection laser's operational wavelength. The CPC bypasses this limitation by exposing particles to an environment of a working fluid's supersaturated vapour (traditionally n-Butanol, water, propylene glycol, etc.) in which the measured particles act as condensation nuclei (CN) for heterogeneous nucleation, followed by their condensational growth. This allows for the measurement of particle sizes down to a few nanometres. Thus, a CPC's purpose is to assess (atmospheric) aerosol total particle number concentrations in the size range of a few nanometres up to several microns. As a result, they are commonly operated as stand-alone instruments.
Amongst other parameters, a CPC's performance is primarily described by its detection efficiency
as a function of the particle size dp. It represents the fraction of the particle number concentration per unit volume ntot,CPC(dp): a CPC is capable of detecting in relation to the concentration as measured by a reference instrument ntot,EM(dp) (typically an aerosol electrometer (EM)) from the same sample. The so-obtained detection efficiency η(dp) is prone to variations over time – potentially caused, for example, by contamination of the optics, mechanical wear, improper handling or transportation – and thus requires re-evaluation during regular calibration in an effort to ensure its validity and accuracy. The calibration follows a standardized procedure (ISO27891, 2015) in which particles of well-defined mobility diameters are selected using a differential mobility analyser (DMA) over a limited size range, such that the fraction of multiply charged particles remains negligible (Wiedensohler, 1988). This measure is absolutely necessary to avoid an overestimation of concentrations by the EM, as multiply charged particles would contribute proportionally more to the measured current, thus biasing its inferred particle number concentration.
An ideal CPC's detection efficiency η(dp) can be represented by a Heaviside step function H(dp−d50), meaning the CPC detects 100 % of sampled particles above a certain threshold size – the so-called cutoff diameter d50 – and none below it. In reality, various factors contribute to a more gradual transition in detection efficiency, making it better described by a sigmoidal curve. These size-dependent factors – such as sampling efficiency, activation efficiency (Wlasits et al., 2020) and detector efficiency (Stolzenburg and McMurry, 1991) – are inherently intertwined and cannot be measured separately. To enable a comparison between an actual CPC's detection efficiency and that of an ideal one, the cutoff diameter d50 is defined as the (mobility equivalent) diameter at which the instrument detects 50 % of its own maximum (plateau) detection efficiency ηplat (see below). This maximum is typically below 100 % and is determined by comparing CPC measurements to those of a reference EM (Stolzenburg and McMurry, 1991). The cutoff diameter d50 depends on the particle seed, the working fluid in use and the CPC's operating temperatures (i.e. condenser and saturator temperature, which determine the supersaturation profile) (Wlasits et al., 2020). As a result, the cutoff diameter serves as a key indicator of a CPC's lower detection limit.
Another limitation of a CPC's applicability is imposed by the particle concentrations (number of particles per volume) in the measured air sample. While low concentrations appear less problematic, high concentrations may lead to multiple particles entering the detection volume within a single counting interval. This causes an overlap of optical pulses and a non-linear undercounting of particles, also known as coincidence (Collins et al., 2012). Coincidence effects theoretically begin as soon as more than one particle is present per detection interval. In practice, the concentration at which coincidence becomes measurable depends strongly on the sample flow rate through the optical detection volume and the associated residence time. For conventional CPC designs, first measurable effects are typically observed at concentrations on the order of 103 cm−3, which is why CPC cutoff calibrations are usually performed at concentrations below approximately 1500 cm−3. For typical CPCs, a 10 % coincidence error – often taken as a practical threshold for the upper limit of reliable single-particle counting – is only reached at concentrations of around 104 to 105 cm−3 (Collins et al., 2012). Modern CPCs incorporate correction algorithms that compensate for coincidence effects over a substantial fraction of their specified concentration range, which may extend up to 106–107 cm−3 depending on the instrument design and optical flow rate. For particle number concentrations approaching or exceeding the upper end of this range, the uncertainty of the coincidence correction increases, resulting in reduced measurement precision rather than an immediate breakdown of counting capability. However, even far below these concentrations, most CPCs exhibit a systematic linear deviation in measured concentration, quantified by the deviation factor κ, when calibrated against an EM. According to Eq. (1), a CPC's plateau detection efficiency ηplat – defined as its detection efficiency η(dp) at the upper asymptote (dp → ∞) – depends on the measured concentrations and consequently on the deviation factor κ. Since a CPC's cutoff diameter d50 is strongly influenced by its plateau detection efficiency ηplat, concentration deviations also affect its precise determination.
To extend the lower detection limit of a CPC even below approximately 2 nm, it can be combined with an upstream particle growth device, such as the particle size magnifier (PSM) manufactured by Airmodus Oy (Finland) – as described by Vanhanen et al. (2011) and Sulo et al. (2024) – or the Nano Enhancer produced by TSI Incorporated (USA). These devices facilitate the pre-growth of particles before they enter the CPC, enabling even the smallest particles to grow to optically detectable sizes. While they operate on the same fundamental principle as CPCs, they differ by omitting the optical detection unit, and comprising only a saturator and a condenser section.
In the saturator stage, a wicking material loaded with a volatile working fluid – typically diethylene glycol (DEG) – provides vapours that mix with the aerosol flow. Heating this stage increases the vapour content that the aerosol's gas phase can hold, allowing equilibrium with the aerosol to be reached. As the aerosol then transitions into the condenser stage, it is rapidly cooled, causing vapour supersaturation. This process enables the aerosol particles to act as CN, causing them to grow into mixed-phase droplets. Despite the higher supersaturation achieved in the PSM compared to a CPC, these droplets remain too small for optical detection. The aerosol is therefore passed to a downstream CPC, where the particles undergo further condensational growth, and are subsequently detected and counted via scattered laser light. This serial arrangement of instruments allows for the activation of significantly smaller particles, which would otherwise remain undetected, therefore effectively lowering the cutoff size compared to a CPC alone.
1.2 Sizing methods
The classical approach for sizing ultrafine aerosol particles, which has been the predominant method over the past decades, relies on the particles' electrical properties, specifically their electrical mobility for size classification and their charge for detection. Representative systems typically discriminate charged particles and ions by subjecting them to the electric field of a DMA. Upon varying the strength of this field, particles are segregated on the basis of their electrical mobility (Knutson and Whitby, 1975). Subsequent counting can be performed using an EM, and the combination of these devices is referred to as mobility particle size spectrometer (MPSS). Such systems are used for sizing aerosols across the full submicrometer range. However, their reliability diminishes as particle size approaches the dimensions of molecular clusters (∼ 2 nm) due to high diffusion losses (Ingham, 1975) and low charging probabilities (Wiedensohler, 1988). Moreover, if an EM is used as the detector, low aerosol concentrations result in weak electrical currents, leading to a poor signal-to-noise ratio, which makes precise measurements challenging. A variation of this principle is employed in an air ion spectrometer (AIS; Mirme et al., 2007) and the neutral cluster and air ion spectrometer (NAIS; Mirme and Mirme, 2013), which offer high sensitivity for small ions and improved time resolution. It is important to note that mobility-based systems such as the MPSS require an aerosol neutralizer to establish a known charge distribution. If the detector stage is capable of measuring particles below ∼ 1.7 nm, ions from the neutralizer itself can be detected and misinterpreted as aerosol particles, potentially leading to significant measurement artefacts (Steiner et al., 2014; Tang and Seeger, 2024).
An alternative approach to particle sizing is offered by activation-based systems, which exploit the supersaturation-induced growth of particles. By varying the supersaturation levels in their saturator stage, systems such as the Airmodus PSM can be used for particle number size distribution measurements (Kogan and Burnasheva, 1960; Lehtipalo et al., 2014). In such activation-based sizing systems, CPCs serve as the final stage, mapping concentrations to the corresponding saturation conditions. While these systems excel at detecting low concentrations without requiring particles to carry charges, their accuracy can be significantly influenced by the particle's charging state and composition, which affect the activation probability (Kangasluoma et al., 2014; Winkler et al., 2008). In addition, their lower size detection limit is fundamentally constrained by the onset of homogeneous nucleation of the working fluid, which occurs if the supersaturation (set by the temperature difference between their saturator and condenser stage, as described by Vanhanen et al., 2011) is increased beyond a critical level. At particle number concentrations approaching or exceeding 107 cm−3, these systems become decreasingly precise due to limitations in single-particle counting and potential coincidence errors. Amongst others, examples for these systems are the Airmodus A11 (Vanhanen et al., 2011), its successor the Airmodus A12 (Sulo et al., 2024) and the TSI Nano Enhancer 3757.
More recent approaches combine elements of both activation-based and charge-based methods. These hybrid systems typically use, for example, an Airmodus PSM or a TSI Nano Enhancer for (pre-)growing charged particles segregated by a DMA and a downstream CPC for counting (Jiang et al., 2011b). Examples include the GRIMM PSMPS and the TSI 1 nm-SMPS. Integrating activation-based pre-growth with mobility-based size classification allows hybrid systems to extend the measurable size range of MPSSs to smaller sizes, while overcoming some limitations inherent to both techniques. Although these systems use a hybrid approach, throughout this article we will refer to them as mobility-based systems, referring to the underlying principle of their sizing method.
In addition to instrumental differences, several studies have highlighted how particle chemical composition and charging state can influence activation and therefore detection efficiencies, especially within the sub-10 nm size range (Kangasluoma et al., 2014, 2020). Calibration particles used in laboratory settings – such as metal oxides or salts – do not fully represent the physicochemical properties of atmospheric particles, which usually consist of a mixture of organic compounds, inorganic species (e.g. sulfates, nitrates, ammonium), black carbon or soot, sea salt, mineral dust and other trace components (Kangasluoma et al., 2020; Kulmala et al., 2013; Canagaratna et al., 2007). These compositional and charging-related differences may therefore introduce additional uncertainties when transferring laboratory-based calibration results to ambient measurement conditions.
Within the last 2 decades, only a few have attempted to intercompare sizing systems in the sub-10 nm range. Asmi et al. (2009) and Gagné et al. (2011) focused on comparing different ion spectrometers (AISs and NAISs) and evaluating their performance in the 1 to 40 nm size range. Wiedensohler et al. (2012) assessed the performance of different mobility-based instruments and found large discrepancies below 20 nm, while Kangasluoma et al. (2020) provided a comprehensive overview of instrumentation capable of measuring particle number size distributions in the size range of 1 to 10 nm. However, a systematic intercomparison of various instrument types for sizing sub-10 nm particles has not yet been conducted – a gap this study also aims to address.
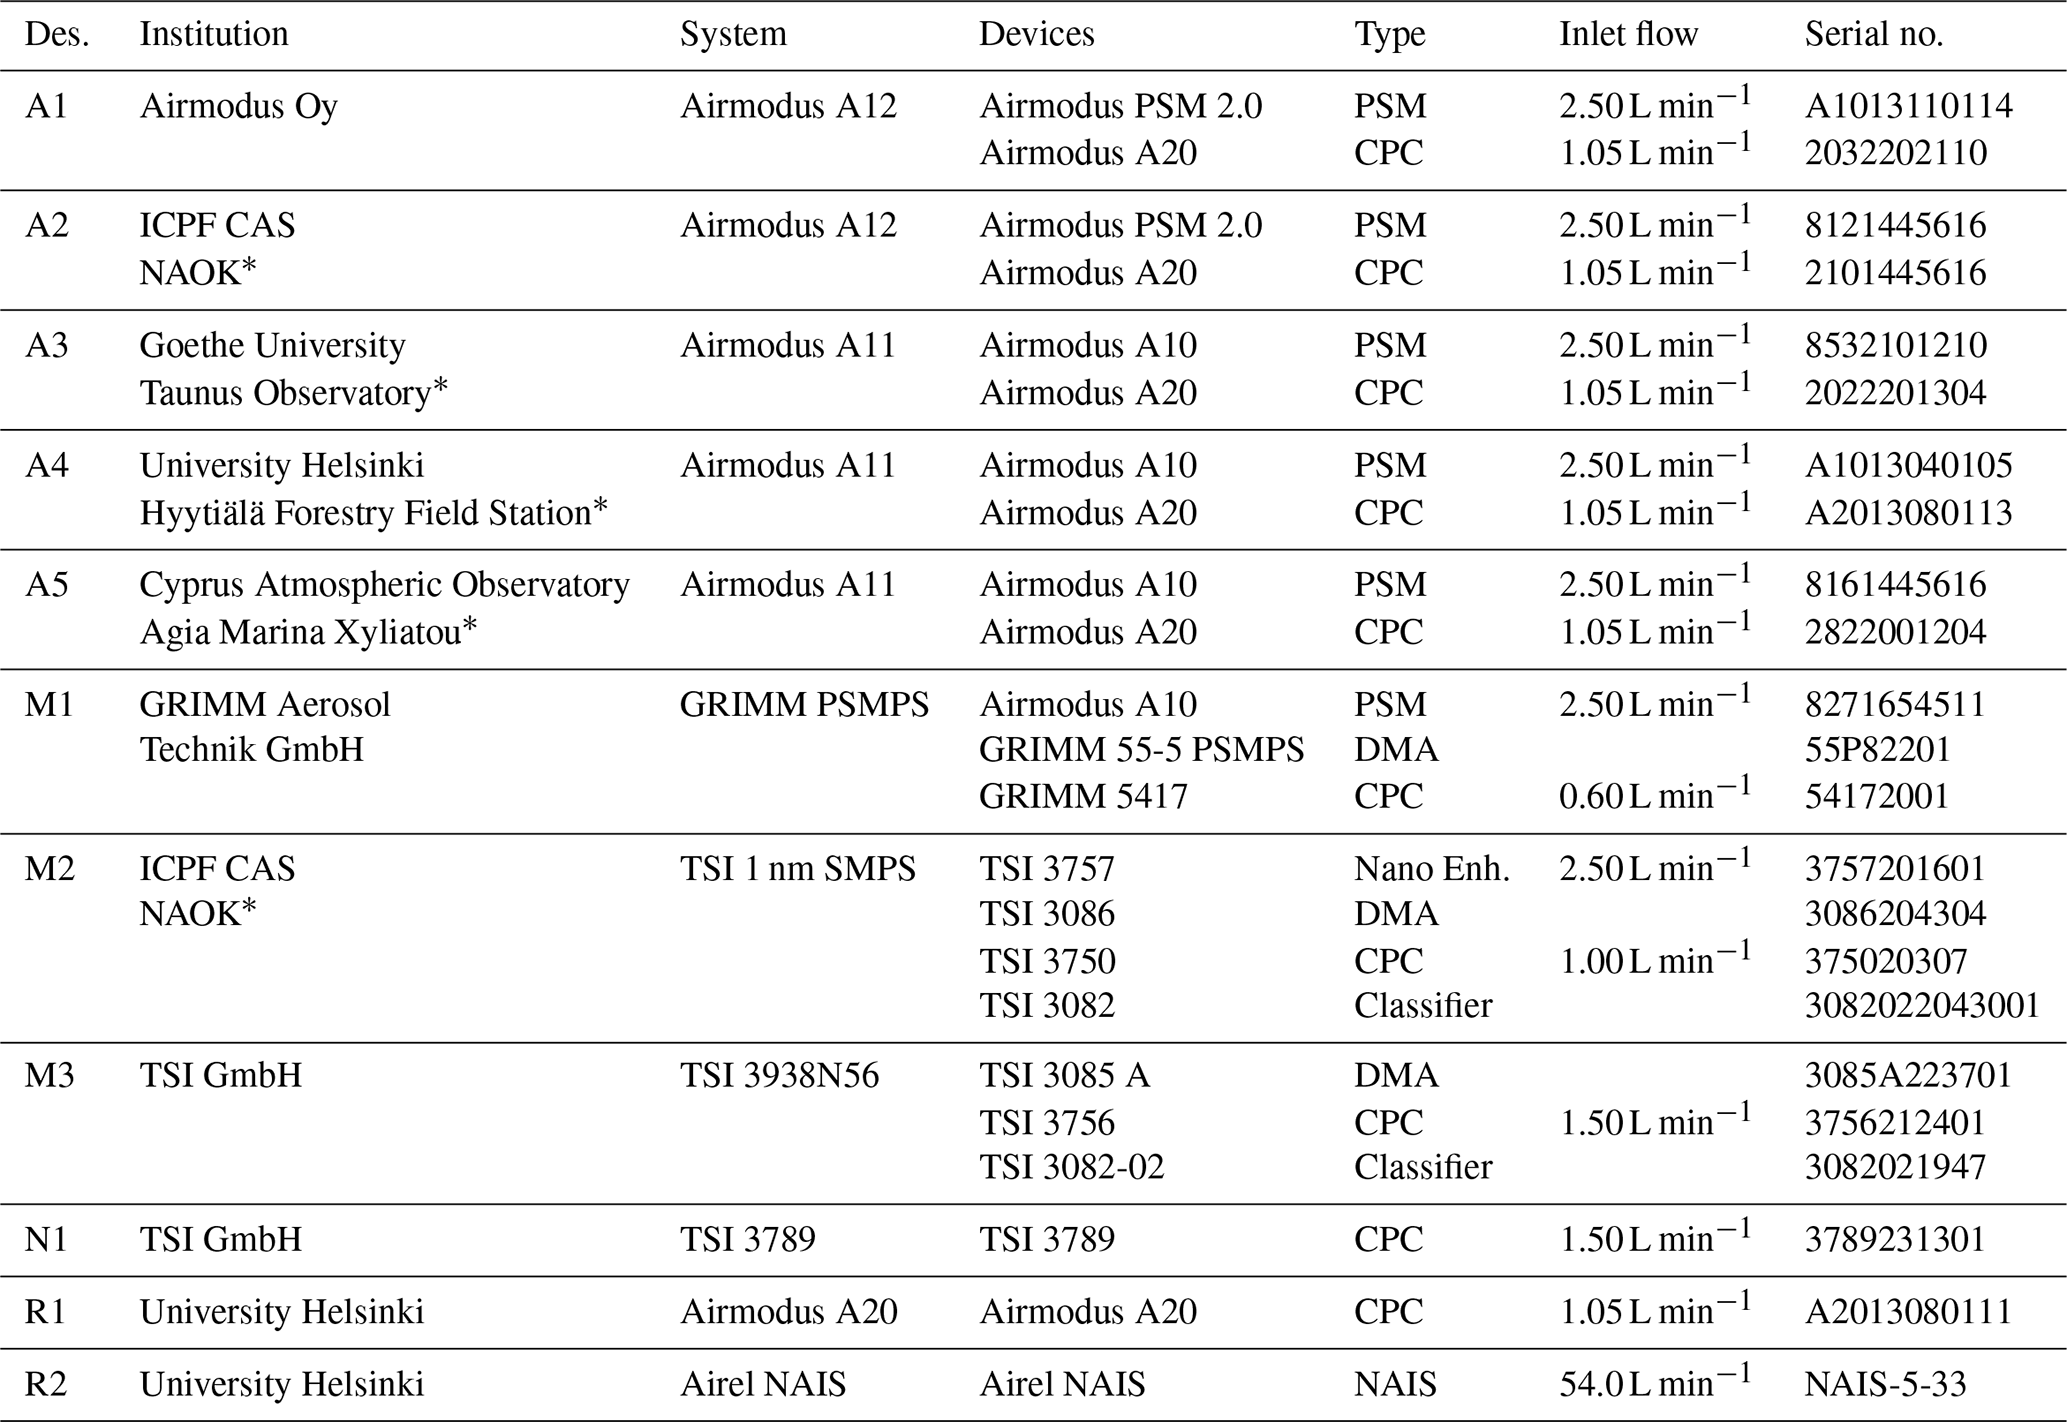
In this work, we present investigations conducted during the ACTRIS intercomparison workshop in Helsinki in November 2023. The study focused on evaluating different sizing systems in terms of linearity response, detection efficiency and sizing accuracy. Additionally, we carried out comparative measurements to assess the performance of these systems measuring polydisperse aerosol at different concentration levels, created using an aerosol chamber. The following section describes the examined systems, the experimental setups used for their evaluation, the research plan and the data analysis methods. An overview of the systems examined in the scope of the workshop, along with their details and naming conventions, is provided in Table 1. All measurements were performed in an open format, where instrument operators were aware of the general experimental conditions.
Table 1Overview of systems investigated during the workshop. Letters in the designation indicate the classification method: “A” denotes activation based, “M” mobility based, “N” non-classifying and “R” reference only. Sites marked with “*” are ACTRIS National Facilities. The column “Inlet flow” lists the (nominal) sampling flow rates of the instruments.
2.1 Experimental setups
Figure 1a illustrates the setups used for generating a test aerosol during the measurements. Particles were produced with a glowing wire generator (GWG) – as described by Peineke et al. (2006) – in a 4-way-cross design. A tungsten oxide (WOx) coil inside the generator was heated by passing an electric current through it. The resulting vapours were cooled downstream, forcing them into nucleating to aerosol particles. The hot-wire flow was supplied with pressurized nitrogen and a constant flow rate of Qa = 3.2 L min−1, while precise flow control was achieved by employing an upstream mass flow controller. Particles were selected downstream according to their electrical mobilities by means of a classification system that consisted of an 241Am neutralizer and a Hauke DMA. The Hauke DMA (also known as a Vienna-type DMA) used in these experiments is a replica of the DMA originally developed by the University of Vienna (Winklmayr et al., 1991). This DMA was later commercialized by Hauke GmbH & Co. KG, although the company no longer sells this instrument.
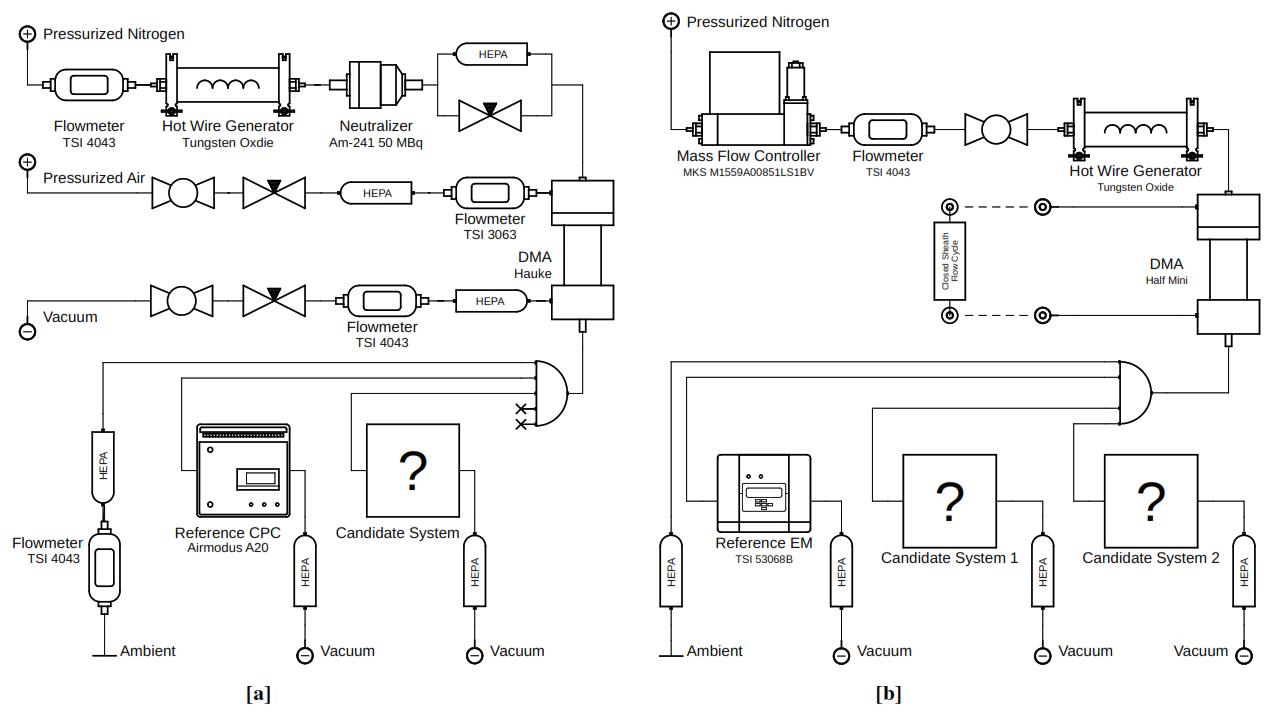
Figure 1Schematic of the setups used for the workshop measurements. (a) Hauke setup and (b) Half-Mini setup, which were used for the linearity response, chamber response, sizing accuracy and detection efficiency measurements.
Its open sheath air flow of Qsh = 20 L min−1 utilized pressurized clean and dry air, including HEPA filters, flowmeters and needle valves. The symmetrically operated DMA's resolution R = (Flagan, 1999) was held at a constant level of RHauke = 6.25 for all measurements. The particle concentrations were regulated by a dilution bridge preceding the DMA. Subsequently, the aerosol flow was split, feeding a reference EM or CPC (depending on the measurement), up to two candidate systems and a vent line open to the atmosphere to compensate for potential overflows. However, for the chamber measurements (see Sect. 2.2.4), the flow was directed into the chamber directly rather than being split, and instruments were sampling from its outlets. Unless stated otherwise, the conductive tubes used after the flow splitters were standardized to a length of 25 cm to ensure greater comparability between instruments. As a result, diffusional losses did not need to be considered for measurements where ratios were relevant. Details on tubing configurations for specific experiments can be found in the respective sections.
For the production of smaller particles (dp ≤ 7 nm), as required for some measurements (see Sect. 2.2.3 and 2.2.2), the Hauke DMA was replaced with a (high resolution) closed-loop sheath flow Half-Mini DMA (Fernández de la Mora and Kozlowski, 2013), the dilution bridge was removed and the flow rates were adjusted accordingly. The aerosol flow was monitored with a mass flow controller rather than a flowmeter. With an aerosol flow rate of Qa = 15 L min−1 and an estimated sheath flow rate of Qsh = 200 L min−1, the resulting resolution computes to RHalf−Mini = 13.4. Particle concentrations were controlled by adjusting the current through the WOx wire. The setup described can be seen in Fig. 1b.
For the calibration of the Half-Mini DMA, tetraheptyl ammonium bromide (THAB) ions were generated using electrospray. In this context, the term “calibration” refers to a verification and eventual adjustment of the DMA's voltage-to-particle diameter relationship by using well-characterized ions of known electrical mobility as references. In principle, a traditional DMA can serve as a primary standard as a selected particle's mobility is fully determined by the applied voltage, the sheath flow rate and the DMA's geometry. However, this is not the case for compact, high-sheath-flow designs (such as the Half-Mini DMA), due to their actual sheath flow rates not being accessible directly with sufficient accuracy. Therefore, THAB ions serve as mobility standards that allow comparison between detected ion peaks and theoretical mobility values, as described by Ude and Fernández de la Mora (2005). In this way, the effective voltage–mobility relationship of the instrument is experimentally confirmed. This procedure enables accurate particle sizing, and ensures consistent and traceable measurement results. The solution was prepared by diluting THAB into methanol, and ion peaks detected from the electrospray source matched well with existing studies (Ude and Fernández de la Mora, 2005). For the Hauke DMA, particle sizes were calculated directly in a measurement program using the ideal DMA equation by Knutson and Whitby (1975) and the specific characteristic dimensions of the DMA.
Although in principle, both DMAs are capable of classifying particles of either polarity, measurements were conducted exclusively on negatively charged particles. This choice was made due to the higher charging probabilities of negatively charged particles (Wiedensohler, 1988), and it is also assumed that negatively charged particles of the same composition achieve higher activation efficiencies at small sizes, regardless of the CPCs used (Winkler et al., 2008; Kangasluoma et al., 2016). Additionally, the complete sampling system was kept as short as possible to minimize the effects of diffusion, especially for the smallest particles (Ingham, 1975).
2.2 Experimental procedures and analysis
2.2.1 Concentration linearity
For the measurement of linearity responses across the different systems' CPCs, the Hauke setup, as previously described (see Fig. 1a), was used. It is important to note that only the CPC units themselves were examined, rather than the complete measurement systems they are part of. For clarity and consistency, each CPC is still referred to by the name of its parent system (e.g. “M2”, “A1”) throughout the description. To ensure that the generated WOx particle sizes fell within the examined CPC's plateau region, we utilized mobility diameters between 40 and 50 nm. By using a calibrated Airmodus A20 CPC as a reference instrument rather than an EM, we circumnavigated the issue of handling doubly charged particles – which, according to Wiedensohler (1988), occur with a non-negligible probability at these sizes. The conductive tubing used after the flow splitter to guide the split flow to the candidate and the reference systems was of equal length. Although some of the examined CPCs were operated with inlet flow rates (see Table 1) that differed from the reference CPC's (R1) inlet flow rate of QR1 = 1.05 L min−1, the difference in diffusion losses resulting were considered negligible within the targeted size range (Ingham, 1975). For every CPC examined, at least eight different particle concentrations, ranging from 100 to 6 ×104 cm−3, were measured over a sampling period of at least 5 min each, for both the CPC under investigation and the reference instrument. To account for potential instrument offsets, the median concentration during runs with particle-free air – recorded over a 5 min period prior to actual measurements – was subtracted from the measured values. The median concentration of the investigated and the reference instrument were then compared for each concentration setting, and a linear fit model was applied to compute the CPC's deviation factor κ. As a preliminary benchmark for passing the examination, a 10 % tolerance around unity was defined. Note that to further reduce the influence of outliers, data from the seconds before and after each concentration transition were excluded from the analysis, actively avoiding concentration spikes. Since the goal was to examine CPCs under field conditions, the internal coincidence correction of the CPCs remained enabled.
2.2.2 Detection efficiency
The procedure for investigating the systems' counting efficiencies was similar to that used for measuring their concentration deviation factors κ (see Sect. 2.2.1), except that the test aerosol’s mode diameter was varied instead of its total concentration ntot. Since all examined systems are listed with cutoff diameters d50 below 7 nm (see Table 2), only the Half-Mini setup (see Fig. 1b) was used for these measurements. In this size range and under charge equilibrium, the fraction of doubly charged particles is negligible (Wiedensohler, 1988), and an EM was utilized as the reference instrument. The Half-Mini DMA was operated with different applied voltages corresponding to a set of at least 10 particle mode diameters ranging from 1.1 to 7 nm. For each of these sizes, we sampled a stable particle concentration for at least 5 min, keeping total concentrations ntot below 2 × 104 cm−3, as measured by the EM. To ensure comparable diffusion losses between the candidate system and the reference, the EM's flow rate was matched to that of the system under test, and equal-length conductive tubing was used after the flow splitter. This approach allowed diffusion losses to be disregarded in the detection efficiency calculation, as they were effectively identical for both systems and thus cancelled out. Note that due to their higher diffusional losses, smaller classification diameters correlate to lower total concentrations (Ingham, 1975). A system's detection efficiency η(dp,i) for a particular particle diameter dp,i was obtained by simply comparing the (zero-corrected) median of the total particle number concentration as measured by the system, nSys(dp,i), to that measured by the reference EM, nEM(dp,i). The resulting data points were subsequently fitted with a skewed Gaussian cumulative density function (see Eq. 3), yielding the detection efficiency curve η(dp) (see Eq. 1). Lastly, we numerically rendered the cutoff diameter from the inverted detection efficiency curve, with d50 = η−1(0.5).
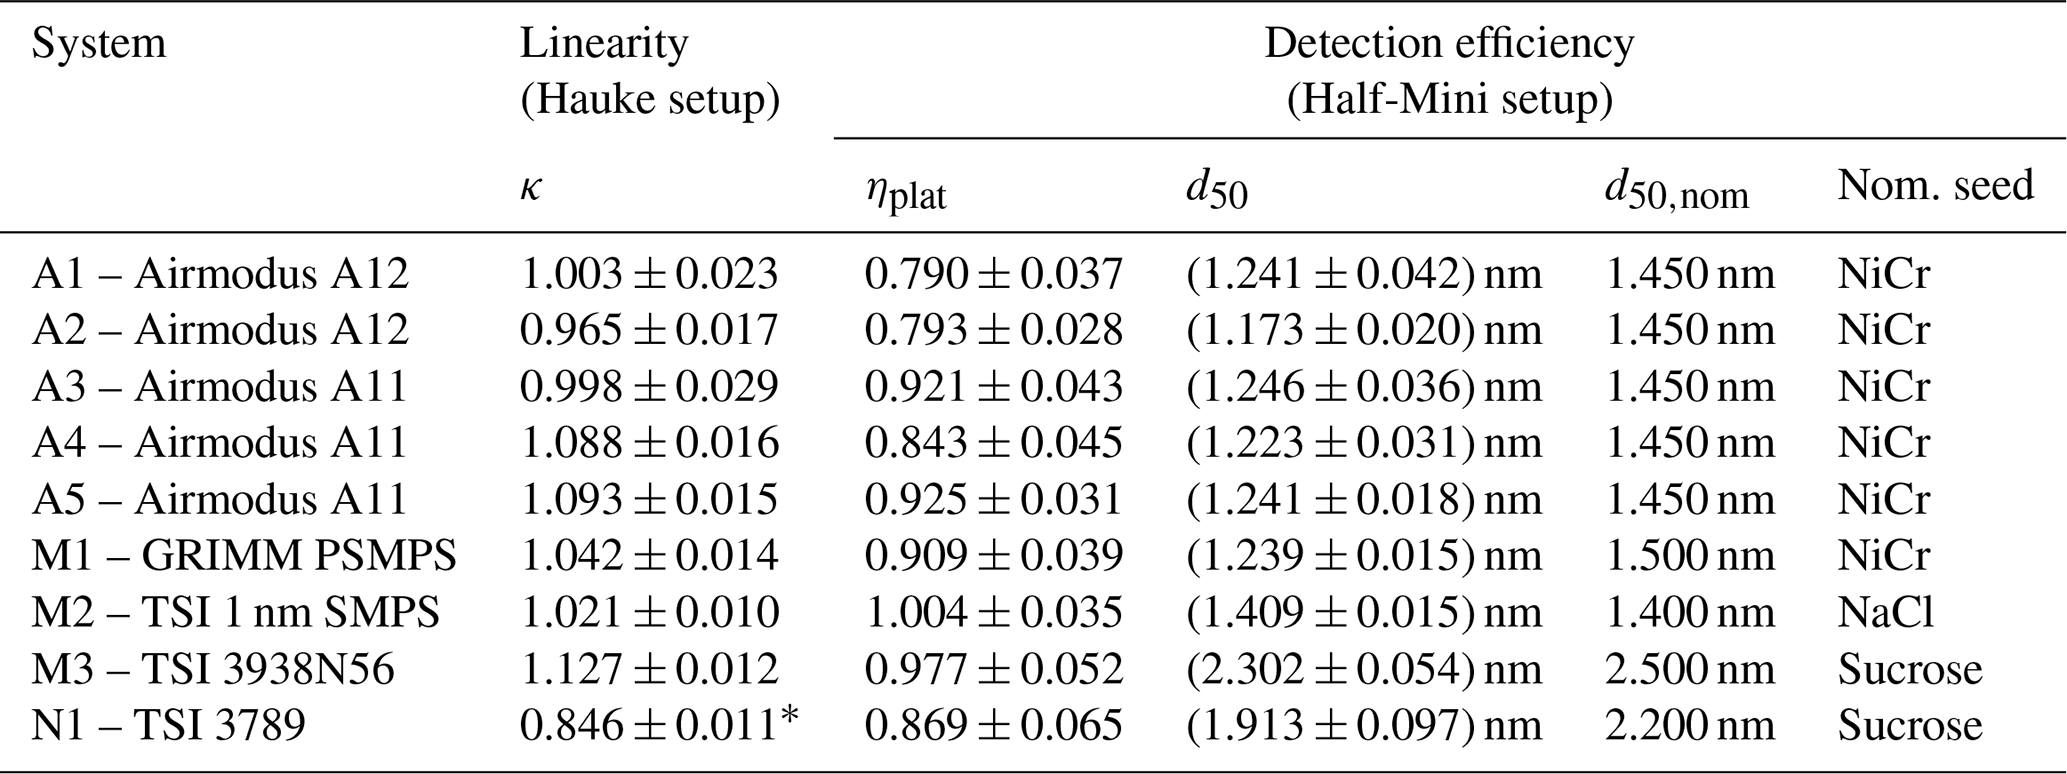
Table 2Linearity and detection efficiency measurements for the systems investigated. The column κ shows the linearity factor obtained on the Hauke setup (Sect. 3.2). Detection efficiency measured on the Half-Mini setup is reported as the plateau height ηplat and the size-shift-corrected cutoff d50, with the nominal cutoff d50,nom as declared by the manufacturer and the corresponding particle seeds in the last column (Sect. 3.3). Entries marked with an asterisk indicate defective units.
2.2.3 Sizing accuracy
The systems' capacities on properly sizing aerosol particles were investigated for nominal particle diameters , ranging from 1.1 to 30 nm. Thus, both setups, namely the Half-Mini setup for sizes ≤ 7 nm and the Hauke setup for sizes ≥ 7 nm (see Fig. 1), had to be used. Here, the hat symbol indicates our definition of the nominal particle diameter as the mode of a particle number size distribution obtained using the Hauke/Half-Mini DMA operated at a fixed voltage. This definition is consistent with the DMA's calibration, which was performed using THAB and electrospray, as discussed previously. For each particle size investigated, a monodisperse aerosol was generated, and the overall concentration levels were aimed to be kept reasonably high. All examined systems operated on scanning mode and sampled over at least three (stable) scanning runs. The channel-wise average of the three most stable measurement runs was utilized for fitting a representative skewed Gaussian regression curve:
Here, d0, σ, A and a denote for the Gaussian's location-, scatter-, amplitude- and skewness parameters, respectively (with generally d0 ≠ holding true). The fitted curves' modes were then compared with the nominal diameter , and the ratio of these two values accounted for an indication of the system's sizing accuracy.
To investigate the data obtained from measurements with mobility-based systems, no special treatment was required and the data could be used for analysis as described previously.
However, for the activation-based systems – namely, the Airmodus A11 and A12 – the manufacturer specifies upper sizing limits of ∼ 4 and ∼ 12 nm, respectively. Additionally, a proper analysis of these systems demanded a more refined distinction between the particle size regimes examined. For an evaluation of the smallest particles (dp ≤ 4 nm), the inverted scans over all possible supersaturation levels – as produced by the software delivered with the Airmodus systems – was used for fitting. As described previously, a skewed Gaussian function was applied and the respective distributions' modes were derived from it. An analysis of data from measurements of larger particles (dp > 4 nm) required the fitting of raw data – that is, saturator flow rates S versus cumulative particle concentrations n(S) – prior to manual inversion. For this, a skewed Gaussian cumulative function, as given by
was applied. Here, A represents the function's amplitude, while C accounts for a constant offset. In the case of the cumulative concentration curve n(S), C equals to zero. The distributions' modes were determined by first computing the derivative of this fit function, then inverting it numerically and finally identifying the mode from the resulting distribution. We applied this procedure because the PSM's diameter–saturator flow relationship dp(S) (also known as an inversion curve) becomes very steep for larger particle sizes, meaning that small variations in saturator flow rates S correspond to large changes in mobility diameter dp. This steepness causes a narrow saturator flow distribution to translate into a broad particle number size distribution, complicating mode identification by means of conventional methods. It should be noted that the zero measurements conducted for this experiment were only intended to check whether the setup was functioning correctly, and no correction for potential offsets was applied, as these have no impact on the distribution modes. Particularly for the smallest particle sizes (dp < 2 nm), diffusional broadening can reduce a DMA's resolution (Stolzenburg, 1988; Jiang et al., 2011a), which may also cause a slight mode shift towards larger sizes. For these measurements, the influence of this effect was considered negligible and was therefore ignored.
2.2.4 Chamber measurements
To evaluate the performance of the participating sizing systems under conditions resembling atmospheric sampling, we conducted measurements in a larger sampling volume using an airtight metal chamber (80 × 80 × 80 cm) equipped with three sampling ports on each of its four vertical walls (named A, B, C and D). On two opposing sides (A and C), the ports are positioned at a height of 45 cm, while on the remaining sides (B and D), they were placed at 35 cm. The three ports on each wall are spaced 20 cm apart, with steel sampling tubes (OD = 6 mm, ID = 4 mm) extending 20 cm into the chamber. The middle port on side A (A2) differed from the others, extending 30 cm into the chamber and serving as the aerosol inlet. The remaining two ports on side A (A1 and A3) functioned as an exhaust and dilution inlet. To ensure proper aerosol mixing, a fan was placed at the bottom centre of the chamber.
The examined systems were connected to sampling ports on walls B, C and D using conductive tubing. Since different instruments had different flow rates, the tubing lengths were adjusted accordingly to ensure comparable diffusional losses across systems. Mobility-based instruments were additionally equipped with a Ni-63 370 MBq neutralizer. For aerosol generation, a setup similar to the Hauke configuration (as depicted in Fig. 1a) was used but with the DMA removed to sample the raw distributions directly from the WOx generator with an aerosol flow rate of Qa ≈ 20 L min−1. The 241Am-neutralizer remained in place to ensure the injected particles reached charge equilibrium. The aerosol concentration and particle number size distribution inside the chamber were controlled by adjusting the WOx generator voltage, ranging from 0 V (zero measurements) to 12.5 V. Measurements were conducted over a 2 d period, including overnight chamber background measurements. Throughout all measurements, the chamber remained slightly under-pressurized.
2.3 Uncertainties
Generating a stable aerosol signal that conserves particle concentrations and the population's geometric mean diameter (GMD) poses a critical factor to most aerosol measurements and their reproducibility. While variations of the GMD effectively turned out to be negligible during the workshop's investigations, keeping the particle concentrations at a reasonably stable level throughout a measurement period manifested as more challenging. On this behalf, the results obtained from concentration measurements are represented as the (channel-wise) median ni,50 rather than the arithmetic mean as mentioned previously. By taking this action, we aimed to actively avoid concentration outliers significantly biasing a proper representation of the underlying particle distributions. Accordingly, the interquartile range (IQR) was used for mapping concentration uncertainties. The error bars of quantities derived directly from measured data were calculated in accordance with Gauss' law of error propagation. For this matter, the IQR values were transformed to an estimate of the standard deviations using σ ≈ IQR1.34 prior to error propagation. For computing uncertainties of quantities resulting from regression models (e.g. the slope of a linear fit or the peak location (mode) of a Gaussian fit), a Monte Carlo uncertainty estimation approach was used. This method is depicted in Fig. 2 and described in the following steps:
-
A Gaussian probability density function 𝒩(μ,σ2) has been modelled for each of the measured channels . Here, the channel's data-point values yi (e.g. the concentration median ni,50) were used as the respective Gaussian's location parameter μ, while the data-point's standard deviation si:=s(yi) served as the Gaussian's scatter parameter.
-
For each measured channel i, an artificial sample data point has been generated from the Gaussian probability density function corresponding to that channel , as described in step 1.
-
Using the generated sample , a regression curve has been generated to fit the underlying sample by employing the same functional form f as the one used for the measured data . Generally, the artificial sample's fit parameters differed from those parameters θ used for fitting the measured data .
-
From the regression function , the quantity of interest (e.g. the distribution's mode diameter ) had been derived.
-
Steps 2 to 4 have been repeated J times.
-
For the set of the derived quantities , the standard deviation has been computed.
-
If the standard deviation did not converge towards a constant value, the sample size J was increased.
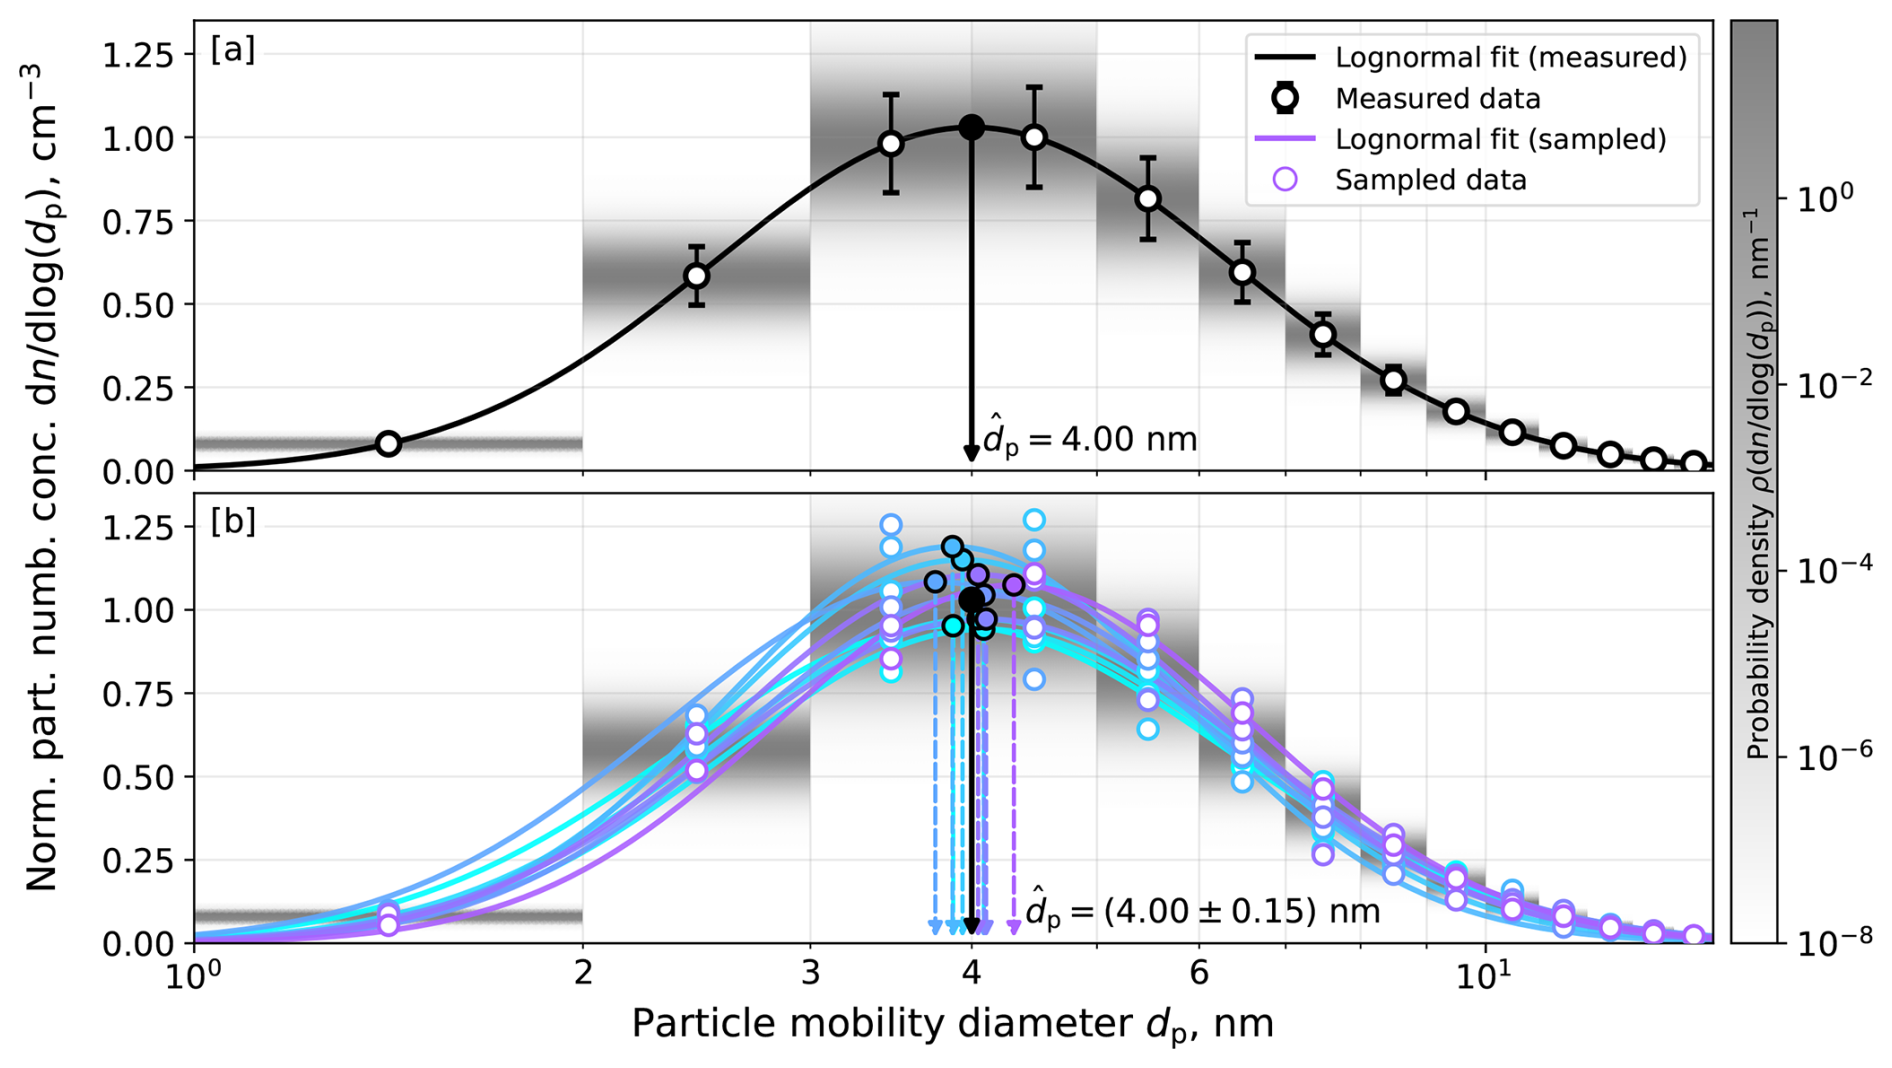
Figure 2Example scheme for computing uncertainties from regression functions (Sect. 2.3). Data points are shown as white circles with solid edges, regression fits as solid lines and derived peaks as dots with arrows. Black symbols indicate measured data (a), while coloured symbols indicate 10 artificially generated datasets (b). Grey areas show the Gaussian probability distributions used to generate the artificial data.
Note that in order to apply the illustrated procedure, the measured values were implicitly assumed to fluctuate around their true values in a Gaussian-like manner. Especially for concentration measurements conducted over longer time periods, in which significant trends are noticeable, this assumption may be violated. In case of the linearity measurements (see Sect. 2.2.1), the validity of this statistical approach is arguable. However, only minor trends were observed during the measurements and these were assumed to be decent enough to justify the application of this method as a legitimate way for estimating the uncertainties of quantities derived from regression models. In cases where deviations are known for both x and y axes (e.g linearity response), this procedure can be extended into two dimension, simulating a tuple of values for each data point.
Here we present the results of the measurements on the concentration linearity, the sizing accuracy, the detection efficiency and the chamber measurements (see Sect. 2.2.1–2.2.4). Throughout the following sections, measurement device systems are referred to by their respective designation, regardless of whether the entire system or only the corresponding particle counter was investigated. This applies unless a clear and unique association with a system was not possible or explicitly stated otherwise. In an additional effort to provide a clear overview, improve readability and ensure easy differentiation between the investigated systems, each is represented by a unique colour in the following figures.
3.1 Size shift
The sizing accuracy measurements revealed a systematic size shift of the distribution modes produced by both the Half-Mini and Hauke setups. To verify this finding, we measured the particle sizes generated by the workshop calibration setup and for comparison, also on other 4-way-cross glowing wire generator setups, using an Airel NAIS (System R2) operated in the negative ion mode. The results of these measurements are depicted in Fig. 3. Here, the circle markers correspond to measurements on the workshop setup itself and the square markers indicate measurements on a similar setup but with NiCr as seed material. To test whether the observed size shift is related to the DMA used, the DMA in the setup was replaced with a Perez-DMA (Perez-Lorenzo et al., 2020). The resulting measurements are indicated by the red and blue plus markers in Fig. 3. An otherwise identical measurement with a cooling coil placed upstream of the DMA is indicated by the yellow cross marker. Lastly, the grey markers in Fig. 3 correspond to measurements from setups using a different type of aerosol generator. Despite differences in configuration, nearly all 4-way-cross glowing wire generator setups show a consistent overestimation of the particle size relative to the nominal mode diameters , which resembles the particle size the DMA was set to select, based on its THAB calibration (as described in Sect. 2.1). This size ratio appears to increase with increasing nominal particle sizes until it reaches a constant value at around 4 nm, with measured diameters more than 20 % larger than nominal. Only the setups using alternative aerosol sources (see grey triangles in Fig. 3) showed minimal or no deviation from the 1:1 line, confirming that the issue is specific to the 4-way-cross glowing wire generator.
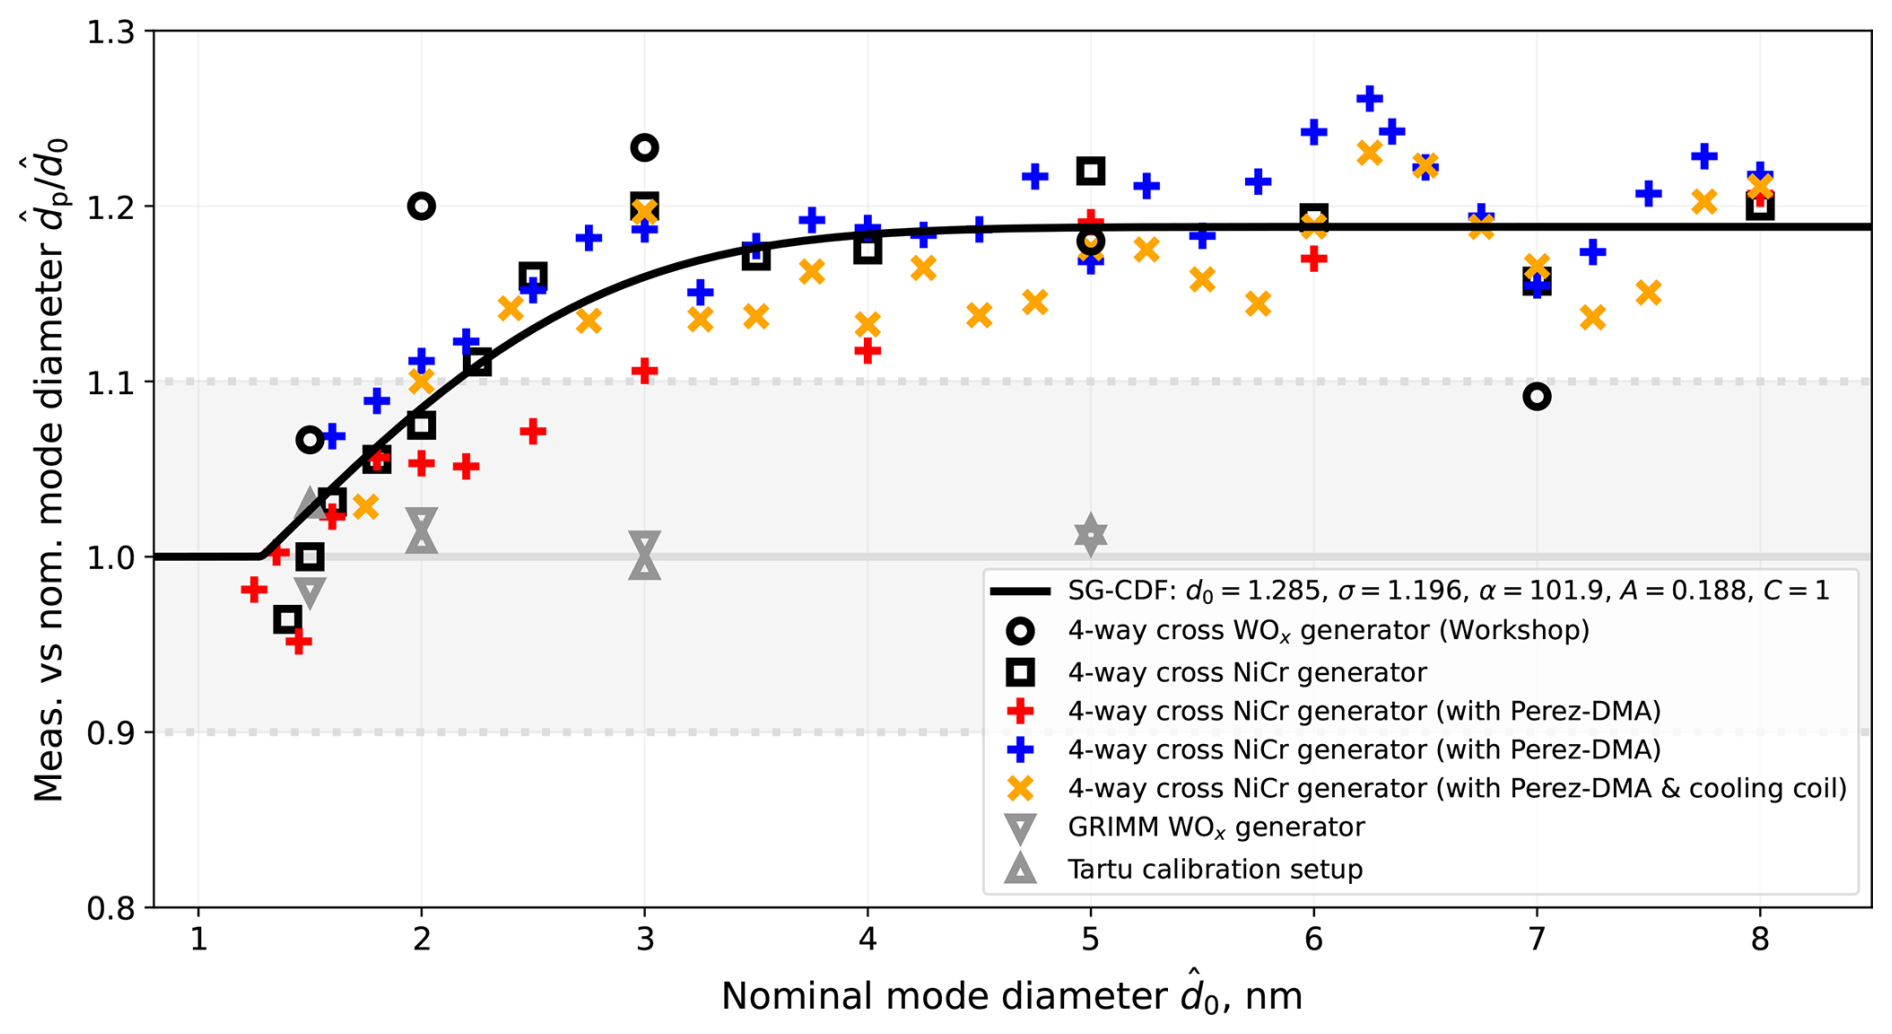
Figure 3Particle size shift of the 4-way-cross glowing wire generator during workshop measurements. The ordinate shows the ratio of mode diameter measured with an Airel NAIS in negative ion mode to the nominal diameter (according to THAB calibration) . The solid line is a skewed Gaussian cumulative distribution function fit (SG-CDF, Eq. 3) with parameters d0, σ, A, α and C. Marker types indicate measurement conditions: circles for the workshop setup, squares for NiCr particle seed, red and blue plus symbols for two independent runs performed with NiCr and a Perez-DMA, yellow cross symbols for a measurement conducted under otherwise identical conditions (but with cooling of the aerosol flow added prior to the DMA's inlet) and grey triangles for a different source excluded from the fit. Error bars are omitted for clarity. See Sect. 3.1 for discussion.
A number of potential explanations were considered for the observed behaviour. One possibility is the DMA different response to various seed types (e.g. metal oxide versus THAB). A more plausible explanation for the observed size shift is insufficient post-generation cooling. The O-rings used to seal the 4-way-cross glowing wire generator, as well as the housing itself, are known to emit volatile compounds when exposed to heat, which may be contributing to the issue. If the aerosol is cooled only after or during classification (e.g. by the sheath flow), these vapours may condense in the process, causing the classified particles to grow and therefore appear larger than desired. However, the cooling coil tested here was insufficient to mitigate the effect (see the yellow vs blue and red crosses in Fig. 3) and thus we cannot confirm this explanation. Further investigations to determine the exact cause of the size shift are very strongly recommended, as well as using a different particle source in future workshops.
To correct the workshop data for the size shift, a skewed Gaussian error function was fitted to the data points in Fig. 3, as the exact reason for the size shift is still unknown, but the behaviour is likely non-linear. To account for the size shift in the Hauke setup, an overall average of the available data points = 1.06 ± 0.03 was used. The results for the detection efficiency and the sizing accuracy measurements (see below) were corrected for by means of the regression function.
3.2 Concentration linearity
A summary of the CPCs' linearity deviation factors κ, as computed from data obtained by the linearity measurements (see Sect. 2.2.1), can be found in Table 2. The deviation factors κ represent the slope of a linear regression model fitted to the measured data points. Apart from the devices M3 and N1, all instruments performed reasonably well – that is, their linearity deviation factors κ lie within a 10 % range to unity. However, two instruments namely the TSI 3789 water CPC (N1) and the TSI 3756 (M3), did not fulfil this criterion, the first of which (N1) appeared to underestimate particle concentrations for all concentration settings by approximately κN1 = 15 %. As observed during the measurements, a defective nozzle turned out to be the reason for this behaviour, effectively rendering results obtained from measurements performed with the TSI 3789 water CPC (N1) as not representative. Nevertheless, the instrument was used as a (corrected) reference during the chamber experiments to provide a rough indication of the magnitude of particle number concentrations. The second CPC exhibiting irregular behaviour – the TSI 3756 (M3) – revealed a contrasting trend, overestimating particle concentrations by roughly 13 %. The deviation is attributable to the investigated system's CPC calibration being outdated. This often results in a drift of the deviation factor κ.
3.3 Detection efficiency
The values for the plateau detection efficiency ηplat for the whole systems and the size-shift-corrected cutoff diameters d50, as derived from the applied regression curves (Eq. 3), are listed in Table 2 alongside the nominal values provided by the manufacturer. Additionally, the results are visualized in Fig. 4. It is important to note that all the systems were tested using WOx particles during the workshop, whereas the nominal cutoff diameters as provided by the manufacturers were determined using different seed particles (see Table 2 and Fig. 4). This difference in particle composition may influence the effective electrical mobility and thus detection efficiency, potentially introducing small shifts in the observed cutoff diameters. As discussed in the previous section, the particles generated by the workshop setups exhibited a systematic size shift relative to nominal values, which also affected the results of the size-dependent detection efficiency measurements. Consequently, the obtained data had to be corrected in a manner as described in Sect. 2.2.3.
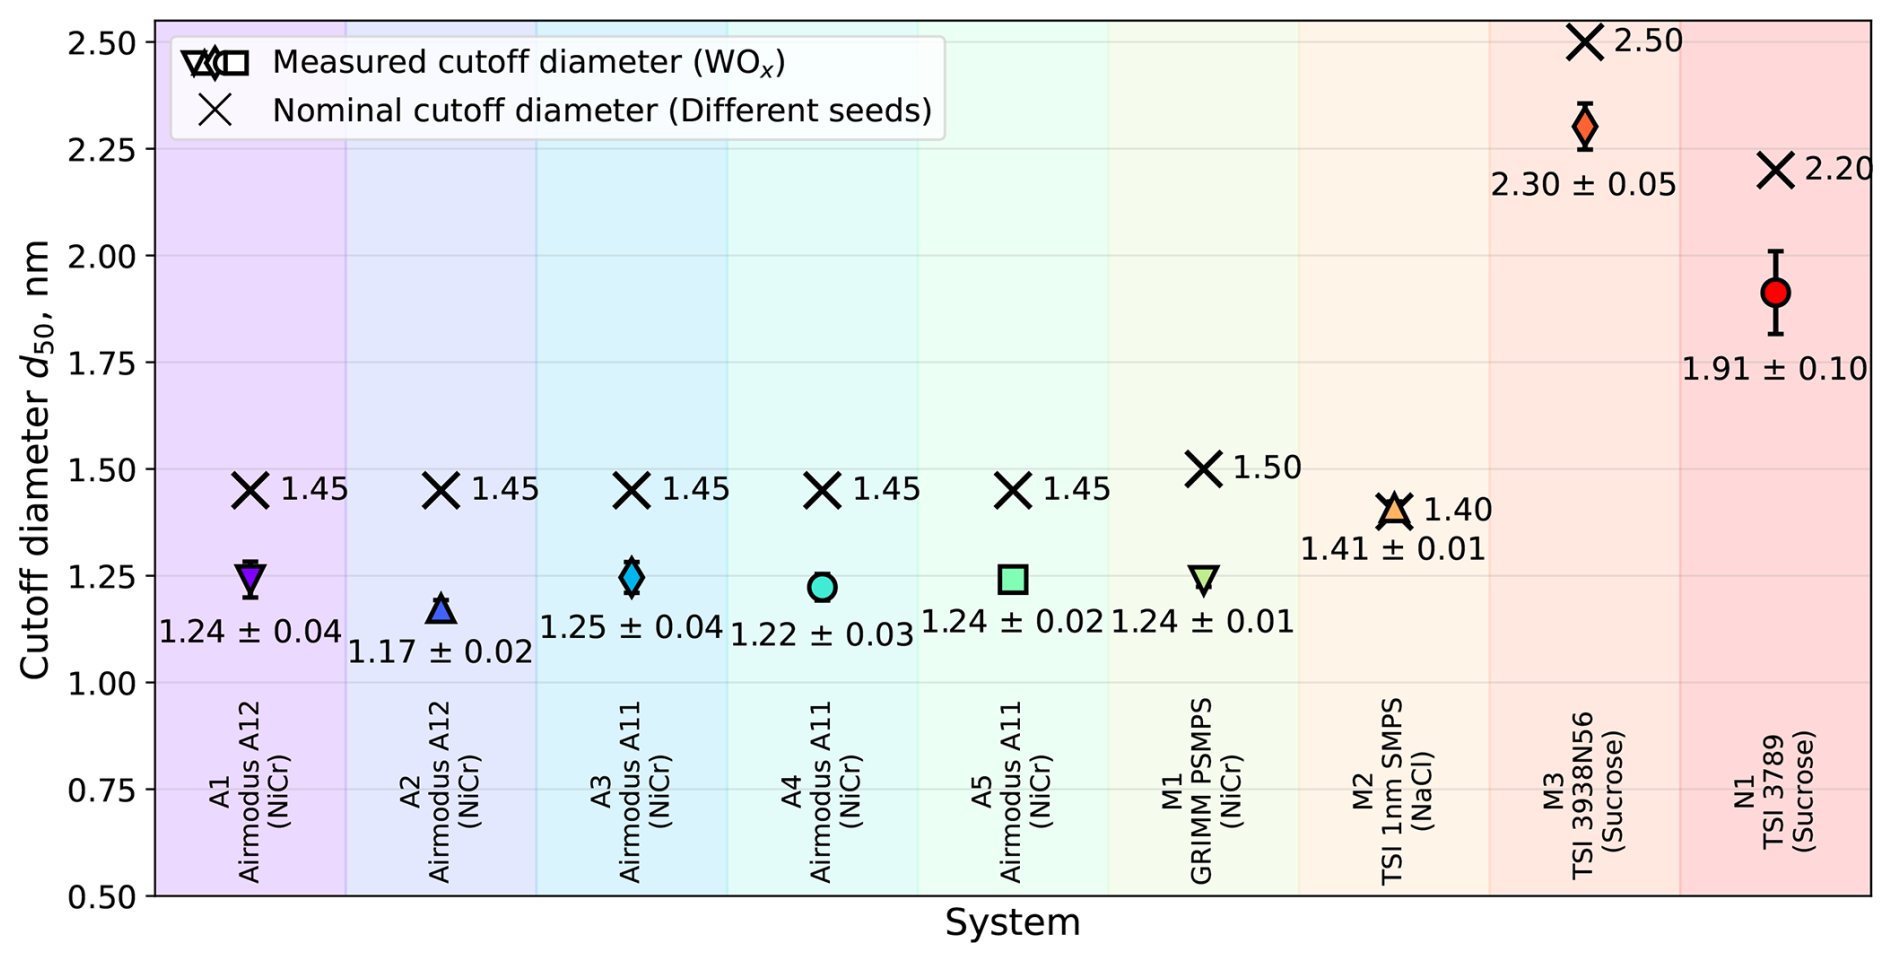
Figure 4Results of the detection efficiency measurements. Crosses indicate the nominal cutoff diameters d50,nom specified by the manufacturers using the seed particles listed below each system name, while differently shaped coloured symbols show the cutoff diameters measured with WOx on the workshop setup (see Sect. 3.3 for discussion).
Notable differences were observed between the results of the linearity tests conducted with the Hauke setup and the detection efficiency measurements performed using the Half-Mini setup. In principle, the deviation factor κ from the linearity test and the plateau detection efficiency ηplat from the detection efficiency evaluation should yield comparable values, as both reflect the maximum counting capability of the CPCs. However, in the present study, the linearity test evaluated only the CPC units in isolation, whereas the detection efficiency measurements assessed the complete systems, including upstream components (e.g. PSM, Nano Enhancer), which introduce additional particle losses. Furthermore, the particle sizes used in the detection efficiency measurements may not have been large enough to reach the true plateau region of the CPCs, and both factors adhere to the observed discrepancies.
The cutoff values for all but one system, namely the TSI 1 nm SMPS (M2), were found to be 0.2 to 0.3 nm below their respective nominal values, demonstrating a high level of consistency across instruments. We speculate that the origin of this systematic behaviour might partly be found either in the simplistic approach used to correct for the size shift and/or in the fact that only negatively charged particles were used for the calibrations. It should be noted that both cutoffs – the nominal value as reported by the manufacturer, as well as the value measured during the workshop – were determined under controlled laboratory conditions employing charged particles. Under atmospheric conditions, the fraction of naturally charged sub-10 nm particles is next to negligible, and the substantial majority of particles remains uncharged. Since neutral particles exhibit lower activation efficiencies compared to charged ones (see previous sections), this may effectively result in a shift of the cutoff towards slightly larger particle diameters for environmental applications. In contrast, the measured cutoff diameter for TSI 1 nm SMPS (M2) d50 = (1.409 ± 0.015) nm was effectively indistinguishable from its nominal value. This difference likely reflects the manufacturer's unique choice of using NaCl as a calibration seed. Further investigations are needed to clarify any residual differences.
3.4 Sizing accuracy
The size-shift-corrected sizing accuracy results for the different systems investigated on the Hauke and Half-Mini setups are presented in Fig. 5. For both setups, the mobility-based systems (M1–M3) mostly demonstrated high sizing accuracy capabilities, consistently relating the measured particle sizes to the nominal mode diameter , within a deviation of 10 % (except for the very smallest sizes), which will be discussed in more detail below. In contrast, activation-based systems exhibited greater unit-to-unit variability, and the sizing accuracy was dependent on particle size. However, all activation-based systems (except A3 with defective saturator) were within 20 % accuracy in the 2 to 10 nm size range.
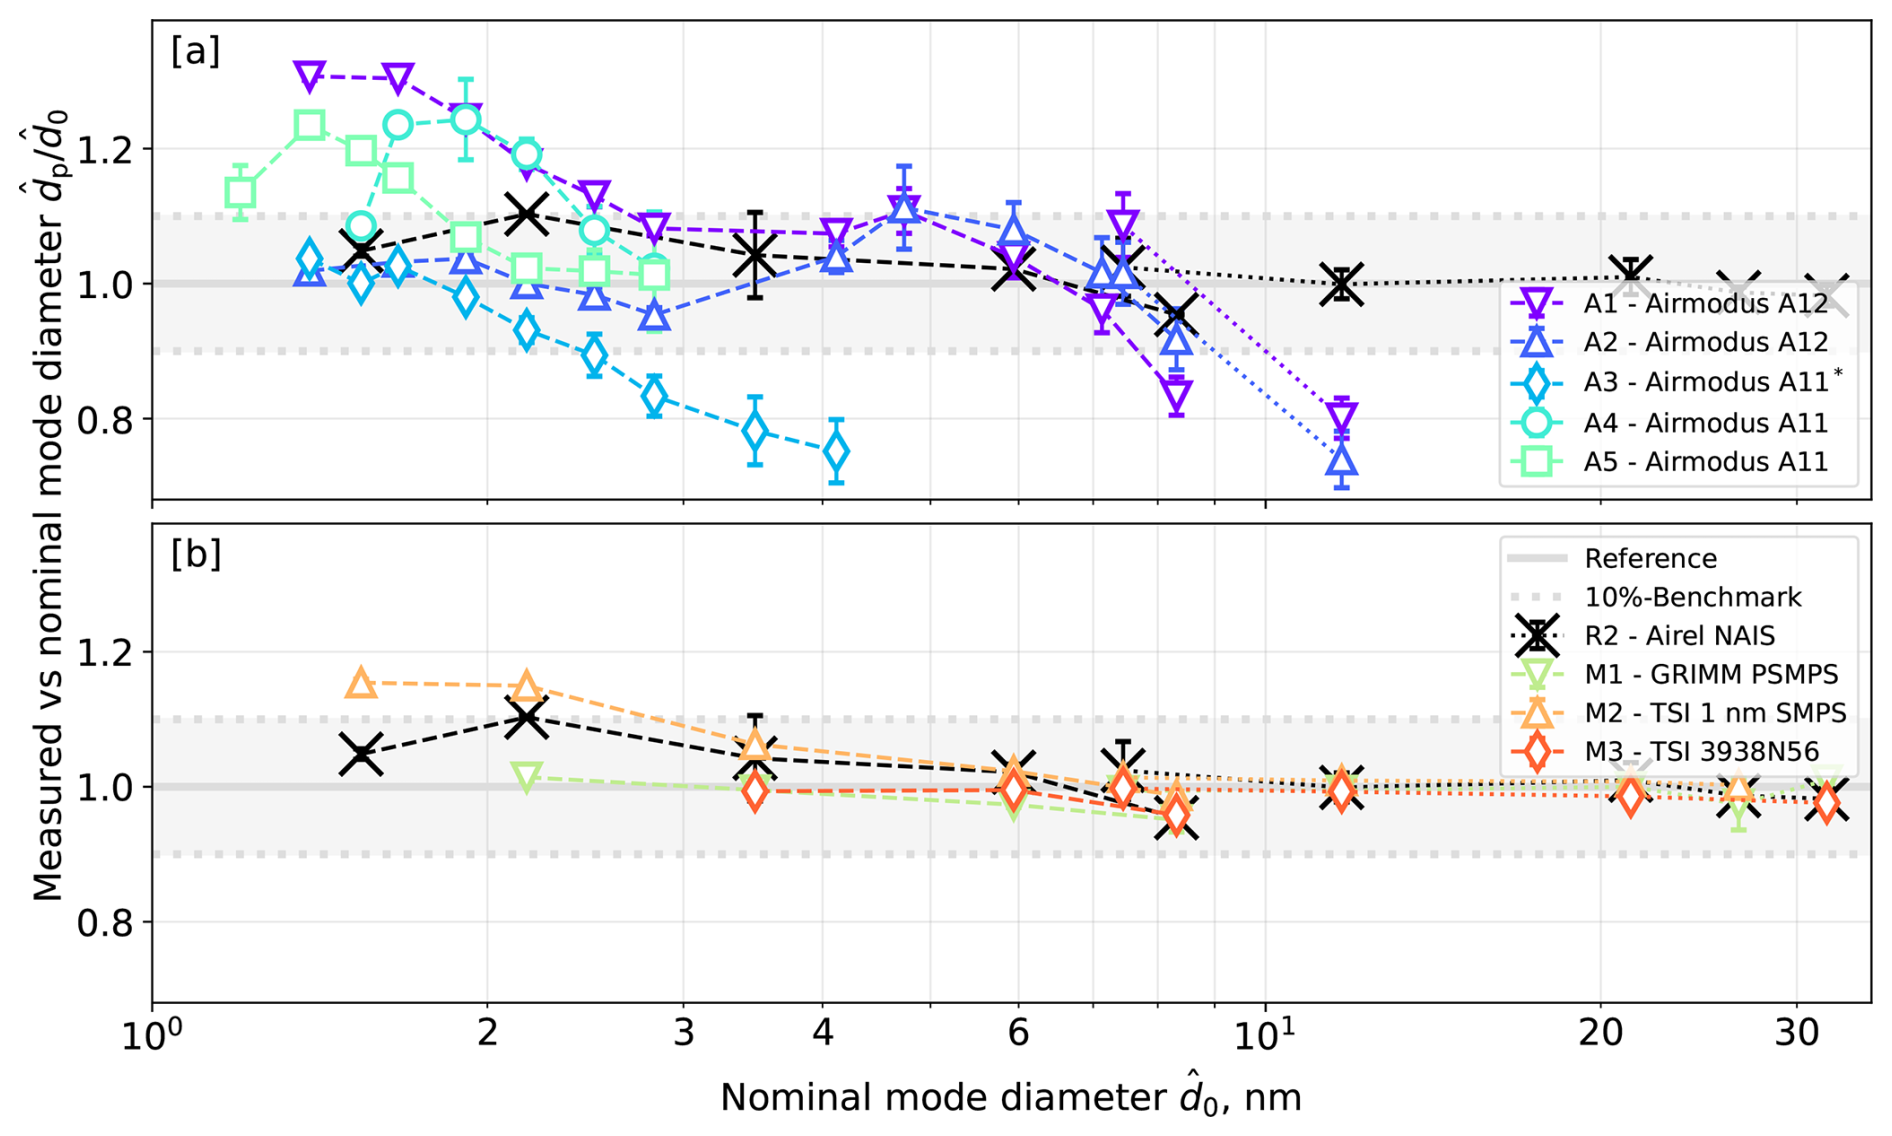
Figure 5Results of the sizing accuracy measurements. Panel (a) shows activation-based systems and panel (b) mobility-based systems. Data obtained with the Half-Mini setup are connected by dashed lines and those from the Hauke setup by dotted lines. Asterisks mark defective units or components (see Sect. 3.4 for discussion).
A common feature that was observed across most systems (including the NAIS (R2), which was used as sizing reference) in the Half-Mini setup was that the ratio of measured to nominal particle size was elevated for the smallest particle sizes and gradually declined across the measurement range. While this trend might arise from an imprecise correction of the size shift (see Sect. 2.2.3), it could also reflect the influence of diffusion broadening, which becomes more pronounced at small particle sizes. It should be noted that the PSM manufacturer calibrations are typically performed using a similar setup, which may themselves be subject to unquantified size shift effects. Consequently, applying the size-shift correction derived from the workshop data might introduce an over-correction, potentially contributing to the observed deviations. Furthermore, a distinct jump was observed in the transition region between the Hauke and Half-Mini setups (∼ 7.5 nm), seen by all instruments. This phenomenon may indicate an over-correction of the Half-Mini setup’s size shift, an under-correction of the Hauke setup's size shift or a combination of both.
The variability observed among activation-based systems is primarily attributable to their internal inversion process used to derive particle sizes from raw data. This inversion relies on an empirical relationship dp(S) that maps saturator flow rates S to particle diameters dp and decays exponentially with S. Due to unit-to-unit variability, the exact relationship depends on the instrument. The instruments' sensitivity to deviations is therefore governed by the derivative of this inversion function and increases with increasing particle size dp (or decreasing saturator flow S). Thus, minor deviations during the measurement of particles with dp > 3 nm may lead to significant discrepancies in the measurement outcome for both activation-based models. Outdated calibrations may further exacerbate this effect, accounting for both the observed offsets and the systematic trends. The steep decrease in sizing accuracy for the Airmodus A12 instruments (A1, A2) as observed above 7 nm might (partially) be as a result of the described increase in sensitivity. A distinct local increase in sizing accuracy was also observed precisely in the region of the inversion function's maximum curvature (corresponding to the previously mentioned particle sizes of around 2 to 3 nm). In this region, the inversion function exhibits the most significant changes in transformation characteristics (stretching/compression) and hence represents the least linear domain of it (Lehtipalo et al., 2014). While the strictly monotonic behaviour of the function precludes drawing conclusions about the local upward trend in the non-linear regime, both systematic and random deviations may still play a role. For a more comprehensive overview of the PSM's calibration curve, see also Vanhanen et al. (2011), Lehtipalo et al. (2014), Cai et al. (2018) and Sulo et al. (2024). It should also be noted that data for system A3 (Airmodus A11) are not considered valid due to a defective saturator identified during the measurements (which was replaced for the other measurements).
Overall, activation-based systems were uniquely capable of detecting even the smallest particle sizes investigated with reasonable accuracy, whereas mobility-based systems maintained robust sizing accuracy over the whole size range tested here (∼ 1.5 to 32 nm).
3.5 Chamber measurements
The performance of the different instruments was compared by measuring the particle number size distribution and total particle concentration of the WOx aerosol in the chamber across various concentration levels. An overview of the time series of total particle concentrations as measured by all systems throughout the chamber experiment is given in Fig. 6a. The highlighted time intervals (panels b–d) resemble specific generator settings that correspond to concentration levels ranging from high to zero (background). Boxplots of the total concentrations for the respective time periods (as indicated by panels b–d) are shown in Fig. 6b.1–d.1. The respective particle number size distributions averaged over those time periods are found in Fig. 6b.2–d.2. The panels (4)–(7) in Fig. 7 represent the median particle concentrations within four distinct particle size intervals: [1,2), [2,4), [4,12) and ≥ 12 nm. These size boundaries were chosen to reflect the detection limits of the mobility-based instruments on one hand, while also capturing a detailed view of sub-10 nm aerosol particles. The red line in each panel indicates the reference total particle concentration ntot,N1, as recorded by the TSI 3889 water-based CPC (N1) and corrected by the factor 0.846−1, corresponding to the inverse of its linear response factor κ (see Sect. 3.2).
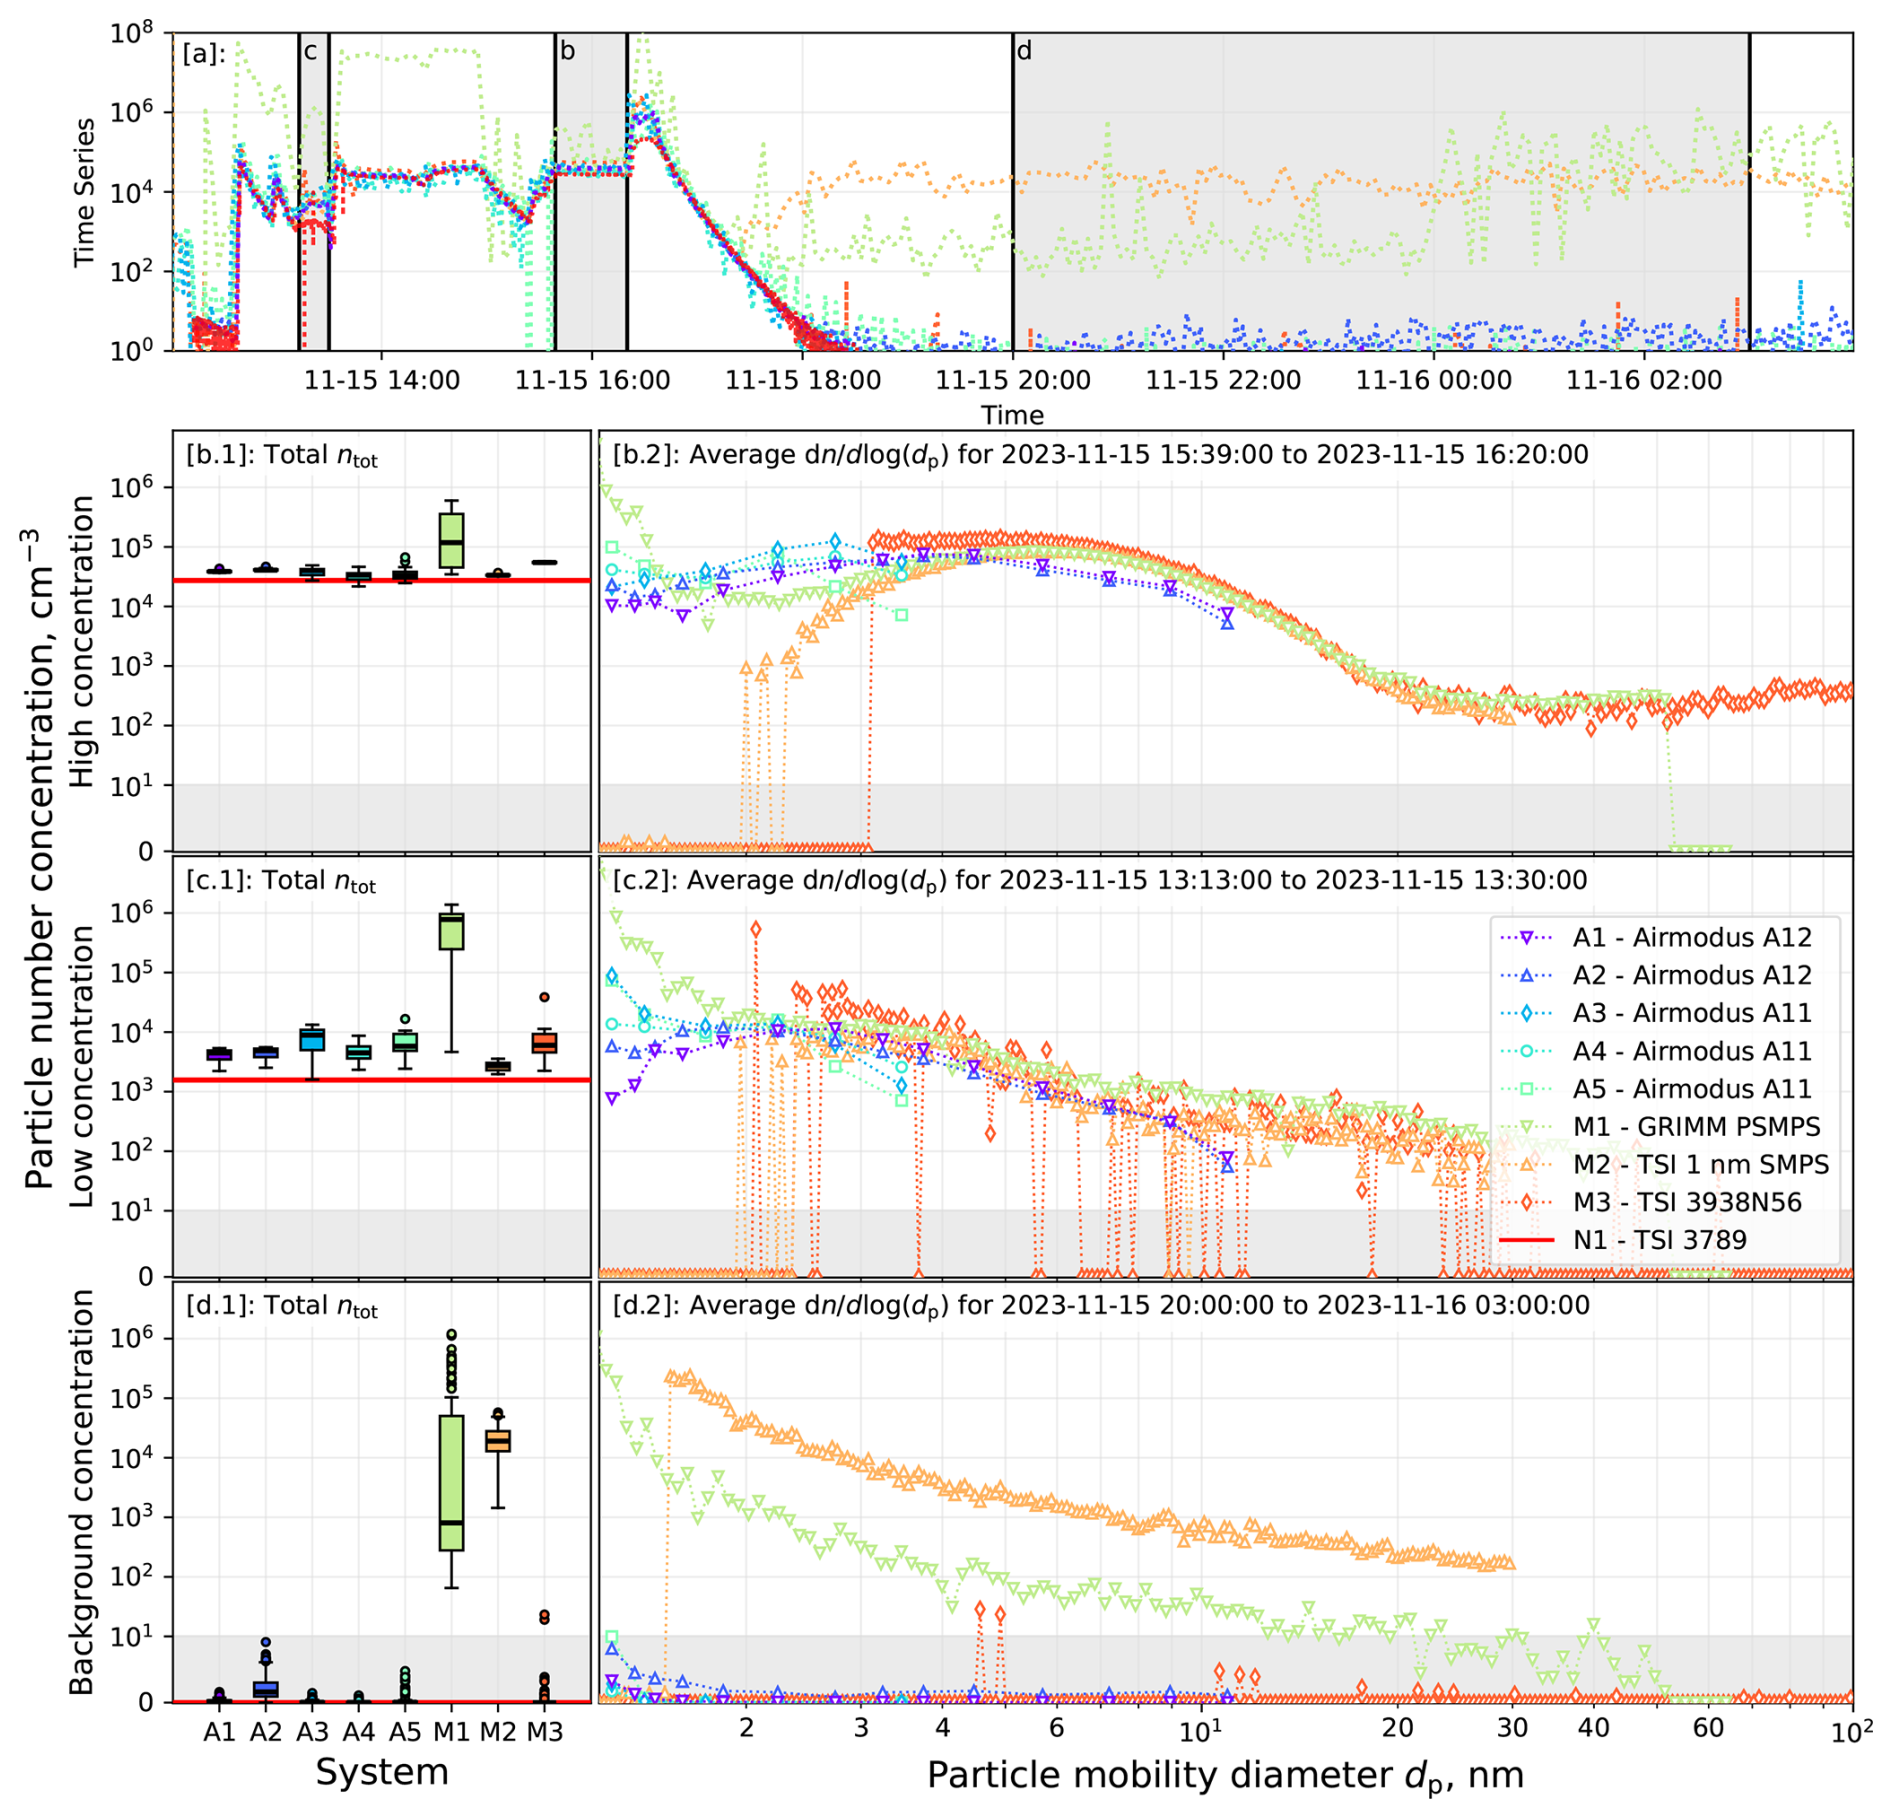
Figure 6Chamber measurement results. Panel (a) shows the time series of total particle number concentrations ntot for all systems, with grey areas indicating the periods detailed in panels (b)–(d) (high, low and background concentrations). Box plots in panels (b.1)–(d.1) show ntot from different instruments, with the red line indicating ntot,N1 measured by the TSI 3789 CPC and normalized on 0.846 (Sect. 3.2). Panels (b.2)–(d.2) show particle size distributions versus dp plotted on a logarithmic scale, with grey areas marking the linear regions of the ordinate (see Sect. 3.5 for discussion).
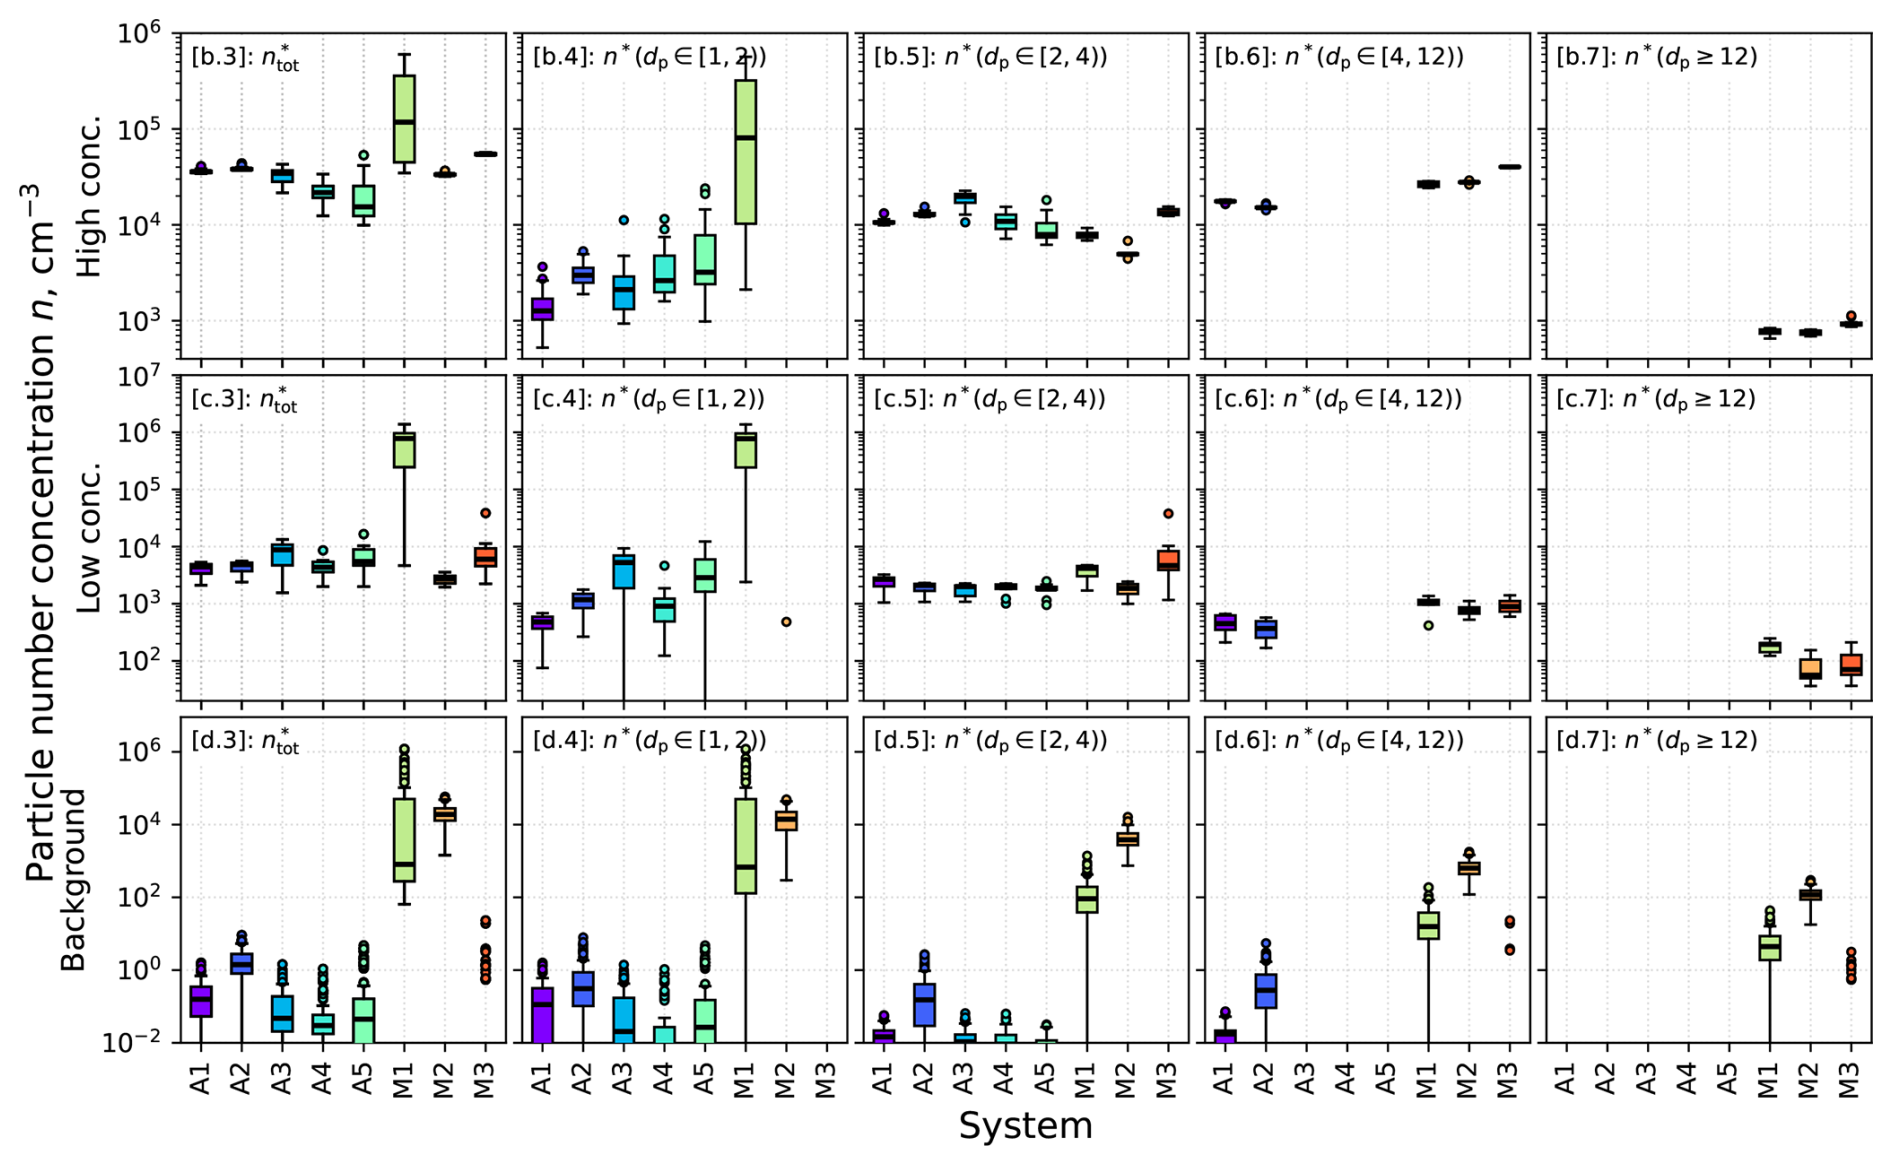
Figure 7Chamber measurement results. The column labelled (3) shows box plots of total particle concentrations for periods with high, low and background concentrations, obtained by integrating the particle size distributions while excluding particles above the instrument sizing limits. Columns labelled (4)–(7) show median concentrations in four size intervals – [1,2), [2,4), [4,12) and ≥ 12 nm – selected based on instrument detection limits to provide detail on sub-10 nm particles (see Sect. 3.5 for discussion).
Additionally, Fig. 7 provides a more detailed breakdown of the different concentration regimes investigated – high, low and background particle concentrations. In this figure, the column labelled [3] shows box plots of total particle concentrations resulting from an integration of the particle number size distributions within the time frames indicated by Fig. 6a. That is, while the activation-based systems are perfectly capable of reporting total number concentrations above their upper sizing limits (∼ 4 nm for the Airmodus A11 and ∼ 12 nm for the Airmodus A12), these number are not accounted for in but are reflected in ntot, as found in Fig. 6b.1–d.1.
The time series in Fig. 6a shows a generally good agreement in total particle concentrations across all instruments. However, slight anomalies were observed for three systems: the TSI 3789 CPC (N1) reference, the GRIMM PSMPS (M1) and the TSI 1 nm SMPS (M2). The TSI 3789 CPC (N1) reported lower total concentrations than the other instruments during both high and low particle concentration phases (Fig. 6b and c). This discrepancy is primarily attributable to its larger cutoff diameter d50, which limits its ability to detect particles smaller than approximately 1.9 nm. The GRIMM PSMPS (M1) occasionally exhibited elevated particle concentrations due to the ion background correction, which is necessary due to PSMPS being sensitive to ions generated by the Ni-63 aerosol neutralizer. Since these ions are not associated with the aerosol under investigation, an appropriate background subtraction must be applied to account for their influence on the measured signal (Patra et al., 2024a, b). The procedure involves recording a time-averaged particle number size distribution of neutralizer ions prior to actual measurements, which is then subtracted from the measured data. However, this method is susceptible to significant fluctuations in ion concentrations, which can lead to increased noise levels and the subsequent activation of internal loss correction functions – as observed during the background concentration measurements (Fig. 6d). Elevated background noise was also observed for the third instrument, the TSI 1 nm SMPS (M2), during the chamber background measurements. For this instrument, the internal loss correction likely became significant due to elevated noise levels, presumably caused by the undesired condensation of working fluid inside the instrument.
As can be seen in Fig. 6b, at relatively high total particle number concentrations (ntot,N1 > 2 × 104 cm−3, according to the TSI 3789 (N1)), representative for intense NPF events or for heavily polluted environments, the mobility-based systems (M1–M3) demonstrated good agreement in their estimates of the distributions' mode location and overall particle number size distributions above 7 nm. Below this, the TSI 3938N56 (M3) exhibited increasingly higher particle number concentrations compared to the GRIMM PSMPS (M1) and the TSI 1 nm SMPS (M2). Below 4 nm, indications of divergence in the particle number size distributions was observed among all these systems. The activation-based systems showed rather good agreement, particularly above 3 nm. Exceptions were noted for the A1 and A3 system. The latter showed elevated concentrations in the 2–3 nm range compared to the other activation-based systems, possibly connected to the replaced saturator module (as described before). In contrast, the A1 system displayed slightly lower concentrations below 2.2 nm. Below 1.6 nm, all systems showed increased inter-instrumental variability, with an upward trend in particle concentrations with decreasing particle number size dp. Notably, while the TSI 1 nm SMPS (M2) exhibited a gradual, Gaussian-like decay before dropping to zero below ∼ 2 nm, the TSI 3938N56 (M3) showed an abrupt drop to zero concentrations just below ∼ 3 nm. This behaviour can be explained by a combination of the instruments' different cutoff sizes and concentrations dropping below their threshold of detectable levels. Compared to the common mode of the mobility-based systems (M1–M3), located at around 4.5 to 6 nm, the modes detected by the activation-based instruments (A1–A5) appeared shifted towards smaller sizes, with the modes of the Airmodus A11 systems (A3–A5) ranging between 2 and 3 nm and the modes of the Airmodus A12 (A1–A2) ranging between 3.5 and 4.5 nm. The difference between the two categories of systems might be attributable to the different sizing principle and to the mobility-based instruments' lack of sensitivity in the sub-3 nm size range.
At low total particle concentrations (ntot,N1 ≈ 2 × 103 cm−3; see Figs. 6 and 7c), typical for atmospheric conditions in rural and moderately polluted urban environments, the activation-based systems (A1–A5) agreed rather well, above ca. 1.8 nm, while larger variations were observed below that. All of them exhibited pronounced maxima between 1.7 and 2.8 nm, with only minor variation in mode locations across instruments. In contrast, the mobility-based systems (M1–M3) displayed distributions resembling exponential decay. An exception is the TSI 1 nm SMPS (M2) below 3 nm, which, due to strong noise levels, appears increasingly undefined with decreasing particle size dp. While the overall shapes of the mobility-based systems’ distributions above 2 nm agreed reasonably well with one another and with those of the activation-based systems, the deviations below that size range behave in a similar manner than those observed for high particle concentrations. Notably, the TSI 1 nm SMPS (M2) and the TSI 3938N56 (M3) effectively recorded zero concentrations below approximately 2 and 2.5 nm, respectively.
Figure 6d illustrates overnight background measurements (ntot,N1 ≈ 0 cm−3), during which no aerosol was introduced into the chamber. Under these conditions, none of the examined systems detected a distinct particle mode. However, the mobility-based systems (M1–M3) – especially the GRIMM PSMPS (M1) and the TSI 1 nm SMPS (M2) – exhibited elevated baselines and artefacts resembling the shape of their internal correction functions. Importantly, these apparent concentrations do not represent real particles in the chamber but arise from instrument-internal correction procedures applied to very low or noisy signals. These corrections, designed to compensate for diffusional losses, are continuously applied to all measured signals. When concentrations approach zero, statistical noise in individual size bins can become comparable to or even larger than the actual signal itself. The subsequent application of size-dependent loss correction factors may then amplify this noise, leading to artificially elevated and smooth size distributions. As discussed previously, for the TSI 1 nm SMPS (M2), this elevated baseline originates from internal signal fluctuations caused by unwanted homogeneous nucleation of DEG remainders inside the Nano Enhancer, which constitutes the pre-growth stage of the system. Such nucleation events generate spurious counts that are then further modified by the instrument's internal correction algorithm. This interpretation is supported by the observation that the signal noise noticeably decreased after cleaning the Nano Enhancer of residual DEG. In contrast, the GRIMM PSMPS (M1) shows a baseline shape consistent with its ion-induced background correction method. For this instrument, the subtraction of an averaged pre-measured ion background can lead to residual artefacts, especially if ion concentrations fluctuate during the actual measurement. In combination with the applied loss corrections, this resulted in apparent particle concentrations even for the particle-free chamber; it is not indicative of this system malfunctioning but rather reflects the limitations of background corrections to signals dominated by noise. The activation-based instruments recorded very low background counts, with concentrations < 10 cm−3 for A2 and A5, and < 1 cm−3 for other instruments in the sub-2 nm size range.
In this article, we provided a comprehensive overview of the first ACTRIS workshop on the intercomparison of instrumentation optimized for measuring sub-10 nm aerosol particle size distributions, held in November 2023 at the ACTRIS Cluster Calibration Center (CCC) in Helsinki, Finland. The workshop brought together a variety of particle measurement systems, as well as calibration setups and procedures, allowing for a detailed analysis not only of instrument performance but also of the methodologies used to evaluate them.
We conclude that all the instrument cutoff sizes, determined for size-selected NiCr particles during the workshop, were close to or even slightly lower than the cutoff sizes reported by the instrument manufacturers. The mobility-based systems, such as the GRIMM PSMS, the TSI 1 nm SMPS and the TSI 3938N56, exhibit highly accurate sizing capabilities, especially for particle sizes above 2 nm. However, the chamber experiments with polydisperse WOx aerosol revealed that at particle concentrations representative of typical atmospheric conditions in rural or moderately polluted urban environments (∼ 2 × 103 cm−3), the GRIMM system showed increased susceptibility to noise and artefacts below 2 nm, while the TSI systems were generally unable to detect particles below 2 nm under these conditions. In contrast, the activation-based systems – namely the Airmodus A11 and A12 – displayed more unit-to-unit variability, likely due to the data inversion process used by these instruments, but demonstrated higher sensitivity in detecting particles at low concentrations, particularly below 2 nm. At concentrations typical for intense new particle formation events or in heavily polluted environments (∼ 5 × 104 cm−3), all tested instruments showed good overall agreement in terms of particle concentrations and size distributions within their overlapping size ranges. In general, we find better agreement between the instruments at larger sizes (particularly > 4 nm) and at higher concentrations.
A major source of uncertainties in the verification measurements observed during the workshop was a systematic particle size shift induced by the 4-way-cross glowing wire generator used to produce test particles. This shift most likely results from insufficient cooling of the aerosol before size selection and highlights the limitations of this generator type for accurate calibrations. Based on these findings, we recommend using an alternative particle source for future measurements and verifying the selected size with another instrument. We also advocate for the inclusion of chamber measurements as a standard component of intercomparison procedures. These offer a significantly higher degree of control and reproducibility compared to outdoor measurements, and could be used to produce calibration particles that better resemble atmospheric aerosols and to systematically investigate the effects of particle chemical composition. In addition, future experimental designs should consider particle charging state effects on instrument performance and comparability, explore blind measurement protocols as demonstrated by DeMott et al. (2018) and explicitly account for potential uncertainties arising from inversion methods.
While significant progress has been made in the instrumentation for measuring sub-10 nm particles, our results highlight the importance of refining and standardizing both the calibration processes and measurement methodologies for achieving comparable results, especially at ambient conditions. Continued advancements in these areas are essential for improving the reliability and comparability of measurements within this critical particle size range and will ultimately pave the way towards improved and harmonized environmental monitoring.
The software used for instrument operation and data acquisition is proprietary software provided by the respective instrument manufacturers and cannot be distributed by the authors. Access to the software may be obtained directly from the manufacturers.
All data are available upon reasonable request from the corresponding author (herbert.hartl@helsinki.fi).
JL, SH and KL designed the study and organized the workshop. AK, HGH, GS, JL, JV, JP, LA, MG, PR, RB, SS, TC, TT and TZ designed the setup and performed the measurements. HGH and JL analysed the data. HGH, GS, JL, KL, JV, JP and SS were involved in the scientific interpretation of the results. KL, SH and TP were responsible for the financial framework. HGH wrote the paper. All authors participated in reviewing the paper.
During parts of the workshop, analysis and composition of the manuscript, Herbert G. Hartl, Joonas Vanhanen and Jonas Purén were employed by Airmodus Oy; Gerhard Steiner was employed by GRIMM Aerosol Technik GmbH; and Amine Koched, Torsten Tritscher, and Sebastian Schmitt were employed by TSI GmbH. At least one of the (co-)authors is a member of the editorial board of Aerosol Research. The peer-review process was guided by an independent editor, and the authors also have no other competing interests to declare.
Publisher's note: Copernicus Publications remains neutral with regard to jurisdictional claims made in the text, published maps, institutional affiliations, or any other geographical representation in this paper. The authors bear the ultimate responsibility for providing appropriate place names. Views expressed in the text are those of the authors and do not necessarily reflect the views of the publisher.
We acknowledge and thank Pasi Aalto, Hannu Koskenvaara, Jarkko Mäntylä and Pekka Rantala for the preparation of the setups and Sander Mirme for providing additional measurement data.
This research has been supported by the Doctoral School of Industrial Innovations (DSII), the University of Helsinki's Faculty of Science via ACTRIS-HY, Research Council of Finland ACCC Flagship funding (grant nos. 337549, 357902, 359340) and Research Council of Finland ACTRIS Central Facilities funding (grant nos. 329274, 367784), We acknowledge and thank Pasi Aalto, Hannu Koskenvaara, Jarkko Mäntylä and Pekka Rantala for the preparation of the setups and Sander Mirme for providing additional measurement data.
This paper was edited by Jicheng Feng and reviewed by three anonymous referees.
Asmi, E., Sipilä, M., Manninen, H. E., Vanhanen, J., Lehtipalo, K., Gagné, S., Neitola, K., Mirme, A., Mirme, S., Tamm, E., Uin, J., Komsaare, K., Attoui, M., and Kulmala, M.: Results of the first air ion spectrometer calibration and intercomparison workshop, Atmos. Chem. Phys., 9, 141–154, https://doi.org/10.5194/acp-9-141-2009, 2009. a
Cai, R., Yang, D., Ahonen, L. R., Shi, L., Korhonen, F., Ma, Y., Hao, J., Petäjä, T., Zheng, J., Kangasluoma, J., and Jiang, J.: Data inversion methods to determine sub-3 nm aerosol size distributions using the particle size magnifier, Atmos. Meas. Tech., 11, 4477–4491, https://doi.org/10.5194/amt-11-4477-2018, 2018. a
Canagaratna, M. R., Jayne, J. T., Jimenez, J. L., Allan, J. D., Alfarra, M. R., Zhang, Q., Onasch, T. B., Drewnick, F., Coe, H., Middlebrook, A., Delia, A., Williams, L. R., Trimborn, A. M., Northway, M. J., DeCarlo, P. F., Kolb, C. E., Davidovits, P., and Worsnop, D. R.: Chemical and Microphysical Characterization of Ambient Aerosols with the Aerodyne Aerosol Mass Spectrometer, Mass Spectrom. Rev., 26, 185–222, https://doi.org/10.1002/mas.20115, 2007. a
Chen, D.-R., Pui, D. Y. H., Hummes, D., Fissan, H., Quant, F. R., and Sem, G. J.: Design and evaluation of a nanometer aerosol differential mobility analyzer (Nano-DMA), J. Aerosol Sci., 29, 497–509, https://doi.org/10.1016/S0021-8502(97)10018-0, 1998. a
Collins, A. M., Dick, W. D., and Romay, F. J.: A New Coincidence Correction Method for Condensation Particle Counters, Aerosol Sci. Tech., 47, 177–182, https://doi.org/10.1080/02786826.2012.737049, 2012. a, b
DeMott, P. J., Möhler, O., Cziczo, D. J., Hiranuma, N., Petters, M. D., Petters, S. S., Belosi, F., Bingemer, H. G., Brooks, S. D., Budke, C., Burkert-Kohn, M., Collier, K. N., Danielczok, A., Eppers, O., Felgitsch, L., Garimella, S., Grothe, H., Herenz, P., Hill, T. C. J., Höhler, K., Kanji, Z. A., Kiselev, A., Koop, T., Kristensen, T. B., Krüger, K., Kulkarni, G., Levin, E. J. T., Murray, B. J., Nicosia, A., O'Sullivan, D., Peckhaus, A., Polen, M. J., Price, H. C., Reicher, N., Rothenberg, D. A., Rudich, Y., Santachiara, G., Schiebel, T., Schrod, J., Seifried, T. M., Stratmann, F., Sullivan, R. C., Suski, K. J., Szakáll, M., Taylor, H. P., Ullrich, R., Vergara-Temprado, J., Wagner, R., Whale, T. F., Weber, D., Welti, A., Wilson, T. W., Wolf, M. J., and Zenker, J.: The Fifth International Workshop on Ice Nucleation phase 2 (FIN-02): laboratory intercomparison of ice nucleation measurements, Atmos. Meas. Tech., 11, 6231–6257, https://doi.org/10.5194/amt-11-6231-2018, 2018. a
Fernández de la Mora, J. and Kozlowski, J.: Hand-held differential mobility analyzers of high resolution for 1–30 nm particles: Design and fabrication considerations, J. Aerosol Sci., 57, 45–53, https://doi.org/10.1016/j.jaerosci.2012.10.009, 2013. a
Flagan, R. C.: On Differential Mobility Analyzer Resolution, Aerosol Sci. Tech., 30, 556–570, https://doi.org/10.1080/027868299304417, 1999. a
Gagné, S., Lehtipalo, K., Manninen, H. E., Nieminen, T., Schobesberger, S., Franchin, A., Yli-Juuti, T., Boulon, J., Sonntag, A., Mirme, S., Mirme, A., Hõrrak, U., Petäjä, T., Asmi, E., and Kulmala, M.: Intercomparison of air ion spectrometers: an evaluation of results in varying conditions, Atmos. Meas. Tech., 4, 805–822, https://doi.org/10.5194/amt-4-805-2011, 2011. a
Ibald-Mulli, A., Wichmann, H.-E., Kreyling, W., and Peters, A.: Epidemiological Evidence on Health Effects of Ultrafine Particles, J. Aerosol Med. Pulm. D., 15, 189–201, https://doi.org/10.1089/089426802320282310, 2002. a, b
Ingham, D. B.: Diffusion of aerosols from a stream flowing through a cylindrical tube, J. Aerosol Sci., 6, 125–132, https://doi.org/10.1016/0021-8502(75)90005-1, 1975. a, b, c, d
IPCC (Intergovernmental Panel on Climate Change): The Earth's Energy Budget, Climate Feedbacks and Climate Sensitivity, Cambridge University Press, 923–1054, https://doi.org/10.1017/9781009157896.009, 2021. a, b
ISO27891: Aerosol particle number concentration – Calibration of condensation particle counters, https://www.iso.org/standard/44414.html (last access: 23 February 2026), 2015. a
Jiang, J., Attoui, M., Heim, M., Brunelli, N. A., McMurry, P. H., Kasper, G., Flagan, R. C. F., Giapis, K., and Mouret, G. M.: Transfer Functions and Penetrations of Five Differential Mobility Analyzers for Sub-2 nm Particle Classification, Aerosol Sci. Tech., 45, 480–492, https://doi.org/10.1080/02786826.2010.546819, 2011a. a
Jiang, J., Chen, M., Kai, C., Attoui, M., and McMurry, P. H.: Electrical Mobility Spectrometer Using a Diethylene Glycol Condensation Particle Counter for Measurement of Aerosol Size Distributions Down to 1 nm, Aerosol Sci. Tech., 45, 510–521, https://doi.org/10.1080/02786826.2010.547538, 2011b. a
Kangasluoma, J., Kuang, C., Wimmer, D., Rissanen, M. P., Lehtipalo, K., Ehn, M., Worsnop, D. R., Wang, J., Kulmala, M., and Petäjä, T.: Sub-3 nm particle size and composition dependent response of a nano-CPC battery, Atmos. Meas. Tech., 7, 689–700, https://doi.org/10.5194/amt-7-689-2014, 2014. a, b
Kangasluoma, J., Samodurov, A., Attoui, M., Franchin, A., Junninen, H., Korhonen, F., Kurtén, T., Vehkamaki, H., Sipilä, M., Lehtipalo, K., Worsnop, D., Petäjä, T., and Kulmala, M.: Heterogeneous Nucleation Onto Ions and Neutralized Ions - Insights Into Sign-Preference, J. Phys. Chem. C, 120, https://doi.org/10.1021/acs.jpcc.6b01779, 2016. a
Kangasluoma, J., Cai, R., Jiang, J., Deng, C., Stolzenburg, D., Ahonen, L. R., Chan, T., Fu, Y., Kim, C., Laurila, T. M., Zhou, Y., Dada, L., Sulo, J., Flagan, R. C., Kulmala, M., Petäjä, T., and Lehtipalo, K.: Overview of measurements and current instrumentation for 1–10 nm aerosol particle number size distributions, J. Aerosol Sci., 148, 105584, https://doi.org/10.1016/j.jaerosci.2020.105584, 2020. a, b, c, d
Kerminen, V.-M., Chen, X., Vakkari, V., Petäjä, T., Kulmala, M., and Bianchi, F.: Atmospheric new particle formation and growth: review of field observations, Environ. Res. Lett., 13, 103003, https://doi.org/10.1088/1748-9326/aadf3c, 2018. a
Knutson, E. O. and Whitby, K. T.: Aerosol classification by electric mobility: apparatus, theory, and applications, J. Aerosol Sci., 6, 443–451, https://doi.org/10.1016/0021-8502(75)90060-9, 1975. a, b
Kogan, Y. I. and Burnasheva, Z. A.: Growth and measurement of condensation nuclei in a continous stream, Russ. J. Phys. Ch., 34, 2630–2639, 1960. a
Kulmala, M., Kontkanen, J., Junninen, H., Lehtipalo, K., Manninen, H. E., Nieminen, T., Petäjä, T., Sipilä, M., Schobesberger, S., Rantala, P., Franchin, A., Jokinen, T., Järvinen, E., Äijälä, M., Kangasluoma, J., Hakala, J., Aalto, P. P., Paasonen, P., Mikkilä, J., Vanhanen, J., Aalto, J., Hakola, H., Makkonen, U., Ruuskanen, T., Mauldin, R. L., Duplissy, J., Vehkamäki, H., Bäck, J., Kortelainen, A., Riipinen, I., Kurtén, T., Johnston, M. V., Smith, J. N., Ehn, M., Mentel, T. F., Lehtinen, K. E. J., Laaksonen, A., Kerminen, V.-M., and Worsnop, D. R.: Direct Observations of Atmospheric Aerosol Nucleation, Science, 339, 943–946, https://doi.org/10.1126/science.1227385, 2013. a, b
Laj, P., Myhre, C. L., Riffault, V., Amiridis, V., Fuchs, H., Eleftheriadis, K., Petäjä, T., Salameh, T., Kivekäs, N., Juurola, E., Saponaro, G., Philippin, S., Cornacchia, C., Arboledas, L. A., Baars, H., Claude, A., Mazière, M. D., Dils, B., Dufresne, M., Evangeliou, N., Favez, O., Fiebig, M., Haeffelin, M., Herrmann, H., Höhler, K., Illmann, N., Kreuter, A., Ludewig, E., Marinou, E., Möhler, O., Mona, L., Murberg, L. E., Nicolae, D., Novelli, A., O’Connor, E., Ohneiser, K., Altieri, R. M. P., Picquet-Varrault, B., van Pinxteren, D., Pospichal, B., Putud, J.-P., Reimann, S., Siomos, N., Stachlewska, I., Tillmann, R., Voudouri, K. A., Wandinger, U., Wiedensohler, A., Apituley, A., Comerón, A., Gysel-Beer, M., Mihalopoulos, N., Nikolova, N., Pietruczuk, A., Sauvage, S., Sciare, J., Skov, H., Svendby, T., Swietlicki, E., Tonev, D., Vaughan, G., Zdimal, V., Baltensperger, U., Doussin, J.-F., Kulmala, M., Pappalardo, G., Sundet, S. S., and Vana, M.: Aerosol, Clouds and Trace Gases Research Infrastructure (ACTRIS): The European Research Infrastructure Supporting Atmospheric Science, B. Am. Meteorol. Soc., 105, E1098– E1136, https://doi.org/10.1175/BAMS-D-23-0064.1, 2024. a
Lehtipalo, K., Kontkanen, J., Kangasluoma, J., Franchin, A., Wimmer, D., Schobesberger, S., Junninen, H., Petäjä, T., Sipilä, M., Worsnop, D., Kulmala, M., Mikkilä, J., Vanhanen, J., and Leppä, J.: Methods for determining particle size distribution and growth rates between 1 and 3 nm using the Particle Size Magnifier, Boreal Environ. Res., 19, 215–236, 2014. a, b, c
McMurry, P. H.: The History of Condensation Nucleus Counters, Aerosol Sci. Tech., 33, 297–322, https://doi.org/10.1080/02786820050121512, 2000. a
Mirme, A., Tamm, E., Mordas, G., Vana, M., Uin, J., Mirme, S., Bernotas, T., Laakso, L., Hirsikko, A., and Kulmala, M.: A wide-range multi-channel air ion spectrometer, Boreal Environ. Res., 12, 247–264, 2007. a
Mirme, S. and Mirme, A.: The mathematical principles and design of the NAIS – a spectrometer for the measurement of cluster ion and nanometer aerosol size distributions, Atmos. Meas. Tech., 6, 1061–1071, https://doi.org/10.5194/amt-6-1061-2013, 2013. a
Oberdörster, G., Oberdörster, E., and Oberdörster, J.: Nanotoxicology: An Emerging Discipline Evolving from Studies of Ultrafine Particles, Environ. Health Persp., 113, 823–839, https://doi.org/10.1289/ehp.7339, 2005. a
Patra, S. S., Jiang, J., Ding, X., Huang, C., Reidy, E. K., Kumar, V., Price, P., Keech, C., Steiner, G., Stevens, P., Jung, N., and Boor, B. E.: Dynamics of nanocluster aerosol in the indoor atmosphere during gas cooking, PNAS Nexus, 3, pgae044, https://doi.org/10.1093/pnasnexus/pgae044, 2024a. a
Patra, S. S., Liu, J., Jiang, J., Ding, X., Huang, C., Keech, C., Steiner, G., Stevens, P. S., Jung, N., and Boor, B. E.: Rapid Nucleation and Growth of Indoor Atmospheric Nanocluster Aerosol during the Use of Scented Volatile Chemical Products in Residential Buildings, ACS ES&T Air, 1, 1276–1293, https://doi.org/10.1021/acsestair.4c00118, 2024b. a
Peineke, C., Attoui, M., and Schmidt-Ott, A.: Using a glowing wire generator for production of charged, uniformly sized nanoparticles at high concentrations, J. Aerosol Sci., 37, 1651–1661, https://doi.org/10.1016/j.jaerosci.2006.06.006, 2006. a
Perez-Lorenzo, L. J., Khanna, V., Meena, T., Schmitt, J. J., and de la Mora, J. F.: A high resolution DMA covering the 1–67 nm size range, Aerosol Sci. Tech., 54, 128–142, https://doi.org/10.1080/02786826.2019.1684433, 2020. a
Peters, A., Wichmann, H. E., Tuch, T., and Heyder, J.: Respiratory Effects are associated with the Number of Ultrafine Particles, Am. J. Resp. Crit. Care, 155, 1376–1383, https://doi.org/10.1164/ajrccm.155.4.9105082, 1997. a, b
Pruppacher, H. R. and Klett, J. D.: Microphysics of Clouds and Precipitation, Springer Dordrecht, 1st edn., https://doi.org/10.1007/978-94-009-9905-3, ISBN 978-90-277-1106-9, 1980. a
Steiner, G., Jokinen, T., Junninen, H., Sipilä, M., Petäjä, T., Worsnop, D., Reischl, G. P., and Kulmala, M.: High-Resolution Mobility and Mass Spectrometry of Negative Ions Produced in a 241Am Aerosol Charger, Aerosol Sci. Tech., 48, 261–270, https://doi.org/10.1080/02786826.2013.870327, 2014. a
Stolzenburg, M.: An Ultrafine Aerosol Size Distribution System, PhD thesis, 1988. a
Stolzenburg, M. R. and McMurry, P. H.: An Ultrafine Aerosol Condensation Nucleus Counter, Aerosol Sci. Tech., 14, 48–65, https://doi.org/10.1080/02786829108959470, 1991. a, b
Sulo, J., Enroth, J., Pajunoja, A., Vanhanen, J., Lehtipalo, K., Petäjä, T., and Kulmala, M.: Pushing nano-aerosol measurements towards a new decade – technical note on the Airmodus particle size magnifier 2.0, Aerosol Research, 2, 13–20, https://doi.org/10.5194/ar-2-13-2024, 2024. a, b, c
Tang, C.-L. and Seeger, S.: Measurement of sub-4 nm particle emission from FFF-3D printing with the TSI Nano Enhancer and the Airmodus Particle Size Magnifier, Aerosol Sci. Tech., 58, 644–656, https://doi.org/10.1080/02786826.2024.2320430, 2024. a
Ude, S. and Fernández de la Mora, J.: Molecular monodisperse mobility and mass standards from electrosprays of tetra-alkyl ammonium halides, J. Aerosol Sci., 36, 1224–1237, https://doi.org/10.1016/j.jaerosci.2005.02.009, 2005. a, b
Vanhanen, J., Mikkilä, J., Lehtipalo, K., Sipilä, M., Manninen, H. E., Siivola, E., Petäjä, T., and Kulmala, M.: Particle Size Magnifier for Nano-CN Detection, Aerosol Sci. Tech., 45, 533–542, https://doi.org/10.1080/02786826.2010.547889, 2011. a, b, c, d
Wiedensohler, A.: An Approximation of the Bipolar Charge Distribution for Particles in the Submicron Size Range, J. Aerosol Sci., 19, 387–389, https://doi.org/10.1016/0021-8502(88)90278-9, 1988. a, b, c, d, e
Wiedensohler, A., Birmili, W., Nowak, A., Sonntag, A., Weinhold, K., Merkel, M., Wehner, B., Tuch, T., Pfeifer, S., Fiebig, M., Fjäraa, A. M., Asmi, E., Sellegri, K., Depuy, R., Venzac, H., Villani, P., Laj, P., Aalto, P., Ogren, J. A., Swietlicki, E., Williams, P., Roldin, P., Quincey, P., Hüglin, C., Fierz-Schmidhauser, R., Gysel, M., Weingartner, E., Riccobono, F., Santos, S., Grüning, C., Faloon, K., Beddows, D., Harrison, R., Monahan, C., Jennings, S. G., O'Dowd, C. D., Marinoni, A., Horn, H.-G., Keck, L., Jiang, J., Scheckman, J., McMurry, P. H., Deng, Z., Zhao, C. S., Moerman, M., Henzing, B., de Leeuw, G., Löschau, G., and Bastian, S.: Mobility particle size spectrometers: harmonization of technical standards and data structure to facilitate high quality long-term observations of atmospheric particle number size distributions, Atmos. Meas. Tech., 5, 657–685, https://doi.org/10.5194/amt-5-657-2012, 2012. a, b
Winkler, P. M., Steiner, G., Vrtala, A., Vehkamäki, H., Noppel, M., Lehtinen, K. E. J., Reischl, G. P., Wagner, P. E., and Kulmala, M.: Heterogeneous Nucleation Experiments Bridging the Scale from Molecular Ion Clusters to Nanoparticles, Science, 319, 1374–1377, https://doi.org/10.1126/science.1149034, 2008. a, b
Winklmayr, W., Reischl, G. P., Lindner, A. O., and Berner, A.: A new electromobility spectrometer for the measurement of aerosol size distributions in the size range from 1 to 1000 nm, J. Aerosol Sci., 22, 289–296, https://doi.org/10.1016/S0021-8502(05)80007-2, 1991. a
Wlasits, P. J., Stolzenburg, D., Tauber, C., Brilke, S., Schmitt, S. H., Winkler, P. M., and Wimmer, D.: Counting on chemistry: laboratory evaluation of seed-material-dependent detection efficiencies of ultrafine condensation particle counters, Atmos. Meas. Tech., 13, 3787–3798, https://doi.org/10.5194/amt-13-3787-2020, 2020. a, b