the Creative Commons Attribution 4.0 License.
the Creative Commons Attribution 4.0 License.
 | 01 Apr 2026
Characterizing aerosol sources based on aerosol optical properties and dispersion modelling in a Scandinavian Coastal Area (Aarhus, Denmark)
Zihui Teng
Jane Tygesen Skønager
Andreas Massling
Henrik Skov
Nikolaos Evangeliou
Sabine Eckhardt
Merete Bilde
Bernadette Rosati
Coastal aerosols are formed through the complex mixing between marine air masses and continental emissions, which originate from both natural and anthropogenic sources. The properties of coastal aerosols are decisive for their interaction with sunlight and their influence on clouds, as well as the potential health implications for the population in these areas. In this study, the aerosol properties and sources at Aarhus Bay, Denmark, were investigated by combining in situ aerosol light scattering and absorption with size distribution measurements and footprint analysis by FLEXPART. Our analysis demonstrates a considerable contribution of anthropogenic aerosols from both fossil fuel combustion and biomass burning, as well as periods with highly scattering aerosols. Furthermore, good agreement was found between in situ and modelled black-carbon data. Combining in situ measurements and FLEXPART analysis further evidenced a major impact of local emissions, as well as a few long-range transport intrusions.
- Article
(6661 KB) - Full-text XML
-
Supplement
(2879 KB) - BibTeX
- EndNote


Atmospheric aerosols play a critical role in regional and global climate systems by scattering and absorbing solar radiation and by acting as nuclei for cloud droplets and ice crystals (Masson-Delmotte et al., 2021). Despite their importance, aerosol–radiation and aerosol–cloud interactions remain among the largest sources of uncertainty in current climate predictions (Masson-Delmotte et al., 2021). At the same time, aerosols can have negative impacts on human health (Pope and Dockery, 2006). Reducing uncertainties of aerosol climate effects and improving insights into aerosol adverse health effects require knowledge about ambient aerosol loading and properties across diverse environments. Coastal regions are particularly complex environments where marine and continental air masses interact, leading to highly variable aerosol chemical composition and physical properties (Lewis and Schwartz, 2004). Coastal air masses are influenced by both anthropogenic and natural sources, including contributions from sea spray, shipping, urban outflow, and biogenic activity. Importantly, coastal zones are home to a large fraction of the global population as approximately 40 % of people live within 100 km of a coastline (Cosby et al., 2024). This highlights the importance of understanding aerosol characteristics in these regions for air quality and human health purposes.
The interaction of aerosol particles and solar radiation depends on particle size, shape, and chemical composition, as well as the incident wavelengths (Bohren and Huffman, 2008). These are determined by the aerosols' sources and how they have been processed in the atmosphere. In situ measurements of scattering and absorption coefficients and derived quantities like single-scattering albedo and Ångström exponents provide a direct way to probe these characteristics (Cazorla et al., 2013; Cappa et al., 2016; Dubovik et al., 2002). The wavelength dependence of the optical parameters allows us to distinguish between particle types such as dust, black carbon (BC), and brown carbon (BrC). Coupling these measurements with auxiliary in situ data, such as particle size distributions, and air mass back trajectories further constrains source regions, thereby enhancing our ability to trace observed aerosol variability back to particular emission sources and transport pathways.
Several long-term atmospheric monitoring stations have provided valuable insights into aerosol behaviour in coastal and marine-influenced environments. Sites such as Mace Head (Ireland), Finokalia (Greece), and the Cape Verde Atmospheric Observatory have contributed to decades worth of in situ data on aerosol optical, chemical, and microphysical properties (e.g. Dall'Osto et al., 2010; Kalivitis et al., 2019; Fomba et al., 2014). While aerosol optical properties have been widely studied using remote sensing techniques (e.g. Zhang et al., 2025), only a handful of shorter field campaigns have examined the scattering and absorption potential of ambient aerosols, particularly in Scandinavia (Ahlberg et al., 2023; Martinsson et al., 2014; Mogo et al., 2012), and only a few targeted coastal aerosols (Mogo et al., 2012; Clarke et al., 2003; Donateo et al., 2020). Although Denmark has a long coastline compared to the size of the country (Worm, 1997), studies of coastal aerosols in Denmark are scarce (Vignati et al., 1999; Kivekäs et al., 2014), and none have coupled aerosol optical properties with size distribution measurements and trajectory modelling, limiting our understanding of source attribution and radiative impacts in these settings.
In this study, we measured and analysed the absorption and scattering potential, as well as the number and surface size distributions, of aerosols measured at a coastal site in Denmark during a 40 d field campaign in spring 2023. Our site was located near Aarhus, at the Kattegat coast of Jutland in Denmark, offering a unique environment to study the properties of coastal aerosols. Depending on wind direction and synoptic conditions, this site can be influenced by marine air masses from the North Sea or the Baltic Sea and long-range-transported aerosols from continental Europe and Asia, as well as local influences such as emissions from nearby shipping lanes and urban outflow from the city of Aarhus.
The wavelength dependence of these optical parameters, combined with number and surface size distribution data, was used to assess aerosol types and sources. To further investigate source regions and particle age, we employed the Lagrangian particle dispersion model FLEXPART to simulate air mass histories. Within specific case studies, we highlight the variability in aerosol loading and composition. The results contribute to a more detailed understanding of aerosol sources and their characteristics in coastal Denmark.
2.1 Measurement site
The measurements were carried out in Aarhus (56.13° N, 10.22° E) from 3 March to 11 April 2023. Aarhus is a coastal city, the second largest city in Denmark, and has approximately 360 000 inhabitants and an area of 468 km2. As shown in Fig. 1, the instruments were placed in the house of a Kayak club (“Kajakklubben Viking”), located on a beach along the southeastern coastline of Aarhus. The coastline is bordered by a forest area, including a deer park, which is a habitat for a herd of deer and other wildlife. Outside the forest, there are main roads, residential houses, and agricultural fields (to the southwest). In addition, Aarhus Port, one of Denmark's largest container ports, is at a distance of 3.83 km from the sampling site (to the north). Thus, the measurement site is potentially influenced by clean marine, forest, and anthropogenic emissions from residential activities, as well as traffic both from the continent (i.e. vehicles) and the sea (marine shipping).
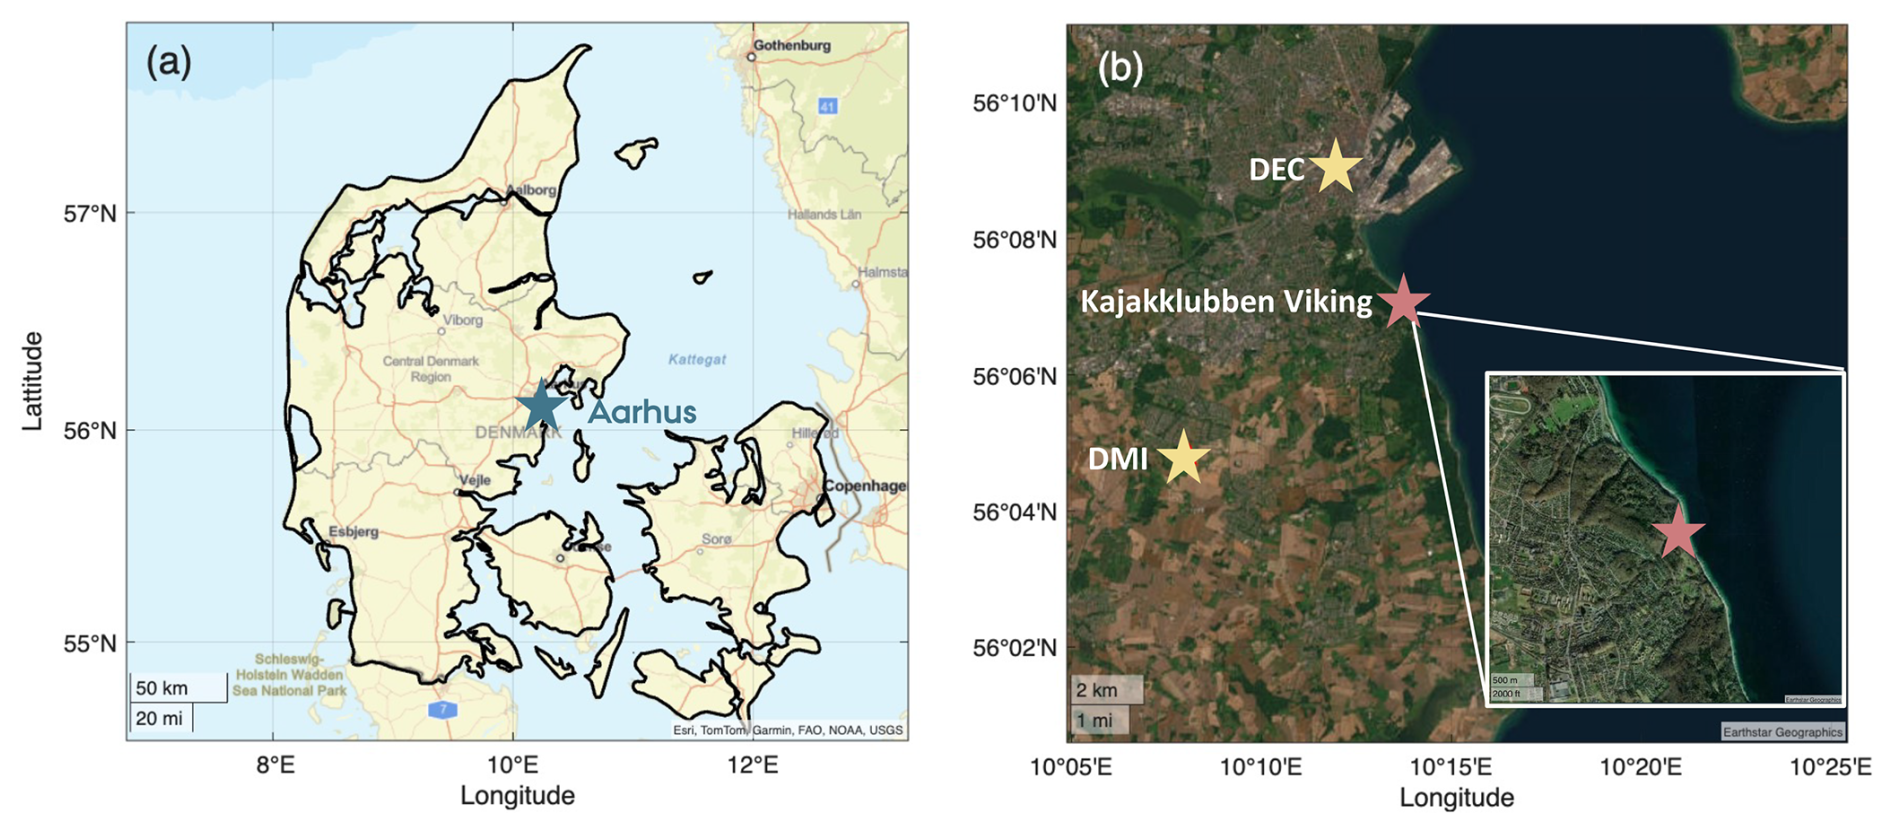
Figure 1Map of (a) Aarhus (basemap sources: Esri, TomTom, Garmin, FAO, NOAA, USGS | Powered by Esri) and (b) sampling sites (basemap provided by Earthstar Geographics). In panel (b), Kajakklubben Viking is marked with a red star, and DMI and DCE stations providing meteorological and air quality data are marked with yellow stars. This figure was produced using MATLAB version 9.14 (R2023a) (Matlab, 2021).
Wind, radiation, and relative humidity (RH) data were obtained from the Danish Meteorological Institute (DMI). The closest DMI measurement site is located in the south of Aarhus (56.1° N, 10.23° E), 7 km from the Kayak Club. PM10 (particulate matter with a diameter of less than 10 µm), nitrous oxide (NOx), and carbon monoxide (CO) were monitored by the Danish Center for Environment and Energy (DCE), from a station about 5 km from the Kayak Club, located at Banegårdsgade (56.15° N, 10.20° E), close to the railway station characterized by heavy traffic (Nordstrøm et al., 2024).
2.2 Instrumentation
A nephelometer (Aurora 3000, Ecotech), an aethalometer (AE33, Aerosol Magee Scientific), and a white-light optical particle spectrometer (Welas® 2300, PROMO 3000, PALAS) were used to obtain the scattering and absorption coefficients, as well as the number and surface particle size distributions of the aerosols. The three instruments were placed inside “Kajakklubben Viking” and shared a stainless steel inlet via a three-way splitter to separate the airflow. The inlet was installed through the wall, parallel to the ground, at a height of around 4 m above the beach. A steel net covered the end of the inlet to prevent droplets and bugs from entering the inlet. The sampled air was dried due to the temperature difference between outdoors and inside, where the instruments were located. No additional dryer was employed. A schematic is presented in Fig. S1 in the Supplement.
The nephelometer measured the integrating intensity of total light scattering and backscattering from aerosols and gas molecules at three wavelengths (λ = 450, 525, and 635 nm), with a resolution of 1 min. The data were corrected for angular truncation errors using the “no-cut” correction according to Müller et al. (2011). The nephelometer operated at a flow rate of 5.0 L min−1. Both total scattering (angles between 10 and 171°) and backscattering (angles between 90 to 171°) were measured. A full calibration, including zero measurement and span gas calibration with carbon dioxide (CO2) (99.9 % purity), was performed prior to and after the measurements. As the results coincided within the measurement uncertainty, no additional correction was applied. The nephelometer was equipped with an RH sensor in the measurement cell and two temperature sensors, one in the inlet and the other one in the measurement cell.
The aethalometer measured the attenuation of light through a filter tape progressively loaded with atmospheric aerosol particles, providing a “filter-light-attenuated signal” at seven wavelengths (λ = 370, 470, 520, 590, 660, 880, and 950 nm) at 1 min time resolution and a flow rate of 5 L min−1 (Drinovec et al., 2015). The absorption coefficients were calculated using Eq. (1) by its relation to the equivalent black-carbon (eBC) mass concentrations, where MAC is the mass absorption cross-section (Hansen et al., 1984):
MAC values for the different wavelengths were used as suggested in the manual (e.g. MAC = 7.77 m2 g−1 for λ = 880 nm). This value at 880 nm was previously employed for aerosols measured in southern Sweden (Ahlberg et al., 2023). Black-carbon source apportionment, to subdivide the fractions from fossil fuel combustion and biomass burning, was performed according to Sandradewi et al. (2008), where the portion from biomass burning is referred to as BB%. This model is based on the assumption that the absorption signal is due to only two absorbing aerosol ensembles, one with a low wavelength dependence (fossil fuel combustion aerosols) and one with a high wavelength dependence (biomass burning aerosols), and that no other types of aerosols influence the absorption signal. A detailed explanation of how these sources can be subdivided is presented in the Supplement. There is a multiple-scattering effect caused by light scattering between the particles and the filter fibres. This depends on both the type of filter and the single-scattering albedo of the aerosol. Therefore, we followed the approach by Drinovec et al. (2015) including the single-scattering albedo of the aerosols to improve the correction factor of 1.57 for TFE-coated glass filter (M8020) tape for the aethalometer. Using a maximum value of 0.025 for the cross-sensitivity of absorption to scattering, as stated in Drinovec et al. (2015), we find that the maximum total correction factors for both scattering from the aerosol and the filter fibres were 1.76, 1.77, and 1.79 for λ = 470, 520, and 660 nm. This results in a maximum relative error of the absorption coefficients due to the scattering of the particles of up to 12.25 %, 12.99 %, and 14.47 % for λ = 470, 520, and 660 nm, respectively. This indicates that the scattering by the aerosols in our specific case did not have a significant effect on the measured absorption signal.
The white-light optical particle spectrometer WELAS was used to measure the number and surface size distributions of particles with optical diameters from approximately 0.2 to 10 µm (in PSL (polystyrene latex)-equivalent particle diameters). The presented total particle number concentrations are thus only representative for this size range, only partly capturing the nucleation and Aitken mode. A flow rate of 5 L min−1 was used. The WELAS sensors were calibrated with MonoDust 1500 as provided by PALAS prior to the measurements.
Prior to data processing, all raw data were cleaned for instances with RH above 40 % (0.78 % of the total dataset), tubing disconnection, and tape advancement of the aethalometer.
2.3 Inlet and sampling efficiency calculation
A schematic illustrating the tubing used for the inlet and instrumental setup at the measurement site is presented in Fig. S1. To assess losses of particles in the sampling probe and inlet tubing, we calculated the overall inlet efficiency as a function of particle diameter using an open-source particle loss calculator (von der Weiden et al., 2009). The calculation accounts for particle losses due to Brownian diffusion, gravitational settling, and inertial impaction in straight tubing and bends. This was done for each instrument by inputting length, diameter, angle of inclination, angle of curvature, and sample flow for each tubing piece between the instrument and the sampling inlet. For all three instruments, we found decreasing inlet efficiencies with increasing particle size. The nephelometer and aethalometer have a 50 % inlet efficiency for a particle diameter of 8 µm, whereas the WELAS has a 50 % inlet efficiency for a particle diameter of approximately 6.5 µm. We also calculated the sampling efficiency of the sampling probe at five different wind speeds: 0, 2.5, 5, 7.5, and 10 m s−1. At wind speeds of 0 and 2.5 m s−1, there is a depletion in the sampling efficiency of larger particles, whereas, at wind speeds of 7.5 and 10 m s−1, there is an enrichment in the sampling efficiencies of larger particles. Efficiency curves are presented in Fig. S2 and tubing parameter tables are presented in Tables S1–S3. The results were not used to correct the data.
2.4 Optical parameters
The single-scattering albedo (SSA), absorption Ångström exponent (AAE), scattering Ångström exponent (SAE), spectral variation of SAE (ΔSAE), backscattering ratio (b), and asymmetry parameter (g) were derived from the scattering and absorption coefficients measured by the nephelometer and aethalometer.
SSA was calculated using Eq. (2) as the ratio of the scattering coefficient (σsca) to the extinction coefficient, which is the sum of the scattering coefficient and absorption coefficient (σabs). SSA values at wavelengths (λ) of 470, 520, and 660 nm were calculated; thus, the scattering coefficients were recalculated for these three wavelengths based on a power-law fitting (Ångström, 1929).
Typical values of SSA for sea salt and sulfate aerosol are expected to be close to 1 at λ = 550 nm (Takemura et al., 2002), while fresh BC is highly absorbing and has been shown to have SSA values close to 0.3 at λ = 554 nm (Bergstrom et al., 2002).
SAE and AAE reflect the spectral variability of light scattering and absorption and were calculated using Eqs. (3) and (4). SAE was calculated for the nephelometer wavelength pair (450 and 635 nm) and additionally for the wavelength pair of 450 and 550 nm to compare to Cappa et al. (2016). Values that were not directly measured were recalculated based on power-law fitting.
SAE is inversely related to particle size. Coarse-mode aerosol particles, such as dust, pollen, and sea salt, have been reported to show SAE values of 0.5 (Costabile et al., 2013). Small particles, such as carbonaceous particles from fossil fuel combustion or biomass burning, typically show SAE values greater than 1.5 (Cazorla et al., 2013). AAE is related to the chemical composition of the particles. BC (emitted during both fossil fuel and biomass combustion) is known to absorb radiation equally well at all wavelengths and therefore exhibits AAE values close to 1 (Bond and Bergstrom, 2006). Dust (e.g. from soil or volcanic eruptions) and brown carbon (BrC, from biomass burning), however, exhibit wavelength-dependent absorption, with stronger absorption in the ultraviolet and blue spectral regions (Kirchstetter et al., 2004), corresponding to AAE values greater than 1.5. Finally, the Ångström matrix describes the relationship between AAE and SAE values in a bivariate plot, effectively subdividing the AAE–SAE space into regions that are representative of different particle types and sources (Cazorla et al., 2013; Cappa et al., 2016). Each point in the matrix corresponds to a pair of AAE and SAE values, and clustering of points in specific regions can be used to identify dominant aerosol types (e.g. large coarse particles, carbonaceous particles, or mixed particles). For a visualization of the full dataset, see Fig. S3.
ΔSAE describes the spectral variation of SAE, calculated as follows (Perrone et al., 2018):
Here, . While SAE is related to the mean size and relative concentrations of the accumulation and coarse mode aerosol, ΔSAE provides information on the contribution of fine- and coarse-mode particles, leading to a better understanding of the SAE values (Perrone et al., 2018). A negative value indicates a large contribution from a single, fine-mode particle, while a positive value indicates a contribution from both the fine and coarse modes, where higher values represent a larger contribution of the coarse-mode particles.
The backscattering ratio b is defined as the ratio of backscattering coefficients (σbsca,λ) to total scattering coefficients (σsca,λ):
b values range from 0 to 1, where a high fraction of larger particles results in a smaller value of b, as large particles (size larger than wavelength) predominantly scatter radiation in the forward direction (Bohren and Huffman, 2008).
b can also be used to estimate the asymmetry parameter g (Andrews et al., 2006). g is the cosine-weighted mean of the phase function, which describes the angular distribution of scattered radiation. It ranges from −1 to 1, representing total backscattering and total forward scattering, respectively, whereas 0 represents an equal balance between forward and backward scattering. It is a crucial parameter in radiative transfer models, climate models, and general circulation models used to estimate the direct radiative effect of aerosols (Bellouin et al., 2005; Barman et al., 2024). g was calculated using Eq. (7):
2.5 Source–receptor modelling with FLEXPART
The origins of the air masses arriving at the receptor site, where sampling instruments were placed, were simulated with the Lagrangian particle dispersion model FLEXPART version 10.4 (Pisso et al., 2019). The model emits computational particles at the surface that are tracked backward in time by the ambient flow, as defined by meteorological fields that are used as input into the model. In the present study, the meteorological input was based on hourly reanalysis meteorological fields (ERA5) from the European Centre for Medium-Range Weather Forecasts (ECMWF) with 137 vertical levels (up to approximately 80 km) and a horizontal resolution of 0.5° × 0.5° (Hersbach et al., 2020). Simulations extended over 30 d backward in time, a sufficient period to capture more than 98 % of most BC emissions arriving at the receptor, given a typical BC lifetime of 1 week (Bond et al., 2013). FLEXPART includes gravitational settling for spherical particles, dry and wet deposition of aerosols (Grythe et al., 2017), turbulence (Cassiani et al., 2015), unresolved mesoscale motions (Stohl et al., 2005), and deep convection (Forster et al., 2007). The model output consists of a footprint emission sensitivity that expresses the probability of any emission occurring in any grid cell to arrive at the receptor site and can be converted into model concentration when coupled with gridded emissions.
Anthropogenic emissions were adopted from the latest version (v6b) of the ECLIPSE (Evaluating the CLimate and Air Quality ImPacts of ShortlivEd Pollutants) dataset, an upgraded version of the previous version (Klimont et al., 2017). The inventory includes emissions from industrial combustion (IND) and from the energy production sector (ENE); residential and commercial emissions (DOM); and emissions from the waste treatment and disposal sector (WST), transportation (TRA), shipping activities (SHP), and gas flaring emissions (FLR). The methodology for obtaining emissions from FLR, specifically over the Russian territories, has been improved in ECLIPSEv6 (Böttcher et al., 2021). Biomass burning (BB) from wildfires was adopted from the Copernicus Global Fire Assimilated System (CAMS-GFAS) (Kaiser et al., 2012), a product that provides the estimates of the injection altitude of fire emissions that are crucial for accurate simulations of BB dispersion.
3.1 Main features of optical and physical properties
Figure 2 presents an overview of the aerosol optical properties during the measurement period, where each data point represents a mean of 10 min, while Table 1 presents numerical values of statistical parameters. Figure 2a shows scattering coefficients (σsca) at three different wavelengths. Two periods with particularly high σsca are visible, the first being from 18 to 20 March and the second being from 30 to 31 March. Apart from these two periods, the values of σsca were below 100 Mm−1. The median σsca values at 450, 525, and 635 nm were found to be 24.42, 20.24, and 17.29 Mm−1, respectively. In addition, the σsca at 450 nm was generally higher than at 525 and 635 nm, indicating that fine-mode particles contributed significantly to the aerosols. The period with the highest absorption coefficients (σabs) was observed from 17 to 20 March (Fig. 2b). Many sharp peaks were only visible in σabs and were absent in σsca, indicating the presence of strongly absorbing particles for short periods of time. These were likely emitted by traffic or biomass burning near the site. Therefore, they are not considered to be representative of the regional aerosols. The median σabs values at 470, 520, and 660 nm were 3.61, 3.06, and 2.20 Mm−1, respectively. In general, the absorption coefficients decreased with increasing wavelengths.
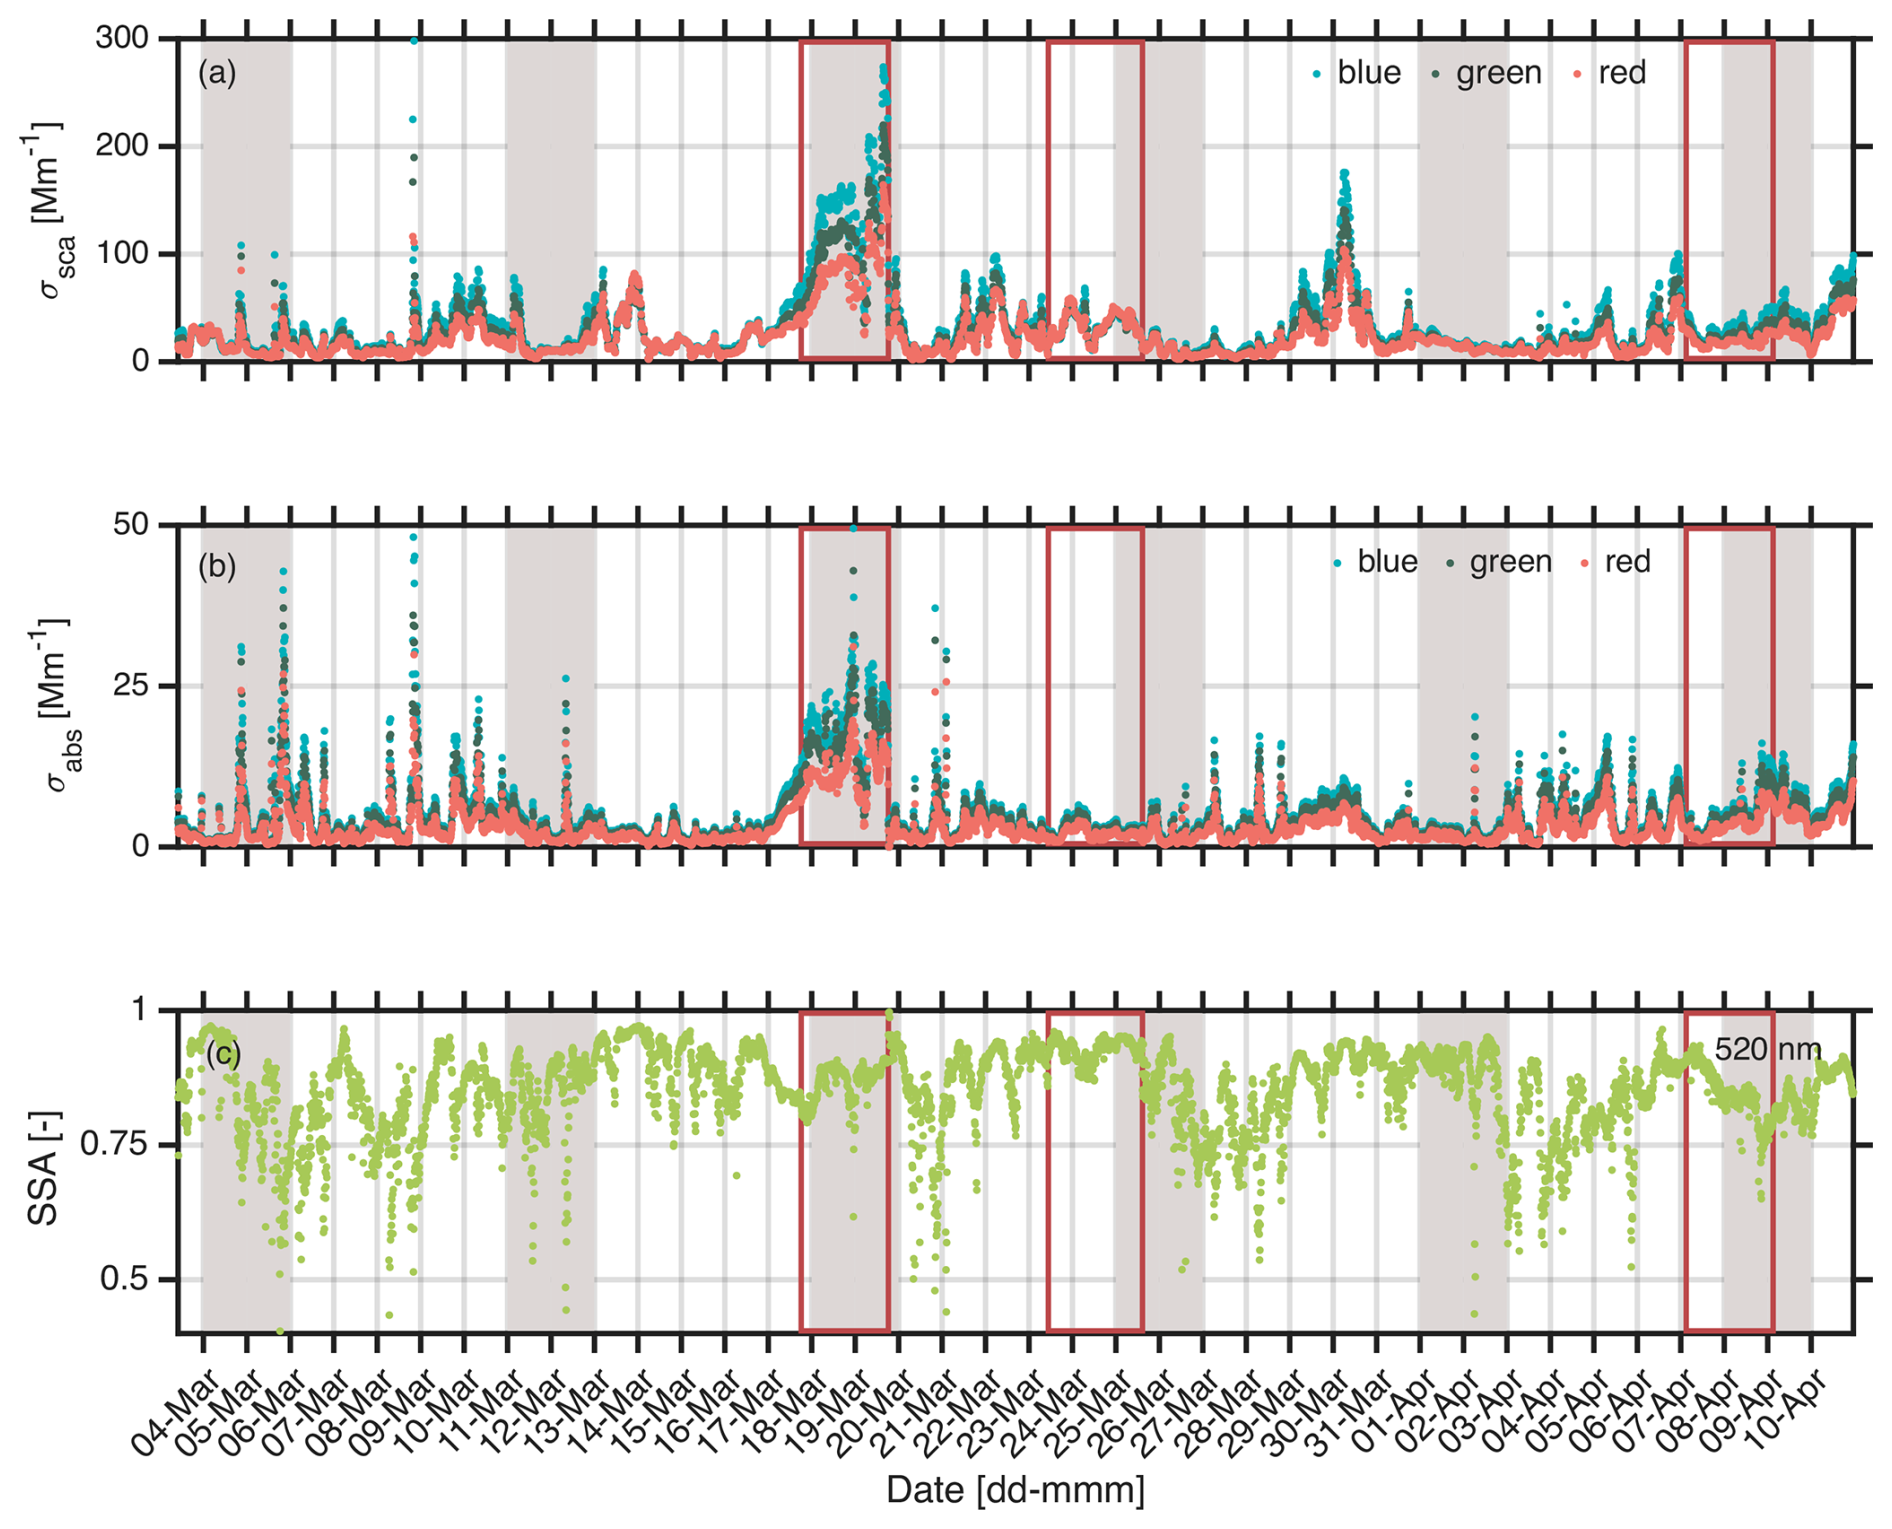
Figure 2The 10 min means of optical properties during the whole measurement period, with weekends highlighted in grey and the three selected cases highlighted with red squares. (a) Scattering coefficient σsca at three wavelengths (blue: 450 nm, green: 525 nm, red: 635 nm). (b) Absorption coefficient σabs at three wavelengths (blue: 470 nm, green: 520 nm, red: 660 nm). (c) Single-scattering albedo SSA at 520 nm. σsca at 520 nm was recalculated using power-law fitting.
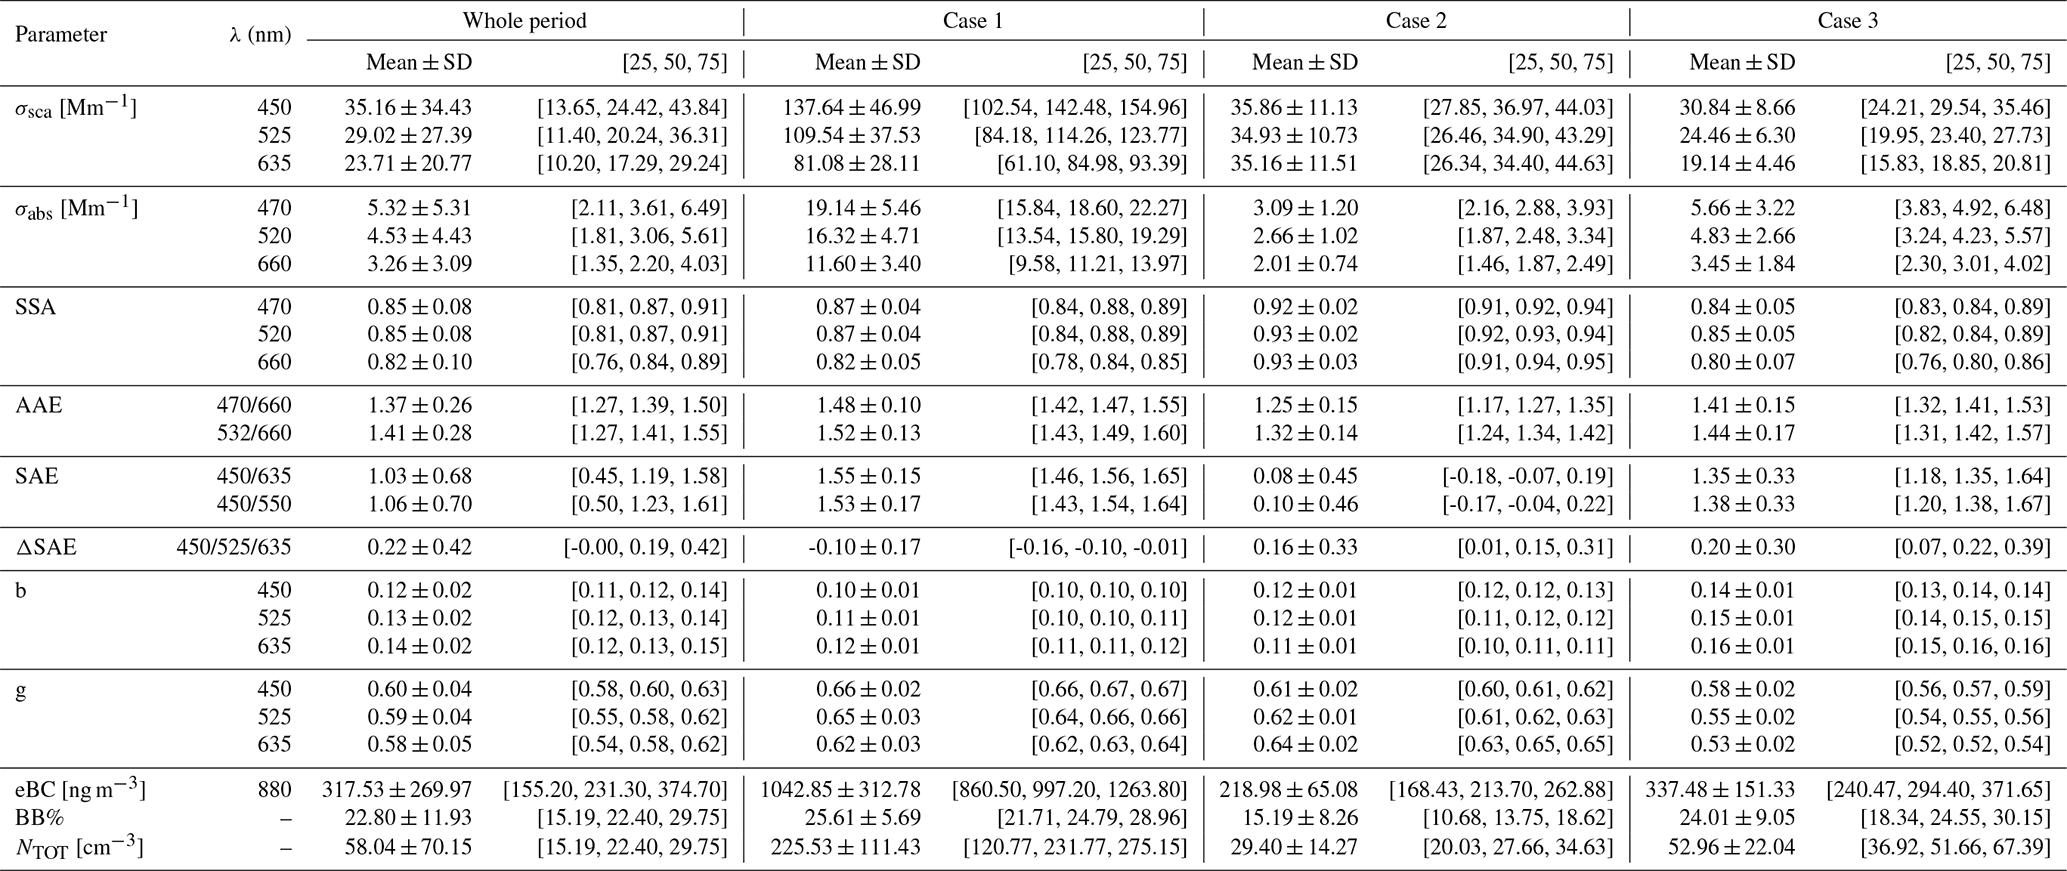
Table 1Statistics of optical properties. Mean ± standard deviation (SD), median and 25th and 75th percentiles ([25th, median, 75th]) of 10 min averaged optical parameters, and total number concentration for the whole period (3 March to 11 April) and the three cases.
Compared to Vavihill, a background site in southern Sweden, median σsca values at 525 nm in this study (20.24 Mm−1) were lower than in the Swedish study, where medians amounted to 31.4 Mm−1 for a similar period of the year (1 March–1 April 2011). Also, median σabs values at 520 nm from this study (3.06 Mm−1) were slightly lower compared to medians measured at Vavihill, amounting to 3.7 Mm−1 at 520 nm, for the same season (Roldin, 2012; Genberg, 2012). A follow-up study in Vavihill in April 2013 reported a monthly mean of approximately 5 Mm−1 at 520 nm (Martinsson et al., 2014), which is similar to our mean values (4.53 ± 4.43 Mm−1). Compared to a coastal, Mediterranean city (Lamezia Terme, Italy), characterized by anthropogenic pollution emissions related to traffic and agriculture, the σsca values at 550 nm during the cold season (October to March from 2015 to 2018) were found to be higher than those from this study, with median values of 30.93 Mm−1 (Donateo et al., 2020).
A median eBC value of 231.3 ng m−3 was found during the whole measurement period at Aarhus Bay, as calculated from the σabs value at 880 nm. Furthermore, the median value of BB%, characterizing the fraction of biomass burning to the eBC load, was 22.4 %. This indicates that biomass burning also contributed significantly to the absorbing aerosols at Aarhus Bay. eBC values at Vavihill, as calculated from presented σabs values at 880 nm during April 2013 (monthly means), were found to be approximately 380 ng m−3 (Martinsson et al., 2014), which is in the same range as our measurements at Aarhus Bay (Aarhus: mean of 317.53 ± 269.97 ng m−3). eBC values at Hyltemossa Research Station, a rural station about 65 km northeast of Malmö–Copenhagen, located in southern Sweden, were comparable with a median of 227.5 ng m−3 during March 2018 (Ahlberg et al., 2023). Interestingly, the median eBC concentration at Lamezia Terme during the cold season was 490 ng m−3 (mean: 690 ± 0 ng m−3) (Donateo et al., 2020) and thus was significantly higher than the median and mean values in Aarhus.
Figure 2c depicts the single-scattering albedo (SSA) at 520 nm, which ranged from 0.28 to 0.99, with a median of 0.87. Oceanic aerosols are generally expected to have high SSA values close to 1 at wavelengths from 440 to 1020 nm, while urban aerosols and biomass burning aerosols are typically described by lower values (Dubovik et al., 2002). Median SSA values at 520 nm in Aarhus (this study) and Vavihill were very similar (0.87 in Aarhus vs. 0.89 in Vavihill) (Genberg, 2012; Roldin, 2012; Tørseth et al., 2012). The median SSA value at Lamezia Terme using a wavelength of 637 nm during the cold season was 0.78 (min: 0.2; max: 0.99) (Donateo et al., 2020), which is slightly lower than the values from this study (Aarhus median: 0.84 at 660 nm).
The median AAE470/660 nm throughout the campaign was 1.39 (mean: 1.37 ± 0.26), which is well comparable to previously reported values for aerosols from fossil fuel combustion of 1 to 1.5 (Lee et al., 2012). The median SAE450/550 nm was 1.32, with a mean and standard deviation of 1.15 ± 0.74, indicating more variability in the wavelength dependence of the scattering coefficient. This variability can typically be explained by a change in the dominant aerosol particle mode as larger particles are described by smaller SAE values and vice versa. SAE440/675 nm values for aerosols from fossil fuel combustion were previously reported to be larger than 1.2 (Bahadur et al., 2012), indicating smaller particles, while SAE440/675 nm values of dust and SAE467/660 nm values of sea salt were reported to be less than 0.5 (Bahadur et al., 2012; Costabile et al., 2013), indicating larger particles. This suggests that both fine- and coarse-mode particles occurred during this Aarhus Bay campaign, which is also in agreement with the median value of ΔSAE of 0.19, suggesting the presence of both modes (Perrone et al., 2018; Suchánková et al., 2024). Few other studies exist in which similar data for coastal environments are reported: a monthly mean AAE370/950 nm for April 2013 of approximately 1.3 was found in Vavihill (Sweden) (Martinsson et al., 2014), in line with our data, while Donateo et al. (2020) reported a median SAE450/700 nm of 2.14 during the cold season (October to March from 2015 to 2018) in the coastal city of Lamezia Terme (Italy). The substantially lower SAE value from this study indicates the presence of more large particles in Aarhus Bay compared to the Mediterranean coastal city.
The median backscatter ratios b at 450, 525, and 635 nm were 0.12, 0.13, and 0.13. As larger particles scatter predominately in the forward direction, such small b values support the SAE and ΔSAE results, highlighting the presence of, in general, larger particles. These values are in line with median values measured in Lamezia Terme during the cold season (October to March from 2015 to 2018) of 0.10, 0.11, and 0.12 at 450, 550, and 700 nm (Donateo et al., 2020), respectively. The median values of the asymmetry parameter g in Aarhus were 0.60, 0.58, and 0.58 at 450, 525, and 635 nm, respectively, which is comparable to median values at similar wavelengths in Lamezia Terme during the cold season, found to be 0.67 (450 nm), 0.63 (550 nm), and 0.62 (700 nm) (Donateo et al., 2020).
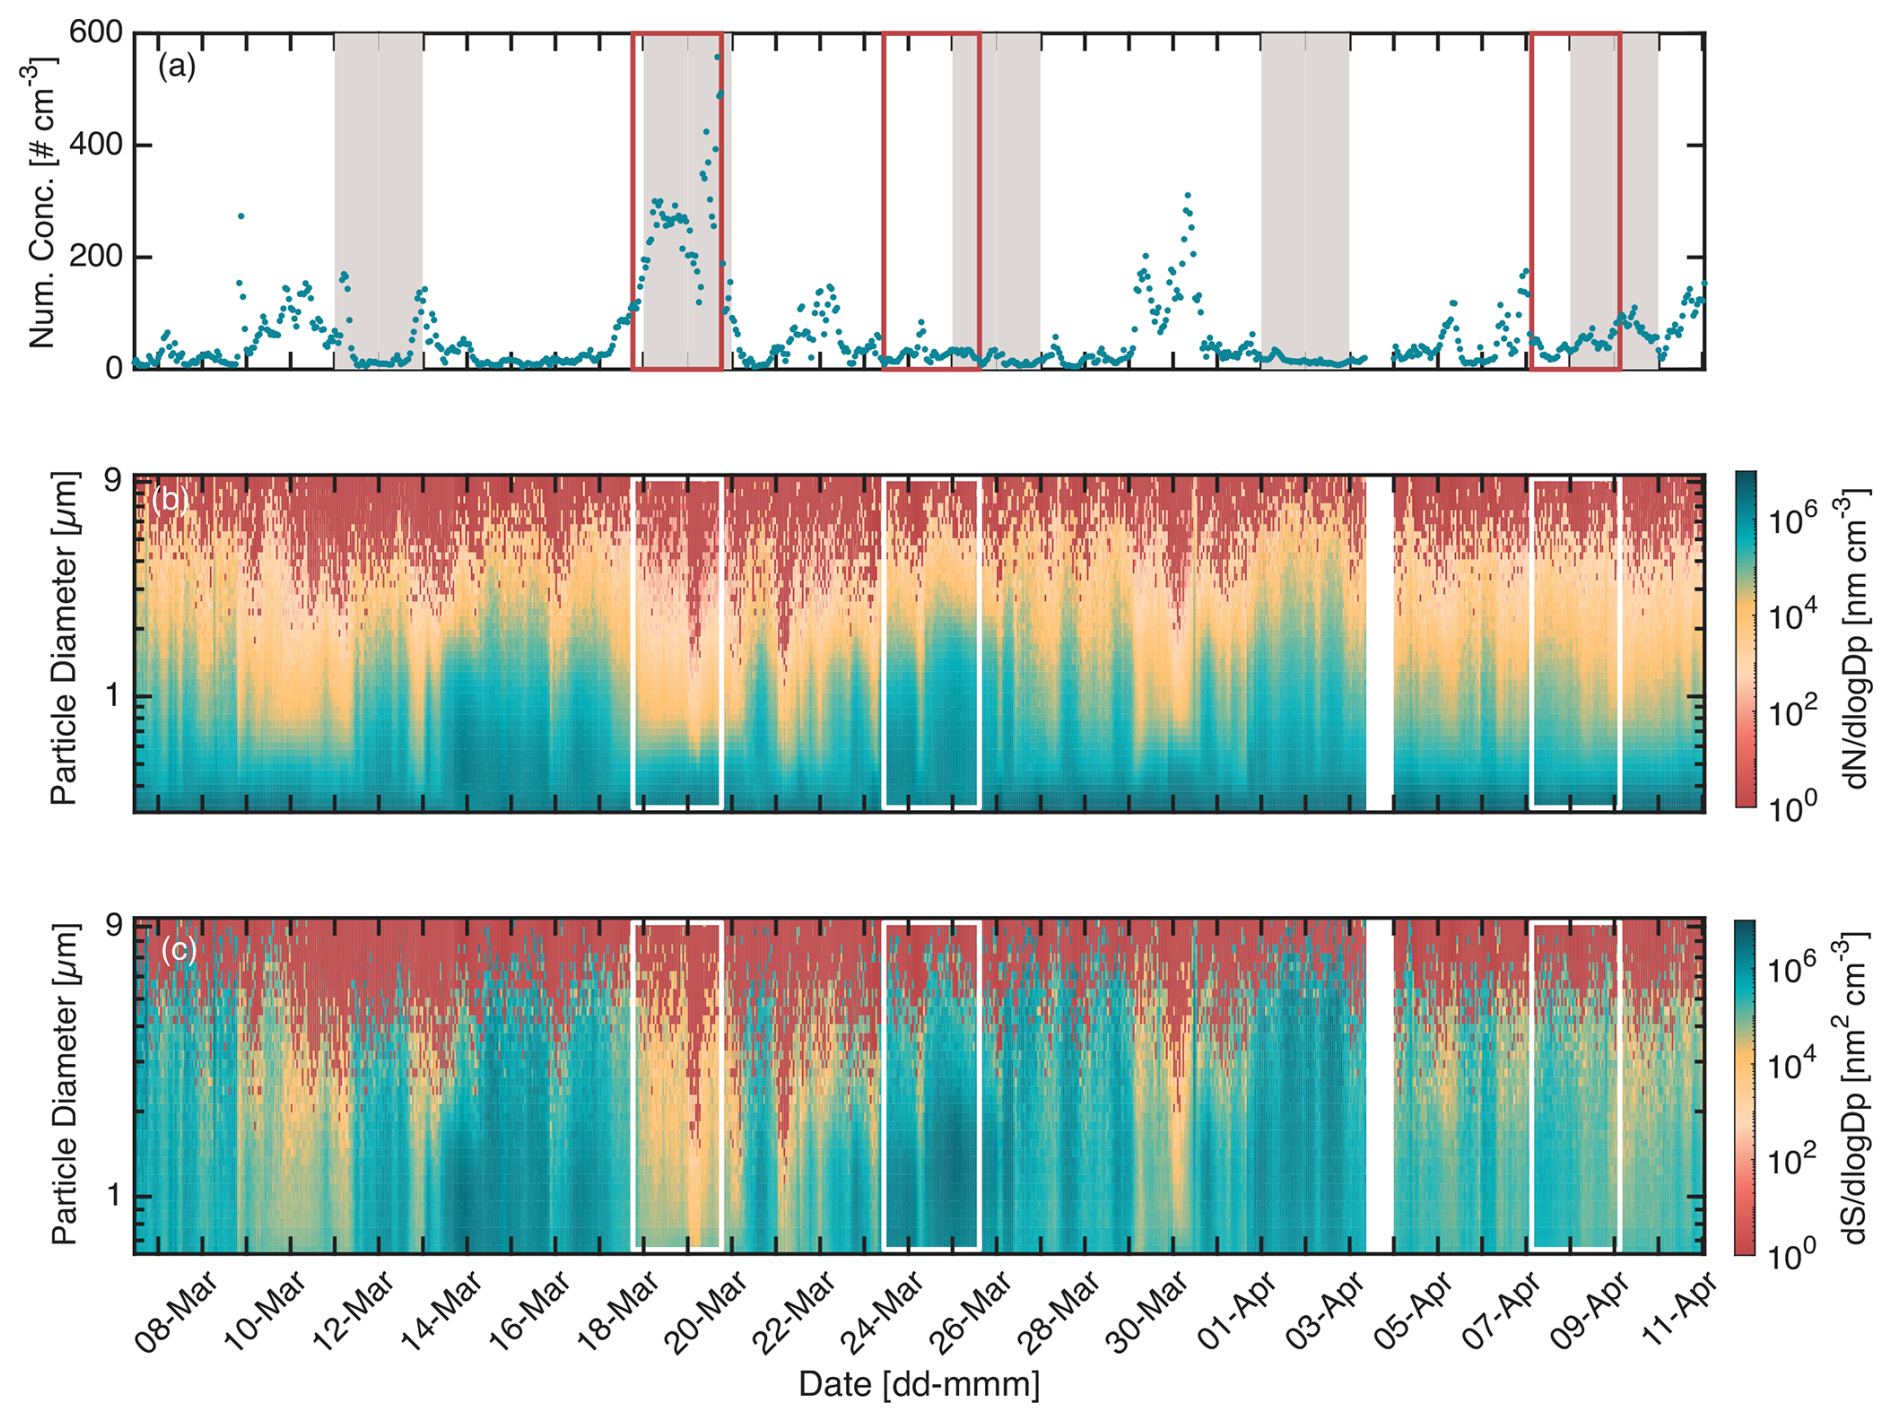
Figure 3Time series of particle concentration and size distribution during the whole measurement period, with weekends highlighted in grey and the three selected cases highlighted with red rectangles. The WELAS measurements were available from 7 March to 11 April 2023. (a) Total number concentration NTOT, (b) number size distribution , and (c) surface area size distribution .
Figure 3 depicts time series of the total number concentration (NTOT; Fig. 3a), number size distribution (; Fig. 3b), and surface area size distribution (; Fig. 3c) measured at Aarhus Bay. Both the total number concentration and size distributions are depicted as hourly means. The size distributions are plotted for particles above 300 nm. The changes in NTOT follow the same trend as was observed for σsca and σabs; i.e. the periods that were found to have high σsca and σabs also had high NTOT, as seen in Fig. 3a. From 17 to 20 March, the highest total particle number concentration was observed, with a maximum concentration of ∼ 550 cm−3. Elevated total particle number concentrations were also detected from 9 to 11 March and from 29 to 31 March. The median total particle number concentration throughout the whole period was 31.48 cm−3 (mean: 58.04 ± 70.15 cm−3). Number size distributions highlight particles between the detection limit of the WELAS and approximately 1 µm, and surface size distributions more clearly depict the contribution of particles up to 7 µm. When comparing the evolution of NTOT with the number and surface size distributions (Fig. 3b and c), it is evident that the period with the highest particle number concentration coincided with the number and surface size distributions dominated by smaller particle sizes, indicating an enhanced abundance of small particles during this period. Generally, when the number and surface size distributions showed a mode above 0.5 µm in particle diameter, the total number concentration remained below 200 cm−3 and was typically less than 100 cm−3.
3.2 Daily patterns of scattering and absorption coefficient and eBC
Figure 4 illustrates the median diurnal variation of σsca, σabs, and eBC concentrations during weekdays (Fig. 4a, c, and e) and weekends (Fig. 4b, d, and f). Median values were calculated excluding the data from 17 to 19 March, which showed the highest concentrations.
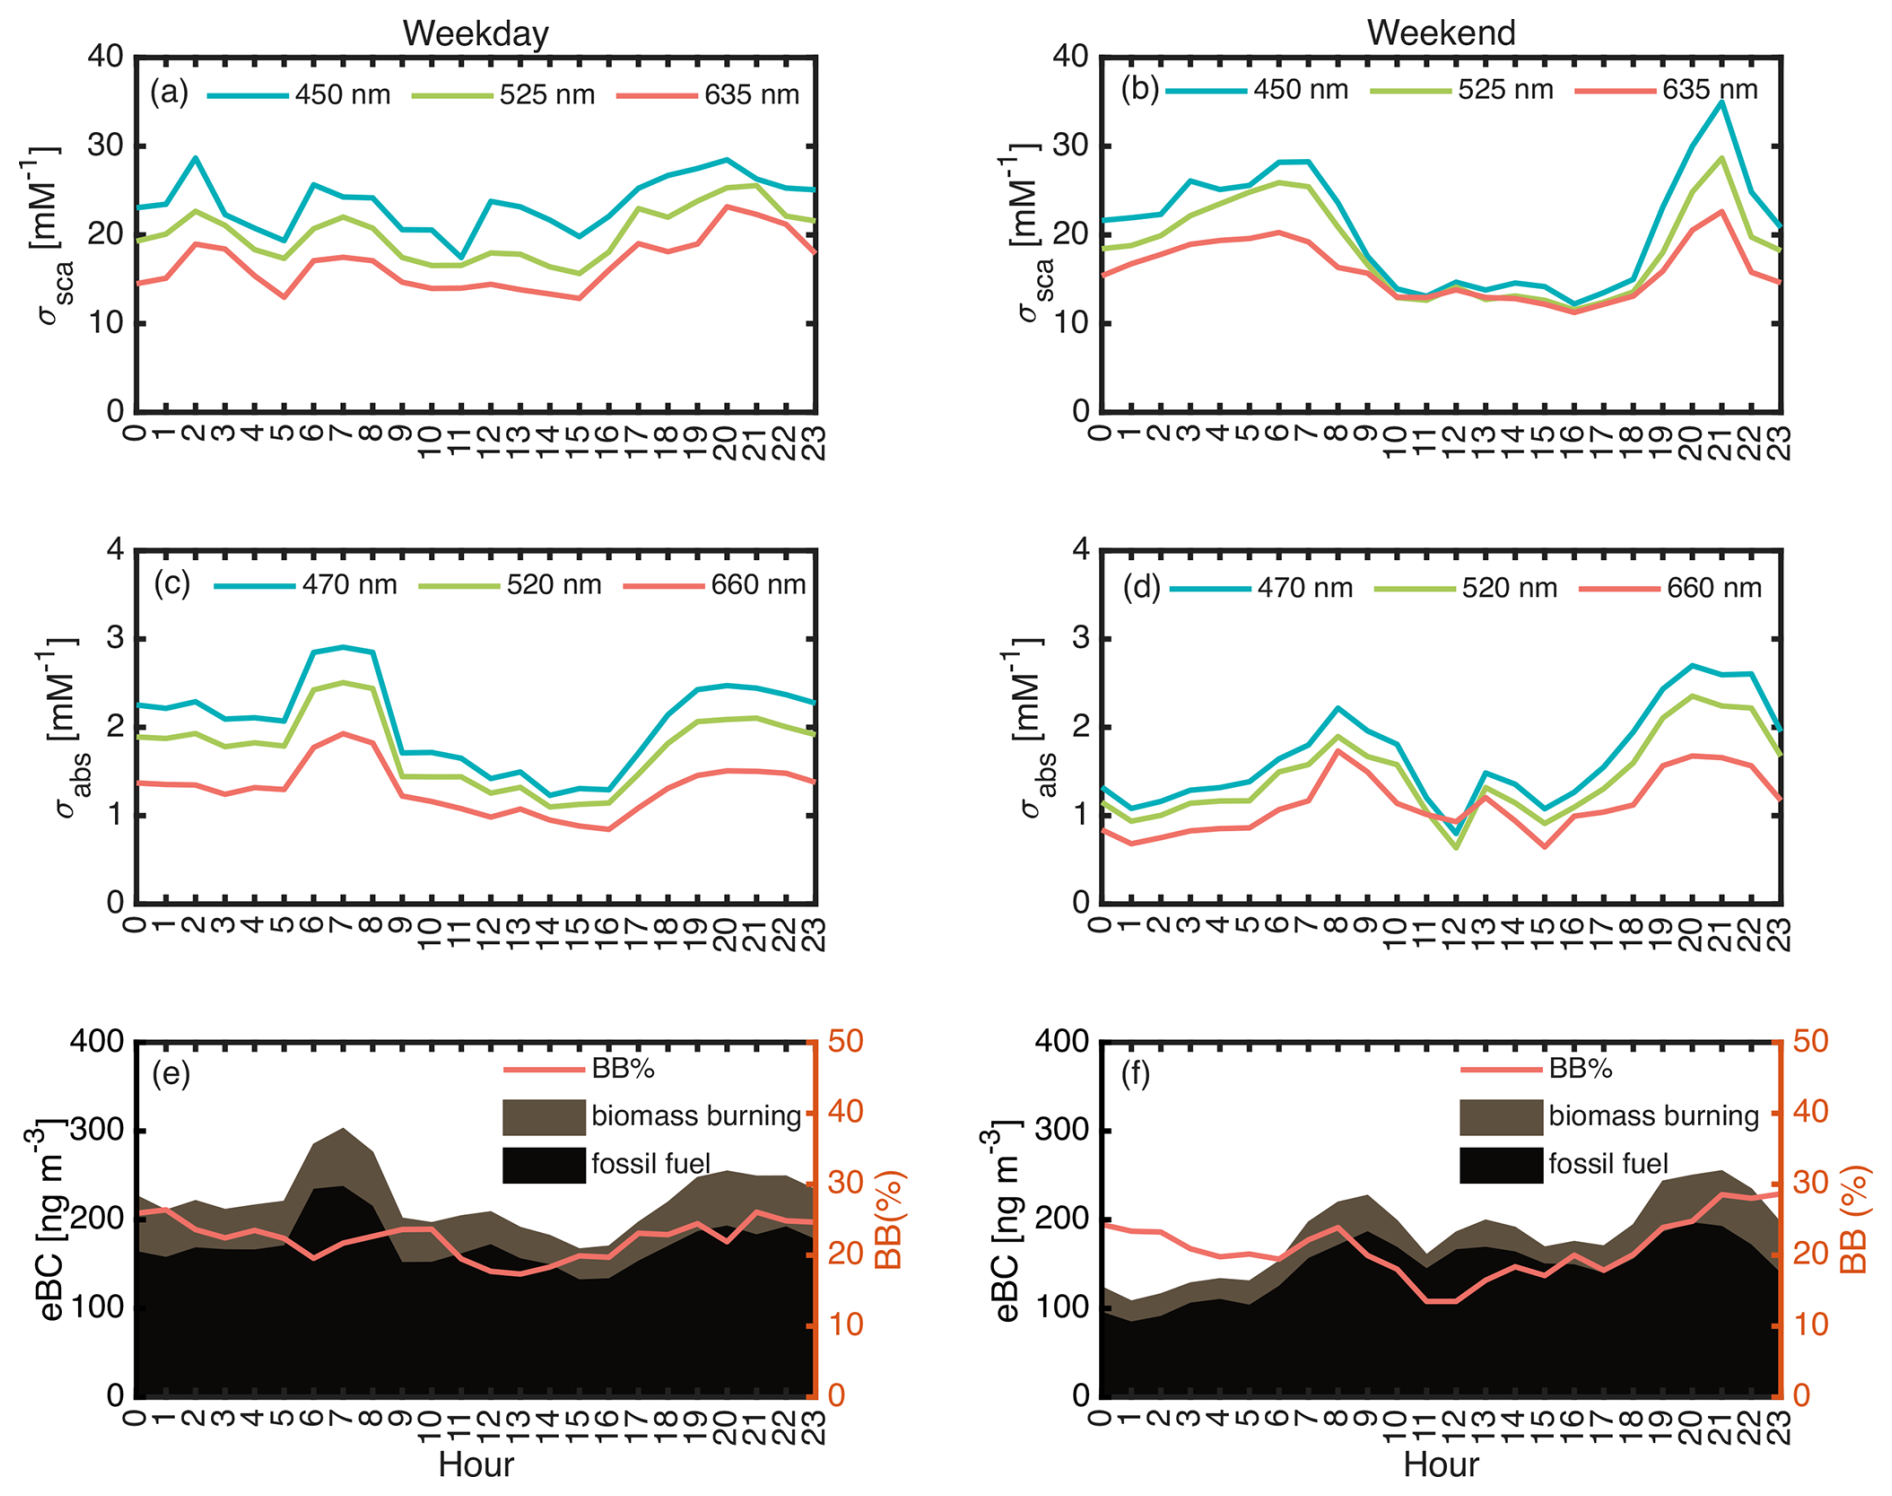
Figure 4Diurnal variation of (a) median σsca values at three wavelengths during weekdays, (b) σsca at three wavelengths during weekends, (c) median values of σabs at three wavelengths during weekdays, (d) median values of σabs at three wavelengths during weekends, (e) median values of eBC during weekdays, and (f) median values of eBC during weekends. In panels (e) and (f), brown colours represent the contribution from biomass burning, and black colours represent the contribution from fossil fuels. Source apportionment is based on BB%; see the text for more information.
The absorption coefficient σabs shows clear diurnal patterns on both weekdays and weekends, with two major peaks, one in the morning and one during the evening/night, highlighting the typical rush hours. The morning peak is generally around 05:00–09:00 LT (local time), while the evening peak typically lasts from 17:00 to 23:00 LT. The morning peak appeared to be earlier and sharper during weekdays than during weekends, coinciding with expected traffic patterns during weekdays and weekends, respectively. The evening peak was slightly lower during weekdays compared to during weekends (Fig. 4c and d). The scattering signal did not show a clear pattern during weekdays; however, two distinct peaks could be observed during the weekend (Fig. 4a and b). Furthermore, the difference between the three wavelengths was larger on weekdays than on weekends. During weekends, σsca values at different wavelengths were very similar between 10:00 and 18:00 LT, indicating that both smaller and larger particles were present. During weekdays, however, σsca at 450 nm was clearly higher in the same time period, indicating a larger fraction of small particles.
Overall, the differing diurnal behaviours in scattering and absorption indicate that non-absorbing or weakly absorbing aerosol components contribute substantially to the observed scattering signal, particularly during weekdays. Figure S4a and b show the temporal evolution of the diurnal pattern of scattering and absorption coefficients, highlighting that, except for the last week, the daily patterns were quite comparable throughout the course of the campaign.
The contribution from combustion of fossil fuels was calculated by subtracting the contribution from biomass burning from the total eBC. Figure 4e and f present eBC values subdivided into fossil fuel (black) and biomass burning (brown) contributions. Fossil fuel contributed the most to eBC concentrations, above 70 % during both weekdays and weekends. BB% varied from 17 % to 26 % during weekdays and from 13 % to 29 % during weekends. During weekdays, a prominent peak during rush hour was observed from around 05:00 to 08:00 LT, underlining the important influence of traffic emissions at the site. In particular, the increase on weekdays was larger than that on weekends. During the evening, an increase in both fossil fuel and biomass burning contributions was found on weekends and weekdays. Notably, the contribution from biomass burning was higher during weekends, where it increased from 20 % to 29 % between 18:00 and 23:00 LT. This could arise from the increased use of domestic fireplaces during weekends and bonfires.
In addition to human activities such as traffic and biomass burning, changes in the planetary boundary layer (PBL) height may impact daily patterns. A high PBL typically leads to the dilution of surface emissions and, in general, lower concentrations, while a lower PBL hinders dispersion, thus favouring higher concentrations. Solar radiation is the major driver for PBL height and can be used as a proxy. Figure S5 shows the overall radiation time per day, and Fig. S6 illustrates the diurnal variation of solar radiation during the campaign. The typical radiation pattern showed an increase from around 07:00 to 08:00 LT and a decrease around 19:00 to 21:00 LT, where the decrease shifts to later hours at the end of the campaign. This coincides well with the time the morning peaks start to decrease and the time the evening peaks start to increase.
3.3 Comparison between measured and modelled black carbon
Figure 5 highlights a very good agreement between the temporal evolution of total eBC, as measured by the aethalometer, and BC, as modelled by FLEXPART analysis. FLEXPART separates the contribution from black carbon into eight different sources (see Fig. S7 for the time series of the individual sources). On average, the main BC sources contributing to the air masses in Aarhus Bay during the campaign were DOM (∼ 49 %), BB (∼ 26 %), and TRA (∼ 19 %), while minor contributions from IND (∼ 3 %), FLR (∼ 2 %), SHP and WSD (∼ 1 %), and ENE (∼ 0 %) were found.
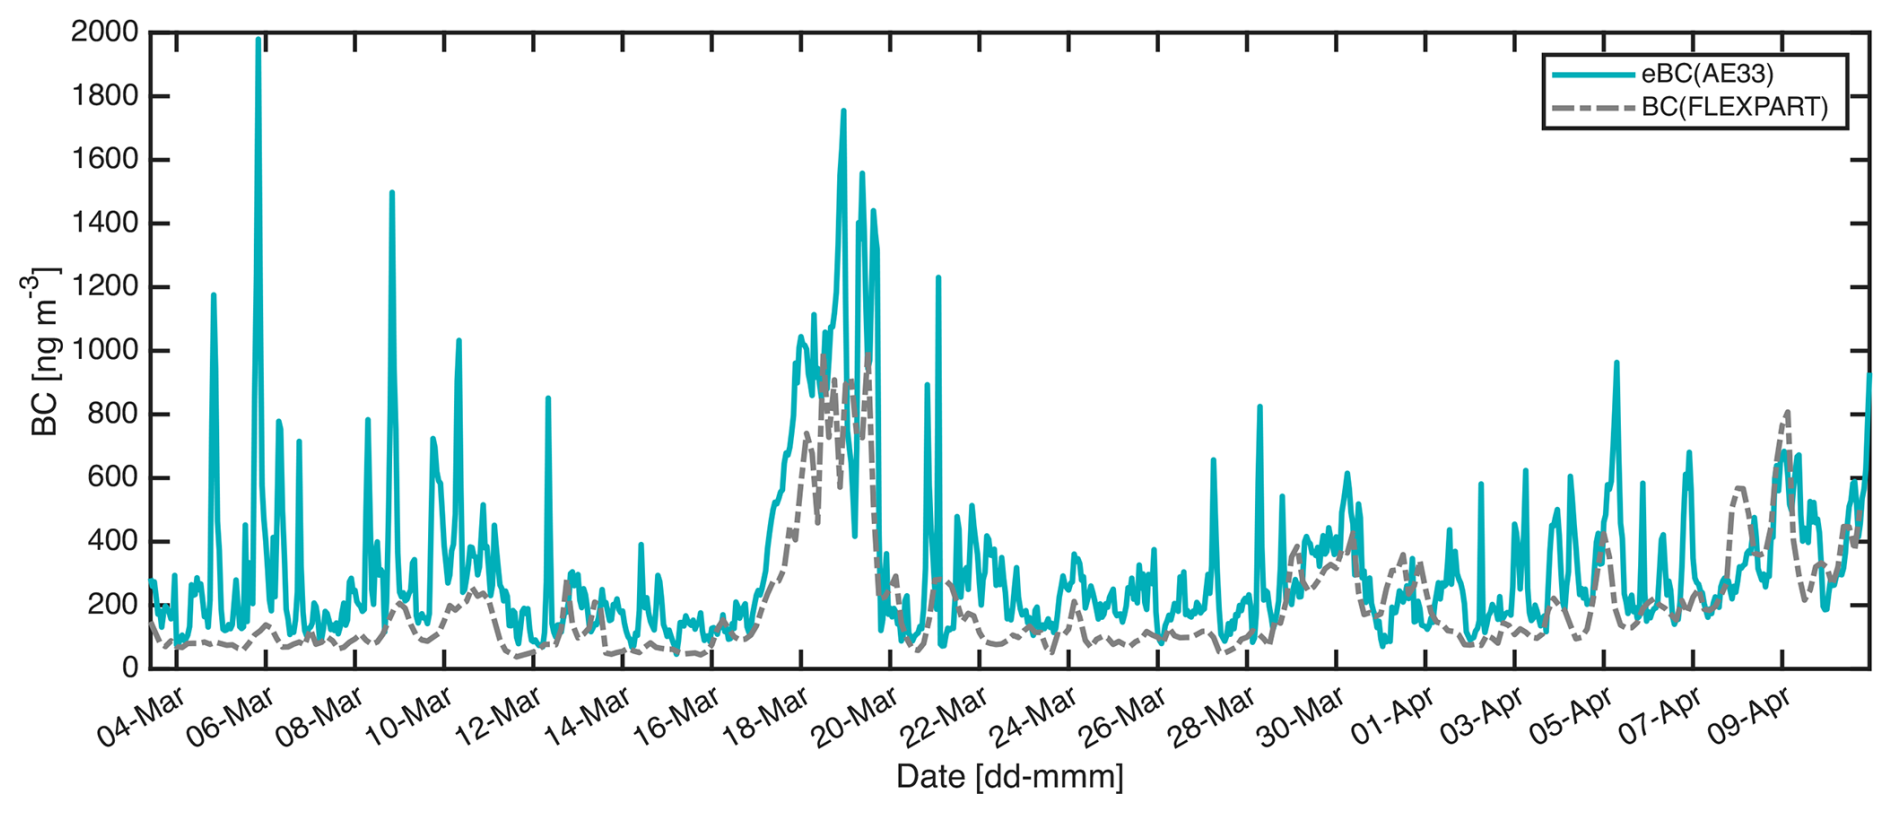
Figure 5Black-carbon mass concentrations measured by the aethalometer (solid blue line) and modelled using FLEXPART (stippled grey line) combining the all-source contributions.
An overall comparison to FLEXPART data yielded a mean fractional bias (MFB) of −51.9 % and a root mean squared error (RMSE) of 221 ng m−3. While several previous studies comparing FLEXPART BC concentrations with observations in background stations found good agreement (Popovicheva et al., 2025; Fang et al., 2025; Yttri et al., 2024; Fang et al., 2023; Popovicheva et al., 2022; Platt et al., 2022), a comparison in urban areas is more challenging due to the difficulties that arise when local emissions have to be considered. The superposition of transported and emitted BC makes a direct comparison with FLEXPART data difficult, leading to more smoothed modelled lines as compared to the observations. Local pollution is mainly characterized by sharp BC peaks, as seen in Fig. 5, and the lack of these in the modelled BC indicates missing sources in the emission inventories, thus leading to an underestimation by the model. Similar results were also found in the cases of urban Vilnius (Lithuania) and Warsaw (Poland) (Hey et al., 2026). The BC trend in Aarhus Bay was, however, captured very well by FLEXPART.
3.4 Characterization of three special air mass types
We selected three special cases from the entire measurement period, characterized by different air mass types.
-
Case 1: local pollution. This period lasted 48 h, from 18:10 LT on 17 March to 18:20 LT on 19 March. It was characterized by high scattering and absorption coefficients, reaching the highest values during the campaign. The measured wind speed (1.48 ± 1.72 m s−1; median: 3.10 m s−1) and radiation were relatively low during this period, as recorded at the DMI station, providing favourable conditions for particle accumulation. The start time was determined to be when σsca,525 and σabs,520 were higher than their campaign means and when SSA520 was lower. The end time was set to be when σabs,520 decreased below the campaign mean.
-
Case 2: high single-scattering albedo. This period lasted 52 h, from 11:00 LT on 23 March to 15:00 LT on 25 March. During this period, the highest SSA values were reached, as well as higher wind speeds (5.40 ± 1.88 m s−1; median: 5.40 m s−1), with a maximum of 10.2 m s−1 (from DMI station). This combination could favour a marine emission source. The start time was determined to be when both σsca,525 and SSA520 exceeded their campaign means, and the end time was determined to be when SSA520 decreased below its mean value for the whole period.
-
Case 3: long-range transport. This case lasted 48 h, from 03:00 LT on 7 April to 03:00 LT on 9 April. Based on the results of the FLEXPART model, significant contributions to BC originated from the “Asia” and “Russia” sectors. Wind speed was low, with a mean value of 2.65 ± 1.22 m s−1 and a median value of 2.80 m s−1; also, the wind direction mainly originated from northeast and east–northeast (from DMI station), in agreement with the FLEXPART results. The start time was determined to be when the contribution from Asia or Russia was higher than its mean contribution during the whole measurement period, and the end time was determined to be when both contributions decreased below their mean values throughout the campaign.
Figure S8 presents the footprint analysis for each of the selected cases, while Fig. S9 shows CO, PM10, and NOx data from the DCE station, highlighting the case periods. Figure S10 shows the time series of wind speed and wind direction during the entire measurement period.
3.4.1 Case 1
Both σsca and σabs were around 3 to 4 times higher than the mean of the entire measurement period, as seen in Table 1. Also, the median total number concentration was 231.77 cm−3 (mean: 225.53 ± 111.43 cm−3) and thus about 7 times higher than the median value during the whole period (almost 4 times higher than mean value). NOx and CO are often used as tracers of pollution as they are mainly emitted from fossil fuel combustion and biomass burning. NOx has a short lifetime of around d and a limited travel range, usually below 1 km (Seinfeld and Pandis, 2016), and is thus indicative of local emissions. CO, on the other hand, has a lifetime of below 1 year and a travel range of about 50 km (Seinfeld and Pandis, 2016), thus representing more regional air masses. NOx concentrations varied from approximately 15 to 109 ppb, with a mean value of 48.22 ppb, a standard deviation of 22.67 ppb, and a median value is 46.32 ppb (Fig. S11). This is 160 % higher than the mean NOx mixing ratios (17.96 ± 17.31 ppb; median: 12.25 ppb) measured during the entire measurement period at that location. Meanwhile, the mean CO concentration during Case 1 was 0.29 ± 0.09 ppm, with a median of 0.27 ppm ranging from 0.16 to 0.59 ppm. This is 55 % higher than the mean value over the whole measurement period of 0.18 ± 0.05 ppm. Thus, the elevated levels of NOx and CO indicate that Case 1 was dominated by local emissions most probably originating from ships or local traffic or other high-temperature combustion sources such as biomass burning. The FLEXPART footprint analysis for Case 1 revealed a clear continental contribution (see Fig. S8) and an age of 3 d for, on average, 76 % of BC data, where 91 % of BC originated from Europe (see Fig. S12), suggesting that the aerosols were rather fresh and probably emitted from local sources. FLEXPART-simulated BC mass concentrations were 35.4 % (RMSE = 475 ng m−3) lower than the observations, representing a smaller deviation than the average bias observed over the full campaign.
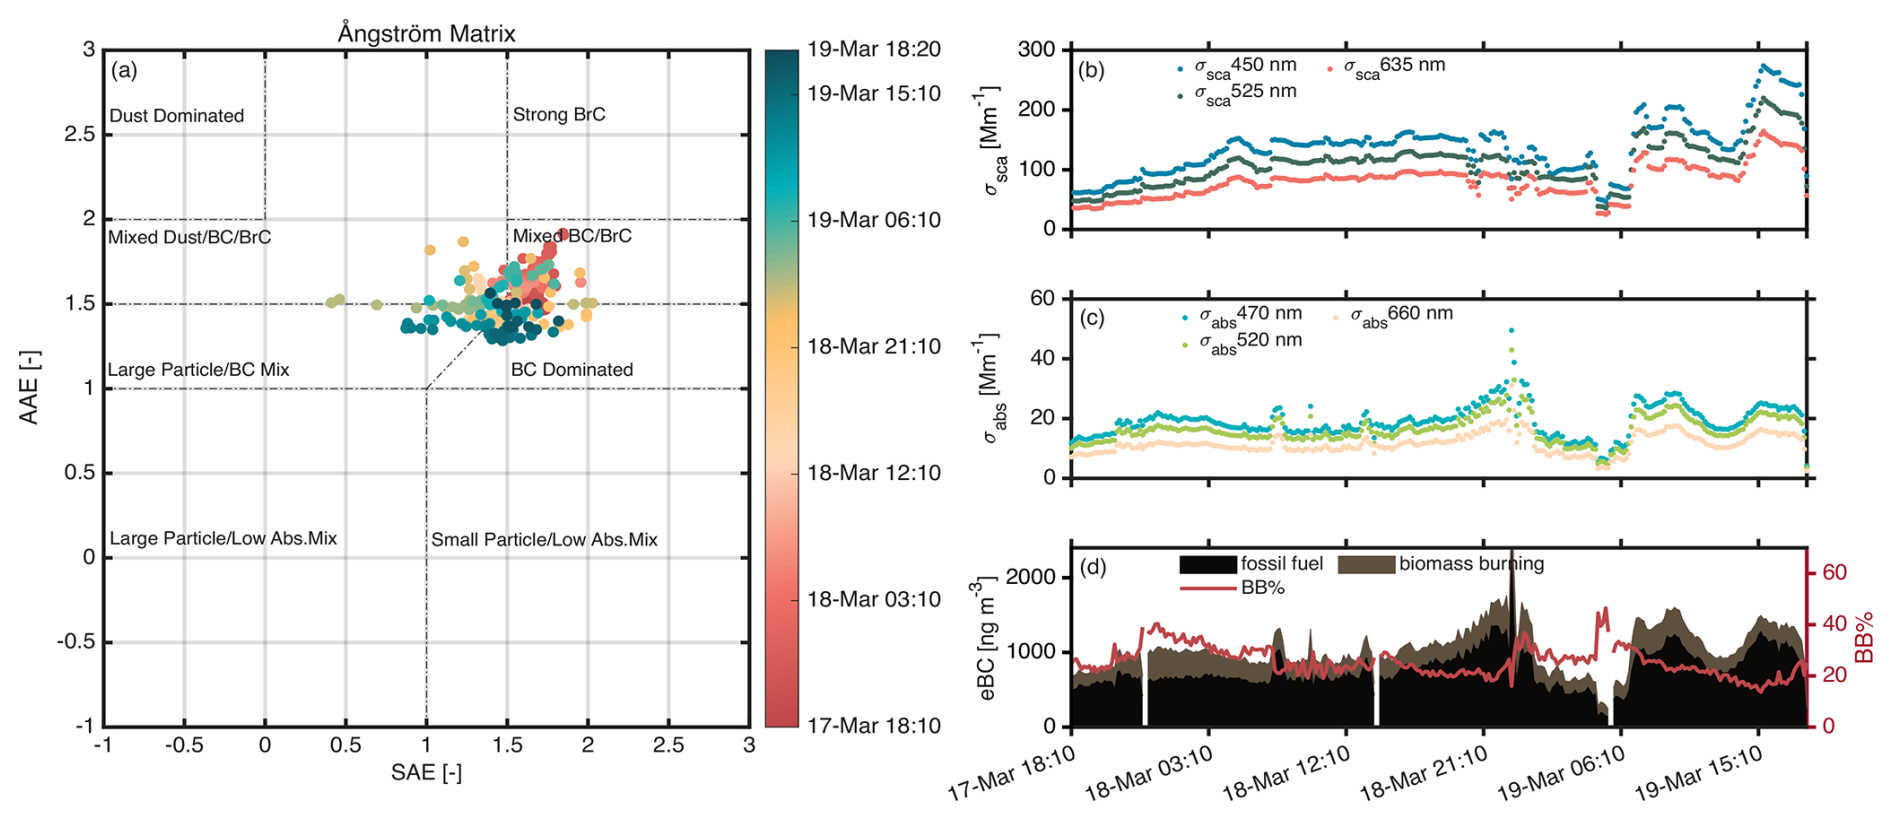
Figure 6Optical properties and eBC concentration during Case 1. (a) Ångström matrix colour-coded by time, (b) time series of scattering coefficients, (c) time series of absorption coefficients, (d) source apportionment of eBC based on the biomass burning percentage (BB%) provided by the aethalometer.
As illustrated in Fig. 6a, most data points were concentrated in the “BC-dominated” and “mixed BC/BrC” zones. The mean values of AAE532/660 nm and SAE450/550 nm were 1.52 and 1.49, respectively. Figure 6d shows that the contribution of fossil fuel combustion to eBC was significant during this period. Aerosols from fossil fuel combustion represented 75.03 % of the eBC concentration, ranging from 52.51 % to 86.31 %, which was slightly higher than during the entire measurement period. Figure 6b and c present the temporal evolution of σsca and σabs during Case 1. It is evident that σsca increased slightly until 05:00 LT on 18 March, while σabs first increased but then stopped increasing earlier at 23:00 LT on 17 March and subsequently decreased until 05:00 LT on 18 March. During this period, aerosols gathered in the mixed BC/BrC range as biomass burning had a significant impact on eBC during this time (Fig. 6d). After 05:00 LT on 18 March, both σsca and σabs remained at a constant level until 20:00 LT on 18 March. From 20:00 LT on 18 March until midnight of 19 March, σsca and σabs show different trends: while σsca shows two dips, σabs, on the contrary, increased to reach the highest values. During the σabs peak, the data points were gathered in the BC-dominated zone (Fig. 6a), and a clear signal from fossil fuels is visible in the source distribution plot (Fig. 6d). After midnight on 19 March, both scattering and absorption coefficients started to decrease, possibly due to a change in the meteorology as all data recorded at the DCE station decreased simultaneously with the optical signals, as seen in Fig. S11. At the end of Case 1, both σsca and σabs increased again and then stabilized. Notably, σsca reached the highest values during this end phase of Case 1. Here, particles were gathered in the large-particle/BC mix zone and moved towards the BC-dominated zone (Fig. 6a). Figure 6d illustrates that BB% continuously decreased during this period, while traffic emissions dominated the signal. Figure S13 displays the size distributions as and during Case 1.
3.4.2 Case 2
During Case 2, the highest SSA values during the whole campaign with a median and mean value of 0.93 at 520 nm were recorded, indicating that highly scattering particles constituted a significant portion of the aerosols throughout this period. As shown in Table 1, the median and mean scattering coefficients were higher in Case 2 (median: 34.90 Mm−1 at 525 nm) than during the entire period (20.24 Mm−1 at 525 nm). Conversely, the absorption coefficients were lower during Case 2 (median: 2.48 Mm−1 at 520 nm) than during the whole measurement period (median: 3.06 Mm−1 at 520 nm). Consequently, the SSA values were comparatively high in relation to the values during the entire period (median: 0.93 at 520 nm).
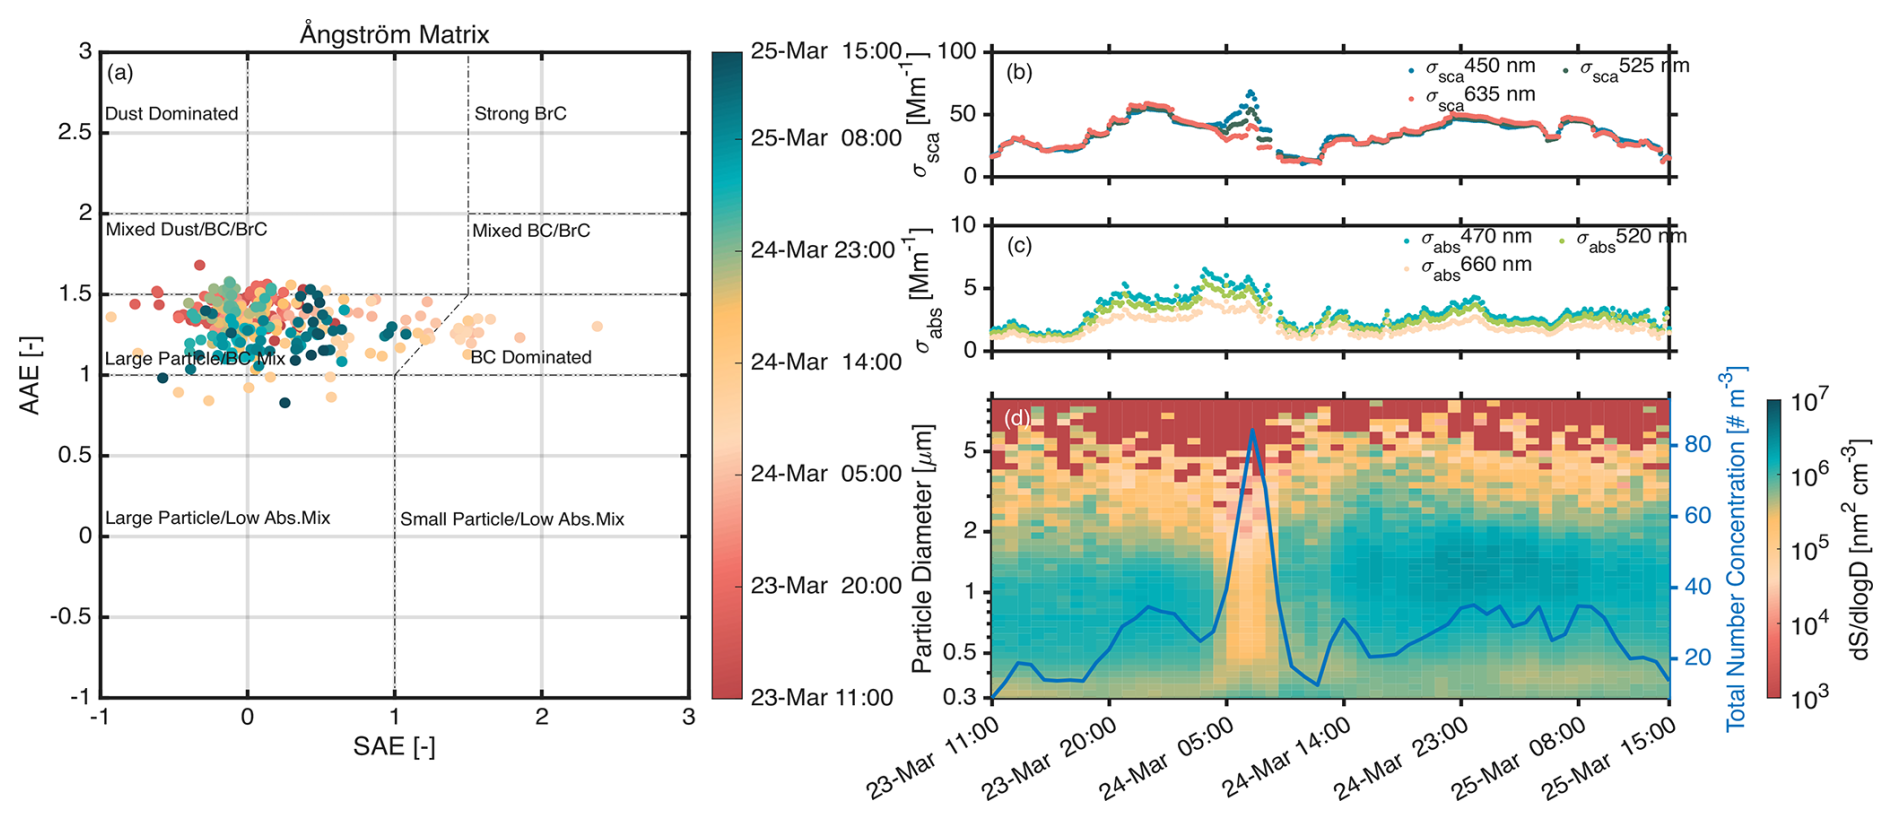
Figure 7Optical and physical properties during Case 2. (a) Ångström matrix colour-coded by time, (b) time series of scattering coefficients, (c) time series of absorption coefficients, and (d) time evolution of surface area size distribution and total number concentration.
The median and mean AAE532/660 nm values during Case 2 (median: 1.34; mean: 1.32 ± 0.14) were slightly lower than the median and mean of the entire period (median: 1.41; mean: 1.41 ± 0.28). The median and mean SAE450/550 nm values during Case 2 (median: −0.04; mean: 0.10 ± 0.46) were significantly lower than the median and mean values for the entire period (median: 1.23; mean: 1.06 ± 0.70), suggesting that large particles dominated the overall aerosol population. Thus, in the Ångström matrix (Fig. 7a), the data are clustered together in the large-particle/BC mixture zone. Only at midnight on 24 March (orange points) were data points shifted to the BC-dominated zone before shifting back to the large-particle/low-Abs mix zone (Fig. S14 displays NOx, CO, and eBC data).
Figure 7b shows that, during this shift, σsca at different wavelengths was clearly different, while the signal mostly overlapped during the rest of Case 2, leading to low SAE values that are typical for large particles. The absorption coefficients (Fig. 7c) generally followed the trend of scattering, except for the special short period observed on 24 March, which lasted approximately 3 h.
Figure 7d highlights that, in terms of surface area, particles of 0.35 to 5 µm in diameter dominated, with a mode diameter around 1 µm (Fig. S15 additionally illustrates the size distribution as ). On 24 March, the particle number concentration increased strongly to approximately 75 cm−3, and sizes below 0.3 µm dominated, consistently with when data points shifted to the BC-dominated zone in the Ångström matrix.
Breaking waves can produce aerosols across a wide size range, from 10 nm to > 10 µm (Clarke et al., 2003), supporting the interpretation that marine coarse particles could have contributed to the observed high scattering. The elevated scattering coefficients during Case 2 are likely to be influenced by these coarse-mode particles, including sea salt aerosols. However, the observed contributions by large coarse particles above approximately 8 µm may be underestimated due to the losses in the inlet and tubing.
Supporting evidence for marine influence includes higher wind speeds during Case 2 and FLEXPART footprint analysis, indicating air masses arriving from the ocean (see Fig. S8). Periods of elevated SSA and scattering are therefore consistent with a contribution from coarse sea salt particles, while the short BC-dominated event could have been due to local ship or traffic emissions. The trend of the modelled and observed black carbon is well comparable, with FLEXPART being able to capture the short BC peak (see Fig. 5), while the overall values were underestimated by the model (MFB = −78.7 %, RMSE = 128 ng m−3).
3.4.3 Case 3
According to the FLEXPART model results, Russia and Asia contributed significantly to the BC concentrations during Case 3, leading to a more long-range-dominated aerosol. The FLEXPART footprint analysis for Case 3 is shown in Fig. S8.
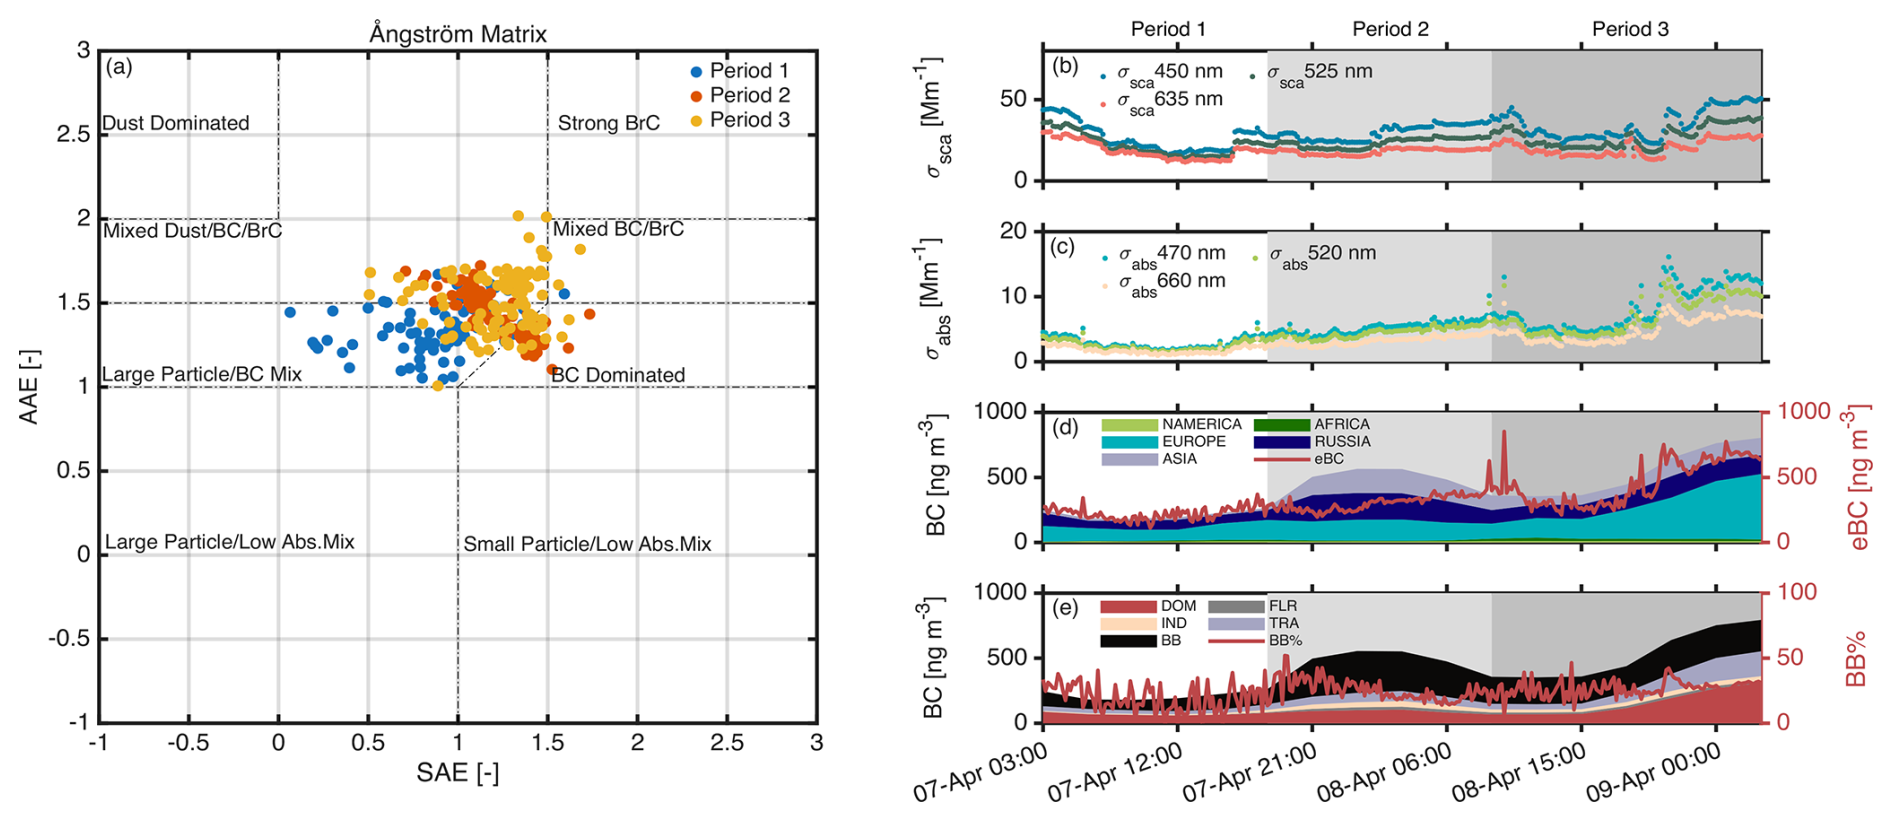
Figure 8Optical properties, eBC concentrations, and FLEXPART results during Case 3. (a) Ångström matrix colour-coded by time; (b) time series of scattering coefficients; (c) time series of absorption coefficients; (d) continental contribution to the BC concentration from FLEXPART and eBC from the aethalometer; and (e) source contributions of BC from FLEXPART (DOM: residential and commercial combustion, FLR: gas flaring, SHP: shipping activities, TRA: surface transportation, ENE: power plants and energy conversion, IND: industrial combustion, WST: waste burning, BB: biomass burning.) and BB% from the aethalometer, shown with the red line.
Figure 8 shows the measured optical properties and source apportionment and the continental contributions of BC from the FLEXPART model results. Based on Fig. 8d, Case 3 was subdivided into three periods:
-
Period 1. This is from 03:00 to 19:00 LT on 7 April, with a contribution from Russia of around 34 %, a contribution from Europe of around 50 %, and contribution from Asia of around 8 %.
-
Period 2. This is from 19:00 LT on 7 April to 09:00 LT on 8 April, with increased contributions from Asia and Russia, reaching around 27 % and 34 %, respectively, while contributions from Europe were 34 %.
-
Period 3. This is from 09:00 LT on 8 April to 03:00 LT on 9 April, with contributions from Asia and Russia remaining constant (approximately 20 % and 26 %), while the contribution from Europe increased over time to reach 48 %.
Figure 8a shows the Ångström matrix, which is colour-coded according to the three periods introduced above. The points are initially located in the large-particle/BC mix zone (period 1) and then shift to the mixed dust/BC/BrC and BC-dominated zones (period 2) and finally spread between the mixed dust/BC/BrC, BC-dominated, mixed BC/BrC, and large-particle/BC mix zones during period 3. This indicates that period 1 contained a high fraction of large particles, and then the mean particle size decreased while the BC fraction increased during period 2 (Fig. S17 illustrates size distributions during Case 3). During period 3, the BC and BrC fractions increased, while SAE values increased, highlighting smaller particles.
Figure 8b illustrates the scattering coefficients and Fig. 8c illustrates the absorption coefficients at different wavelengths over time. During period 1, the scattering coefficient at 525 nm decreased from 40 to 10 Mm−1, and the absorption coefficient at 525 nm decreased from 4 to 2 Mm−1. The mean SSA value was 0.90. The similar σsca values at the three wavelengths lead to the observed clustering in the large-particle/BC mix zone (Fig. 8a). During period 2, the scattering and absorption coefficients began to increase. The SSA dropped to 0.84, indicating an increase in the contribution by absorbing aerosols. During period 3, the scattering and absorption coefficients first briefly decreased and subsequently increased again, fluctuating but both following similar trends, while SSA values decreased to 0.80.
Figure 8d demonstrates a strong agreement between black-carbon concentrations simulated by FLEXPART and those measured by the aethalometer during Case 3. The model slightly overestimated the observations by 15.8 %, with an RMSE of 132 ng m−3. This good performance is consistent with the dominance of long-range transport during Case 3, a process that FLEXPART is well suited to representing.
Figure 8e divided BC into different emission sources. According to FLEXPART, biomass burning (BB) contributed significantly to periods 1–3, especially period 2. BC concentrations from BB reached their highest values with increasing contributions from Asia and Russia, while transport (TRA) and domestic (DOM) emissions increased during period 3 simultaneously with an increasing contribution from Europe (Fig. 8d). The median and mean BB% from the aethalometer were 24.55 % and 24.01 ± 9.05 % during Case 3, and its evolution during periods 1–3 appeared to be rather constant, not following the FLEXPART BB signal. On the other hand, the evolution of the eBC concentration is well comparable with the FLEXPART signal from the domestic sector. A discrepancy between BB% and FLEXPART's BB concentration could potentially arise from the fact that, while FLEXPART clearly distinguishes between BB and DOM, the signal is most probably mixed in the aethalometer measurement.
The mean NOx mixing ratio measured at the DCE station during this case was 13.30 ± 8.46 ppb, with a median value of 10.94 ppb, which was lower than that throughout the whole campaign period (17.96 ± 17.31 ppb; median: 12.25 ppb). Similarly, the mean CO concentration was 0.16 ± 0.03 ppm, and the median value is 0.152 ppb; these are thus comparable to the mean and median values of the whole period (0.18 ± 0.055 ppm; median: 0.165 ppm). Figure S16 shows that NOx decreased sharply to below 5 ppm around 00:00 LT on 8 April (period 2) and then increased again. However, the eBC concentration continually increased, while the NOx concentration decreased. This suggests that the BC was likely to be transported from other regions, as FLEXPART suggested, such as Asia and Russia, instead of being emitted locally. During period 3, the NOx and eBC concentrations increased drastically, indicating that the pollutants were derived from local emissions. This is consistent with the BC results from the FLEXPART model and the increased contribution from Europe during this period.
Aerosol properties were investigated during 5 weeks from March to mid-April 2023 at the coastal site of Aarhus Bay, Denmark. Aerosol absorption and scattering coefficients, as well as size distributions, were continuously monitored to investigate the aerosol type and to infer the main aerosol sources during the selected period. Specifically, the study aimed to assess the importance of anthropogenic vs. natural, including marine, sources at this coastal area. Additionally, a comparison to footprint, air mass source, and age analysis with the FLEXPART model was carried out.
Scattering and absorption coefficients were relatively low during the whole period (σsca: median: 20.24 Mm−1, σabs: median: 3.06 Mm−1 at λ = 525 nm), similarly to what was found in other Scandinavian locations (Genberg, 2012; Roldin, 2012; Tørseth et al., 2012), and were lower compared to Mediterranean coastal cities (Donateo et al., 2020). SSA varied from 0.28 to 0.9, pointing to periods with both highly absorbing, most likely anthropogenic influences and highly scattering, potentially marine influences. The wavelength dependence of absorption highlighted a substantial impact from biomass burning aerosols (BB%) of 22.40 % (median). This can be attributed to emissions from domestic fireplaces, which are common in the Aarhus area (Plejdrup et al., 2021). The wavelength dependence of the scattering coefficient showed large variability due to changes in the particle size distribution. This was corroborated by the recorded size spectra showing periods with high number concentrations and, mostly, small sizes and several periods with lower number concentrations and particle diameters above 1 µm. Compared to a Mediterranean coastal city during a similar period, particles in Aarhus appeared to be, on average, larger (Donateo et al., 2020). Daily patterns in Aarhus Bay revealed a diurnal variation related to traffic and biomass burning emissions detected in the absorption coefficients during both weekdays and weekends. Interestingly, scattering coefficients revealed a pattern only during weekends, with the highest scattering coefficients during the evening hours between 18:00 and 23:00 LT.
Wavelength dependences in scattering and absorption were explored by means of the Ångström matrix and combined with FLEXPART analysis to pinpoint major aerosol sources in Aarhus Bay. Periods with local anthropogenic pollution, highly scattering aerosols, and particles from long-range transport were observed. Using the Ångström classification scheme proposed by (Cappa et al., 2016), aerosols during the whole campaign were 48 % characterized by BC-dominated, 31 % characterized by large-particle/BC mix, 7.7 % characterized by large-particle/low-Abs. mix, 4.3 % characterized by small-particles–low-Abs. mix, 4.2 % characterized by mixed dust/BC/BrC, 4.1 % characterized by mixed BC/BrC, and 0.85 % characterized by strong BrC (see Fig. S3). According to FLEXPART, the mean continental contribution to BC concentrations was ∼ 71 % from Europe, ∼ 10 % from Russia, ∼ 9 % from Asia, ∼ 6 % from North America, ∼ 2 % from Africa, and ∼ 1 % from Central America and the Ocean. Besides, the air mass age as modelled by FLEXPART underscores the mixture of both freshly emitted and several-week-old air masses present in the Aarhus Bay area (see Fig. S18).
In particular, three distinct cases were chosen to describe typical aerosol properties in Aarhus Bay. Case 1 depicts a typical local pollution event, characterized by the highest scattering and absorption coefficients and, simultaneously, strongly elevated NOx and CO mixing ratios. According to the Ångström matrix, most data could be described as BC-dominated and mixed BC/BrC, with a mean of 75 % originating from fossil fuel combustion. Particle number concentrations reached their highest values but contained predominately particle sizes below 500 nm. eBC data compared well with modelled values from FLEXPART, highlighting the large contribution from fossil fuels. FLEXPART analysis showed a clear influence by continental air masses. Case 2 highlights the period with the highest SSA values during the measurement campaign. Both SAE and size distribution measurements indicate the presence of large particles that are mainly described by the large-particle/BC mix area in the Ångström matrix. The higher wind speeds and lower absorption coefficients during the period of Case 2 could indicate a larger contribution by marine particles during this period, which is also suggested by FLEXPART footprint analysis. Case 3 denotes an event with air masses from long-range transport. FLEXPART analysis yielded a larger contribution by the sectors “Russia” and “Asia”, particularly impacting BC concentrations at the beginning of Case 3, which were characterized by smaller particles, as evidenced by smaller SAE values, compared to local events dominated by the “Europe” sector.
All raw and analysed measurement data are available from the Zenodo repository https://doi.org/10.5281/zenodo.19061033 (Rosati, 2026). The FLEXPART model results are available through https://atmo-access.nilu.no/BRosati.py (last access: 24 February 2026) or upon request to Nikolaos Evangeliou (e-mail: ne@nilu.no) or Sabine Eckhardt (e-mail: sec@nilu.no).
The supplement related to this article is available online at https://doi.org/10.5194/ar-4-169-2026-supplement.
BR designed and supervised the research. ZT, JST, and BR conducted field experiments. ZT analysed the scattering and absorption measurements. JTS analysed the spectrometer measurements and performed loss calculations. NE and SE performed FLEXPART simulations. BR, AM, HS, and MB contributed to interpreting the results. ZT, JTS, and BR wrote the paper with contributions from all of the co-authors. All of the authors read and reviewed the paper.
The contact author has declared that none of the authors has any competing interests.
Publisher's note: Copernicus Publications remains neutral with regard to jurisdictional claims made in the text, published maps, institutional affiliations, or any other geographical representation in this paper. The authors bear the ultimate responsibility for providing appropriate place names. Views expressed in the text are those of the authors and do not necessarily reflect the views of the publisher.
The aethalometer (AE33, Aerosol Magee Scientific) was loaned from Villum Research Station. We would like to thank Peter Ravn and Torben Sigsgaard for their support with the offline measurements and Henrik Birkedal for loaning the microscope. We acknowledge the support of the Center of Excellence for Chemistry of Clouds (C3). FLEXPART simulations are cross-atmospheric research infrastructure services provided by ATMO-ACCESS. The computations/simulations were performed on resources provided by Sigma2 – the National Infrastructure for High Performance Computing and Data Storage in Norway. We acknowledge the Danish Ministry of Environment and Department of Environmental Science at Aarhus University for collecting and providing the NOx and CO data and support for this study. Additionally, we acknowledge the Danish Meteorological Institute for providing the meteorology data.
This research has been supported by the Villum Fonden (grant no. 42128), the Novo Nordisk Foundation (grant no. NNF19OC0056963), the Danmarks Grundforskningsfond (grant no. DNRF172), and the EU Horizon 2020 (grant no. ATMO-ACESS 101008004).
This paper was edited by Daniele Contini and reviewed by two anonymous referees.
Ahlberg, E., Ausmeel, S., Nilsson, L., Spanne, M., Pauraite, J., Klenø Nøjgaard, J., Bertò, M., Skov, H., Roldin, P., Kristensson, A., Swietlicki, E., and Eriksson, A.: Measurement report: Black carbon properties and concentrations in southern Sweden urban and rural air – the importance of long-range transport, Atmos. Chem. Phys., 23, 3051–3064, https://doi.org/10.5194/acp-23-3051-2023, 2023. a, b, c
Ångström, A.: On the Atmospheric Transmission of Sun Radiation and on Dust in the Air, Geogr. Ann., 11, 156–166, https://doi.org/10.1080/20014422.1929.11880498, 1929. a
Andrews, E., Sheridan, P. J., Fiebig, M., McComiskey, A., Ogren, J. A., Arnott, P., Covert, D., Elleman, R., Gasparini, R., Collins, D., Jonsson, H., Schmid, B., and Wang, J.: Comparison of methods for deriving aerosol asymmetry parameter, J. Geophys. Res.-Atmos., 111, https://doi.org/10.1029/2004JD005734, 2006. a
Bahadur, R., Praveen, P. S., Xu, Y., and Ramanathan, V.: Solar absorption by elemental and brown carbon determined from spectral observations, P. Natl. Acad. Sci. USA, 109, 17366–17371, https://doi.org/10.1073/pnas.1205910109, 2012. a, b
Barman, N., Kundu, S. S., and Borgohain, A.: Observation and model simulation of aerosol optical properties and size distribution over the hilly terrain of Northeast India, Aerosol Science and Engineering, 8, 319–335, https://doi.org/10.1007/s41810-024-00225-9, 2024. a
Bellouin, N., Boucher, O., Haywood, J., and Reddy, M. S.: Global estimate of aerosol direct radiative forcing from satellite measurements, Nature, 438, 1138–1141, https://doi.org/10.1038/nature04348, 2005. a
Bergstrom, R. W., Russell, P. B., and Hignett, P.: Wavelength Dependence of the Absorption of Black Carbon Particles: Predictions and Results from the TARFOX Experiment and Implications for the Aerosol Single Scattering Albedo, AMS, J. Atmos. Sci., https://doi.org/10.1175/1520-0469(2002)059<0567:WDOTAO>2.0.CO;2, 2002. a
Bohren, C. F. and Huffman, D. R.: Absorption and scattering of light by small particles, John Wiley & Sons, ISBN 9783527618156, https://doi.org/10.1002/9783527618156, 2008. a, b
Bond, T. C. and Bergstrom, R. W.: Light Absorption by Carbonaceous Particles: An Investigative Review, Aerosol Sci. Tech., 40, 27–67, https://doi.org/10.1080/02786820500421521, 2006. a
Bond, T. C., Doherty, S. J., Fahey, D. W., Forster, P. M., Berntsen, T., DeAngelo, B. J., Flanner, M. G., Ghan, S., Kärcher, B., Koch, D., Kinne, S., Kondo, Y., Quinn, P. K., Sarofim, M. C., Schultz, M. G., Schulz, M., Venkataraman, C., Zhang, H., Zhang, S., Bellouin, N., Guttikunda, S. K., Hopke, P. K., Jacobson, M. Z., Kaiser, J. W., Klimont, Z., Lohmann, U., Schwarz, J. P., Shindell, D., Storelvmo, T., Warren, S. G., and Zender, C. S.: Bounding the role of black carbon in the climate system: A scientific assessment, J. Geophys. Res.-Atmos., 118, 5380–5552, https://doi.org/10.1002/jgrd.50171, 2013. a
Böttcher, K., Paunu, V.-V., Kupiainen, K., Zhizhin, M., Matveev, A., Savolahti, M., Klimont, Z., Väätäinen, S., Lamberg, H., and Karvosenoja, N.: Black carbon emissions from flaring in Russia in the period 2012–2017, Atmos. Environ., 254, 118390, https://doi.org/10.1016/j.atmosenv.2021.118390, 2021. a
Cappa, C. D., Kolesar, K. R., Zhang, X., Atkinson, D. B., Pekour, M. S., Zaveri, R. A., Zelenyuk, A., and Zhang, Q.: Understanding the optical properties of ambient sub- and supermicron particulate matter: results from the CARES 2010 field study in northern California, Atmos. Chem. Phys., 16, 6511–6535, https://doi.org/10.5194/acp-16-6511-2016, 2016. a, b, c, d
Cassiani, M., Stohl, A., and Brioude, J.: Lagrangian stochastic modelling of dispersion in the convective boundary layer with skewed turbulence conditions and a vertical density gradient: Formulation and implementation in the FLEXPART model, Bound.-Lay. Meteorol., 154, 367–390, https://doi.org/10.1007/s10546-014-9976-5, 2015. a
Cazorla, A., Bahadur, R., Suski, K. J., Cahill, J. F., Chand, D., Schmid, B., Ramanathan, V., and Prather, K. A.: Relating aerosol absorption due to soot, organic carbon, and dust to emission sources determined from in-situ chemical measurements, Atmos. Chem. Phys., 13, 9337–9350, https://doi.org/10.5194/acp-13-9337-2013, 2013. a, b, c
Clarke, A., Kapustin, V., Howell, S., Moore, K., Lienert, B., Masonis, S., Anderson, T., and Covert, D.: Sea-salt size distributions from breaking waves: Implications for marine aerosol production and optical extinction measurements during SEAS, J. Atmos. Ocean. Tech., 20, 1362–1374, https://doi.org/10.1175/1520-0426(2003)020<1362:SSDFBW>2.0.CO;2, 2003. a, b
Cosby, A., Lebakula, V., Smith, C., Wanik, D., Bergene, K., Rose, A., Swanson, D., and Bloom, D.: Accelerating growth of human coastal populations at the global and continent levels: 2000–2018, Sci. Rep., 14, https://doi.org/10.1038/s41598-024-73287-x, 2024. a
Costabile, F., Barnaba, F., Angelini, F., and Gobbi, G. P.: Identification of key aerosol populations through their size and composition resolved spectral scattering and absorption, Atmos. Chem. Phys., 13, 2455–2470, https://doi.org/10.5194/acp-13-2455-2013, 2013. a, b
Dall'Osto, M., Ceburnis, D., Martucci, G., Bialek, J., Dupuy, R., Jennings, S. G., Berresheim, H., Wenger, J., Healy, R., Facchini, M. C., Rinaldi, M., Giulianelli, L., Finessi, E., Worsnop, D., Ehn, M., Mikkilä, J., Kulmala, M., and O'Dowd, C. D.: Aerosol properties associated with air masses arriving into the North East Atlantic during the 2008 Mace Head EUCAARI intensive observing period: an overview, Atmos. Chem. Phys., 10, 8413–8435, https://doi.org/10.5194/acp-10-8413-2010, 2010. a
Donateo, A., Feudo, T. L., Marinoni, A., Calidonna, C. R., Contini, D., and Bonasoni, P.: Long-term observations of aerosol optical properties at three GAW regional sites in the Central Mediterranean, Atmos. Res., 241, 104976, https://doi.org/10.1016/j.atmosres.2020.104976, 2020. a, b, c, d, e, f, g, h, i
Drinovec, L., Močnik, G., Zotter, P., Prévôt, A. S. H., Ruckstuhl, C., Coz, E., Rupakheti, M., Sciare, J., Müller, T., Wiedensohler, A., and Hansen, A. D. A.: The “dual-spot” Aethalometer: an improved measurement of aerosol black carbon with real-time loading compensation, Atmos. Meas. Tech., 8, 1965–1979, https://doi.org/10.5194/amt-8-1965-2015, 2015. a, b, c
Dubovik, O., Holben, B., Eck, T. F., Smirnov, A., Kaufman, Y. J., King, M. D., Tanré, D., and Slutsker, I.: Variability of absorption and optical properties of key aerosol types observed in worldwide locations, J. Atmos. Sci., 59, 590–608, https://doi.org/10.1175/1520-0469(2002)059<0590:VOAAOP>2.0.CO;2, 2002. a, b
Fang, W., Evangeliou, N., Eckhardt, S., Xing, J., Zhang, H., Xiao, H., Zhao, M., and Kim, S.-W.: Increased contribution of biomass burning to haze events in Shanghai since China's clean air actions, Commun. Earth Environ., 4, 310, https://doi.org/10.1038/s43247-023-00979-z, 2023. a
Fang, W., Evangeliou, N., Eckhardt, S., Xiao, H., and Li, H.: Unprecedented shifts in aerosol pollution sources in China under a decade of clean air actions, Commun. Earth Environ., 6, 512, https://doi.org/10.1038/s43247-025-02487-8, 2025. a
Fomba, K. W., Müller, K., van Pinxteren, D., Poulain, L., van Pinxteren, M., and Herrmann, H.: Long-term chemical characterization of tropical and marine aerosols at the Cape Verde Atmospheric Observatory (CVAO) from 2007 to 2011, Atmos. Chem. Phys., 14, 8883–8904, https://doi.org/10.5194/acp-14-8883-2014, 2014. a
Forster, C., Stohl, A., and Seibert, P.: Parameterization of Convective Transport in a Lagrangian Particle Dispersion Model and Its Evaluation, J. Appl. Meteorol. Clim., 46, 403–422, https://doi.org/10.1175/JAM2470.1, 2007. a
Genberg, J.: ACTRIS, EMEP, GAW-WDCA, 2012, Aerosol absorption coefficient at Vavihill, data hosted by EBAS at NILU, https://doi.org/10.48597/7M2A-YGDC, 2012. a, b, c
Grythe, H., Kristiansen, N. I., Groot Zwaaftink, C. D., Eckhardt, S., Ström, J., Tunved, P., Krejci, R., and Stohl, A.: A new aerosol wet removal scheme for the Lagrangian particle model FLEXPART v10, Geosci. Model Dev., 10, 1447–1466, https://doi.org/10.5194/gmd-10-1447-2017, 2017. a
Hansen, A. D., Rosen, H., and Novakov, T.: The aethalometer – an instrument for the real-time measurement of optical absorption by aerosol particles, Sci. Total Environ., 36, 191–196, https://doi.org/10.1016/0048-9697(84)90265-1, 1984. a
Hersbach, H., Bell, B., Berrisford, P., Hirahara, S., Horányi, A., Muñoz-Sabater, J., Nicolas, J., Peubey, C., Radu, R., Schepers, D., Simmons, A., Soci, C., Abdalla, S., Abellan, X., Balsamo, G., Bechtold, P., Biavati, G., Bidlot, J., Bonavita, M., De Chiara, G., Dahlgren, P., Dee, D., Diamantakis, M., Dragani, R., Flemming, J., Forbes, R., Fuentes, M., Geer, A., Haimberger, L., Healy, S., Hogan, R. J., Hólm, E., Janisková, M., Keeley, S., Laloyaux, P., Lopez, P., Lupu, C., Radnoti, G., de Rosnay, P., Rozum, I., Vamborg, F., Villaume, S., and Thépaut, J.-N.: The ERA5 global reanalysis, Q. J. Roy. Meteor. Soc., 146, 1999–2049, https://doi.org/10.1002/qj.3803, 2020. a
Hey, F. M., Minderytė, A., Ugboma, E. A., Evangeliou, N., Eckhardt, S., Pisso, I., Byčenkienė, S., and Stachlewska, I. S.: City-produced and transported black carbon: Synergy of in-situ optical measurements and modeling, Atmos. Res., 334, 108731, https://doi.org/10.1016/j.atmosres.2025.108731, 2026. a
Kaiser, J. W., Heil, A., Andreae, M. O., Benedetti, A., Chubarova, N., Jones, L., Morcrette, J.-J., Razinger, M., Schultz, M. G., Suttie, M., and van der Werf, G. R.: Biomass burning emissions estimated with a global fire assimilation system based on observed fire radiative power, Biogeosciences, 9, 527–554, https://doi.org/10.5194/bg-9-527-2012, 2012. a
Kalivitis, N., Kerminen, V.-M., Kouvarakis, G., Stavroulas, I., Tzitzikalaki, E., Kalkavouras, P., Daskalakis, N., Myriokefalitakis, S., Bougiatioti, A., Manninen, H. E., Roldin, P., Petäjä, T., Boy, M., Kulmala, M., Kanakidou, M., and Mihalopoulos, N.: Formation and growth of atmospheric nanoparticles in the eastern Mediterranean: results from long-term measurements and process simulations, Atmos. Chem. Phys., 19, 2671–2686, https://doi.org/10.5194/acp-19-2671-2019, 2019. a
Kirchstetter, T. W., Novakov, T., and Hobbs, P. V.: Evidence That the Spectral Dependence of Light Absorption by Aerosols Is Affected by Organic Carbon, J. Geophys. Res.-Atmos., 109, https://doi.org/10.1029/2004JD004999, 2004. a
Kivekäs, N., Massling, A., Grythe, H., Lange, R., Rusnak, V., Carreno, S., Skov, H., Swietlicki, E., Nguyen, Q. T., Glasius, M., and Kristensson, A.: Contribution of ship traffic to aerosol particle concentrations downwind of a major shipping lane, Atmos. Chem. Phys., 14, 8255–8267, https://doi.org/10.5194/acp-14-8255-2014, 2014. a
Klimont, Z., Kupiainen, K., Heyes, C., Purohit, P., Cofala, J., Rafaj, P., Borken-Kleefeld, J., and Schöpp, W.: Global anthropogenic emissions of particulate matter including black carbon, Atmos. Chem. Phys., 17, 8681–8723, https://doi.org/10.5194/acp-17-8681-2017, 2017. a
Lee, S., Yoon, S.-C., Kim, S.-W., Kim, Y. P., Ghim, Y. S., Kim, J.-H., Kang, C.-H., Kim, Y. J., Chang, L.-S., and Lee, S.-J.: Spectral dependency of light scattering/absorption and hygroscopicity of pollution and dust aerosols in Northeast Asia, Atmos. Environ., 50, 246–254, https://doi.org/10.1016/j.atmosenv.2011.12.026, 2012. a
Lewis, E. R. and Schwartz, S. E.: Sea salt aerosol production: mechanisms, methods, measurements, and models, vol. 152, American geophysical union, ISBN 9781118666050, https://doi.org/10.1029/GM152, 2004. a
Martinsson, J., Swietlicki, E., and Stenström, K.: Seasonal Variations of Light-Absorbing properties in Atmospheric Aerosols in Southern Sweden, in: LUCCI Annual Report 2013/2014, Lund University, https://portal.research.lu.se/en/publications/seasonal-variations-of-light-absorbing-properties-in-atmospheric-/ (last access: 24 February 2026), 2014. a, b, c, d
Masson-Delmotte, V., Zhai, P., Pirani, A., Connors, S., Péan, C., Berger, S., Caud, N., Chen, Y., Goldfarb, L., Gomis, M., Huang, M., Leitzell, K., Lonnoy, E., Matthews, J., Maycock, T., Waterfield, T., Yelekçi, O., Yu, R., and Zhou, B.: IPCC: Summary for Policymakers, chap. 7, Cambridge University Press, https://doi.org/10.1017/9781009157896.001, 2021. a, b
Matlab, V.: 9.7. 0.1190202 (R2021a), The MathWorks Inc.: Natick, MA, USA, https://www.mathworks.com (last access: 24 February 2026), 2021. a
Mogo, S., Cachorro, V. E., Lopez, J. F., Montilla, E., Torres, B., Rodríguez, E., Bennouna, Y., and de Frutos, A. M.: In situ measurements of aerosol optical properties and number size distributions in a coastal region of Norway during the summer of 2008, Atmos. Chem. Phys., 12, 5841–5857, https://doi.org/10.5194/acp-12-5841-2012, 2012. a, b
Müller, T., Laborde, M., Kassell, G., and Wiedensohler, A.: Design and performance of a three-wavelength LED-based total scatter and backscatter integrating nephelometer, Atmos. Meas. Tech., 4, 1291–1303, https://doi.org/10.5194/amt-4-1291-2011, 2011. a
Nordstrøm, C., Ellermann, T., Brandt, J., Christensen, J., Ketzel, M., Massling, A., Bossi, R., Frohn, L. M., Geels, C., Solvang Jensen, S., Nielsen, O.-K., Winther, M., Bech Poulsen, M., Bjært Sørense, M., Skou Andersen, M., and Sigsgaard, T.: Luftkvalitet 2023, Tech. rep., Aarhus Universitet, DCE – Nationalt Center for Miljø og Energ, ISBN 978-87-7156-906-3, 2024. a
Perrone, M., Romano, S., Genga, A., and Paladini, F.: Integration of optical and chemical parameters to improve the particulate matter characterization, Atmos. Res., 205, 93–106, https://doi.org/10.1016/j.atmosres.2018.02.015, 2018. a, b, c
Pisso, I., Sollum, E., Grythe, H., Kristiansen, N. I., Cassiani, M., Eckhardt, S., Arnold, D., Morton, D., Thompson, R. L., Groot Zwaaftink, C. D., Evangeliou, N., Sodemann, H., Haimberger, L., Henne, S., Brunner, D., Burkhart, J. F., Fouilloux, A., Brioude, J., Philipp, A., Seibert, P., and Stohl, A.: The Lagrangian particle dispersion model FLEXPART version 10.4, Geosci. Model Dev., 12, 4955–4997, https://doi.org/10.5194/gmd-12-4955-2019, 2019. a
Platt, S. M., Hov, Ø., Berg, T., Breivik, K., Eckhardt, S., Eleftheriadis, K., Evangeliou, N., Fiebig, M., Fisher, R., Hansen, G., Hansson, H.-C., Heintzenberg, J., Hermansen, O., Heslin-Rees, D., Holmén, K., Hudson, S., Kallenborn, R., Krejci, R., Krognes, T., Larssen, S., Lowry, D., Lund Myhre, C., Lunder, C., Nisbet, E., Nizzetto, P. B., Park, K.-T., Pedersen, C. A., Aspmo Pfaffhuber, K., Röckmann, T., Schmidbauer, N., Solberg, S., Stohl, A., Ström, J., Svendby, T., Tunved, P., Tørnkvist, K., van der Veen, C., Vratolis, S., Yoon, Y. J., Yttri, K. E., Zieger, P., Aas, W., and Tørseth, K.: Atmospheric composition in the European Arctic and 30 years of the Zeppelin Observatory, Ny-Ålesund, Atmos. Chem. Phys., 22, 3321–3369, https://doi.org/10.5194/acp-22-3321-2022, 2022. a
Plejdrup, M., Nielsen, O.-K., and Christensen, J.: Emission scenarios and air quality modelling for residential wood combustion. Impact analysis of measures for small wood burning appliances in Denmark and effect on transport of black carbon to the Arctic, Tech. Rep. Scientific report no. 426, Aarhus University, DCE – Danish Centre for Environment and Energy, ISBN 978-87-7156-562-1, http://dce2.au.dk/pub/SR426.pdf (last access: 24 February 2026), 2021. a
Pope III, C. A. and Dockery, D. W.: Health effects of fine particulate air pollution: lines that connect, J. Air Waste Manage. Assoc., 56, 709–742, https://doi.org/10.1080/10473289.2006.10464485, 2006. a
Popovicheva, O. B., Evangeliou, N., Kobelev, V. O., Chichaeva, M. A., Eleftheriadis, K., Gregorič, A., and Kasimov, N. S.: Siberian Arctic black carbon: gas flaring and wildfire impact, Atmos. Chem. Phys., 22, 5983–6000, https://doi.org/10.5194/acp-22-5983-2022, 2022. a
Popovicheva, O. B., Chichaeva, M. A., Evangeliou, N., Eckhardt, S., Diapouli, E., and Kasimov, N. S.: Multi-year black carbon observations and modeling close to the largest gas flaring and wildfire regions in the Western Siberian Arctic, Atmos. Chem. Phys., 25, 7719–7739, https://doi.org/10.5194/acp-25-7719-2025, 2025. a
Roldin, P.: EMEP, EUSAAR, GAW-WDCA, 2012, Aerosol light scattering coefficient at Vavihill, data hosted by EBAS at NILU, https://doi.org/10.48597/QGZS-5XKM, 2012. a, b, c
Rosati, B.: Data for paper: Teng and Skønager et al. 2026, “Characterizing aerosol sources based on aerosol optical properties and dispersion modelling in a Scandinavian Coastal Area (Aarhus, Denmark)”, in: Aerosol Research, Zenodo [data set], https://doi.org/10.5281/zenodo.19061033, 2026. a
Sandradewi, J., Prevot, A., Szidat, S., Perron, N., Alfarra, M., Lanz, V., Weingartner, E., and Baltensperger, U.: Using Aerosol Light Absorption Measurements for the Quantitative Determination of Wood Burning and Traffic Emission Contributions to Particulate Matter, Environ. Sci. Technol., 42, 3316–23, https://doi.org/10.1021/es702253m, 2008. a
Seinfeld, J. H. and Pandis, S. N.: Atmospheric Chemistry and Physics: From Air Pollution to Climate Change, 3rd edn., John Wiley & Sons, ISBN 978-1-118-94740-1, 2016. a, b
Stohl, A., Forster, C., Frank, A., Seibert, P., and Wotawa, G.: Technical note: The Lagrangian particle dispersion model FLEXPART version 6.2, Atmos. Chem. Phys., 5, 2461–2474, https://doi.org/10.5194/acp-5-2461-2005, 2005. a
Suchánková, L., Mbengue, S., Zíková, N., Šmejkalová, A. H., Prokeš, R., Holoubek, I., and Ždímal, V.: A seven-year-based characterization of aerosol light scattering properties at a rural central European site, Atmos. Environ., 319, 120292, https://doi.org/10.1016/j.atmosenv.2023.120292, 2024. a
Takemura, T., Nakajima, T., Dubovik, O., Holben, B. N., and Kinne, S.: Single-Scattering Albedo and Radiative Forcing of Various Aerosol Species with a Global Three-Dimensional Model, J. Climate, 15, 333–352, https://doi.org/10.1175/1520-0442(2002)015<0333:SSAARF>2.0.CO;2, 2002. a
Tørseth, K., Aas, W., Breivik, K., Fjæraa, A. M., Fiebig, M., Hjellbrekke, A. G., Lund Myhre, C., Solberg, S., and Yttri, K. E.: Introduction to the European Monitoring and Evaluation Programme (EMEP) and observed atmospheric composition change during 1972–2009, Atmos. Chem. Phys., 12, 5447–5481, https://doi.org/10.5194/acp-12-5447-2012, 2012. a, b
Vignati, E., de Leeuw, G., Schulz, M., and Plate, E.: Characterization of aerosols at a coastal site near Vindeby (Denmark), J. Geophys. Res.-Oceans, 104, 3277–3287, https://doi.org/10.1029/1998JC900019, 1999. a
von der Weiden, S.-L., Drewnick, F., and Borrmann, S.: Particle Loss Calculator – a new software tool for the assessment of the performance of aerosol inlet systems, Atmos. Meas. Tech., 2, 479–494, https://doi.org/10.5194/amt-2-479-2009, 2009. a
Worm, K.: Coastal zone planning in Denmark, Ocean Coast. Manage., 37, 253–268, https://doi.org/10.1016/S0964-5691(00)89026-2, 1997. a
Yttri, K. E., Bäcklund, A., Conen, F., Eckhardt, S., Evangeliou, N., Fiebig, M., Kasper-Giebl, A., Gold, A., Gundersen, H., Myhre, C. L., Platt, S. M., Simpson, D., Surratt, J. D., Szidat, S., Rauber, M., Tørseth, K., Ytre-Eide, M. A., Zhang, Z., and Aas, W.: Composition and sources of carbonaceous aerosol in the European Arctic at Zeppelin Observatory, Svalbard (2017 to 2020), Atmos. Chem. Phys., 24, 2731–2758, https://doi.org/10.5194/acp-24-2731-2024, 2024. a
Zhang, Z., Li, J., Che, H., Dong, Y., Dubovik, O., Eck, T., Gupta, P., Holben, B., Kim, J., Lind, E., Saud, T., Tripathi, S. N., and Ying, T.: Long-term trends in aerosol properties derived from AERONET measurements, Atmos. Chem. Phys., 25, 4617–4637, https://doi.org/10.5194/acp-25-4617-2025, 2025. a