the Creative Commons Attribution 4.0 License.
the Creative Commons Attribution 4.0 License.
 | 19 Jun 2026
An intercomparison study of optical particle size spectrometers for aerosol number size distribution measurements
Vincent Crenn
Joris Leglise
Sébastien Jacquinot
Christophe Debert
Denis Petitprez
Valentine Bizet
Lara Leclerc
Alain Miffre
Danael Cholleton
Alec Rose
Alexandre Tomas
Amel Kort
Didier Hebert
Aurélie Joubert
Florence Deschamps
Sébastien Ritoux
Lyes Ait Ali Yahia
François Gaie-Levrel
An inter-laboratory comparison (ILC) involving optical particle size spectrometers (OPSSs) was organised at the French national level. The aim of this study was to make an inventory of the metrological capabilities of particle number size distribution (PNSD) measurements using OPSSs. This laboratory study was conducted over an 18-month period and involved 16 partners and 35 OPSSs. This large number of instruments provides strong statistical weight to the dataset, offering robust insight into the overall instrumental capabilities of accurately and reliably measuring PNSD. For that, each partner applied the same pre-defined experimental protocol to the OPSS(s) to be tested, operated together with a common control OPSS. Three different test aerosols were involved, and their PNSDs were measured: (1) a monodisperse amorphous silica sample, (2) glass beads, and (3) a green cornstarch powder. This article presents the measured PNSD using the 35 OPSSs associated with the description of the experimental set-up, sample preparation protocol, and comparison with scanning electron microscopy measurements.
- Article
(1208 KB) - Full-text XML
- BibTeX
- EndNote


Optical particle size spectrometers (OPSSs) are widely used to measure particle number size distributions. Their response is based on the light scattered by particles, which occurs when a laser beam of defined wavelength interacts with focused particles. Each resulting detected scattered laser pulse corresponds to the occurrence of a particle, which allows temporal monitoring of the particle number concentration. The intensity of the scattered light at a given scattering angle is then analysed for each pulse to evaluate particle size. The latter is therefore expressed as an optical equivalent diameter (dopt) which corresponds to the diameter of a spherical particle that scatters the same light intensity as the one scattered by a particle of a given refractive index, thus applying the Mie theory. As a result, after calibration by applying the Mie theory, OPSSs allow particle number size distribution (PNSD) measurements in real-time for particle sizes ranging from ∼ 200 nm up to ∼ 10 µm. Their wide measurement range and fast response time make them well suited for ground-based measurements, as well as for aircraft measurements (Ortega et al., 2019). More recently, these instruments have also been increasingly used for workplace and indoor air quality monitoring (Maragkidou et al., 2018). However, these optical methods are dependent on particle size, shape, and refractive index. Accurate light-scattering theories do not exist for complex particles, for which the Mie theory appears as an approximation (Mishchenko et al., 2002). For this reason, downstream use of calibration factors is required, e.g. for converting number size distributions into mass concentrations.
Accurate particle size distributions require careful calibration of the OPSS detection efficiency against primary standards for particle number concentration. Size calibration is typically performed using spherical, non-absorbing polystyrene particles with well-defined diameters and refractive indices (ISO 21501-1, 2025; ISO 21501-4, 2018). However, indoor, environmental and/or workplace aerosols consist of particles with varying shapes and sizes and complex refractive indices. Interestingly, very few OPSS inter-laboratory comparisons (ILCs) were performed over the last 50 years. In their work, Hindman Ii et al. (1978) performed a field comparison of PNSD measurements involving six OPSSs. Systematic differences between the measurements from the various instruments were smallest for sub-micron particles by a factor of 1.5–2.5 and largest for micron particles by a factor of 8–15. More than 40 years later, Vasilatou et al. (2020) presented a first inter-laboratory comparison for low particle number concentrations dedicated to clean room facilities. Their study was conducted for particle sizes ranging from 300 nm up to 5 µm and for number concentrations up to 2 particles cm−3 using polystyrene latex (PSL) spheres and sodium chloride and/or lactose monohydrate aerosols. Such ILCs involved non-transportable facilities for the use of primary methods for measuring particle number concentrations in accordance with the full requirements of the ISO 21501-4 standard (Horender et al., 2019; ISO 21501-4, 2018). For that reason, the authors used OPSSs as transfer standards that were shipped to all participants. They showed that all particle sizes agreed with the reference value within 7 % and were therefore compatible with the stated uncertainties. Meanwhile, Iida and Sakurai (2018) presented a new methodology for evaluating the OPSS counting efficiencies based on an ink jet aerosol generator, which allowed the production of monodisperse particles at a constant rate with lactose monohydrate, ionic liquid, and sodium chloride. Nevertheless, as also stated by Vasilatou et al. (2020), the metrological basis of this study remains incomplete since the degree of equivalence was investigated by means of inter-laboratory comparisons. As a result, to the best of our knowledge, no ILC exists involving OPSSs for measuring PNSD, while such optical size spectrometers are used every day worldwide, and precision is needed when precise air quality assessment is sought.
In this context, the present work aims to present the methodology and the results of an ILC involving a large number of OPSSs (35) for measuring PNSD by focusing on the same three test aerosols. This work does not consist of instrument calibration, but this will be considered as a possible metrological control, accounting for the statistical weight provided by the large ensemble of instruments implied. This ILC was conducted as a continuation of a previous study carried out on electrical mobility spectrometers (Gaie-Levrel et al., 2020) in which we stated that “new intercomparison studies on aerosol particle size distribution measurements will be organised by involving optical, aerodynamic, and electrical mobility sizers using a common transportable control aerosol generator circulated among participants, following an approach similar to that proposed by Gaie-Levrel et al. (2018) for particle mass concentration measurements”. We seized the opportunity of the French network, built through previous cooperations and conferences, to carry out this ILC at a national scale, thus involving 16 research groups. The overall objective of this study was to make an inventory of the metrological capabilities of various OPSS measurement techniques, with the idea to provide robust insight into their instrumental accuracy and to establish both a methodology and a first dataset for improving their reliability. Since this work is not a calibration study, no reference devices (e.g. SMPS, APS, AAC-CPC) were used for validation, and no polystyrene standards were used. Indeed, experiments were carried out using three aerosol samples: (1) a monodisperse amorphous silica sample, (2) glass beads, and (3) a green cornstarch powder. There was no intention to generate test aerosols that would be representative of specific ones, e.g. a typical urban atmospheric aerosol. Instead, one of our objectives was to investigate the possibility of producing the same aerosols in the different laboratories involved by using an accessible generation set-up using a dry-based method as this seemed to make it easier to provide the powders to all partners. To minimise biases, the dry-based aerosol generator involved in this work was identical for each partner and was completed with a common running-control OPSS.
2.1 Experimental set-up
Inter-laboratory comparisons are usually constrained by the difficulty of moving instruments at the same location at the same time. The strategy chosen in this study was to use a unique laboratory experimental set-up, involving a common dry-aerosol generator and a control OPSS, which were sent to each participant prior to the experiments. A total of 16 partners took part in this inter-comparison exercise and received every part in order to build the experimental set-up in their own laboratories, as presented in Fig. 1.
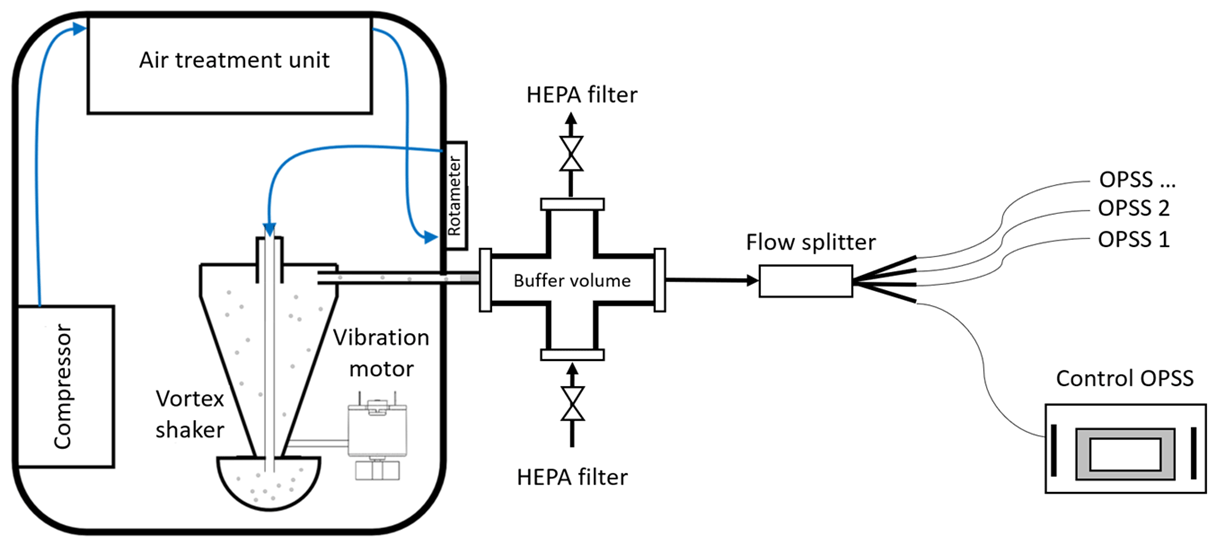
The aerosol generator is based on the principle of a vortex shaker (VS-1000, ADDAIR, patent WO2013092816; Leglise et al., 2022). Within the generator, the filtered and dried air is injected from the upper part directly into the vortex mixer receptacle containing the powder sample to be aerosolised. The injection rod internal dimension is selected such that the flow in the receptacle is turbulent. The whole structure is connected to a vibrating motor with an eccentric mass to ensure stable and efficient agitation. The second zone, conical in shape, is subjected to an upward flow where the particles are selected according to their size by vertical elutriation. The air injection flow rate was set to be 4 L min−1 for this study, and the vibration frequency was set at 60 Hz (∼ 12 V). A homogenisation volume was coupled downstream of the generator in order to smooth temporal instabilities and to dilute the produced aerosols according to the total instrumental flow rate (Fig. 1). A four-way flow splitter (TSI model 3708) was involved to allow the use of multiple instruments in parallel, including the control OPSS. The latter was used as a common control measurement device (FIDAS Mobile, PALAS) in order to provide measurements with the same instrument in each laboratory in parallel to the OPSSs tested by each partner. Through the 16 partners involved, 35 optical instruments were included in this inter-laboratory comparison, involving OPSSs with different technical specifications, as presented in Table 1. The control instrument was freshly calibrated, and its performances were verified periodically throughout the ILC exercise. The choice of the control instrument mainly relied on its availability over the ILC period, as well as its high size resolution (64 channels), as stated in Table 1. Since there was no intention of including exclusively freshly calibrated instruments, the latter were categorised according to the time delay between their last calibration and the date of the experiments. A total of 40 % of the instruments had been calibrated less than 1 year prior to the experiments, 26 % had been conducted between 1 and 2 years prior to the experiments, and 34 % had been calibrated more than 2 years prior to the experiments. To limit coincidental measurement artefacts and to allow higher particle concentrations to be measured, a controlled sheath air flow can be included in the instrument design, as stated in Table 1.
Table 1OPSS types implicated in the present intercomparison study.
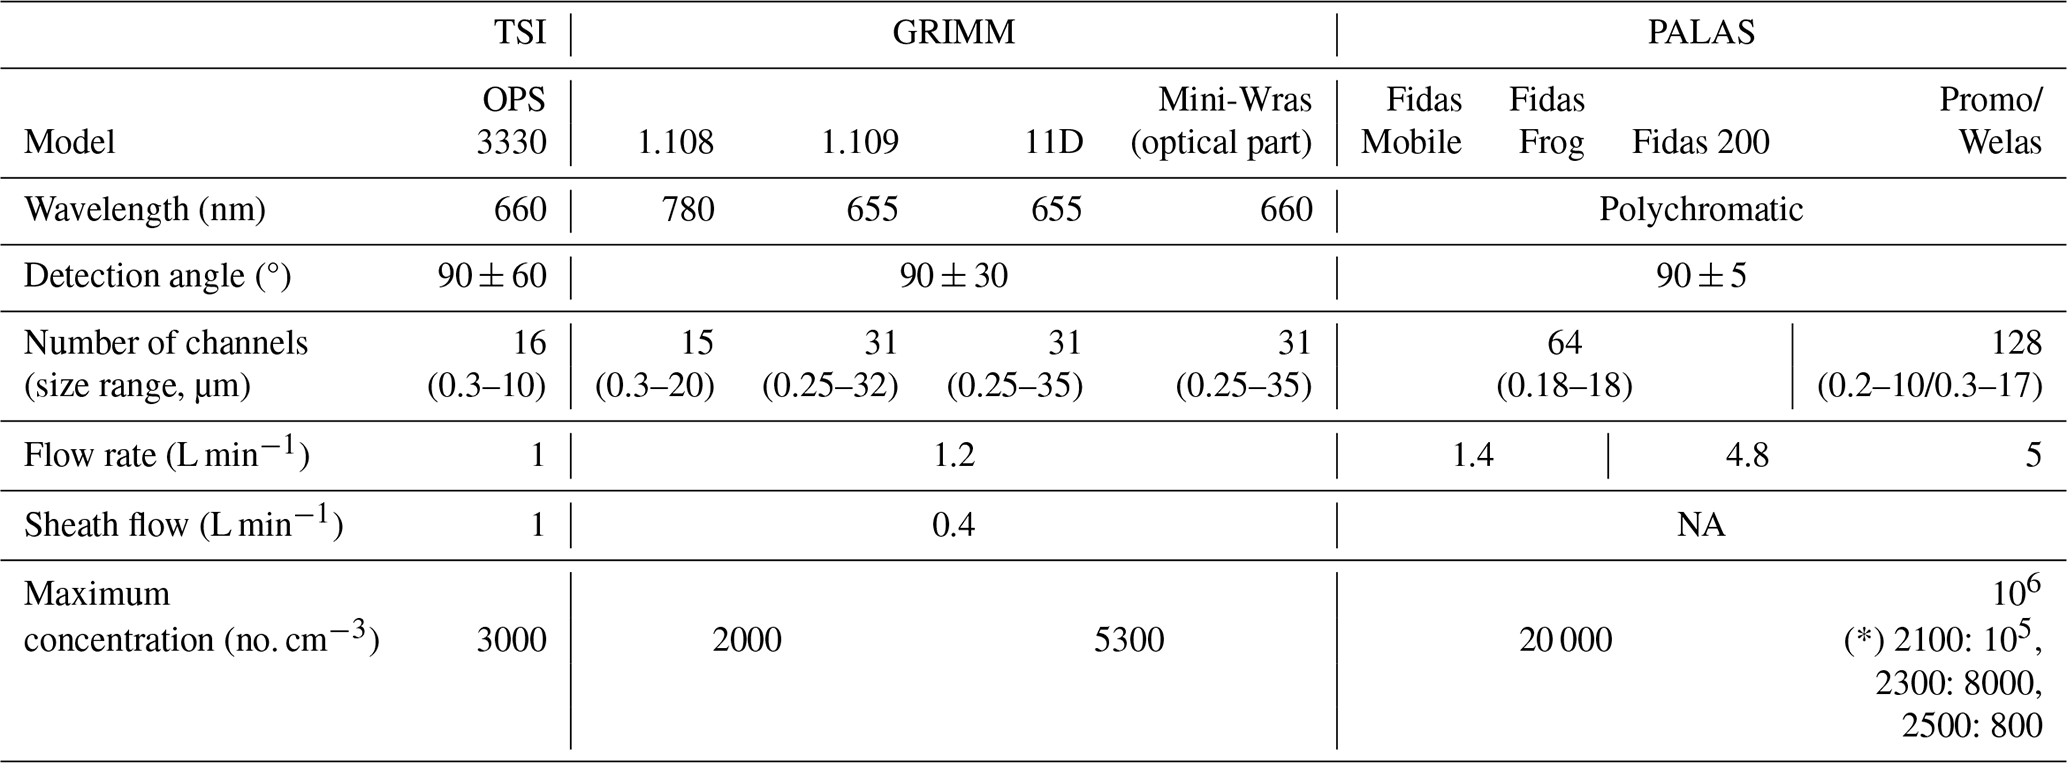
(*) Maximum concentration for 10 % coincidence error depending on measurement cell reference.
2.2 Samples, preparation protocol, and data acquisition
Three different test aerosols were investigated:
-
A monodisperse amorphous silica (Angströmsphere), 0.5 µm in size, was used as a control sample, allowing us to verify the instrumental accuracy and to adjust measurements when required. This silica sample has already been studied in the past to determine its refractive index, i.e. 1.45 (Hubert et al., 2017). This sample is hereafter labelled as the A sample or sample A.
-
Glass beads, which are named Spheriglass 5000CP00 (Potters), with a refractive index in the range of 1.9 to 2.2, were used as the second sample. This sample is hereafter labelled as the B sample or sample B.
-
A coloured cornstarch powder, called green Holi powder (colour people), with a refractive index around 1.6, was used as the third sample. This sample is hereafter labelled as the C sample or sample C.
While sample A consists of calibrated monodisperse particles in the low particle size range of OPSSs, sample B consists of polydisperse spherical particles with a refractive index close to the one of calibration PSL particles (1.59). Sample C is the most complex test aerosol, with polydisperse particles with non-spherical morphology. About 0.5 L of each powder (commercially available) was acquired, subsampled, provided to each participant, and stored at room temperature and protected from light. The preparation protocols for powder samples to be analysed were deliberately basic to be performed as simply as possible.
Figure 2 shows a typical scanning electron microscopy (SEM) image of airborne particles sampled on a carbon transmission electron microscopy (TEM) grid from each aerosol produced using the experimental set-up presented in Fig. 1 and using the Mini Particle Sampler (MPS) (R'Mili et al., 2013; Xiang et al., 2021) for these three samples.
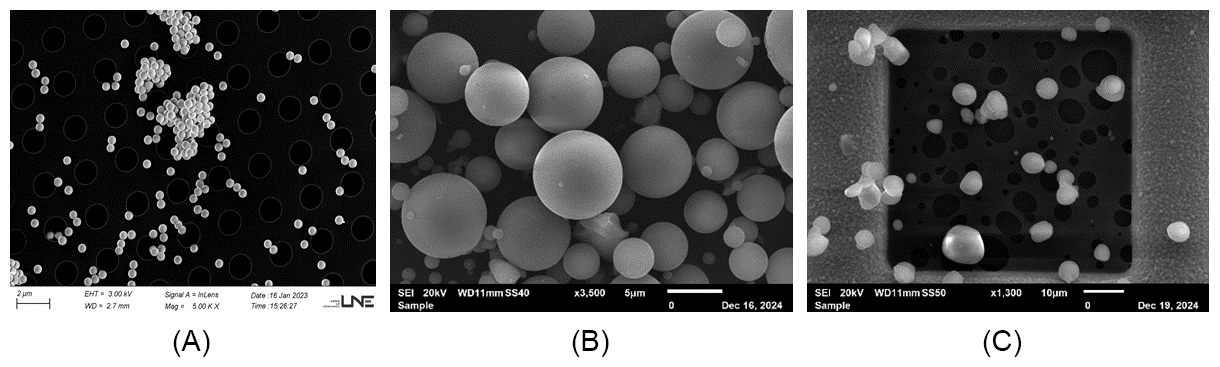
Figure 2SEM images for the three powder samples, i.e. (A) monodisperse silica, (B) glass beads, and (C) Holi powder.
From these SEM images, particle sizes were found to be 0.486 ± 0.015 µm for monodisperse amorphous silica, 4.06 ± 2.792 µm for Spheriglass, and 4.117 ± 0.899 µm for Holi powder. It is worth noting that SEM measurements correspond to the geometrical diameter of particles, which may be different from the equivalent optical diameter reported by OPSSs.
Regarding data acquisition, each partner was required to record PNSDs with a 10 s acquisition time per sample and a total duration of 10 min. A blank measurement was performed between samples. Each participant was responsible for the use of each OPSS under “good laboratory practice” conditions, particularly by ensuring (i) the absence of internal errors reported by the devices, including coincidence errors, and (ii) the lowest particle losses through tubing that was as short and as straight as possible between the flow splitter and the OPSSs involved.
3.1 Reference number size distributions
For each of the three test aerosols, all PNSDs measured by each partner with the control OPSS were used to calculate the averaged PNSD resulting from all measurements. Figure 3 presents the corresponding averaged PNSD for the three test aerosols. The presence of submicron particles for samples B and C, also visible in the SEM pictures provided in Fig. 2, could be linked to powder synthesis process or physical frictions between grains (attrition).
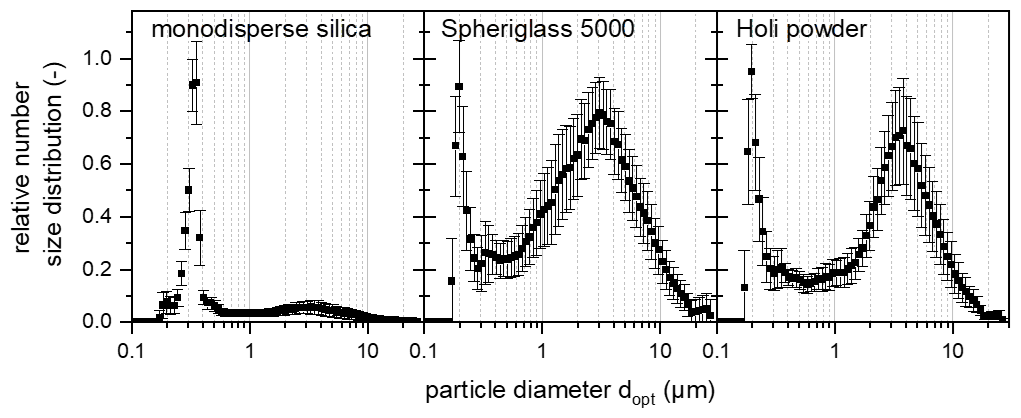
Figure 3Average relative particle number size distributions measured by the control Fidas mobile instrument for the three powder samples. Error bars correspond to calculated standard deviations.
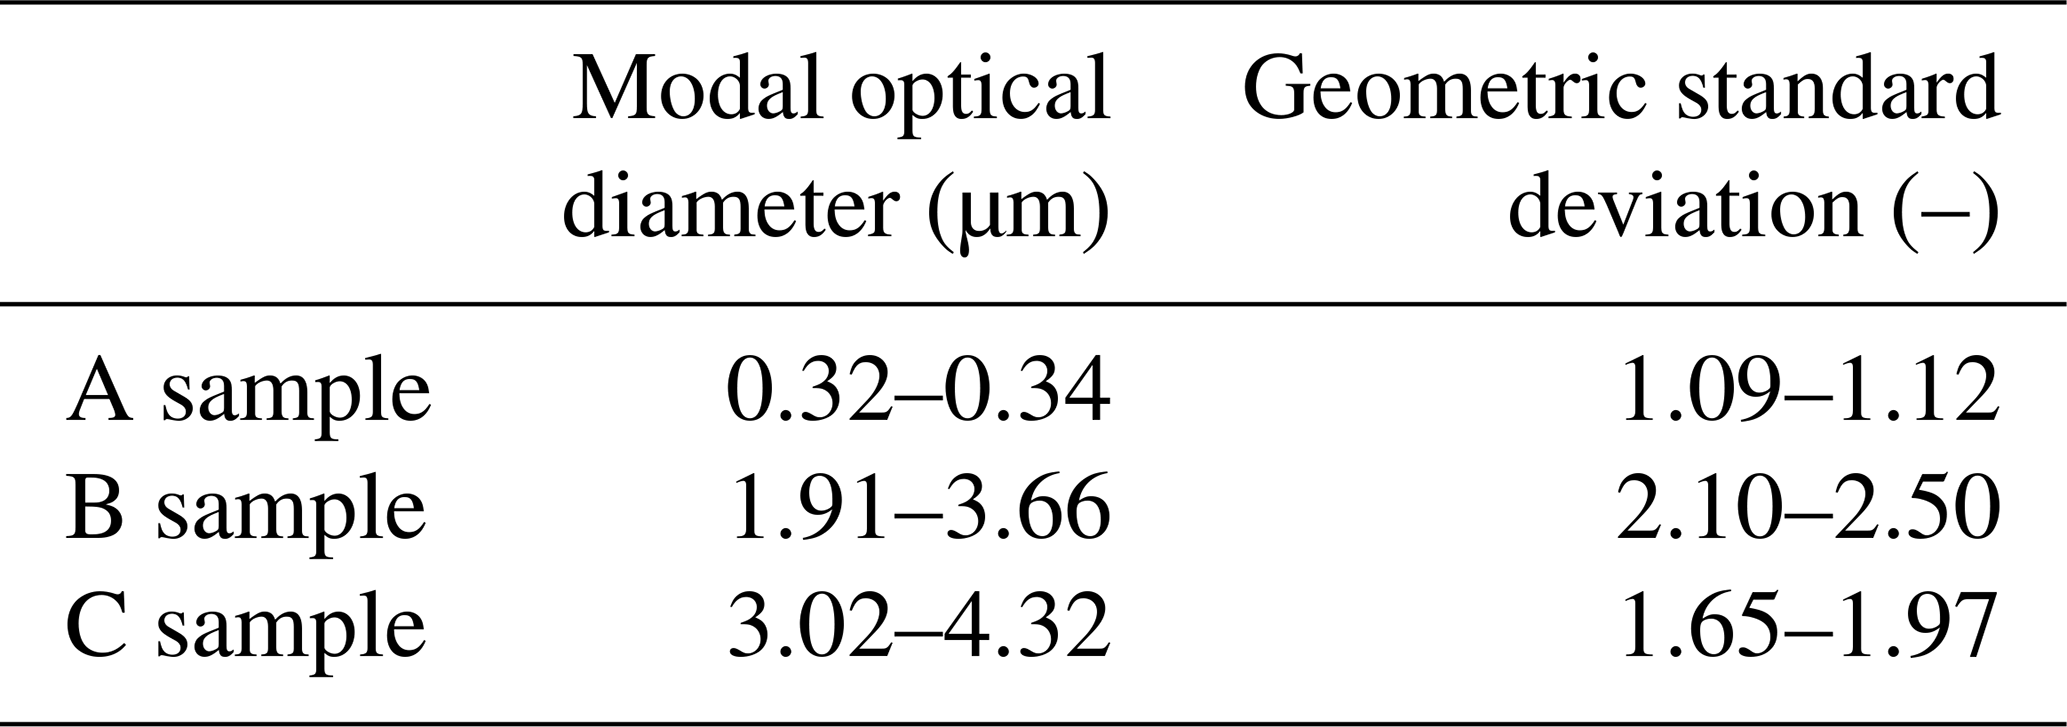
PNSDs were fitted with a lognormal law (OriginPro 2023), allowing the modal diameter and geometric standard deviation to be determined for each replicate; the characteristics of the PNSDs measured by the control OPSS are given in Table 2.
Table 2The 90 % confidence intervals of the measured PNSD from the control OPSS.
It is important to note that the default of accordance between SEM-based (Fig. 2 and Sect. 2.2) and OPSS-based modal diameter measurements can be due to the fact that SEM images provide a geometric diameter, whereas OPSSs return an equivalent optical diameter, i.e. the diameter of a particle with given refractive index that diffuses the same light intensity as the particle.
3.2 PNSD comparison and Z scoring
Since the total flow rate in the set-up is dependent on the number and types of OPSSs involved by each partner, it was not possible to compare the total number concentrations. For that reason, data processing and interpretation are based on the relative number size distributions (i.e. log dopt). In this study, modal diameters and geometric standard deviations (GSDs) obtained from lognormal fits were considered, along with the corresponding determination coefficients (R2) characterising the goodness of fit of the lognormal model for three different aerosols. The results are present in Fig. 4 for silica, Fig. 5 for Spheriglass, and Fig. 6 for Holi. In these figures, the grey area represents the 90 % confidence interval of both the modal diameter and GSD given in Table 2, thus providing a reference range for assessing inter-instrument agreement. Error bars presented in Figs. 4–6 for each OPSS involved correspond to the 95 % confidence interval on modal diameters and GSDs stemming from the lognormal fitting procedure.
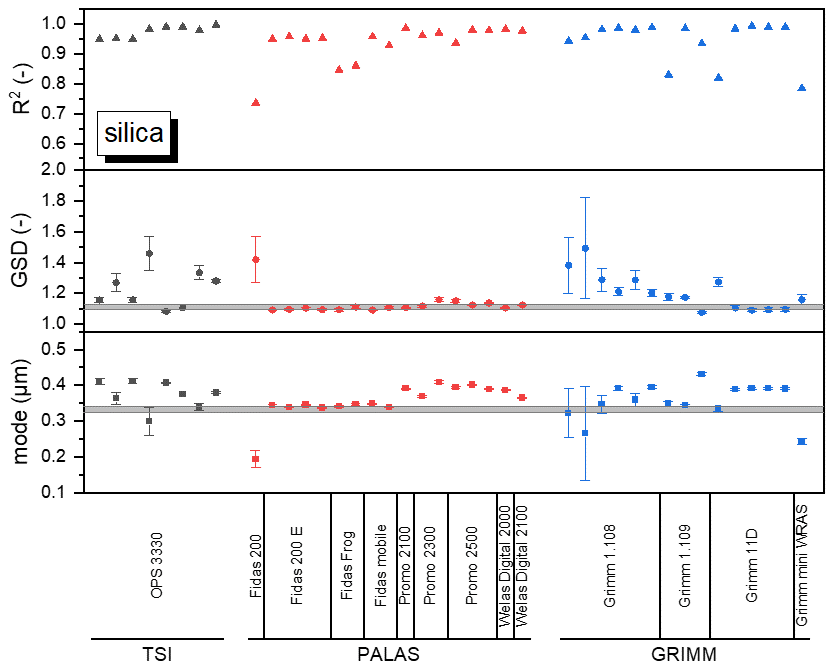
Figure 4PNSD parameters (mode, GSD) and lognormal model fit quality (R2) for monodisperse silica for the different instruments involved in the ILC. The grey area corresponds to the 90 % confidence interval of the parameters obtained with the control instrument.
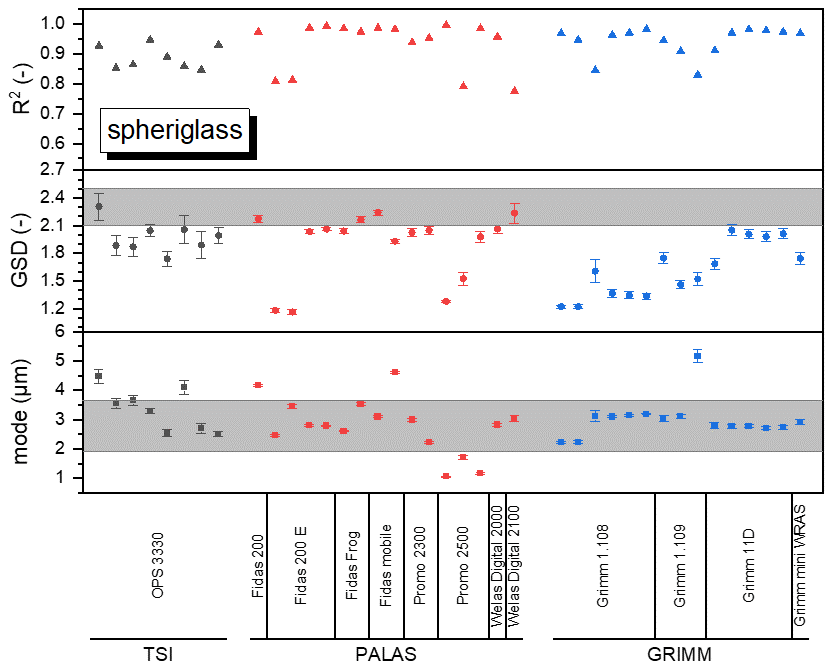
Figure 5PNSD parameters (mode, GSD) and lognormal model fit quality (R2) for Spheriglass particles for the different instruments involved in the ILC. The grey area corresponds to the 90 % confidence interval of the parameters obtained with the control instrument.
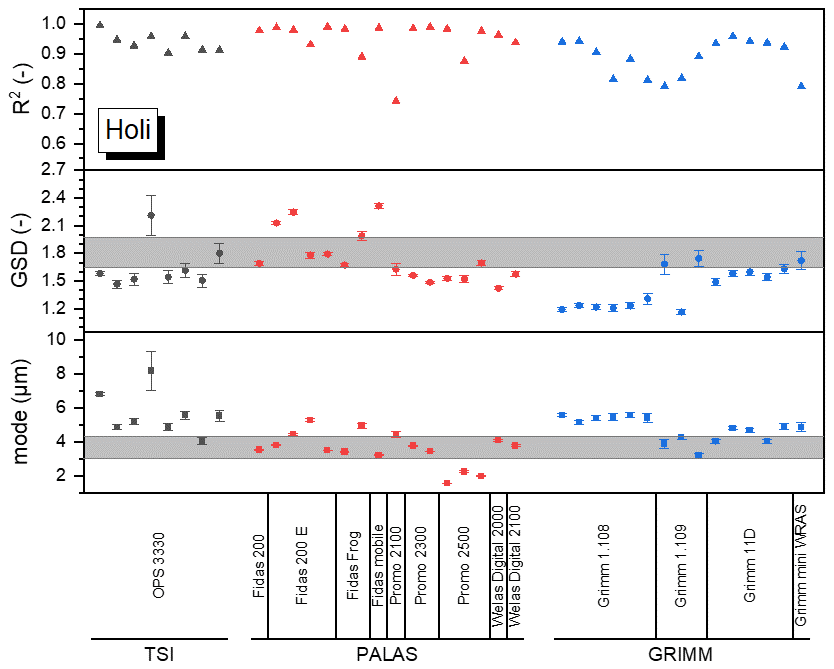
Figure 6PNSD parameters (mode, GSD) and lognormal model fit quality (R2) for aerosolised Holi powder for the different instruments involved in the ILC. The grey area corresponds to the 90 % confidence interval of the parameters obtained with the control instrument.
For monodisperse silica (Fig. 4), the results show a high level of consistency between instruments for both the modal diameter and the GSD. Most measurements fall within or very close to the confidence interval defined by the control instrument. This limited dispersion reflects the well-controlled and stable nature of the monodisperse aerosol, which is inherently easier to characterise. The generally high R2 values further indicate that the lognormal model accurately represents the particle number size distribution for this type of aerosol.
For Spheriglass (Fig. 5), a larger variability is observed across instruments. Although several measurements remain within the confidence interval provided by the control OPSS, noticeable deviations appear, particularly for the GSD. The latter is most frequently lower for candidate instruments than for the control OPSS. Nonetheless, lower determination coefficients are also observed, suggesting that some GSDs should be considered with caution. This increased spread suggests a higher sensitivity to instrumental differences, possibly related to variations in measurement principles or particle–instrument interactions.
For Holi powder (Fig. 6), the variability between instruments is even more pronounced. Significant differences are observed for both the modal diameter and the GSD, with several measurements lying outside the confidence interval of the control instrument. This behaviour is consistent with the complex and polydisperse nature of Holi powder aerosols, as mentioned earlier, which are more challenging to characterise accurately. The diversity in particle size, shape, and composition likely contributes to discrepancies between instruments as different measurement techniques may respond differently to such heterogeneity. As a result, the quality of the lognormal fit (R2) is expected to be more variable, reflecting deviations from an ideal lognormal distribution.
Overall, the comparison across these results clearly highlights the influence of aerosol complexity on measurement reproducibility. While monodisperse silica yields highly consistent and reliable results across instruments, despite its low diameter range compared to the OPSS size detection limits, Spheriglass particles introduce moderate variability, and Holi powder – due to its polydisperse and heterogeneous nature – leads to the largest discrepancies and uncertainty in the derived parameters.
Most measurements cluster near the control instrument, though a few outliers occur at both lower and higher values, likely reflecting differences in calibration, measurement methods, or sample handling.
An analysis based on the Z-score performance criterion (ISO 13528, 2022; Thompson et al., 2006) was conducted in order to consider both the discrepancy between the modal diameters and the variability of the control measurement. Z is defined as follows:
where and represent the modal diameters from the tested OPSS and from the control measurement, respectively, and represents the repeatability standard deviation calculated from all of the control measurements. Depending on the Z value, the measurements can then be classified into performance zones:
-
|Z|>3 shows unsatisfactory values (“warning zone”),
-
shows questionable values (“surveillance zone”),
-
shows coherent values and corresponds to acceptable performance,
-
|Z|≤1 shows values and corresponds to excellent performance.
A similar analysis was conducted on the GSDs. According to Eq. (1), Z scores are mainly affected by the repeatability standard deviation and, to a lesser extent, depend slightly on the choice of the control OPSS.
In order to better understand the Z scoring, each OPSS involved in this inter-laboratory comparison was classified as a function of the technical specification associated with commercial type. The results are presented in Fig. 7 for each aerosol sample. The results are shown separately for the mode diameter and the GSD. The Z scores are grouped into the four categories represented by different colours, while the contribution of each manufacturer (GRIMM, PALAS, and TSI) is indicated by distinct bar patterns.
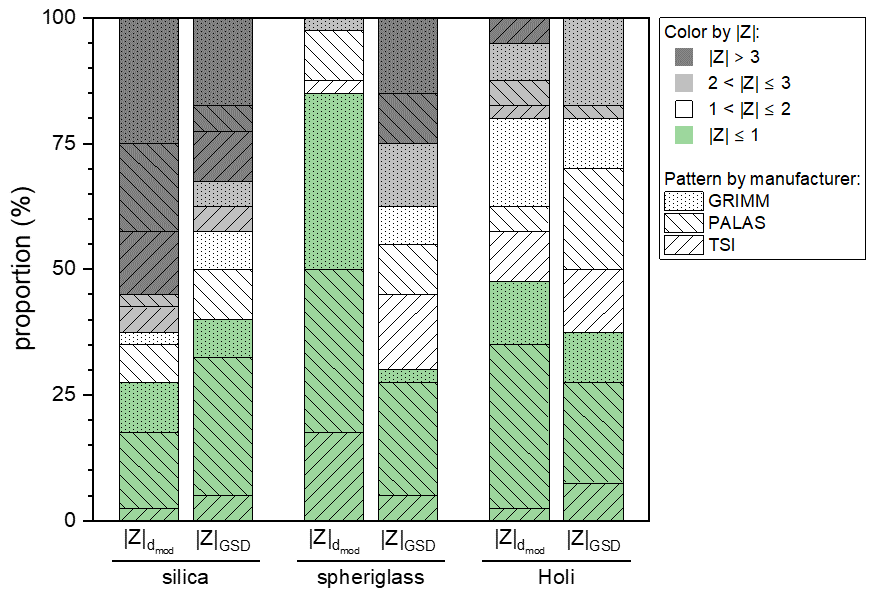
Figure 7Z score calculated for each OPSS tested in the inter-laboratory comparison for the three test aerosols (silica, Spheriglass, Holi powder) as a function of each manufacturer (TSI, PALAS, GRIMM).
Overall, optimal or acceptable performances () are observed for 38 % of instruments involved for silica, 97 % for Spheriglass, and 80 % for the Holi powder samples. Regarding the GSDs (), these proportions are 58 %, 63 %, and 80 %, respectively. These observations are interesting since the most complex sample, i.e. the Holi powder, does not yield the largest Z scores. This is due to a greater uncertainty stemming from the multiple measurements performed with the control OPSS , which leads to lower Z values. On the contrary, the highly repeatable PNSD obtained for monodisperse silica results in larger Z scores, with a large proportion (62 % for the modal diameter, 42 % for the GSDs) in the questionable and unsatisfactory () categories linked to the size detection limit of each involved OPSS (180 nm for PALAS and 250–300 nm for GRIMM and TSI; see Table 1). Because the number of specimens involved is not equivalent, the proportions of Z scores are specified by instrument manufacturer in Fig. 8 for each of the test aerosols considered.
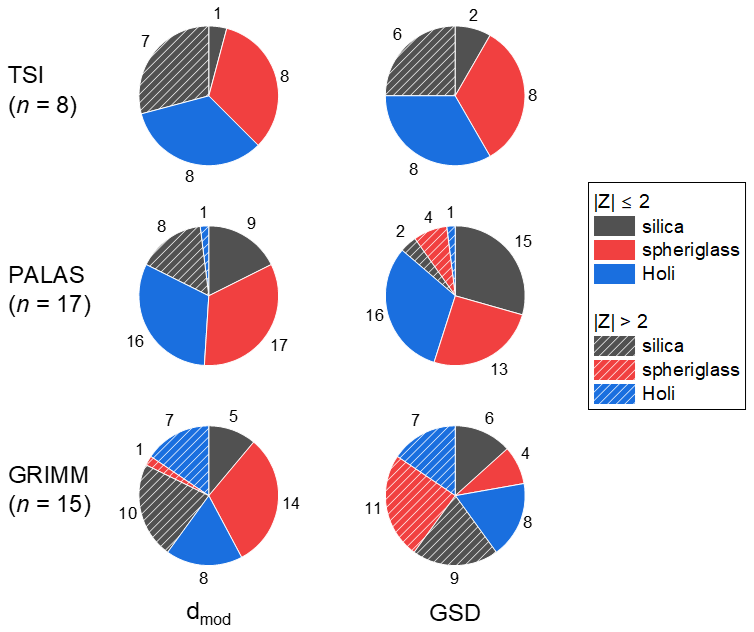
Figure 8Repartition of Z scores (≤2 and >2) for each OPSS manufacturer for the three test aerosols (silica, Spheriglass, Holi powder) for both modal diameter and GSDs.
It can be seen from Fig. 8 that ∼ 71 % of TSI OPSSs involved in this ILC show optimal or acceptable performances (). This percentage is even better for PALAS devices, with 82 % to 86 % being in the same range of Z scores for modal diameter and GSDs, respectively. These proportions decrease to 60 % and 40 %, respectively, for the GRIMM instruments. Overall, PALAS OPSSs achieve the best agreement with the control device, whereas GRIMM and, to a lesser extent, TSI show larger deviations. These trends suggest that instrument design and measurement principles play a critical role in performance. Although this was not evident in the Z-score analysis, the deviations with regards to the control OPSS are particularly important when dealing with heterogeneous and polydisperse particle populations.
It was then the intention to seek the dependence between Z scores and instrumental characteristics. However, the correlation matrix did not reveal a significant effect of any parameter tested (number of size channels, time since last calibration, etc.). It is therefore believed that the biases between measured and control modal diameters are multi-factorial. One question arises regarding the choice of the mobile Fidas as a control instrument, which may have improved the performance evaluation of other PALAS devices. This choice was mainly motivated by the higher size channel resolutions of PALAS OPSSs compared to the other types (Table 1). The size dependence and variability of the scattered-light intensity in relation to particle morphology and refractive index influence the performances of OPSSs (Szymanski et al., 2009). Other parameters can also impact the measured pulse height spectrum of OPSSs, such as the coincidence due to the presence of more than one particle in the sensing volume and the inability of the electronic system to process such events. These limitations may affect the comparability of results between different OPSS types which are usually calibrated by the manufacturers or, less frequently, by users. Calibration of OPSSs can also be used to characterise the instrument correlation to particles with different refractive indices and morphologies from those of calibration particles (Szymanski and Liu, 1986). In terms of particle size and number concentration, Marple and Rubow (1976) calibrated an OPSS with respect to aerodynamic particle size using cascade impactors, which appears to be a time-consuming methodology. Other approaches were also developed using cyclones and filters on the OPSS inlet. Comparisons to aerodynamic particle sizers, scanning mobility particle sizers, and/or electron microscopy measurements were also performed (Binnig et al., 2007; Sousan et al., 2016). In that way, Sang-Nourpour and Olfert (2019) developed a new calibration technique involving an aerodynamic aerosol classifier (AAC) coupled to an OPSS to be tested for the size calibration and to a condensation particle counter for the number concentration. Their protocol presents the advantage of not being limited to a specific particle material or aerosol generation method. Among the parameters that may be at the origin of the deviations observed in relation to the control measurement, the degree of expertise of the operator in charge of the tests and the time since the last calibration and/or maintenance of the device are to be considered. It is therefore difficult to pinpoint a single parameter responsible for the observed deviations between instruments and to propose a further set of good laboratory practices. Depending on the aerosol concentration used during the experiments carried out by each partner, coincidence effects can have disproportionately affected measurements. Instrument-specific factors, including differences in size channel resolution, calibration history, operator expertise, and time since last maintenance, further complicate comparability and interpretation. Because OPSS devices are typically calibrated with reference particles whose optical properties do not match those of the test aerosols, these differences likely introduce significant biases into the particle size measurement, highlighting the challenges of achieving precise inter-laboratory agreement.
This inter-laboratory comparison provides a comprehensive assessment of the metrological performance of OPSSs for measuring particle number size distributions across a range of aerosols without the intention of generating specific test aerosols. This study provided an opportunity to bring together a large number of partners at the national level on a topic that still requires further scientific investigation, especially regarding the access to an affordable and widely deployable calibration bench for multiple laboratories. The standardisation framework associated with OPSS calibration is highly complex, involving stringent requirements with specialised and non-portable facilities. In this context, the present study aimed to develop a common experimental set-up that is straightforward to implement, easily transportable, and highly versatile. Indeed, the system was designed to accommodate a wide range of test aerosols, enabling the generation of polydisperse aerosols in the micron size range, including solid and spherical aerosols. Such flexibility is particularly challenging to achieve with wet-generation systems, which are typically less adaptable and more constrained in terms of aerosol type and operating conditions.
The study involved 16 research groups and 35 OPSSs of various types, tested on three aerosol samples: monodisperse amorphous silica, glass beads, and green Holi powder. This originality lies in the fact that, despite using the same aerosol, the same generator, the same control measurement device, the same experimental protocol, and the OPSS instruments from each participating laboratory, the reported results still differed in several cases. For the monodisperse silica sample, measurements were within ±30 % of the control OPSS, reflecting the high comparability of instruments for narrow size distributions. However, greater variability was observed for the glass beads and Holi powder, which exhibited broader size distributions and complex particle morphologies. When looking at the modal diameter provided by the different OPSSs, 72 % of the instruments were in optimal or acceptable Z-score zones (71 %, 82 %, and 60 % for TSI, PALAS, and GRIMM devices, respectively). Two thirds of the GSDs obtained by means of lognormal fit were found in the same range of Z scores: 75 % for TSI, 86 % for PALAS, and 40 % for GRIMM instruments.
Although most measurements clustered near the control, outliers highlighted systematic deviations linked to factors such as calibration history, size channel resolution, particle morphology, and refractive index differences between calibration standards and test aerosols. Such properties are particularly difficult to determine, especially when complex particles are involved. Nonetheless, this study offers an essential starting point for future work that will need to address the more advanced calibration approaches and to further investigate how such methods could be implemented in practice. Coincidence effects due to higher aerosol concentrations during partner experiments were also identified as contributing to measurement variability, even if each participant was asked to make sure that each OPSS involved was used under “good laboratory practice” conditions, i.e. by ensuring the absence of internal errors reported by the devices, including coincidence errors.
These results confirm that, while OPSSs provide generally reliable PNSD measurements, the observed inter-instrument deviations emphasise the complexity of ensuring consistent performance across laboratories. This study establishes both a methodology and a first dataset for improving OPSS reliability at national and international scales. It underlines the need for strengthened robustness in aerosol measurements and for a clearer understanding of the sources of variability when instruments are deployed under routine monitoring conditions. Although the ISO 21501 standard provides essential requirements for the calibration and performance verification of optical particle counters under controlled laboratory conditions, it does not comprehensively address the influence of complex aerosol properties encountered during ambient or operational measurements, such as non-sphericity, particle agglomeration, variable refractive indices, or broad polydisperse size distributions. Therefore, future work focusing on harmonising calibration procedures using aerosols that better represent real-world optical properties, correcting for coincidence errors, and standardising best practices for instrument maintenance and data acquisition is still needed. Expanding inter-laboratory comparisons to include a broader range of particle types, sizes, and concentrations will further strengthen confidence in OPSS measurements, supporting more accurate and timely air quality monitoring.
Experimental data can be made available upon request from the corresponding author. Due to confidentiality agreements involving several partners who contributed to this study as co-authors, the datasets generated and analysed during this study cannot be made publicly available. The data contain sensitive information subject to contractual and proprietary restrictions, and their disclosure could compromise partner confidentiality obligations. In addition, the processing and analysis of the dataset were performed using proprietary workflows developed in Origin software (OriginPro 2023), making the data structure and processing pipeline difficult to transfer, reproduce, or use outside the original working environment. Therefore, access to the data cannot be provided publicly or upon request.
SB and FGL conceived and designed this study from scientific, technical, and partnership perspectives. SB was primarily involved in data processing, while FGL focused on the dissemination and valorisation of the results. All partners contributed to the work according to a defined timeline, including the provision and use of the generator, and the project was carried out without dedicated funding.
The contact author has declared that none of the authors has any competing interests.
Publisher's note: Copernicus Publications remains neutral with regard to jurisdictional claims made in the text, published maps, institutional affiliations, or any other geographical representation in this paper. The authors bear the ultimate responsibility for providing appropriate place names. Views expressed in the text are those of the authors and do not necessarily reflect the views of the publisher.
The authors would like to acknowledge the ASFERA (Association française d'études et de recherches sur les aérosols) for its support and assistance in partner identification.
This paper was edited by Christof Asbach and reviewed by three anonymous referees.
Binnig, J., Meyer, J., and Kasper, G.: Calibration of an optical particle counter to provide PM2.5 mass for well-defined particle materials, J. Aerosol Sci., 38, 325–332, https://doi.org/10.1016/j.jaerosci.2006.12.001, 2007.
Gaie-Levrel, F., Bourrous, S., and Macé, T.: Development of a portable reference aerosol generator (PRAG) for calibration of particle mass concentration measurements, Particuology, 37, 134–142, https://doi.org/10.1016/j.partic.2017.06.005, 2018.
Gaie-Levrel, F., Bau, S., Bregonzio-Rozier, L., Payet, R., Artous, S., Jacquinot, S., Guiot, A., Ouf, F. X., Bourrous, S., Marpillat, A., Foulquier, C., Smith, G., Crenn, V., and Feltin, N.: An intercomparison exercise of good laboratory practices for nano-aerosol size measurements by mobility spectrometers, J. Nanopart. Res., 22, 103-, https://doi.org/10.1007/s11051-020-04820-y, 2020.
Hindman Ii, E. E., Trusty, G. L., Hudson, J. G., Fitzgerald, J. W., and Rogersi, C. F.: Field comparison of optical particle counters, Atmo. Environ., 12, 1195–1200, https://doi.org/10.1016/0004-6981(78)90367-0, 1978.
Horender, S., Auderset, K., and Vasilatou, K.: Facility for calibration of optical and condensation particle counters based on a turbulent aerosol mixing tube and a reference optical particle counter, Rev. Sci. Inst., 90, https://doi.org/10.1063/1.5095853, 2019.
Hubert, P., Herbin, H., Visez, N., Pujol, O., and Petitprez, D.: New approach for the determination of aerosol refractive indices – Part II: Experimental set-up and application to amorphous silica particles, J. Quant. Spectrosc. Ra., 200, 320–327, https://doi.org/10.1016/j.jqsrt.2017.03.037, 2017.
Iida, K. and Sakurai, H.: Counting efficiency evaluation of optical particle counters in micrometer range by using an inkjet aerosol generator, Aerosol Sci. Technol., 52, 1156–1166, https://doi.org/10.1080/02786826.2018.1505032, 2018.
ISO 13528: Statistical methods for use in proficiency testing by interlaboratory comparison, https://www.iso.org/standard/78879.html (last access: 10 June 2026), 2022.
ISO 21501-1: Determination of particle size distribution – Single particle light interaction methods – Part 1: Light scattering aerosol spectrometer, https://cobaz.afnor.org/notice/norme/iso-21501-12025/XS146596?rechercheID=44163013&searchIndex=2&activeTab=all (last access: 10 June 2026), 2025.
ISO 21501-4: Determination of Particle Size Distribution – Single Particle Light Interaction Methods – Part 4: Light Scattering Airborne Particle Counter for Clean Spaces, https://cobaz.afnor.org/notice/norme/iso-21501-42018/XS127973?rechercheID=27531797&searchIndex=1&activeTab=all (last access: 10 June 2026), 2018.
Leglise, J., Crenn, V., Le Dur, D., and Gensdarmes, F.: Vers un passage au TRL 8 d'un disperseur de poudre de type vortex shaker, ASFERA, https://doi.org/10.25576/ASFERA-CFA2022-28366, 2022.
Maragkidou, A., Jaghbeir, O., Hämeri, K., and Hussein, T.: Aerosol particles (0.3–10 µm) inside an educational workshop – Emission rate and inhaled deposited dose, Build. Environ., 140, 80–89, https://doi.org/10.1016/j.buildenv.2018.05.031, 2018.
Marple, V. A. and Rubow, K. L.: Aerodynamic particle size calibration of optical particle counters, J. Aerosol Sci., 7, 425–433, https://doi.org/10.1016/0021-8502(76)90028-8, 1976.
Mishchenko, M. I., Travis, L. D., and Lacis, A. A.: Scattering, Absorption, and Emission of Light by Small Particles, Cambridge University Press, https://books.google.com/books/about/Scattering_Absorption_and_Emission_of_Li.html?hl=fr&id=i6r1YFyK_g8C (last access: 10 June 2026), 2002.
Ortega, J., Snider, J. R., Smith, J. N., and Reeves, J. M.: Comparison of aerosol measurement systems during the 2016 airborne ARISTO campaign, Aerosol Sci. Technol., 53, 871–885, https://doi.org/10.1080/02786826.2019.1610554, 2019.
R'Mili, B., Le Bihan, O. L. C., Dutouquet, C., Aguerre-Charriol, O., and Frejafon, E.: Particle sampling by TEM grid filtration, Aerosol Sci. Technol., 47, 767–775, https://doi.org/10.1080/02786826.2013.789478, 2013.
Sang-Nourpour, N. and Olfert, J. S.: Calibration of optical particle counters with an aerodynamic aerosol classifier, J. Aerosol Sci., 138, https://doi.org/10.1016/j.jaerosci.2019.105452, 2019.
Sousan, S., Koehler, K., Hallett, L., and Peters, T. M.: Evaluation of the Alphasense optical particle counter (OPC-N2) and the Grimm portable aerosol spectrometer (PAS-1.108), Aerosol Sci. Technol., 50, 1352–1365, https://doi.org/10.1080/02786826.2016.1232859, 2016.
Szymanski, W. W. and Liu, B. Y. H.: On the Sizing Accuracy of Laser Optical Particle Counters, Particle & Particle Systems Characterization, 3, 1–7, https://doi.org/10.1002/ppsc.19860030102, 1986.
Szymanski, W. W., Nagy, A., and Czitrovszky, A.: Optical particle spectrometry-Problems and prospects, J. Quant. Spectrosc. Ra., 110, 918–929, https://doi.org/10.1016/j.jqsrt.2009.02.024, July 2009.
Thompson, M., Ellison, S. L. R., and Wood, R.: The International Harmonized Protocol for the proficiency testing of analytical chemistry laboratories: (IUPAC technical report), Pure Appl. Chem., 78, 145–196, https://doi.org/10.1351/pac200678010145, 2006.
Vasilatou, K., Dirscherl, K., Iida, K., Sakurai, H., Horender, S., and Auderset, K.: Calibration of optical particle counters: First comprehensive inter-comparison for particle sizes up to 5 µm and number concentrations up to 2 cm−3, Metrologia, 57, https://doi.org/10.1088/1681-7575/ab5c84, 2020.
Xiang, M., Morgeneyer, M., Aguerre-Chariol, O., Philippe, F., and Bressot, C.: Airborne nanoparticle collection efficiency of a TEM grid-equipped sampling system, Aerosol Sci. Technol., 55, 526–538, https://doi.org/10.1080/02786826.2020.1870923, 2021.