the Creative Commons Attribution 4.0 License.
the Creative Commons Attribution 4.0 License.
 | 15 Jul 2026
Size distribution and particle morphology of analytes dried through the evaporative light scattering detector – Part 1
Frederick Bertani
Joshua Hassim
Simone Hochgreb
This study investigates the size distribution and particle morphology of analytes dried through an evaporative light scattering detector (ELSD), a widely used detector based on aerosol light scattering in pharmaceutical and materials analysis. We employed multiple particle sizing techniques, including a phase Doppler particle analyser (PDPA), aerodynamic aerosol classifier (AAC), and scanning mobility particle sizer (SMPS), to characterise droplet and particle distributions at various stages within the ELSD. Initial droplet size distributions were reconstructed using dioctyl sebacate (DOS) as a non-evaporating surrogate and correlated to water droplets. Downstream particle measurements were conducted for caffeine, dextran, and citric acid under different concentrations and operating conditions. Scanning electron microscopy (SEM) was used to examine dried-particle morphology. Results show that analyte properties significantly influence final particle size and morphology, with implications for ELSD signal and detection. This is the first comprehensive characterisation of the particle drying and scattering process within an ELSD and provides both physical insights into its operation and data for the validation of a model.
- Article
(4479 KB) - Full-text XML
- Companion paper
- BibTeX
- EndNote


Analytical chemistry techniques often involve liquid chromatography for separation, followed by a detector for separate analytes. In many cases, the latter are detectable by UV or visible spectroscopy, but, in many cases, analytes do not provide sufficient coupling signal, and other methods are required. The evaporative light scattering detector (ELSD) is one of the methods used for the detection of such analytes commonly used in the pharmaceutical, bio-materials, and food-manufacturing industry (Mourey and Oppenheimer, 1984). The eluent solution is atomised and passed through a heated tube, which removes the solvent and leaves behind dry analyte particles, which are then detected as light scattered by a laser beam (Lafosse et al., 1992). Thus, the ELSD is able to detect any analyte which is less volatile than its mobile phase, and it is commonly advertised as a “universal detector”, capable of detecting many species, including those that are not UV–visible active.
Although the ELSD is a well-established analytical technique for analyte detection (Adelantado et al., 2016; Boborodea et al., 2018; Dalavitsou et al., 2019), the underlying physics of its operation remain poorly characterised. In particular, detailed data on particle transport, from atomisation through to detection, including processes such as impaction, diffusion, and evaporation, are absent from the literature.
Spray drying is a very large topic across a number of industries (food, pharmaceuticals, materials), as discussed in topical reviews (Wang and Langrish, 2009; Vehring, 2008; Stunda-Zujeva et al., 2017). These studies have covered the understanding of the process of slurry drying and the material transformations associated with the many different facets of the process, from differential diffusion, particle collapse and its effect on final particle morphology, and practical encapsulation. Many other studies also exist covering the generation of micrometre-sized particles in the context of inhalable drug delivery (Thybo et al., 2008; Kemp et al., 2013, 2016; Dunbar et al., 1998), as well as submicron-sized particles for a variety of applications (Mezhericher et al., 2018; He et al., 2024). However, there is yet to be an experimental investigation into the drying of particles in the particular situation of the ELSD, which involves particles across the optical range – as will be reported – from micrometres down to tens of nanometres. Studies which follow the lifetime of a droplet in situ with single-particle levitation techniques (electric–dynamic balance (Gregson et al., 2019), acoustic levitation (Doß and Bänsch, 2022; Fu et al., 2012; Wulsten et al., 2009), or optical tweezers (Power and Reid, 2014; Cai et al., 2015)) examine particles which are generally much larger (greater than 5 µm) than relevant to the ELSD and generally have not explored the droplet from the point of atomisation.
The purpose of the present study is to obtain experimental results of particle size number distributions relevant to the development of a model for the simulation of the signal obtained for the ELSD. The present work includes data from a variety of common organic compounds as analytes and investigates the drying process after injection through the ELSD under steady-state conditions for different analyte concentrations.
In what follows, the methodology for the ELSD instrument is described, followed by a detailed overview of the analytical setup. A series of experimental configurations are employed to evaluate the atomised droplet size distribution, spanning from the submicron to the supermicron range. This broad size spectrum necessitates the use of multiple measurement techniques to bridge different size regimes reached by different instrumentation effectively. The dried analytes are subsequently characterised using a scanning mobility particle sizer (SMPS) and scanning electron microscope (SEM) to assess both particle size and morphology. The experimentally obtained dried-particle size distributions serve as a benchmark for comparison with simulation results from a simplified numerical model presented in the companion paper (Bertani et al., 2026).
2.1 Preparation of the analyte solutions
Caffeine, citric acid, and dextran were chosen as analytes for this study. Caffeine was chosen because it is currently the standard default sample used in Agilent ELSDs as it is used for calibration. Dextran was chosen to represent a large-molecular-weight water-soluble polymer as the ELSD is often used to analyse molecules of this type. Citric acid was chosen as a non-volatile non-cyclical small molecule alternative to caffeine. The properties of caffeine and citric acid are summarised below in Table 1. The properties of the variety of dextran used in this study are unknown to precise values as they have not been tabulated by the manufacturer or in the literature for such large-molecular-weight chains.
Table 1Analyte physico-chemical properties at 25 °C and atmospheric pressure (Pence and Williams, 2010; Bothe and Cammenga, 1979; Griesser et al., 1999). MW: molecular weight; hlv: heat of vaporisation; pv: vapour pressure.

Solutions of aqueous caffeine (obtained from Alfa Aesar, Thermo Fisher Scientific), dextran (Mw = 450 000–650 000 g mol−1; Scientific Laboratory Supplies Ltd.), and citric acid (Alfa Aesar, Thermo Fisher Scientific) were prepared using distilled water (Merck Life Science UK Ltd.) at concentrations of 0.125, 0.25, 0.5, and 1 g L−1. After mixing, all solutions were sonicated in a water bath held at 25 °C for 10 min to ensure total dissolution.
2.2 ELSD experimental setup
The ELSD (1290 Infinity II, Agilent Technologies) was operated at a steady-state liquid feeding rate, with the dissolved analyte in the mobile phase, instead of the more conventional analyte pulse injections from a liquid chromatography column. Steady-state operation is necessary to allow particle collection for SEM imaging and particle sizing experiments, which require significantly longer timescales than that of a pulsed injection. The ELSD was operated at a constant nebuliser temperature of 25 °C, an evaporator temperature of 25 °C.
2.2.1 ELSD layout
The ELSD used in this study produces a spray using a twin-fluid coaxial Glass Expansion SeaSpray nebuliser shown in Fig. 1, with dimensions detailed in Table 2, installed at location (1) as shown in the diagram in Fig. 2. The volumetric gas flow rate going through the nebuliser is set by the manufacturer to a constant flow rate of 0.4 L min−1. The cross-section of the network of pipes is shown in the cross-sectional diagram in Fig. 2. Excessively large droplets emerging from the nebuliser are removed at the impaction point (Y junction indicated as location (2) on the diagram). Liquid droplets dribble down to the waste collection stream along the vertical leg. This connector remains always flooded so that all the gas flows into the evaporator and outlet only. A further impingement point for large droplets is provided by the labyrinth diffuser cartridge along the inclined tube (at the interface between sections (3) and (4)). An additional dry nitrogen gas (BOC Ltd.) flow rate of 2 L min−1 is injected downstream of the Y piece into the evaporator. The geometry is indicated in Fig. 3. The atomisation chamber and the section up to the diffuser cartridge have a diameter of 11.7 mm and a length of 45 mm, and the evaporator has a diameter of 14.4 mm over a length of 144 mm. Further details regarding the geometry and operating conditions can be found in the companion modelling paper and original PhD thesis (Bertani, 2024; Bertani et al., 2026).

Figure 1(a) SeaSpray high-performance nebuliser, (b) cross-sectional diagram of the nozzle tip showing liquid nozzle and gas annulus.


Figure 2Cross-section of the ELSD, indicating inlet, evaporator, outlet, detector, and liquid trap. The unit is assembled with the main ducts at 15° to horizontal to return any liquid droplets to the liquid trap.

Figure 3Schematic of the ELSD layout, indicating different elements of the ELSD which affect droplet concentration or size, represented as separate subsections.
Figure 3 shows a schematic highlighting relevant sections of the ELSD which affect the total droplet count and size distribution and, thus, the subsequent light-scattering response. These elements are to be characterised by particle concentration transfer functions.
2.3 Nebuliser sizing experiments
In order to understand the process of droplet evaporation within the flow passages of the ELSD, measurements are required of the particle distribution upstream of the ELSD, i.e. the initial droplet size distribution produced from the nebuliser (Fig. 1). For the present experiments, the nebuliser was operated at a constant volumetric liquid flow rate of 0.5 mL min−1 controlled by a syringe pump (Aladdin; SyringeONE AL-1000) and a constant volumetric nitrogen gas flow rate of 0.4 L min−1 controlled by a mass flow controller (Alicat Scientific).
Upstream particle sizing experiments aim to characterise the droplet size distribution for a given solvent, water, in the case of the aqueous solutions used in later experiments. However, accurately capturing the droplet distribution is particularly challenging due to rapid evaporation of the water solvent. This makes it difficult to obtain in situ measurements that span the full size range of interest. As a result, multiple complementary techniques are employed to assess the true droplet size distribution as discussed below.
A phase Doppler particle analyser (PDPA; DANTEC Dynamics DopplerPower DPSS laser 2 × 1 W 488/515 nm) was initially used to characterise the droplet size distribution emitted by the nebuliser. The transmitting probe uses a 500 mm focal length lens and one photodetector. The receiving probe contains a 310 mm focal length lens, an aperture mask, and three photodetectors. The receiving probe was angled 20° off-axis from the forward-scattering direction to allow first-order refraction to dominate the received light. The spatial resolution of the sampling region is of the order of 0.2 mm based on the pinhole aperture used. The settings were arranged to sample the smallest possible diameter corresponding to the index of refraction of the fluids considered (water, dioctyl sebacate (DOS)). This rapid and localised detection minimises the influence of evaporative losses on the measured droplet size distribution. However, as an optical technique, the PDPA has a lower detection limit of approximately 2 µm, below which droplets cannot be reliably sized (Boutier, 2013; Sijs et al., 2021). Consequently, a significant fraction of smaller droplets may fall below the detection threshold and remain unmeasured. To address this limitation, a second instrument was employed to cover the measurement gap between 200 nm and 2 µm. An aerodynamic aerosol classifier (AAC; Cambustion Ltd.) was used in conjunction with a condensation particle counter (CPC; TSI Instruments Ltd., model 3752) to measure the aerodynamic particle size distribution (Johnson et al., 2018). The latter setup requires sampling and cannot realise spatially resolved measurements, but it is capable of detecting smaller particles (≤ 2 µm). Additionally, droplets that are still evaporating cannot be reliably classified, owing to the long convective timescales involved in sampling lines. A comparison of the capabilities of both instrumentations is provided in Table 3.
Table 3Summary of capabilities and drawbacks of the two instruments utilised to elucidate initial droplet distributions.

Preliminary measurements with the PDPA determined that the size peak from the nebuliser lies around the micrometre range. To bridge the measurement gap and approximate the full droplet size distribution, a compromise was achieved by combining PDPA measurements with those from the AAC-CPC system. A series of experiments were conducted using both the PDPA and the AAC/CPC in a size range where both are feasible using a non-evaporating liquid, namely dioctyl sebacate (DOS), a low-vapour-pressure oil (the vapour pressure of DOS is 2.6 × 10⁻⁴ Pa at room temperature and pressure, offering negligible evaporation rate (Pence and Williams, 2010)). The solvent properties for both DOS and water are shown in Table 4.
Table 4Solvent physico-chemical properties at standard room temperature and pressure (Pence and Williams, 2010).

Figure 4 shows flow diagrams of the three sets of experiments used to obtain number distribution functions of the original spray.
-
Spray PDPA. The PDPA sampling volume is taken within the spray plume at a distance of 1 mm from the tip of the nebuliser along the centreline. The reference droplet size concentration distribution is labelled nP,s(dp), where dp is the droplet diameter.
-
Well-mixed PDPA. The atomiser output is collected past a liquid trap and along a tube connected to a well-mixed outlet. This allows comparison of the integrated, well-mixed measurements required by the AAC-CPC setup. The measurements are taken with the PDPA (top right) to yield a size distribution nP,m(dp).
-
Well-mixed AAC. This is an identical setup to that of the well-mixed PDPA but is acquired using the AAC-CPC setup as a well-mixed aerosol (bottom), yielding the size distribution nA,m(dp). Note that the additional air is required for the operation of the AAC-CPC.

Figure 4Configurations of the experiments conducted to obtain the initial droplet distribution of DOS. Experiment 1: spray PDPA (top left). Experiment 2: well-mixed PDPA (top right). Experiment 3: well-mixed AAC (bottom).
In the well-mixed AAC experiment, the flow configuration incorporated a liquid trap to eliminate the largest droplets, which is required for preventing the flooding of the instrument, in accordance with the experimental setup for aerosol generation used by Johnson et al. (2018). Furthermore, this configuration required the inclusion of an additional diluting flow and a vent to accommodate the required sampling flow rate of the CPC at 1.5 L min−1 relative to the atomiser flow of 0.4 L min−1. The AAC was operated with a sheath flow of 15 L min−1 and a sample flow of 1.5 L min−1, corresponding to a resolution (defined as the ratio of particle size to the minimum resolvable size difference) of 10. Under these conditions, the AAC is capable of classifying aerodynamic particle sizes in the range of 200–6000 nm. The transfer function of the AAC has been extensively characterised using DOS droplets up to approximately 5 µm in diameter (Johnson et al., 2018; Payne et al., 2023), and these characterisations were applied in the present study to deconvolve the measured concentrations and to recover the underlying particle size distribution.
For the well-mixed non-evaporative experiment (i.e. experiments 2 and 3 using DOS), particle losses across the liquid trap and transfer tube are attributed to gravitational settling and are adjusted for as outlined in the Appendix. Experimental data from setups 2 and 3 are related via a transfer function, as explained below.
We make the assumption that the particle size distribution from the well-mixed PDPA experiment, nP,m(dp), should equal that of the well-mixed AAC experiment, nA,m(dp), above a threshold size (> 2 µm). However, the values need to be corrected owing to a systematic difference, namely that PDPA measurements measure the passage of droplets at a local sampling volume of the order of a cubic millimetre, whereas the AAC measurements involve sampling the mean integrated total particle number in the flow.
We assume that the differences can be adjusted by a constant factor C, assumed not to be biased across the size distribution, times a transfer function which accounts for the diameter-dependent loss, fL(dp). The factor C is obtained by error minimisation across the size distribution obtained with the two measurement methods.
From the comparison between the well-mixed PDPA and well-mixed AAC experiments it is possible to calculate the loss function associated with the PDPA, fL, which characterises the diameter dependent signal loss, as given by the following:
The ratio of the two distributions is calculated as a function of diameter, between µm, where that fL asymptotes to unity for sizes near 2 µm. A final transfer function, fT, is associated with the losses in the tubes which feed the aerosol into the AAC, which is obtained experimentally by taking the ratio of number density distribution measured using the spray PDPA, nP,s(dp), to the well-mixed PDPA experiments:
It is assumed that all atomised solvents produce a log-normal droplet number distribution:
where N is the total concentration of droplets. Log-normal distributions are controlled by the parameters μ and σ, which are analogous to the distribution mode and width, respectively, in logarithmic space. We assume that the mode of the distribution, ln μ, is obtained from the measurements below 2 µm using the best fit to the distribution nA,m. We also make the assumption that the value of σ does not vary between distributions using different atomising liquids as its value primarily depends on the atomiser geometry (Canals et al., 1988; Kashani and Mostaghimi, 2010). The value of σ is determined from the best fit to nP,s using values above 2 µm.
In this description, we have so far only considered experiments using a non-evaporating liquid so that we could use appropriate instrumentation (AAC-CPC) to measure the expected droplet distribution nP,m. However, the liquids used in the ELSD (water, alcohols) have different properties compared to DOS regarding atomisation. In order to relate the present measurements to those of different fluids, we sought experiments and correlations produced in nebulisers with similar geometry, covering a range of compounds (Aliseda et al., 2008; Kahen et al., 2005; Kashani and Mostaghimi, 2010). After an analysis of the gas and liquid flow rates over which the experiments were validated, we selected the experiments and correlations by Aliseda et al. (2008). Their measurements obtained log-normal distributions for twin-fluid concentric pneumatic nebulisers, similar to the one used in the ELSD for this study, for a range of compounds whose physical properties are well within the range of industrially relevant solvents, as shown in Table 5. A full discussion of these considerations is available in the thesis by Bertani (2024). The correlations used are for the Sauter mean diameter (SMD, D32) as a function of characteristic flow non-dimensional numbers. The SMD is related to the log-normal parameters μ and σ via the following (Hinds and Zhu, 2022):
Table 5Range of physical properties for which Aliseda et al. (2008) provide a correlation.

The function linking the D32 of the initial droplet distribution to the solvent properties and operating conditions, as expressed in the original work, is as follows Aliseda et al. (2008):
where DL is the liquid orifice diameter; bG is the gas jet thickness (here taken as the thickness of the atomiser gas annulus); and ρL and ρG are densities of the liquid and gas, respectively. ReG is the gas-phase Reynolds number based on the atomiser gas annulus; is the Weber number based on the liquid properties and nozzle diameter; Oh is the Ohnesorge number; and C1 and C2 are experimentally determined constants with values of 1.734 and 1.0, respectively. The variable mr is the ratio of liquid to gas mass flow.
The Reynolds number is based on the thickness of the gas annulus and the corresponding gas velocity Ub and dynamic gas viscosity μG. The Weber number is based on the liquid properties of density ρL and surface tension σL, , where the liquid velocity is based on the area defined by the jet diameter DL. Finally, the Ohnesorge number is also based on the liquid properties and jet diameter, .
The final step is to obtain the actual number concentrations in the flow (coming from the atomiser centreline) for the particular operating conditions. These are obtained by imposing the conservation of liquid volumetric flow rate for the droplets, starting from the droplet size concentration distribution nP,s, which is assumed to remain self-similar for different fluids:
where QL and QG are the measured volumetric flow rates of liquid and gas delivered to the injector at reference conditions, the integral obtained corresponds to the total liquid mass per unit volume of gas, and the correction factor ϕ is applied to obtain the final estimated input droplet number distribution of the mixture of solvent and dilute analyte delivered by the nebuliser at section (1).
2.4 ELSD outlet particle sizing experiments
The previous section detailed the steps taken to obtain the particle size distributions at the upstream end of the flow network, which acts as an input to the overall model (i.e. (1) in Fig. 3). In order to verify the accuracy of a model, it is also necessary to obtain particle size distributions at the outlet of the ELSD (i.e. corresponding to the outlet of (4) in Fig. 3).
The measurements are made using a scanning mobility particle sizer (SMPS, TSI Instruments Ltd.). The SMPS comprises two pieces of aerosol instrumentation in series: a differential mobility analyser (DMA) and a CPC. The outlet of the ELSD was connected via non-particle-generating, conductive rubber tubing to the inlet of the SMPS as shown in Fig. 5. All SMPS experiments in this study used TSI-made DMAs (electrostatic classifier models 3080 and 3082 and a model 3081 long column) and CPCs (models 3752 and 3776). The SMPS was operated with a negative polarity such that positively charged particles were selected, with an aerosol flow of 1.5 L min−1 and a sheath flow of 15 L min−1. Experiments were obtained over 90 s scans across the explored size range of 8 to 232 nm. Each set of experimental conditions was repeated three times to ensure reproducibility; the reported results show the average of these three runs for each case.

Figure 5Configuration for the acquisition of particle size distribution downstream of the ELSD. The DMA and CPC make up the SMPS.
2.5 SEM images
Samples were collected from the ELSD outlet for SEM analysis on carbon TEM grids (EM Resolutions, Holey Carbon Film, Cu, 300 mesh, 4–6 nm, UL, hole diameters ranging from 0.25 to 5 µm) for 3 min using an ELSD gas flow of 2 L min−1. The samples were coated in platinum to ensure that the organic samples were electrically conductive enough to be visible in the SEM before being analysed on a TESCAN MIRA3 FEG-SEM at 5 kV.
3.1 Upstream droplet size measurements
The results of the particle size distribution measurements obtained as described in Sect. 2.3 from the PDPA and AAC experiments using DOS are shown in Fig. 6. PDPA measurements are collected over 120 s, and averages over three repeats are produced, with negligible variation between measurements. Likewise, well-mixed AAC measurements were collected as an average of three scans, with variability of 5.2 nm (0.6 %) on the modes.

Figure 6Particle size distributions for non-evaporating DOS droplets measured downstream of the atomiser, normalised to peak concentrations measured with the well-mixed AAC. Distributions shown correspond to spray PDPA nP,s (obtained directly from the PDPA atomiser centreline), well-mixed PDPA nP,m (obtained from the well-mixed setup), and well-mixed AAC nA,m (obtained from the well-mixed setup). The dashed black line shows a log-normal fit obtained according to the procedure described in the text: the mode from the well-mixed AAC and the σ from the spray PDPA. Left plot shown with diameter as a linear scale (left) and as a log-normal scale (right). Points on the lines represent bins in the different experiments. No smoothing has been applied.
The green line for the well-mixed AAC measurements shows a log-normal mode around 450 nm, which is adopted as the mode for the final original spray distribution. The orange line for well-mixed PDPA, nP,m shows good agreement with the well-mixed AAC green nA,m line once scaled by a best-fit factor . The spray PDPA blue line is scaled by the same factor . The ratio of the blue signal (spray PDPA) and orange signal (well-mixed PDPA) reflects the losses within the liquid trap and tube via fT. The values determined for fT and fL as a function of diameter are shown in Fig. 7. The best-fit log-normal curve for the final total spray concentration curve nP,s(dp) is shown as the dashed black line log-normal curve in Fig. 6. The procedure can be summarised as using the mode determined by the AAC measurements and the value of σ determined by the spray PDPA measurements.

Figure 7Loss function fL and transfer function fT as obtained from experimental data. Left: fL superimposed onto the distributions obtained via well-mixed cases; right: fT superimposed onto the distributions obtained via PDPA experiments. Logarithmic scale for diameter. Points on the lines represent bins in the different experiments. No smoothing has been applied.
Once the mode and σ for the DOS distribution are determined, the correlation in Eq. (5) was used to determine the expected value of D32 and, thus, an updated value of μ, assuming that σ remains constant and that the total volume flow rate is conserved, as expressed in Eq. (6). The original distribution for DOS and the final result for the expected droplet number distribution for water from the nebuliser are shown in Fig. 8.

Figure 8Initial droplet distributions for DOS (mode = 450 nm, σ = 1.08) and water (mode = 550 nm, σ = 1.08) on a logarithmic scale.
The initial size distribution of water droplets is approximated using the same liquid and gas volumetric flow rates as in the DOS case. As a result, by conservation of volume, a larger peak droplet diameter corresponds to a lower peak number concentration compared to DOS. This difference in peak diameter is due to the higher surface tension of water relative to DOS. An increased surface tension would lead to more energy being required to break the liquid jet into droplets, resulting in larger droplets overall.
3.2 Particle size measurements downstream of evaporator and detector tube
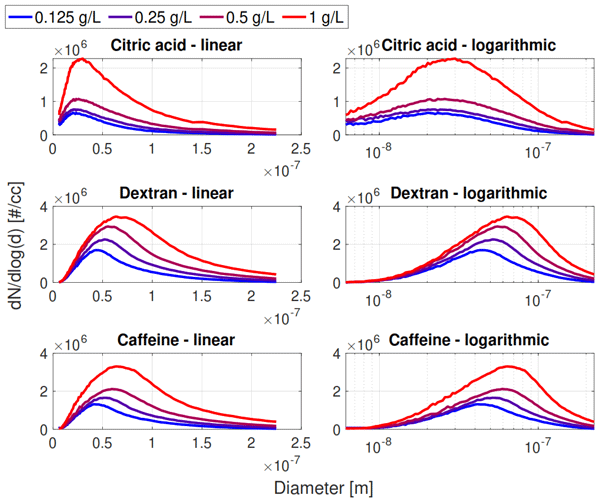
Measurements of particle concentrations as a function of size emerging from the evaporator section were made using an SMPS and are shown in Fig. 9 for caffeine, dextran, and citric acid diluted in water at concentrations from 0.125 to 1 g L−1. Analytes with different volatilities and bulk densities were selected to understand whether different particle size distributions are produced. Their properties are shown in Table 1, with the lowest volatility associated with citric acid, followed by caffeine. The volatility of dextran is not known, although its molecular weight is highest compared to the other two compounds.

Figure 9Mobility diameter SMPS scans of citric acid (top row), dextran (middle row), and caffeine (bottom row) injections through the ELSD at 25 °C for different initial analyte concentrations; mobility diameter shown as a linear scale (left) and as a log-normal scale (right).
The lowest overall concentrations and smallest mean diameters are associated with citric acid, which has lower volatility and higher effective density relative to caffeine. Although there is little information about dextran properties, measurements show very little systematic difference between the number distributions compared to caffeine. This may indicate similar effective densities upon drying.
As expected, the peak numbers increase with the concentration but not linearly across the range. For all cases, the mode of the distribution increases with concentration. One can also observe that the distribution is not quite log-normal or symmetric but rather skewed towards larger sizes. This is indicative of a distribution which has gone through a size-dependent impingement via a cut-off diameter. This can be attributed to the effects of the Y junction and the diffuser cartridge (sections 2 and 3 in Fig. 3) on the aerosol. Further evidence is presented in the parallel study modelling the ELSD signal response, which demonstrates that a collection efficiency curve for the two aforementioned impingement points leads to such a skewed distribution (Bertani et al., 2026).
From the measurements and adjustments discussed for the nebulised droplet distribution, a number concentration peak at a diameter value of 550 nm and a peak width of σ = 1.08 are estimated for the reconstructed initial distribution of water (Fig. 8). An estimate of the dried-particle size for a droplet of initial diameter d0 and of analyte mass concentration c in the liquid can be made by assuming that the mass ma of the analyte not captured by the impingement is conserved after all solvent water has evaporated, leaving a final spherical droplet diameter df with known bulk density ρb:
The estimated diameter df obtained can be thought of as a lower bound for the dried-particle diameter as the bulk density may differ from that of the dried particle, particularly as the dried-particle diameter may differ from that of a sphere. Assuming that we can compare the peak of the distributions, we can compare the mode of the initial droplet distribution with the mode of the SMPS distribution:
Substituting the values for effective density for the bulk density values given in Tables 1 and 4 and using the mode diameters from the peaks of Fig. 9 as representative for an analyte concentration of 1 g L−1 yields final mode diameters of 46 and 52 nm for citric acid and caffeine, respectively (the density of dextran is uncertain, and so this is not calculated). The resulting values should be compared to the measured modes of 35 and 65 nm, respectively, according to the values in Fig. 9. The estimated values generally align with the experimental measurements; however, the value for citric acid is over-predicted, while caffeine is under-predicted, as shown in Fig. 10. The under-prediction of the peak caffeine diameter indicates a lower effective density of caffeine particles compared to the bulk value; this is consistent with the SEM results shown in the next section as the collected dried caffeine samples are not spherical in shape. The over-prediction of the peak citric acid diameter may be attributed to inaccuracies associated with the construction of the initial droplet distribution of water and possible mixing effects reducing the surface tension of the water–citric acid solution and changing the diameter; a decreased surface tension is consistent with less energy being required to break the liquid jet into droplets, resulting in smaller droplets overall.

3.3 SEM images
SEM images were collected for the three analytes selected in Table 1 according to the methodology described in Sect. 2.5. The efficiency of the collection grids used for SEM imaging reaches minimum efficiencies below 20 % in the size range of 5–300 nm (Xiang et al., 2021). Therefore, while the images can be analysed for particle size distribution, they are only representative for particles larger than 300 nm. Here we present SEM images to gain insight into the morphology of dried particles in the ELSD and into what extent particle shape might affect the scattering properties which directly lead to light detection.
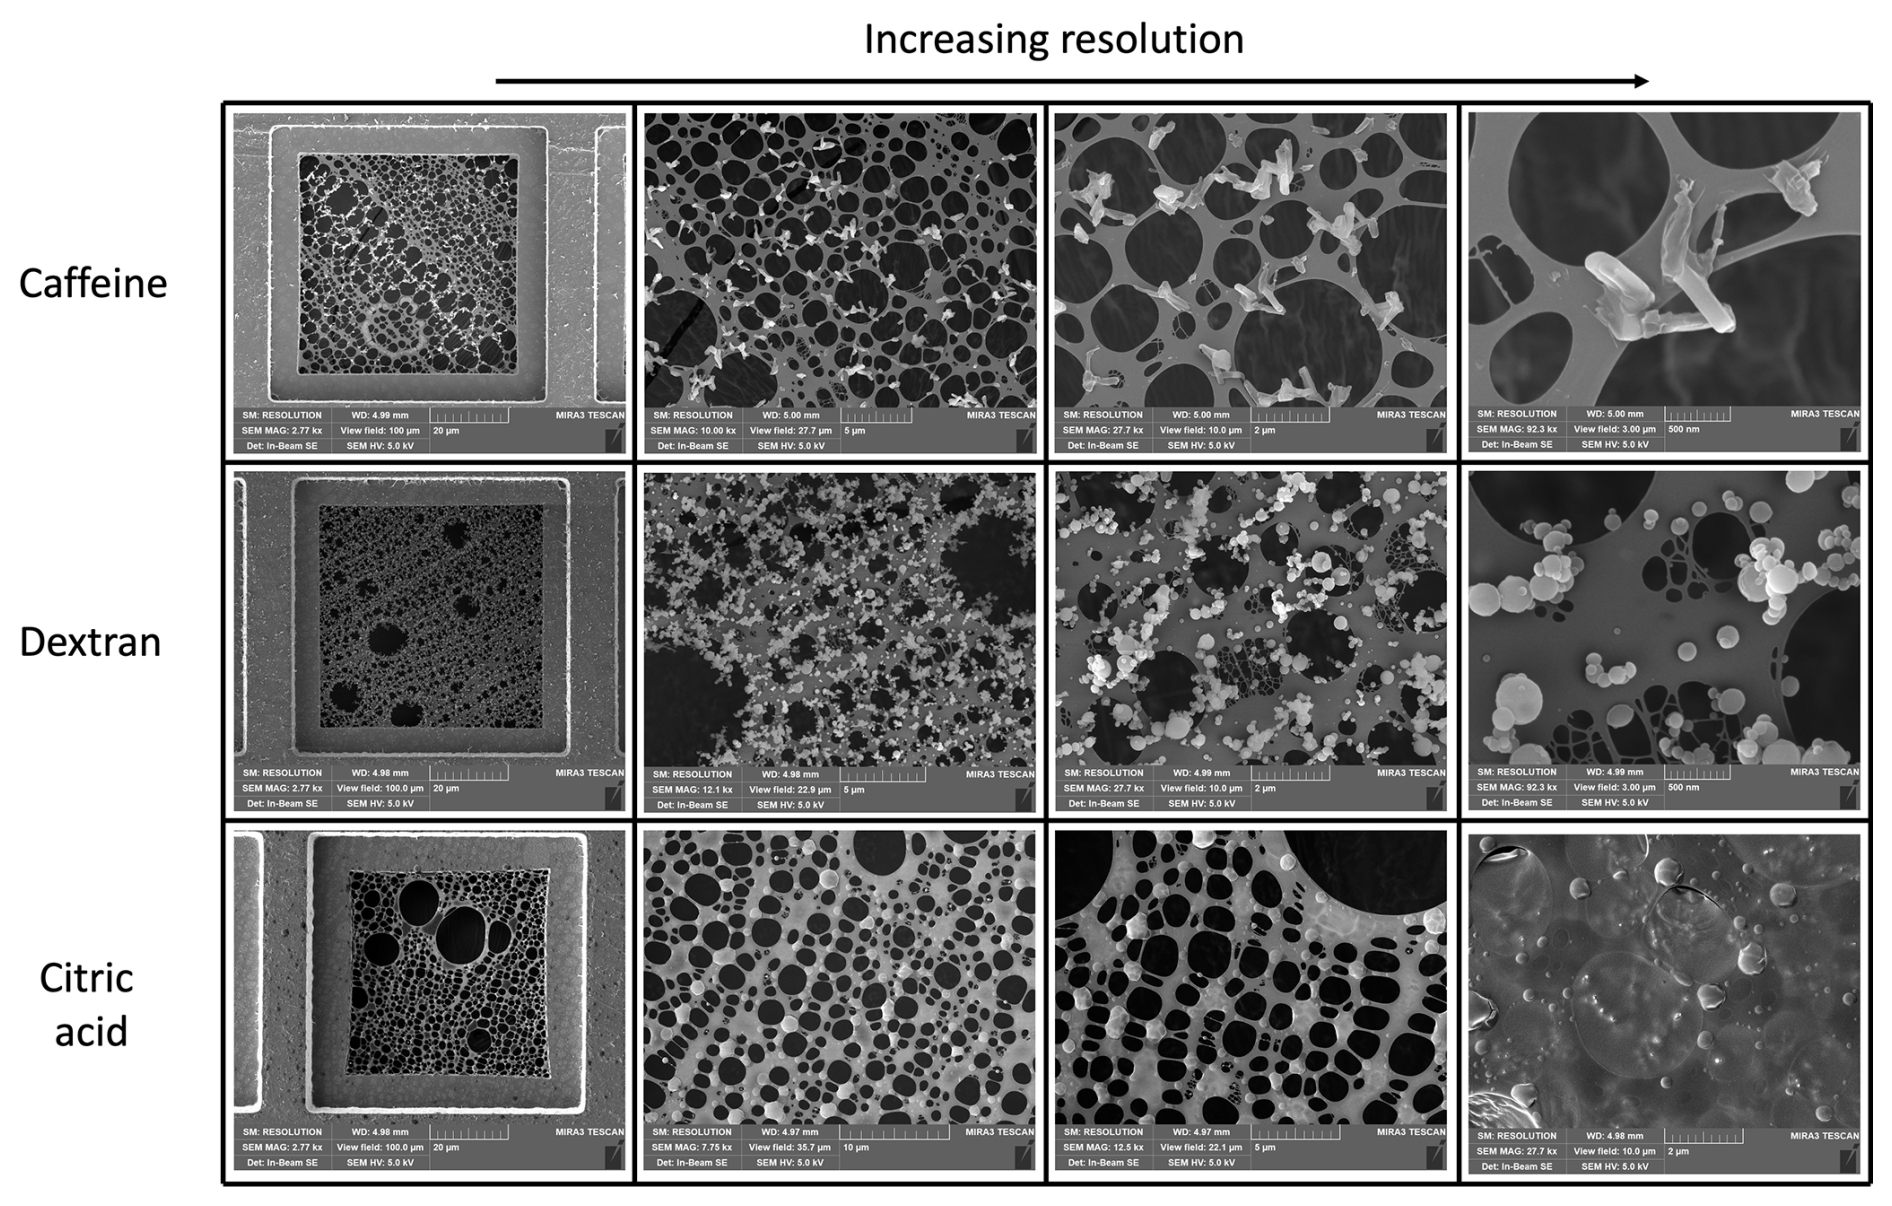
Figure 11SEM images taken of 1 g L−1 samples of caffeine (top row), dextran (middle row), and citric acid (bottom row) at increasing levels of magnification.
Figure 11 shows SEM images of grids with collected particles for the three selected analytes under the same operating conditions for caffeine, dextran, and citric acid, in order of increasing spatial resolution. Caffeine samples produced particles with a notably elongated morphology, with a few shorter particles with crystalline character. This is consistent with literature reports of caffeine crystallising into needles in bulk (Sarfraz et al., 2012). This finding may have significant consequences for the detection of caffeine via light scattering since the morphology found via SEM differs significantly from that of a sphere. Dextran produced spherical particles with an approximately spherical morphology with a large variety of diameters, as shown in Fig. 11. These are often agglomerated into larger particles with different primary particle sizes. This is also consistent with literature reports for dried dextran particles (Yuan et al., 2007). Finally, samples of citric acid produced particles which are approximately spherical and not agglomerated. Particles tended to collect in the regions around the holes of the TEM grid. This suggests that the citric acid particles may have particular surface tension properties associated with liquids (possibly water) as they were deposited onto the TEM grids. This is in contrast to available literature on bulk drying of aqueous citric acid, which suggests that citric acid formed crystals with distinct networks of multi-layer agglomerates (Ohgaki et al., 1992; Groen and Roberts, 2001). The difference may suggest that there is a difference in terms of crystallisation in bulk compared to atomised droplets.
This study provides a comprehensive characterisation of particle formation and evolution within the ELSD. By combining multiple particle sizing techniques and SEM imaging, we have elucidated the complex relationships between initial droplet formation, solvent evaporation, and final particle morphology for different analytes. Our results demonstrate that the initial droplet size distribution can be approximated using non-evaporating surrogates and correlated to aqueous solutions. Measurements of the electrical mobility distribution of the dried particles downstream of the evaporator shows that morphological changes associated with the analyte characteristics affect the bulk density, thus influencing final particle size distributions. SEM images further highlight the diverse morphologies of dried particles, ranging from elongated caffeine crystals to spherical dextran agglomerates and approximately spherical citric acid particles.
These findings form the database for understanding ELSD functioning and detection mechanisms in order to optimise performance across different analytes. The observed differences in particle size and morphology can contribute to variations in light-scattering behaviour, which directly impacts detector response. A companion paper develops a model for eluent atomisation and drying and uses the present results for validation (Bertani et al., 2026).
The outlook of the combined experiments and model allows the development of improved instrument designs and more robust analytical methods for a wide range of applications of the ELSD in pharmaceutical, biomaterials, and food science research.
A1 Diffusional losses
The loss of particles due to diffusion was calculated via the Gormley and Kennedy equation for aerosol penetration, P, in a tube as given by Hinds and Zhu (2022):
where χ is the penetration parameter and is expressed as the ratio of a diffusive to convective velocity.
In the above, L is the tube length, Q is the gas volumetric flow rate, and 𝒟 is the mass diffusivity of the aerosol in the fluid as given by
In the equation above, Cc is the Cunningham slip correction factor and is given by
where λ is the gas mean free path.
By taking the length of the tube as 2 m and the gas flow rate as 2 L min−1 and applying Eq. (A1) to a variety of diameters, the diameter-dependent value of P is shown in Fig. A1.

Figure A1Values for aerosol penetration for a range of diameters, given the conditions in the well-mixed experiments.
From Fig. A1, it is observed that the penetration value increases with particle size, reaching values greater than 99 % penetration for particles of 100 nm and above. Thus, it was concluded that diffusional loss was negligible in the determination of the initial particle distribution.
A2 Gravitational losses
The loss of large particles from the point of atomisation to the point where the particles can first be detected with the AAC can also be rationalised by calculating the expected losses with the gravitational velocity Vgv for particles of this size (Hinds and Zhu, 2022):
where g is the acceleration due to gravity. In the case of DOS atomisation this simplifies to
where all variables are given in SI units.
The piping used to connect the atomiser to the AAC was a in. internal diameter tube, with an internal radius of m and cross-sectional area of m2. Since the atomiser was the only source of gas flow, at 0.4 L min−1, this is equivalent to a mean flow speed of V = 0.21 m s−1 or a total flow time of t = 9.5 s for a tube around 2 m in length. The penetration depth can be found by equating the limit setting velocity to the convective velocity and solving for the cut-off diameter of 3.5 µm. The limit can explain the difference between the original PDPA distribution and the value with the well-mixed AAC, which contains very low number concentrations of particles above 3.5 µm.
The dataset associated with this article can be made available from the corresponding author on request.
F. Bertani: data curation, investigation, writing (original draft), formal analysis. J. Hassim: methodology, investigation, resources. S. Hochgreb: conceptualisation, supervision, funding acquisition.
The contact author has declared that none of the authors has any competing interests.
Publisher's note: Copernicus Publications remains neutral with regard to jurisdictional claims made in the text, published maps, institutional affiliations, or any other geographical representation in this paper. The authors bear the ultimate responsibility for providing appropriate place names. Views expressed in the text are those of the authors and do not necessarily reflect the views of the publisher.
An HPLC/ELSD prototype was loaned from Agilent for the experimental work. We also thank A. Boies for the shared aerosol measurement equipment.
F. Bertani and J. Hassim were funded by the UK EPRSC Centre for Doctoral Training in Aerosol Science (grant no. EP/S023593/1). F. Bertani was partly funded by Agilent, Inc. (S. O'Donohue, S. Bullock, grant no. 4414), and J. Hassim was partly funded by Alphasense, with further contribution from Cambustion.
This paper was edited by Eirini Goudeli and reviewed by two anonymous referees.
Adelantado, C., Rodríguez-Fariñas, N., Rodríguez Martín-Doimeadios, R. C., Zougagh, M., and Ángel Ríos: Analysis of silica nanoparticles by capillary electrophoresis coupled to an evaporative light scattering detector, Anal. Chim. Acta, 923, 82–88, https://doi.org/10.1016/j.aca.2016.03.055, 2016. a
Aliseda, A., Hopfinger, E. J., Lasheras, J. C., Kremer, D. M., Berchielli, A., and Connolly, E. K.: Atomization of viscous and non-Newtonian liquids by a coaxial, high-speed gas jet. Experiments and droplet size modeling, Int. J. Multiphas. Flow, 34, 161–175, 2008. a, b, c, d
Bertani, F.: Improving Evaporative Light Scattering Detector performance using Experiments and Modelling, PhD thesis, Apollo – University of Cambridge Repository, https://doi.org/10.17863/CAM.116176, 2024. a, b
Bertani, F., Hassim, J., and Hochgreb, S.: Simulation of aerosol transport, evaporation and scattering in the Evaporative Light Scattering Detector – Part 2, Aerosol Res., 4, 325–344, https://doi.org/10.5194/ar-4-325-2026, 2026. a, b, c, d
Boborodea, A., Mirabella, F. M., and O'Donohue, S.: Polyolefin characterization in xylene by high-temperature gel permeation chromatography with a new evaporative light scattering detector, Chromatographia, 81, 419–424, 2018. a
Bothe, H. and Cammenga, H. K.: Phase transitions and thermodynamic properties of anhydrous caffeine, J. Therm. Anal., 16, 267–275, https://doi.org/10.1007/BF01910688, 1979. a
Boutier, A.: Laser metrology in fluid mechanics: granulometry, temperature and concentration measurements, John Wiley & Sons, ISBN 978-1-848-21398-2, 2013. a
Cai, C., Stewart, D. J., Reid, J. P., Zhang, Y.-h., Ohm, P., Dutcher, C. S., and Clegg, S. L.: Organic Component Vapor Pressures and Hygroscopicities of Aqueous Aerosol Measured by Optical Tweezers, J. Phys. Chem. A, 119, 704–718, https://doi.org/10.1021/jp510525r, 2015. a
Canals, A., Wagner, J., Browner, R. F., and Hernandis, V.: Empirical model for estimating drop size distributions of aerosols generated by inductively coupled plasma nebulizers, Spectrochim. Acta B, 43, 1321–1335, https://doi.org/10.1016/0584-8547(88)80172-1, 1988. a
Dalavitsou, A., Vasiliadis, A., Mordos, M. D., Kouskoura, M. G., and Markopoulou, C. K.: Analytes’ Structure and Signal Response in Evaporating Light Scattering Detector (ELSD), Curr. Anal. Chem., 15, 540–552, https://doi.org/10.2174/1573411014666180330161557, 2019. a
Doß, M. and Bänsch, E.: Numerical study of single droplet drying in an acoustic levitator before the critical point of time, Chem. Eng. Sci., 248, 117149, https://doi.org/10.1016/j.ces.2021.117149, 2022. a
Dunbar, C. A., Concessio, N. M., and Hickey, A. J.: Evaluation of Atomizer Performance in Production of Respirable Spray-Dried Particles, Pharm. Dev. Technol., 3, 433–441, https://doi.org/10.3109/10837459809028624, 1998. a
Fu, N., Woo, M. W., and Chen, X. D.: Single droplet drying technique to study drying kinetics measurement and particle functionality: a review, Dry. Technol., 30, 1771–1785, https://doi.org/10.1080/07373937.2012.708002, 2012. a
Gregson, F. K. A., Robinson, J. F., Miles, R. E. H., Royall, C. P., and Reid, J. P.: Drying Kinetics of Salt Solution Droplets: Water Evaporation Rates and Crystallization, J. Phys. Chem. B, 123, 266–276, https://doi.org/10.1021/acs.jpcb.8b09584, 2019. a
Griesser, U. J., Szelagiewicz, M., Hofmeier, U. C., Pitt, C., and Cianferani, S.: Vapor Pressure and Heat of Sublimation of Crystal Polymorphs, J. Therm. Anal. Calorim., 57, 45–60, https://doi.org/10.1023/A:1010188923713, 1999. a
Groen, H. and Roberts, K. J.: Nucleation, growth, and pseudo-polymorphic behavior of citric acid as monitored in situ by attenuated total reflection Fourier transform infrared spectroscopy, J. Phys. Chem. B, 105, 10723–10730, https://doi.org/10.1021/jp011128l, 2001. a
He, W., Liu, J., Zhou, X., Lin, X., Chang, D., and Guo, Y.: Production of ultrafine particles with nanometer size distribution via a bubble film bursting method, Powder Technol., 443, 119920, https://doi.org/10.1016/j.powtec.2024.119920, 2024. a
Hinds, W. C. and Zhu, Y.: Aerosol technology: properties, behavior, and measurement of airborne particles, John Wiley & Sons, ISBN 978-1-119-49404-1, 2022. a, b, c
Johnson, T. J., Irwin, M., Symonds, J. P. R., Olfert, J. S., and Boies, A. M.: Measuring aerosol size distributions with the aerodynamic aerosol classifier, Aerosol Sci. Tech., 52, 655–665, https://doi.org/10.1080/02786826.2018.1440063, 2018. a, b, c
Kahen, K., Acon, B. W., and Montaser, A.: Modified Nukiyama–Tanasawa and Rizk–Lefebvre models to predict droplet size for microconcentric nebulizers with aqueous and organic solvents, J. Anal. At. Spectrom., 20, 631–637, https://doi.org/10.1039/B501186H, 2005. a
Kashani, A. and Mostaghimi, J.: Aerosol characterization of concentric pneumatic nebulizer used in inductively coupled plasma – Mass spectrometry (ICP-MS), Atomization Spray., 20, https://doi.org/10.1615/AtomizSpr.v20.i5.40, 2010. a, b
Kemp, I. C., Wadley, R., Hartwig, T., Cocchini, U., See-Toh, Y., Gorringe, L., Fordham, K., and Ricard, F.: Experimental Study of Spray Drying and Atomization with a Two-Fluid Nozzle to Produce Inhalable Particles, Dry. Technol., 31, 930–941, https://doi.org/10.1080/07373937.2012.710693, 2013. a
Kemp, I. C., Hartwig, T., Herdman, R., Hamilton, P., Bisten, A., and Bermingham, S.: Spray drying with a two-fluid nozzle to produce fine particles: Atomization, scale-up, and modeling, Dry. Technol., 34, 1243–1252, https://doi.org/10.1080/07373937.2015.1103748, 2016. a
Lafosse, M., Elfakir, C., Morin-Allory, L., and Dreux, M.: The advantages of evaporative light scattering detection in pharmaceutical analysis by high performance liquid chromatography and supercritical fluid chromatography, J. High Res. Chromatog., 15, 312–318, https://doi.org/10.1002/jhrc.1240150509, 1992. a
Mezhericher, M., Nunes, J. K., Guzowski, J. J., and Stone, H. A.: Aerosol-assisted synthesis of submicron particles at room temperature using ultra-fine liquid atomization, Chem. Eng. J., 346, 606–620, https://doi.org/10.1016/j.cej.2018.04.054, 2018. a
Mourey, T. H. and Oppenheimer, L. E.: Principles of operation of an evaporative light-scattering detector for liquid chromatography, Anal. Chem., 56, 2427–2434, 1984. a
Ohgaki, K., Hirokawa, N., and Ueda, M.: Heterogeneity in aqueous solutions: electron microscopy of citric acid solutions, Chem. Eng. Sci., 47, 1819–1823, https://doi.org/10.1016/0009-2509(92)80300-2, 1992. a
Payne, S. D., Johnson, T. J., and Symonds, J. P. R.: Characterisation of the Aerodynamic Aerosol Classifier Transfer Function for Particle Sizes up to 5 Micrometres, Aerosol Air Qual. Res., 23, 230008, https://doi.org/10.4209/aaqr.230008, 2023. a
Pence, H. E. and Williams, A.: ChemSpider: an online chemical information resource, Royal Society of Chemistry, https://www.chemspider.com/ (last access: 1 July 2026), 2010. a, b, c
Power, R. M. and Reid, J. P.: Probing the micro-rheological properties of aerosol particles using optical tweezers, Rep. Prog. Phys., 77, 074601, https://doi.org/10.1088/0034-4885/77/7/074601, 2014. a
Sarfraz, A., Simo, A., Fenger, R., Christen, W., Rademann, K., Panne, U., and Emmerling, F.: Morphological Diversity of Caffeine on Surfaces: Needles and Hexagons, Cryst. Growth Des., 12, 583–588, https://doi.org/10.1021/cg101358q, 2012. a
Sijs, R., Kooij, S., Holterman, H. J., van de Zande, J., and Bonn, D.: Drop size measurement techniques for sprays: Comparison of image analysis, phase Doppler particle analysis, and laser diffraction, AIP Advances, 11, 015315, https://doi.org/10.1063/5.0018667, 2021. a
Stunda-Zujeva, A., Irbe, Z., and Berzina-Cimdina, L.: Controlling the morphology of ceramic and composite powders obtained via spray drying – a review, Ceram. Int., 43, 11543–11551, 2017. a
Thybo, P., Hovgaard, L., Andersen, S. K., and Lindeløv, J. S.: Droplet Size Measurements for Spray Dryer Scale-Up, Pharm. Dev. Technol., 13, 93–104, https://doi.org/10.1080/10837450701830957, 2008. a
Vehring, R.: Pharmaceutical particle engineering via spray drying, Pharm. Res., 25, 999–1022, 2008. a
Wang, S. and Langrish, T.: A review of process simulations and the use of additives in spray drying, Food Res. Int., 42, 13–25, https://doi.org/10.1016/j.foodres.2008.09.006, 2009. a
Wulsten, E., Kiekens, F., van Dycke, F., Voorspoels, J., and Lee, G.: Levitated single-droplet drying: Case study with itraconazole dried in binary organic solvent mixtures, Int. J. Pharm., 378, 116–121, https://doi.org/10.1016/j.ijpharm.2009.05.060, 2009. a
Xiang, M., Morgeneyer, M., Aguerre-Chariol, O., Philippe, F., and Bressot, C.: Airborne nanoparticle collection efficiency of a TEM grid-equipped sampling system, Aerosol Sci. Tech., 55, 526–538, https://doi.org/10.1080/02786826.2020.1870923, 2021. a
Yuan, W., Wu, F., Geng, Y., Xu, S., and Jin, T.: Preparation of dextran glassy particles through freezing-induced phase separation, Int. J. Pharm., 339, 76–83, https://doi.org/10.1016/j.ijpharm.2007.02.018, 2007. a