the Creative Commons Attribution 4.0 License.
the Creative Commons Attribution 4.0 License.
 | 09 Sep 2026
Coral reef exposure increases aerosol and cloud condensation nuclei over the Great Barrier Reef
Juha Sulo

Magdalena Okuljar
Joel Alroe
Eva Johanna Horchler
Luke Cravigan
Branka Miljevic
Luke Harrison
Daniel Harrison
Zoran Ristovski
The Great Barrier Reef (GBR) is the largest reef ecosystem in the world and is home to diverse marine life. In situ measurements characterizing lower troposphere aerosol concentrations and dynamics over the GBR are lacking in the literature. In this study, we present analysis of multi-year in situ aerosol measurements over the GBR, showing, for the first time, direct observations of coral reefs contributing to aerosol loading over the reef. Our results show that aerosol concentrations over the GBR are typical of a clean coastal environment, and the aerosol loading over the GBR is primarily influenced by the long-range transport of aerosol particles. However, a non-negligible effect from local sources is also observed. The fraction of small aerosol particles in the particle population increases in air masses that pass over the coral reef ecosystem. Finally, our statistical modelling shows that cloud condensation nuclei concentrations over the GBR are dominantly driven by the availability of accumulation and Aitken-mode aerosol particles with negligible effects from local meteorology. While accumulation-mode particle concentrations have the strongest impact on cloud condensation nuclei concentrations, counterfactual modelling simulation shows that Aitken-mode concentrations can contribute up to 6 % to cloud condensation nuclei concentrations over the reef.
- Article
(3720 KB) - Full-text XML
-
Supplement
(2173 KB) - BibTeX
- EndNote


Coral reefs are one of the most diverse ecosystems in the world, believed to be home to more than 25 % of all marine life while covering less than 1 % of the ocean floor (Knowlton et al., 2010; Reaka, 1997). Globally, coral reefs offer protection to coastlines from extreme weather events (Harris et al., 2018), provide job opportunities to nearby communities, and provide recreational opportunities to locals and tourists alike (Santavy et al., 2021). The Great Barrier Reef (GBR) is the largest reef ecosystem in the world and an important cultural site for indigenous Australians (Rowland et al., 2025). However, coral reefs are under severe stress from multiple stressors, including increased ocean temperatures and extreme weather events, ocean acidification, and habitat destruction by humans (Dietzel et al., 2021; Hughes et al., 2017a, b). The increase in ocean temperatures is associated with the corresponding increase in surface-intensified warming (Fox-Kemper et al., 2021). Furthermore, coral bleaching is primarily caused by heat stress from increased sea water temperature and irradiative stress from UV radiation (Berkelmans, 2002; Brown, 1997; Courtial et al., 2017). The GBR has seen an increasing frequency of mass coral-bleaching events, with severe and prevalent mass bleaching events observed on approximately 40 % of the reefs nearly every year since 2020 (Australian Government, 2024).
Aerosol particles can attenuate temperature and radiation extremes both directly by scattering light as well as via aerosol–cloud interactions. Combined aerosol–radiation and aerosol–cloud interactions are estimated to have a −1.3 [−2.0 to −0.6] W m−2 net effective radiative forcing on the global energy budget, which has masked around one-third of continental warming from greenhouse gases (Storelvmo et al., 2016). Cloud properties are modified by the availability and concentration of cloud condensation nuclei (CCN) as well as precursor aerosol. However, substantial uncertainties remain regarding the sources and variability of CCN in remote marine environments, where aerosol concentrations are typically low and local aerosol–cloud interactions may exert a proportionally larger climatic influence (Carslaw et al., 2013). Due to its remote location, aerosol dynamics over the GBR have been mostly studied by satellite measurements and modelling (Cropp et al., 2018; Fiddes et al., 2022; Jackson et al., 2018; Swan, 2022). In situ measurements characterizing lower troposphere aerosol concentrations and dynamics over the GBR are lacking in literature. Month-long field campaigns with limited instrumentation and case studies have been reported, showing that new particle formation (NPF) and local source contribution to CCN are possible (Modini et al., 2009; Swan et al., 2016; Vaattovaara et al., 2014). However, this contribution has not been quantified using robust in situ measurements for long-term effects or magnitude. Many of the studies also focus on the potential of marine dimethyl sulfide (DMS) as a precursor for non-sea salt sulfate and new aerosol particles as part of the CLAW (Charlson, Lovelock, Andreae, and Warren) hypothesis (Swan et al., 2016). The CLAW hypothesis is a negative feedback loop that links ocean warming due to an increase in solar irradiance with higher emissions of DMS and subsequent new particle formation (NPF), leading to an increase in CCN concentration and cloud albedo. Condensable vapours such as DMS can also contribute to aerosol growth and loading without ongoing NPF process.
Fiddes et al. (2022) argued in their modelling study that reef sources likely do not contribute meaningfully to increased aerosol number concentration due to the prevalence of anthropogenic sulfur over the reef from the Queensland coast but rather may contribute to increased aerosol mass or size. Earlier aerosol measurements by Modini et al. (2009) detected NPF in air masses that passed over the GBR, but the aerosol source was left uncertain. Furthermore, there are currently no in situ studies characterizing spatiotemporal aerosol variations over the GBR.
The objectives of this study are to (1) characterize spatiotemporal aerosol variability over the GBR, (2) quantify the relationship between aerosol populations and CCN concentrations, and (3) investigate the influence of cloud processing and local aerosol sources on lower tropospheric aerosol dynamics over the reef environment. To address these objectives, we characterize the spatiotemporal variation of aerosol concentrations over the GBR and quantify the drivers behind CCN concentrations using a synthesis of multiple previous campaigns conducted via mobile and stationary platforms over the span of 8 years. Assessing background aerosol concentrations and their dynamics over the GBR is part of the Reef Restoration and Adaptation Program (RRAP) Cooling and Shading Subprogram, which investigates technologies to mitigate bleaching stress on coral reefs by reducing the amount of downwelling solar radiation. Previous RRAP-related atmospheric studies over the GBR have focused on targeted observations using airborne platforms such as drones (Eckert et al., 2023, 2024) and light aircraft (Hernandez-Jaramillo et al., 2024, 2025), as well as characterization of specific atmospheric properties including boundary layer height (Ryan et al., 2024), cloud vertical structure (Braga et al., 2025), continental influence (Horchler et al., 2025), BVOC fluxes within the reef lagoon (Deschaseaux et al., 2025), and spatial cloud distributions (Zhao et al., 2024). Quantifying lower troposphere aerosol concentrations, their sources, spatiotemporal variability, and capacity to act as CCN are key steps in understanding aerosol dynamics over the reef environment. Furthermore, they are important in understanding the baseline conditions over the reef for attempting any solar radiation management interventions to protect the reef from bleaching.
2.1 Measurement campaigns
Over the last decade, there have been multiple atmospheric measurement campaigns to understand different aspects of the atmosphere over the GBR. These campaigns have large spatial variability along the reef, and varying parts of the reef have been monitored over different years (Fig. S1 in the Supplement). An overview of the campaign datasets used in this study is shown in Table 1. The Reef to Rainforest (R2R) campaign in 2016 studied the effects of the GBR itself on cloud properties and rain. The 2019 dataset represents opportunistic measurements captured during a transit voyage for the RV Investigator from Brisbane to Darwin. The remaining campaigns since 2021 have been part of the RRAP Cooling and Shading Program focused on an effort to protect the reef corals from heat and light stress but also to improve our fundamental understanding of metrological, aerosol, and cloud microphysical processes over the GBR (Braga et al., 2025; Deschaseaux et al., 2025; Eckert et al., 2023, 2024; Hernandez-Jaramillo et al., 2024; Richards et al., 2024; Ryan et al., 2024; Zhao et al., 2024). Overall, these campaigns represent both stationary measurements and longer voyage tracks, with a greater density in the southern and central reef.
Table 1Overview of campaigns used in this study.
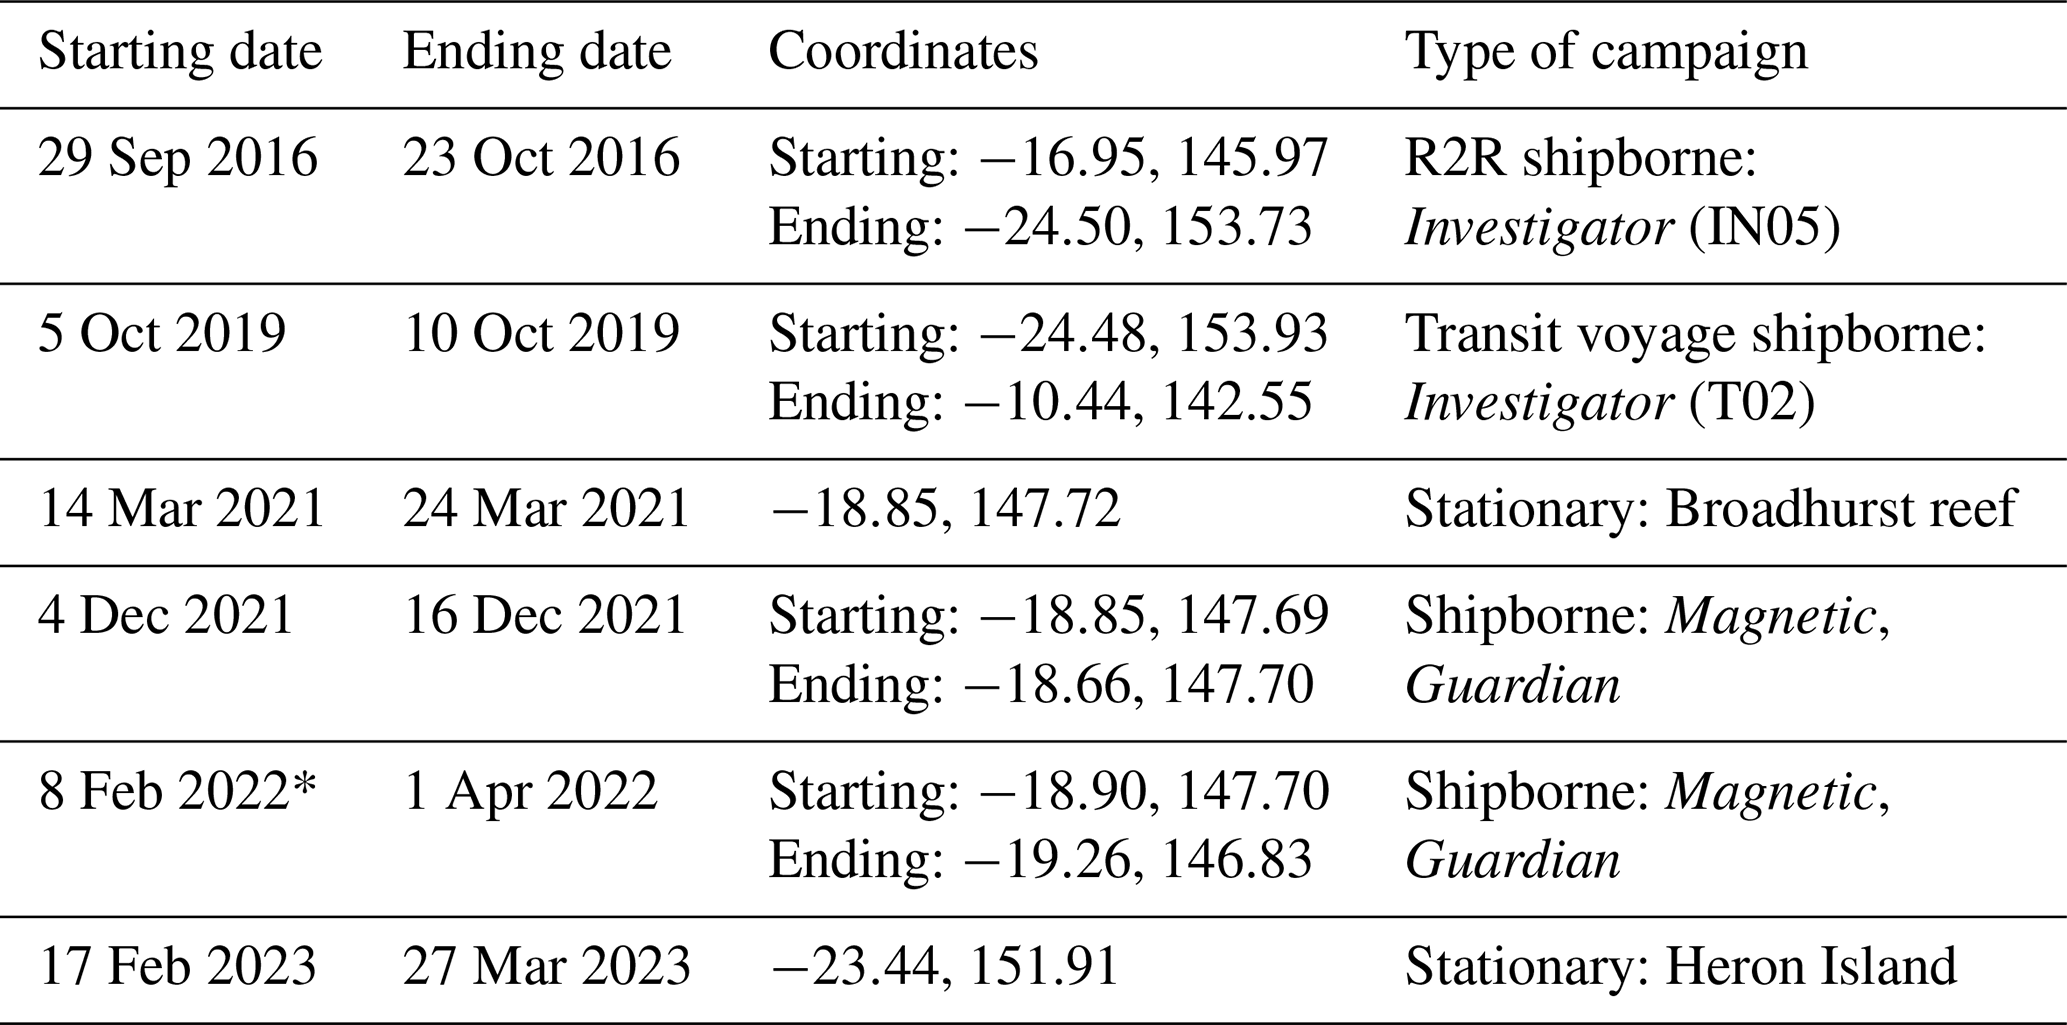
* Data from this campaign are published in Horchler et al. (2025).
2.2 Measurements
Measurements used in this study include comprehensive measurements of the physical and meteorological properties of the atmosphere over the GBR. The variables used in the general spatiotemporal characterization were narrowed down to those that appear in each measurement campaign, providing maximum spatial and temporal coverage. An overview of variables used in the analysis is listed in Table S2. The dataset was harmonized to a time resolution of 15 min, with median values used for aggregating data with a higher time resolution.
Aerosol particle number concentration was measured using a condensation particle counter (CPC, Brechtel, USA or Airmodus, Finland or TSI, USA) with a cutoff of 10 nm (Ntot), and the aerosol number size distribution was measured using a scanning mobility particle sizer (SMPS, TSI, USA) or a scanning electrical mobility spectrometer (SEMS, Brechtel, USA) and an aerodynamic particle size (APS, TSI, USA), covering a combined size range between 10 and 5000 nm. Particle number concentrations were calculated for nucleation mode (under 20 nm), Aitken mode (20–80 nm), accumulation mode (80–1000 nm), and coarse mode (1000–5000 nm). In addition to the aerosol number concentration, the cloud condensation nuclei (CCN) concentration was measured using the CCN-100 counter (Droplet Measurement Technologies, USA). In some of the campaigns, CCN concentration was measured using only a single supersaturation level of 0.5 %, and therefore for the spatiotemporal analysis, CCN concentration at 0.5 % supersaturation was chosen as indicative of CCN concentrations in the entire dataset.
Meteorological variables were measured with a number of different weather stations and instruments. Campaigns in 2016 and 2019 used the RV Investigator's built-in suite of weather sensors to investigate meteorological conditions on the reef. The March 2021 campaign utilized the WS800-UMB weather station (Lufft, Germany), and subsequent campaigns used MaxiMet GMX501 (Gill Instruments Ltd., UK). Temperature, pressure, relative humidity, solar irradiance, and wind direction and speed were measured in each campaign. Auxiliary measurements like precipitation and dew point temperature were only available in some campaign datasets and were not used in the analysis.
Black carbon (BC) concentration was measured using an aethalometer (AE31, Aerosol Magee Scientific, Slovenia) or tricolour absorption photometer (TAP, Brechtel, USA) with red wavelength. The two instruments have been shown to agree fairly well in temporal variation (R2=0.93; Marto et al., 2021), although the absolute values have discrepancies depending on the correction algorithms chosen (Laing et al., 2020).
2.3 Calculations
Several derived parameters were calculated from the available datasets to support further analysis. The Hoppel minimum (Hoppel et al., 1985; Noble and Hudson, 2019), the diameter of minimum concentration between the Aitken and accumulation modes, was calculated by fitting a smoothing spline to the size distribution between 40 and 140 nm and finding the minimum concentration diameter. In case the minimum concentration was not found within this size limit or was found at the edge of it, the size distribution was considered monomodal in terms of Aitken and accumulation mode, and the Hoppel minimum value was marked as missing. A subsequent Hoppel minimum value was constrained by the previous value, based on the assumption that a Hoppel minimum diameter varying more than 10 nm either way in 15 min would either be unrealistic or a sign of a rapid change in air mass.
The critical diameter is the particle diameter above which particles are assumed to be active as the CCN. Here, we defined it as the diameter above which the reverse sums of total particle concentration and CCN concentration reach unity (Sihto et al., 2011), and it was calculated for every data point in which aligned CCN and total concentration data were available. This method of calculating critical diameter assumes that the activation of atmospheric particles as CCN depends only on particle size, not chemical composition, under the assumption of a fully internal mixture of aerosol particles. This likely leads to higher uncertainty in critical diameter as ambient aerosol particles have a more complex mixing state (Riemer et al., 2019). The hygroscopicity parameter kappa (Petters and Kreidenweis, 2007) was calculated based on the dry critical diameter for the datasets that contained CCN concentrations measured with varying supersaturation. CCN activation ratio is defined as the ratio between CCN and total aerosol number concentrations. For consistency, only the CCN concentrations at 0.5 % supersaturation were considered. Because the real supersaturation in the atmosphere is likely to vary (Krüger et al., 2014), CCN concentration, critical diameter, activation ratio, and kappa have inherently more uncertainties than other measured variables in the dataset.
The pollution flag was calculated using BC concentration to determine episodes when ambient air was contaminated by local pollution sources such as the ship plume or diesel engine sources on Heron Island. An algorithm developed for detecting when the ship plume is affecting the measurements aboard the RV Investigator was used for the relevant campaign datasets aboard the vessel (Humphries et al., 2019). For shipborne RRAP campaigns, we flagged data points during which the winds originated from the aft sector (90–270° relative to the ship's heading) and the BC concentration was above 30 ng m−3. For the Heron Island campaign, the limit for BC was increased to 50 ng m−3, representing elevated background concentrations due to co-located infrastructure at the island-based sampling site. The specific limits were selected to account for outliers; that is, values exceeding these limits fall above the 95th percentile of the respective datasets. The pollution-flagged data accounted for 6.7 % of our dataset.
In order to determine the effect of both continental and reef sources on the air masses, 72 h back trajectories were calculated using the HYSPLIT (Stein et al., 2015) Lagrangian dispersion model by the National Oceanic and Atmospheric Administration (NOAA), matching the latitude, longitude, and time for each in situ data point. Global Data Assimilation System (GDAS) dataset at 1° spatial resolution provided by NOAA was used for HYSPLIT analysis. The land fraction was defined as the fraction of times during which HYSPLIT output coordinates placed the air mass over land and below a conservative boundary layer threshold – defined as the HYSPLIT planetary boundary layer height plus 1 standard deviation. The reef fraction was calculated in a similar manner by using the coordinates of the reefs in the GBR (Great Barrier Reef Marine Park Authority, 2007). The relative humidity and precipitation values from HYSPLIT analysis were utilized to estimate the in-cloud and precipitation exposure of air mass during 24 h prior to arriving at the measurement station (Isokääntä et al., 2022). We assumed that the air masses were in cloud if the relative humidity exceeded the 90 % or 94 % threshold. For the results, the 90 % threshold was used, but the difference between the two thresholds was minor. The precipitation data from HYSPLIT were not vertically resolved, which likely resulted in a small overestimation of the fraction of the precipitation exposure as the air masses could travel over the rain and not get affected. Low and total cloud coverage from ERA5 reanalysis data with 1 h time resolution (Hersbach et al., 2023) was used as supporting variables in the analysis. The reanalysis product combines satellite and ground-based measurements, generating a data product with a spatial resolution of 0.25∘ or roughly 31×31 km at the GBR. The data retrieved from ERA5 and air mass back trajectories were forward-filled to a 15 min resolution. The variables used from these sources typically vary in time scales larger than 15 min, and forward-filling avoids interpolation artefacts from other methods. This was done to allow merging 1 h data with 15 min in situ measurements. While forward-filling does not generate sub-hourly structure, ERA5 reanalysis does not contain physically meaningful sub-hourly information for these variables. Any other interpolation method would necessarily introduce synthetic variability, therefore forward-filling is the most conservative choice.
Gradient boosting regression algorithm from the scikit-learn Python package (Friedman, 2001; Pedregosa et al., 2011) was used to construct a predictive model and help to determine which features of the dataset best explain CCN concentrations at the GBR. The gradient boosting algorithm is an ensemble method, using several base estimators to build a decision tree in a step-by-step fashion, aiming to minimize the overall prediction error at each addition (Friedman, 2001). The gradient boosting hyperparameters were tuned by performing an exhaustive grid search in the hyperparameter space (Yang and Shami, 2020), using 5-fold cross-validation and a base regression with a learning rate of 0.1, 250 estimators, and a minimum sample split of 2 as scoring estimator. Friedman mean squared error (MSE; Friedman, 2001) was used as the metric for split quality in building the regression model. Feature selection was done by using permutation feature importance (Adler and Painsky, 2022; Breiman, 2001; Doshi-Velez and Kim, 2017) with 10 000 repetitions. The directionality of the selected features were tested using SHapley Additive exPlanation (SHAP) values (Lundberg and Lee, 2017) and partial dependence plots (Friedman, 2001).
We quantified the conditional effect of Aitken-mode aerosols on CCN concentrations using a counterfactual modelling framework. Counterfactual analysis (Manshausen et al., 2022; Marelle et al., 2025) estimates how the predicted variable of a model changes if a single predictor is altered while all other conditions remain constant. This allows for isolating the modelled contribution of specific variables under consistent meteorological and compositional contexts. We trained a gradient boosting model as described above. The model was fitted to all available observations, with predictor variables representing aerosol size distributions, composition, and concurrent meteorological conditions. The trained model was then used to generate two sets of predictions: baseline predictions, using the observed feature values, and counterfactual predictions, where the Aitken-mode particle concentration was fixed to the first percentile of its distribution. The resulting difference (ΔCCN = baseline – counterfactual) represents the modelled change in CCN concentration under a hypothetical regime of minimal Aitken-mode aerosol abundance. Uncertainty in ΔCCN was estimated using a batch bootstrap procedure that resampled contiguous temporal segments, defined by data gaps exceeding 1 h, to preserve the serial correlation structure typical of atmospheric time series. This resampling approach produced 95 % confidence intervals for the mean and median ΔCCN based on 10 000 replicates.
2.4 Uncertainty of analysis
There are a number of uncertainties related to our analysis. The uneven spatial and temporal distribution of the data makes it difficult to infer spatiotemporal variability in the analysis. Years 2021–2023 occurred during the 4-year La Niña event from 2020 to 2023, while 2016 was an El Niño year and 2019 was a neutral El Niño Southern Oscillation (ENSO). The different phases of ENSO likely contribute to the increased variability in our measurements as variations in ENSO affect not only the meteorology and precipitation over the reef but also sea surface temperatures. ENSO can influence CCN concentrations through changes in sea surface temperature, marine biological activity, DMS emissions, sea spray production, and boundary layer dynamics, as well as through altered transport, convection, and wet scavenging. These processes affect both aerosol precursor availability and the growth and survival of particles into the CCN size range. The unusually high aerosol and CCN concentrations observed in 2016 may be linked to the exceptionally strong El Niño conditions during that year, which was the only clear El Niño period in the dataset. However, the available data do not allow a direct attribution, and the cause of the elevated 2016 concentrations remains uncertain.
Additionally, the synthesis of multiple campaigns conducted over several years introduces uncertainty associated with differences in instrumentation, calibration procedures, CPC detection efficiency, diffusional losses, and differential mobility particle sizer (DMPS) inversion methods. Metadata and calibration records were not equally comprehensive for all historical campaigns, particularly the earlier datasets, increasing uncertainty in absolute intercampaign comparability. Previous intercomparison studies suggest that well-calibrated mobility particle spectrometers generally agree within approximately 10 %–20 % in the 20–200 nm size range, while substantially larger uncertainties may occur in the sub-10 nm size range because of low charging efficiency, diffusional losses, and counting statistics uncertainties (Kangasluoma et al., 2020; Wiedensohler et al., 2018). Nevertheless, the observed particle concentrations within individual campaigns commonly varied several-fold, substantially exceeding expected instrumental uncertainty, with variability observed across both Aitken and accumulation modes. This suggests that the major observed patterns are unlikely to be dominated by measurement artefacts. Finally, a lack of reliable measurements in the nucleation-mode range and a lack of sub-10 nm altogether make accounting for local sources more demanding.
Lastly, CCN concentrations in the dataset were measured at a single supersaturation of 0.5 %. This limits our ability to fully characterize the CCN activation spectrum and the sensitivity of aerosol populations to changing supersaturation conditions. Different aerosol populations may exhibit different activation behaviour at lower supersaturations due to differences in size distribution, hygroscopicity, and mixing state. Furthermore, the typical supersaturation level over the GBR is likely variable and often lower than 0.5 % (Horchler et al., 2025). Consequently, the measurements may overestimate CCN concentrations and activation ratios while underestimating the critical activation diameter. The relatively high supersaturation used in this study also increases sensitivity to smaller Aitken-mode particles, potentially enhancing the apparent contribution of recently formed particles to CCN concentrations compared with lower-supersaturation marine cloud conditions. Aerosol particles over the GBR are expected to be transported into shallow marine cloud layers through boundary layer mixing and convective uplift (Hernandez et al., 2024), making supersaturations approaching 0.5 % physically plausible under clean marine conditions with low aerosol loading and low condensation sink, where reduced competition for water vapour allows higher peak cloud supersaturations to develop (Seinfeld and Pandis, 2016). However, reef- or continentally influenced air masses with elevated aerosol concentrations likely experience lower cloud supersaturations. Consequently, the 0.5 % supersaturation used in this study likely represents an upper-range activation scenario rather than an exact representation of cloud supersaturation over the GBR.
Disentangling temporal and spatial variability over the reef requires dedicated multi-year measurements in a single location, as well as ideally a period of spatially distributed simultaneous measurements. Furthermore, our analysis does not address the potential of chemical information revealing more about the sources of the aerosol that exist over the reef. Although vapour emissions from coral reefs have been studied before, aerosol chemical composition, particularly in combination with analysis on vapour emissions over the reef, are lacking in current literature. Finally, more detailed investigation into apparent in-cloud supersaturation and the dynamics of atmospheric convection over the reef are needed to properly characterize cloud formation and the role of CCN over the GBR.
3.1 Overview of meteorological parameters and aerosol population over GBR
Overall, meteorological parameters over the GBR are representative of a subtropical marine environment, indicating a warm, humid environment (most commonly at ∼80 %) mostly influenced by marine air masses advecting from east to south-east (Fig. S2). Solar irradiance is often around 1000 W m−2, and low cloud cover fraction on the reef is typically low (Fig. S2d, i), confirming that trade wind cumulus cloud fields tend to dominate over the GBR (Coddington et al., 2016; Zhao et al., 2022). Total particle concentration (Ntot) is typically between 100 and 800 cm−3 (Fig. S3a). These concentrations are all consistent with a clean coastal environment with a mix of different sources in the Southern Hemisphere (Humphries et al., 2021a; Law et al., 2017; Peltola et al., 2022), while aerosol particle number concentrations in remote marine environments are typically reported as being below 200 cm−3 (Ansmann et al., 2023; Humphries et al., 2023).
Mode values of Ntot (500 cm−3), CCN concentration (250 cm−3), accumulation-mode (80–1000 nm) particle concentration (120 cm−3), and Hoppel minimum (70 nm) are comparable between most datasets (Fig. S3). However, the March 2021 campaign dataset stands out as an exception, exhibiting generally lower aerosol number concentrations but a higher activation ratio, critical diameter, and Hoppel minimum (Fig. S3). Aitken-mode (20–80 nm) particle concentrations are variable between years (maximum mode at 260 cm−3 and minimum mode at 100 cm−3). Coarse mode (>1 µm) concentrations are below 10 cm−3, while nucleation-mode (< 20 nm) concentrations are commonly below 100 cm−3 (Fig. S3h, i). Correlation analysis of all data shows that CCN concentration correlates well with Ntot (R=0.76) as well as accumulation (R=0.85) and Aitken (R=0.60) mode particle number concentrations (Fig. S4). This suggests that the availability of aerosol particles, especially accumulation-mode particles, is an important driver behind CCN concentration over the GBR.
Kappa values, calculated for those datasets in which multiple CCN supersaturation measurements and size-distribution measurements were available, exhibit significant variability between datasets (Fig. S3j). In particular, the December 2021 dataset exhibits kappa values that are often larger than 0.7 (Fig. S3j) but with large variability, suggesting a significant inorganic fraction (Petters and Kreidenweis, 2007) in the aerosol particles as well as complex sources. The 2023 measurements, meanwhile, show kappa values largely below 0.2 (Fig. S3j), suggesting mostly organic particles (Petters and Kreidenweis, 2007). This can likely be explained by the 2023 measurements being the only ones taking place directly on a coral cay instead on a ship. Therefore, local biogenic sources will contribute to the growth of particles and result in more organic particle composition. Overall, the observed kappa values fall within the broad range reported in previous long-term CCN studies and marine aerosol observations, with median values comparable to moderately hygroscopic marine aerosol populations reported in the literature (Andrews et al., 2025; Schmale et al., 2017).
3.2 Spatiotemporal variability of clouds and aerosols over GBR
The CCN concentrations do not reveal any monotonal spatial trend; however, the spatial distribution of observed CCN concentration is visually comparable to the spatial distribution of measured Ntot (Fig. S5). The varying speed and scale of aerosol processes (from growth and evaporation in seconds to synoptic-scale processes taking days), and the non-continuous spatially heterogeneous measurements make detecting spatial variability in our dataset very difficult. Previous research shows that the GBR region is mainly dominated by high clouds, altocumulus clouds, and low-level clouds (Zhao et al., 2022). The low-level cloud cover fraction over GBR is usually between 10 % and 20 % over the year (Zhao et al., 2022), consistent with the ERA5 median low cloud cover during our measurement period (Fig. S2i). Spatial analysis shows that median total cloud cover is the highest at the northern part of the GBR, and it decreases with higher latitude (Fig. S6a). On the contrary, the median low cloud cover does not exhibit a clear relation with latitude, but in the southern and central parts of the GBR, it is usually lower between the coast and the outer reef than over the open ocean (Fig. S6b).
In terms of temporal variance, the highest median Ntot and CCN concentrations are observed during the 2016 measurements. The 2016 CCN concentrations are statistically different from the 2023 measurements (Mann–Whitney U test, p<0.01), but otherwise concentrations are similar campaign to campaign (Fig. 1a). The CCN activation ratio remains stable, independent of the campaigns with no statistically significant differences between campaigns (Fig. 1b). Total particle number concentration splits into three groups, with 2016 and 2019 being statistically similar, measurements post December 2021 inclusive being similar with one another, and the low concentrations measured during the March 2021 campaign standing out from the rest (Fig. 1c). The spatial effects can be confounded with temporal effects, particularly with temporal gaps and uneven spatial coverage. However, even limiting the dataset to just central and southern GBR and avoiding the sparser northern GBR, the temporal effects appear similar (Fig. S7).
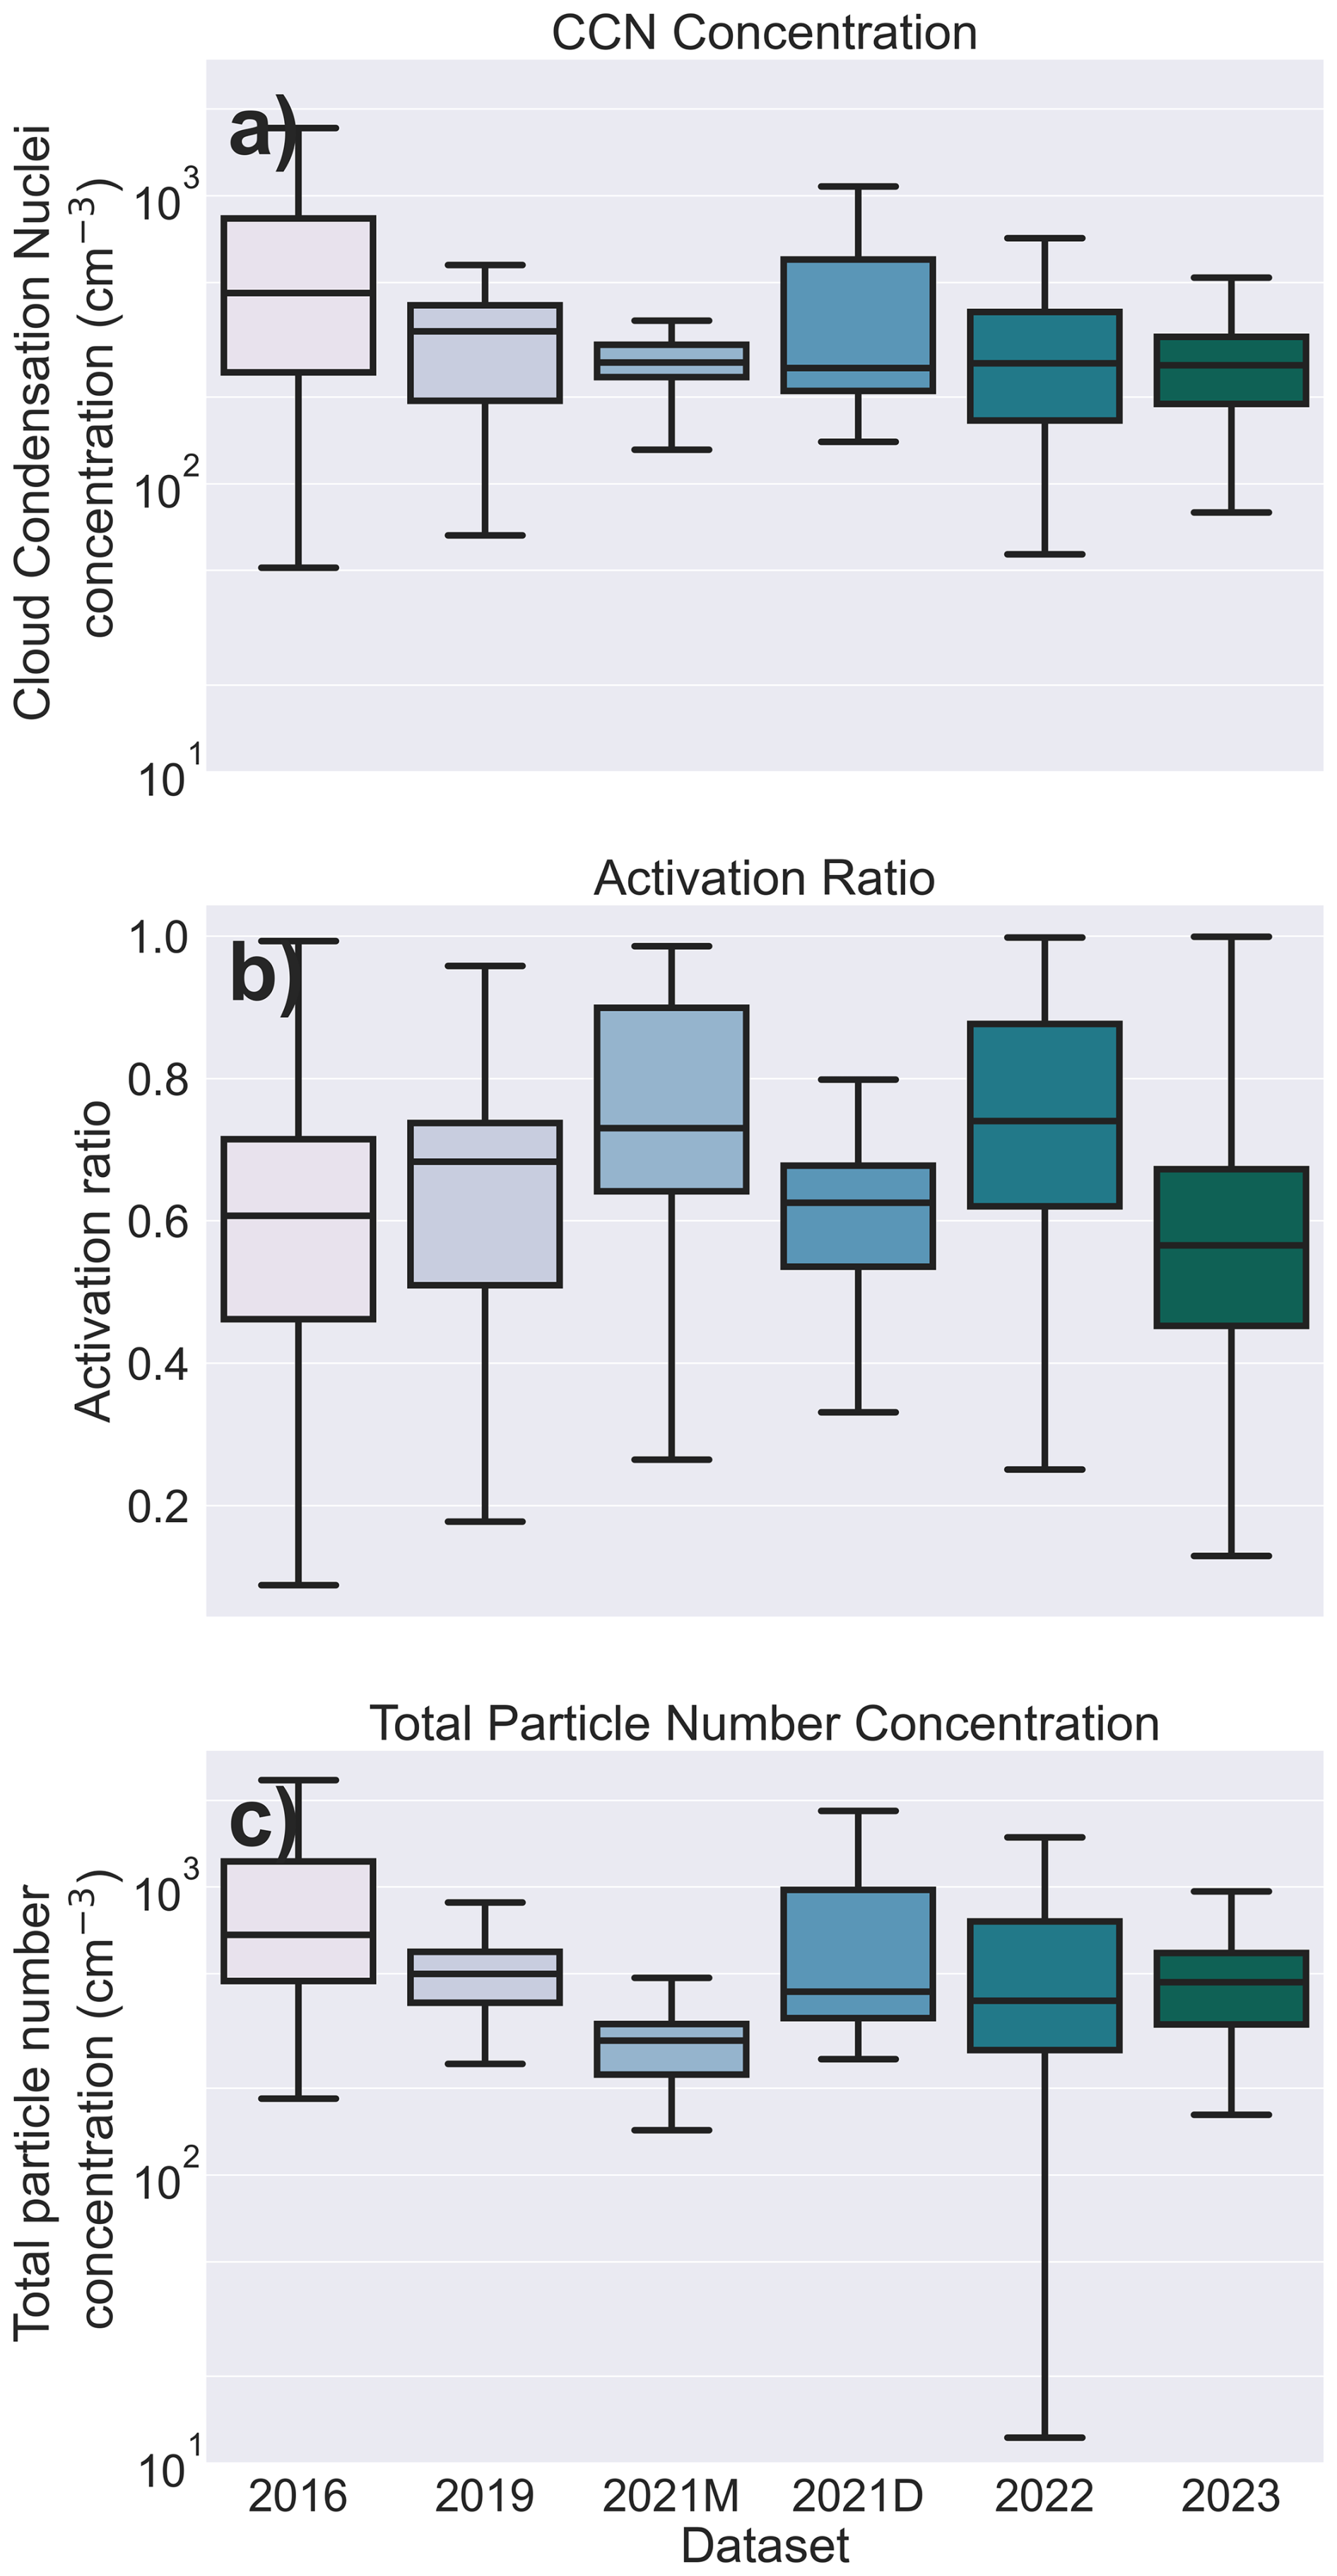
Figure 1Temporal variability of cloud condensation nuclei (CCN) concentration (a), activation ratio (b), and total particle number concentration (c). The middle line of a boxplot represents the median value, the upper and lower edges of a box show the interquartile range, and the whiskers show the entire range.
3.3 Cloud processing
Cloud processing occurs to particles with diameters large enough to activate as CCN (Seinfeld and Pandis, 2016). In air masses where cloud processing has occurred, particularly marine air masses, this can usually be identified by the presence of a Hoppel minimum (Hoppel et al., 1985). Our analysis shows that over the GBR, a Hoppel minimum is observed in the size distribution in 92 % of times, suggesting that cloud processing commonly occurs in the air masses that reach the reef (Braga et al., 2025). However, bimodality alone cannot uniquely identify cloud processing, as distinct primary and secondary aerosol populations can also produce multimodal size distributions. To independently assess whether the observed size-distribution structure was consistent with recent cloud exposure, air mass histories were classified using HYSPLIT relative humidity and precipitation along the preceding 24 h of each trajectory (Isokääntä et al., 2022). Overall, 66.9 % of air masses experienced precipitation, while a further 1.5 % encountered non-precipitating cloud conditions; 31.6 % showed neither (Table S2). Air masses with precipitation history exhibited lower total, Aitken mode, accumulation mode, and CCN concentrations, consistent with aerosol removal by wet scavenging (Fig. S8). These results provide independent meteorological support for frequent cloud processing of aerosol reaching the GBR, although the trajectory-based classification and Hoppel minimum represent complementary rather than equivalent indicators of cloud history.
To investigate processes affecting CCN concentrations and hence cloud processing over the GBR, comparison between data binned by the CCN concentration was analysed (Fig. 2).
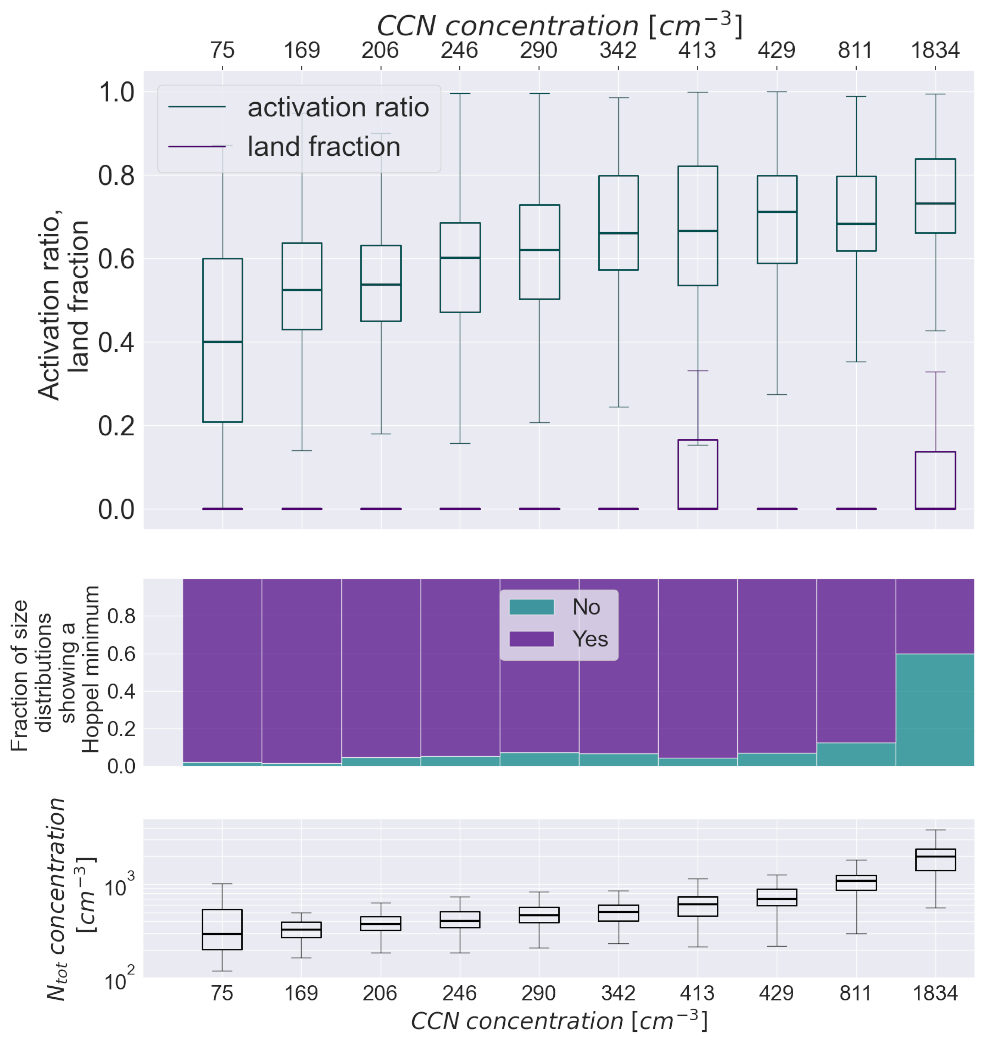
Figure 2Activation ratio, land fraction, and fraction of data with no Hoppel minimum present as well as total number concentration of particles for different CCN concentration bins. CCN concentration bins were created based on CCN concentration quantiles, ensuring equal distribution of data points between analysed bins. Values of activation ratio, land fraction, and total number concentration of particles are visualized by boxplots. Here, the middle line represents the median value; the upper and lower edges of a box show 75 % and 25 % percentiles, respectively; and the whiskers show the entire range.
CCN concentration appears to increase with both total particle number concentration and activation ratio, but the activation ratio begins to plateau at around 0.7 for CCN concentrations higher than 340 cm−3 (Fig. 2). The size distribution for CCN concentrations below the median CCN concentration (Q1 and Q2) remains stable for medium and high activation ratios, with low activation ratios associated with generally smaller Aitken-mode diameter and an enriched Aitken-mode concentration (Fig. 3a, b). At higher CCN concentrations, the Aitken-mode peak widens considerably towards smaller sizes, suggesting an influx of ultrafine particles, possibly from more local sources (Fig. 3c, d). At the fourth quartile (Q4) CCN concentration, a separate nucleation-mode peak is observed during low activation ratio periods, further suggesting influence from more local sources. At high activation ratios, the Hoppel minimum disappears, suggesting transport of air masses that have not undergone cloud processing. Considering the high concentrations of accumulation-mode particles and small fraction of Aitken-mode particles, it is likely this is due to non-marine sources from the Australian continent. These periods match with the highest CCN concentrations, as observed in Fig. 2, where extreme CCN concentrations are associated with an increase in land fraction – the fraction of time the air mass spent over the continent. Overall, these findings suggest there could be two mechanisms that contributed to increased CCN concentrations over the reef: continental transport or locally created new particles.

Figure 3Aerosol size distributions for the four quartiles of CCN concentrations (a, b, c, d). Aerosol size distributions are coloured by the activation ratio low (0.03–0.53; purple), medium (0.53–0.69; black), and high (0.69–0.99; green). Shaded areas present the interquartile ranges. Values of activation ratio ranges for each CCN concentration quartile as well as values of CCN concentration quartile are listed in Table S3.
3.4 Plausible drivers of atmospheric CCN concentration
To estimate the importance of atmospheric variables to CCN concentrations over the reef, a gradient boosting regression model was constructed. The dataset (N=1944) was split into into a training and a test set. Features that showed a statistically significant change in the feature importance analysis are shown in Fig. 4, and the full table of inputs can be found in Fig. S9. The model performs very well for the test set (r2=0.907).
The analysis shows that accumulation-mode particle number concentration is the strongest predictor of CCN concentration, with higher accumulation-mode concentration leading to higher CCN concentration (Fig. S10a, b), which is consistent with previous studies (Fossum et al., 2020; Kawana et al., 2022; Seinfeld and Pandis, 2016). Aitken-mode concentration is the second-best predictor. Importantly, the gradient boosting model evaluates predictor importance conditionally in the presence of all other variables included in the model. Therefore, the identified importance of Aitken-mode concentration does not simply reflect covariance with accumulation-mode concentration but indicates that Aitken-mode particles provide additional predictive information for CCN concentrations beyond that already explained by accumulation-mode particles alone. Critical diameter and sea surface temperature appear to play a role as well, with higher critical diameter reducing CCN concentration and sea surface temperature extremes increasing CCN concentration. Finally, BC concentration, nucleation-mode concentration, and activation ratio appear to have a small but statistically significant effect. The above results suggest that although accumulation-mode concentration primarily drives CCN concentration, smaller particles in the sub-100 nm range have an effect. However, nucleation-mode concentrations are considered underestimated as they are subject to notable uncertainties in charging and detection efficiency (Kangasluoma et al., 2020), and thus some nucleation-mode dynamics are underrepresented. Nucleation-mode particles will also not directly contribute to CCN concentration due to being too small to be activated as CCN. However, they can still contribute indirectly by first growing to larger sizes or by coagulating and contributing to the size and mass of larger particles. Previous studies suggest that low-intensity new particle formation is likely a relatively common feature of clean marine air masses over the GBR under conditions of active photochemistry and low condensation sink (Modini et al., 2009; Vaattovaara et al., 2014).
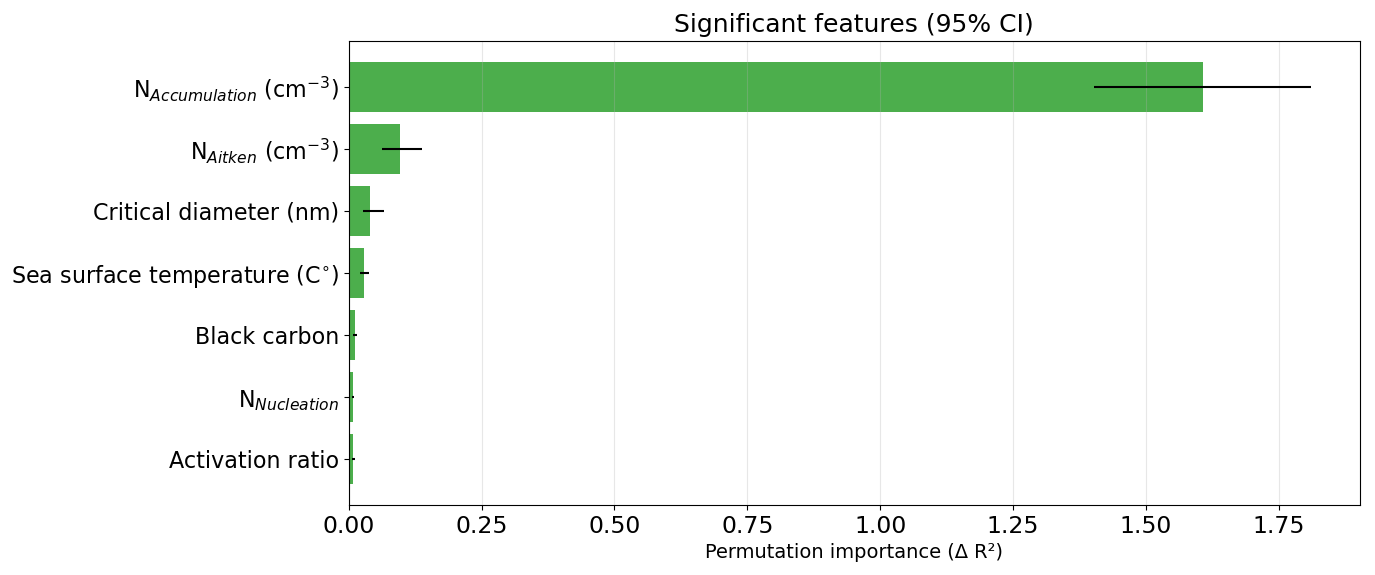
Figure 4Permutation feature importance of climate variables in explaining CCN concentration. The differences between original and permuted mean square errors on the x axis indicate how important each feature is in predicting the CCN concentration, with larger difference between original and permuted values indicating a more important feature. The black whiskers indicate 95 % confidence intervals. The number of permutations used was 10 000.
The effect of Aitken-mode particles on CCN concentration was investigated by a counterfactual modelling approach using the gradient boosting algorithm (see Sect. 2). This method was chosen because a simple linear decomposition or subtraction of accumulation-mode concentration from CCN concentration cannot distinguish between direct covariance between aerosol modes and physically meaningful indirect contributions arising from aerosol growth, coagulation, and nonlinear interactions. It might over or underestimate the true effect of Aitken-mode particles to CCN. For example, a smaller Aitken-mode concentration would likely affect coagulation scavenging to accumulation mode. A modelling approach allows keeping the inherent relationships of the ambient variables intact while minimizing Aitken-mode concentration in a believable way. The results show that Aitken-mode particle concentration can contribute 5.6 % (4.6 %–5.9 % confidence intervals) to CCN concentration over the GBR (Fig. S11). The contribution is calculated from counterfactual modelling with confidence intervals representing the 5th and 95th percentiles of the effect from bootstrapping.
A log-log ordinary least squares regression showed that 81.6 % of the variance in CCN concentration was explained by accumulation-mode concentrations alone. Including Aitken-mode concentrations in the regression did not measurably increase the explained variance (ΔR2<0.001). However, counterfactual gradient boosting analysis still attributed approximately 6 % of CCN to Aitken-mode particles, suggesting a secondary contribution associated with particle growth pathways and nonlinear interactions not captured by simple linear regression.
We additionally fitted a simple power-law parameterization relating CCN concentration to accumulation-mode concentration (NACC):
which corresponds to
The resulting parameterizations are summarized in Fig. 5. Fits were evaluated for the full dataset as well as two subsets representing clean marine conditions (reef fraction <0.1 and land fraction <0.1) and reef- and/or land-influenced conditions. While the parameterization is not intended as a predictive model, it provides a useful framework for comparing how much CCN variance can be explained by accumulation-mode concentrations alone under different air mass regimes.
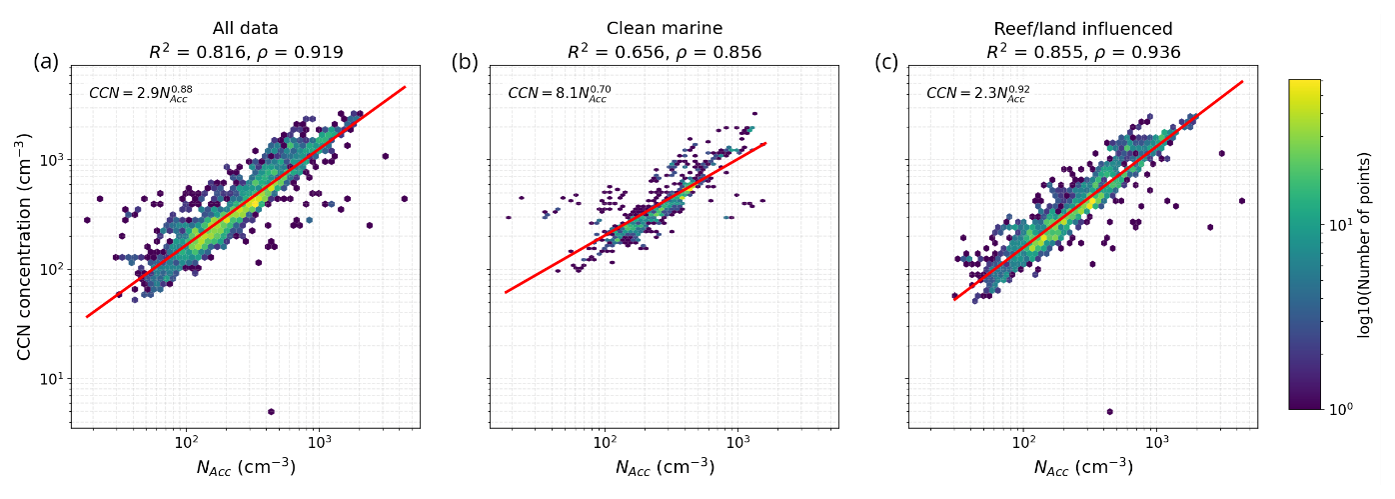
Figure 5An ordinary least squares regression analysis fitted to log-log accumulation mode (NACC) and CCN concentration data for all the data (a), clean marine data (b), and reef/land-influenced data.
The CCN–accumulation-mode relationship weakened under clean marine conditions (R2=0.656), suggesting that additional factors beyond accumulation-mode abundance – such as aerosol composition, growth state, or recently formed particles – exert a larger relative influence on CCN variability in pristine marine air masses. This interpretation is consistent with the counterfactual gradient boosting analysis, which indicated a modest but non-negligible contribution of Aitken-mode particles to CCN concentrations.
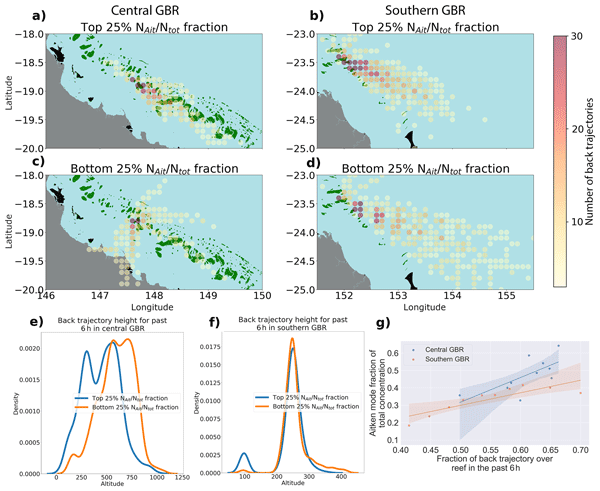
To examine whether the Aitken mode is sensitive to specific sources or geographic regions, we examine the air mass back trajectories that coincided with the highest and lowest quartiles of aerosol number fraction contributed by the Aitken mode. Figure 6a–d represents two geographic areas where our dataset contains a high density of data points in a small area, 0.5° × 0.5° or approx. 55×55 km each. When Aitken-mode enrichment occurs, air masses predominantly travel over the reef rather than the open ocean. This is also a general trend, in which increased time spent over the reef enhances the Aitken-mode enrichment in both the central and southern GBR, irrespective of whether we are measuring on a reef or on open ocean (Fig. 6g). Air masses also typically travel at lower altitudes and always within the mixing layer during periods of Aitken-mode enrichment, increasing exposure to surface fluxes (Fig. 6e–f).
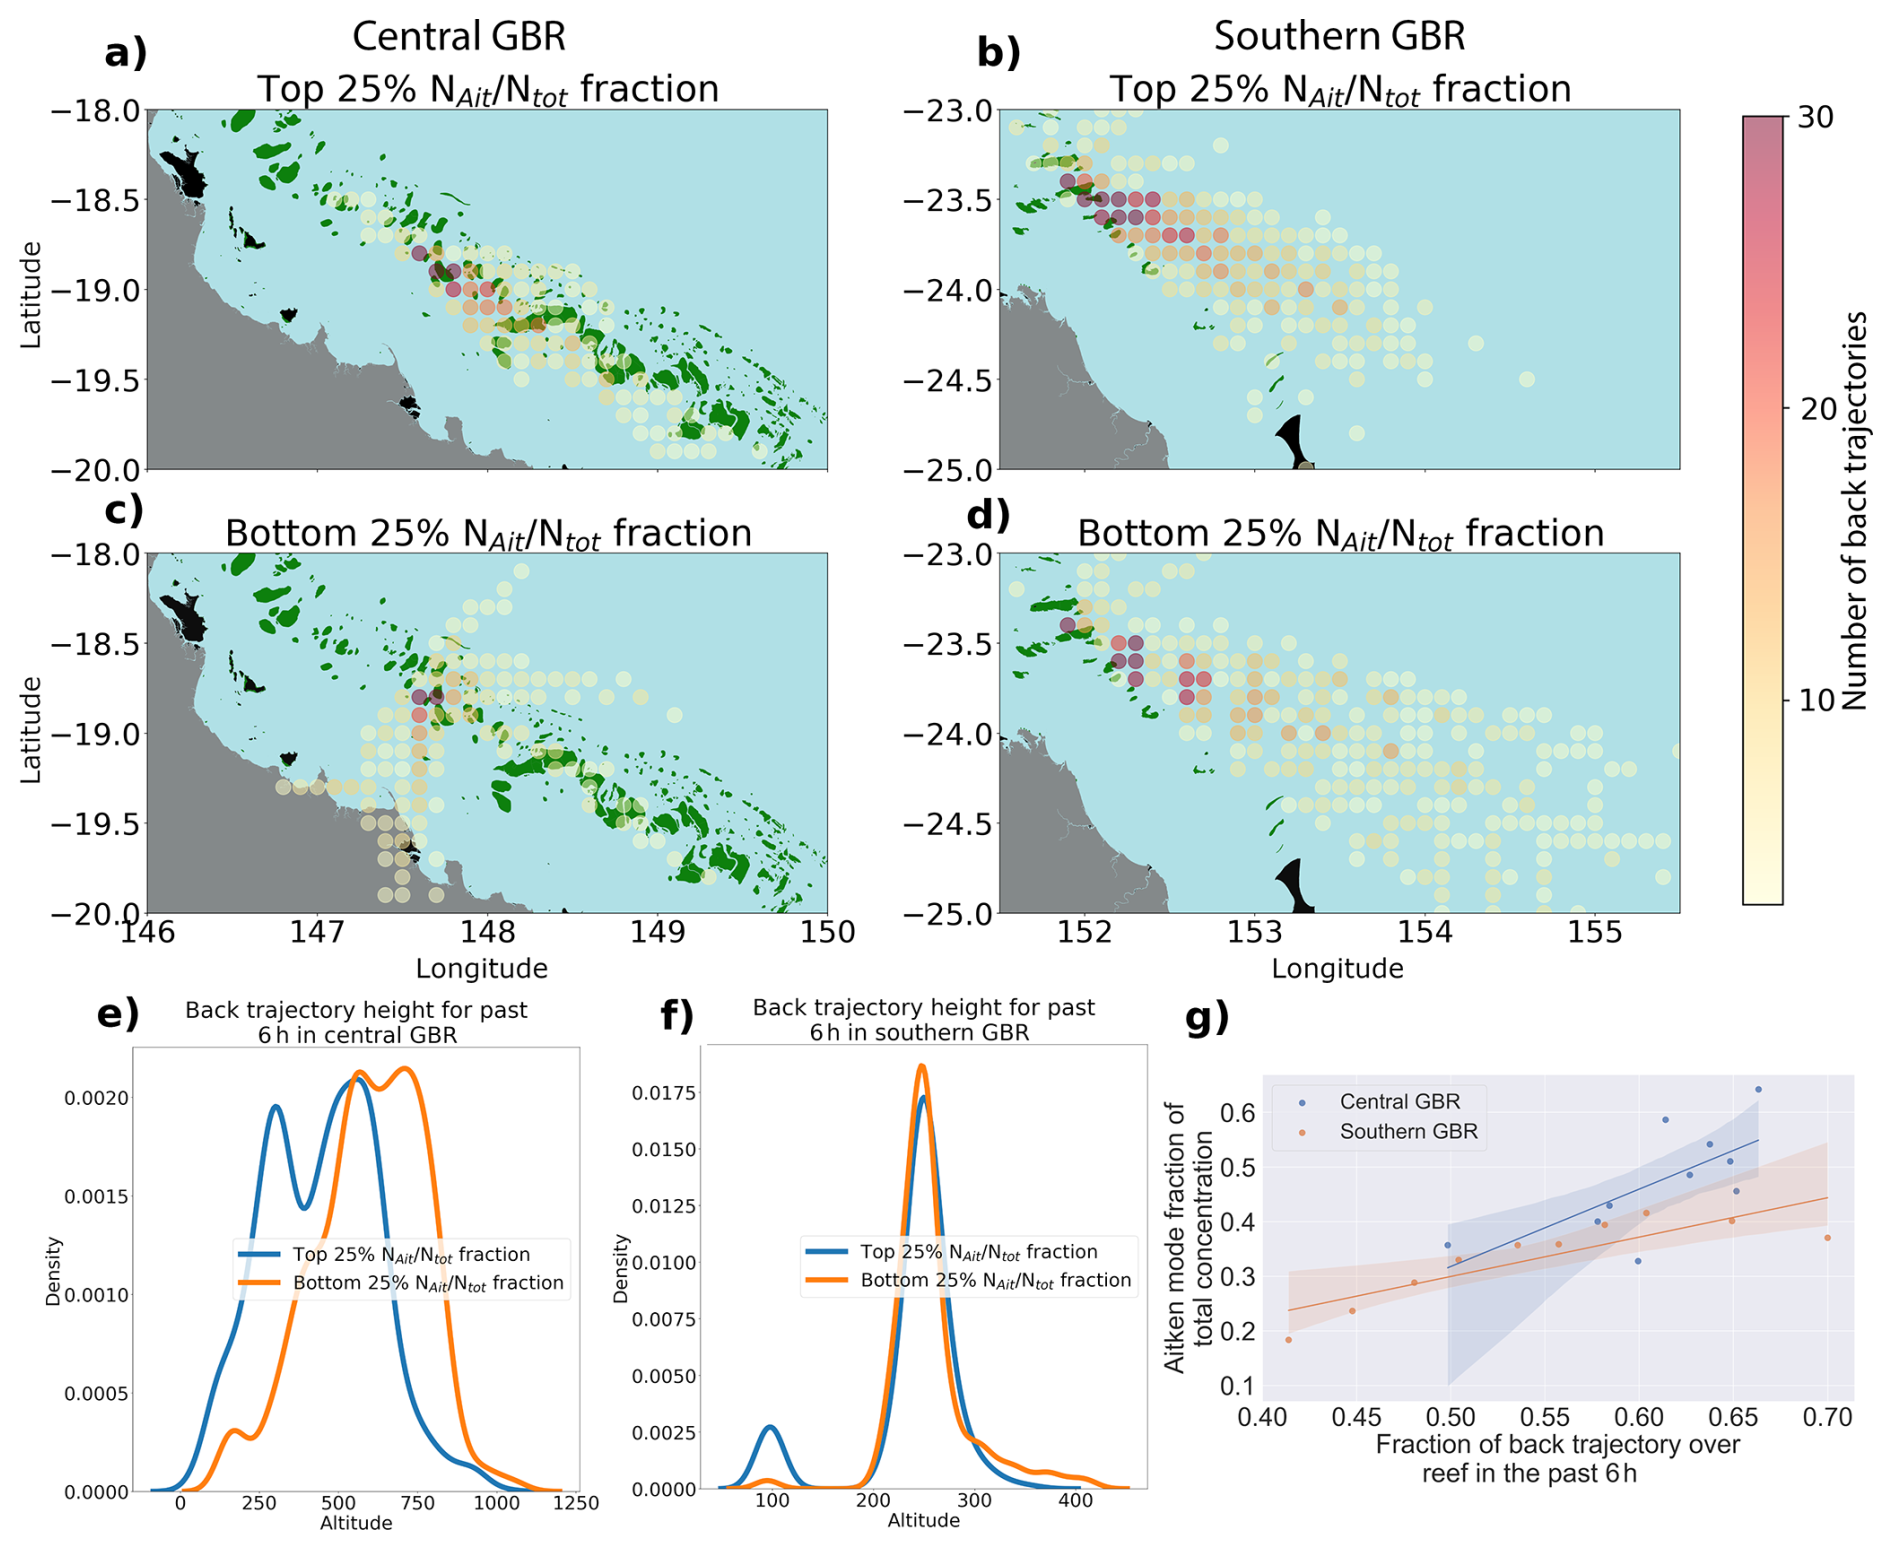
Figure 6Spatial distribution of 6 h back trajectories for data with top 25 percentile (a, b) and bottom 25 percentile (c, d) of Aitken-mode fraction in proportion to total particle concentration in central GBR (left) and southern GBR (right). The green areas are reefs, black areas are islands, and the grey area is the Australian mainland. Kernel density estimates for the back trajectory altitude for top 25 % (blue) and bottom 25 % (orange) Aitken-mode fraction in central (e) and southern (f) GBR. Fraction of the total aerosol number concentration in the Aitken mode plotted against the proportion of the past 6 h during which the air mass was over the reef at central and southern GBR (g). The lines are linear fits to calculated Aitken-mode fraction quantiles and their respective reef fractions. Shaded areas represent the line fit uncertainty.
Aerosol concentrations over the GBR are typical of a clean coastal environment (Dall'Osto et al., 2011), sitting somewhere between a clean marine (Humphries et al., 2021a, 2023) and Australian land environment (Chen et al., 2019; Milic et al., 2017; Tessendorf et al., 2013). While the North Atlantic and the GBR are not directly equivalent marine environments, the comparison with Mace Head (Dall'Osto et al., 2011) provides useful context for clean coastal aerosol conditions. The comparison to the Southern Ocean (Humphries et al., 2021b, 2023) represents a substantially more pristine Southern Hemisphere marine environment, showing that aerosols in the GBR are higher than the baseline. The air masses observed at the GBR frequently went through cloud processing, resulting in a particle number size distribution that often contains a Hoppel minimum (92 %). While mode values of most particle parameters – Ntot, CCN concentration, accumulation-mode particle concentration, and Hoppel minimum – are comparable between most measurements, the hygroscopicity parameter exhibits significant variability between data. This suggests that we are capturing a variety of different aerosol particles in terms of chemical composition. The heavily organic particles measured at Heron Island in 2023 are of particular note, as the stark difference suggests local organic emissions could play a key role in aerosol loading over coral cays and islands.
As it stands, it appears that aerosol loading over the GBR is primarily influenced by the long-range transport of aerosol particles. It is also apparent that there is a non-negligible effect from local sources. Air masses travelling over the reef are enriched in small particles, and their contribution to CCN concentration is up to 6 % (Fig. S11). It is important to note that this enrichment is clearly not the dominant process but rather occurs in the background. The process is likely similar to silent NPF described in Kulmala et al. (2022), in which it is mostly unobservable in surface plots. This is one of the key reasons why the effect can only be inferred through statistical modelling and back trajectory analysis.
Meteorology – sea surface temperature in particular – appears to play a role as well. However, although meteorological conditions do vary over the reef, their effect on CCN concentration is notably small. It could be that the meteorological effect is contained in the changing aerosol loading, and the residual effect in our statistical modelling is small. We can hypothesize that long-term changes in climate and large-scale weather patterns such as ENSO and the Southern Oscillation affect CCN concentrations primarily through changes in aerosol sources, sinks, and transport pathways. Variations in sea surface temperature influence marine biological activity, DMS emissions, and sea spray production, all of which alter the availability of aerosol precursors and primary particles. At the same time, ENSO-driven changes in boundary layer height, convection, precipitation, and large-scale circulation modify vertical mixing, wet scavenging, and the transport of aerosols and precursor gases. Together, these processes influence both the production of new particles and the survival and growth of existing particles into the CCN size range. However, confirming this hypothesis is not possible with the available data.
Previous multi-site observational studies have demonstrated strong relationships between CCN concentrations and aerosol number concentrations across a range of environments (Andrews et al., 2025; Schmale et al., 2017), and our results agree well with these observations. However, direct quantitative comparison of fitted coefficients between studies is complicated by differences in regression formulation, supersaturation conditions, and variable transformations. Within the GBR dataset itself, the clean marine subset exhibited both a weaker power-law dependence and lower explained variance than reef- and/or land-influenced air masses. This suggests that under very clean marine conditions, accumulation-mode number concentration alone becomes a less complete parameterization of CCN variability, likely because aerosol composition, growth state, activation efficiency, and recently formed particles exert a proportionally larger influence. Overall, accumulation-mode parameterizations work reasonably well overall, but clean marine environments may require additional treatment of growth processes and aerosol composition.
Coral reef contributions to aerosols and CCN are typically not explicitly parameterized in climate models. This analysis highlights the importance of resolving atmosphere–biosphere processes at fine spatial scales to capture subtle but climatically relevant sources of CCN. By directly isolating and quantifying the effect of coral reef emissions on CCN concentrations, our study provides, to our knowledge, the first direct observational evidence of a reef-origin aerosol contribution to cloud-relevant particle populations. While likely negligible at global scales, this reef signal represents a unique natural marine source that can influence regional CCN budgets and cloud microphysics. It is important to note that we cannot distinguish between various sources within the coral reef ecosystem, and therefore quantifying the exact sources within the ecosystem itself remains a subject of future work. These results offer a novel constraint for regional modelling and a foundation for incorporating biogenic aerosol processes from reef systems into Earth system models. Furthermore, this analysis method could be extended to cover other biologically active systems that are potentially important regional sources of CCN.
Our results have important implications for the RRAP Cooling and Shading Subprogram. The observed sensitivity of CCN concentrations to air mass conditions and the complex aerosol dynamics having an impact specifically in clean marine air masses suggest that the effectiveness of cooling and shading intervention over the GBR is likely notably variable in space and time. Consequently, consistent long-term atmospheric monitoring at fixed locations, together with robust characterization of baseline aerosol–cloud interactions, is essential both for resolving long-term variability in natural GBR aerosol processes and for evaluating the potential effectiveness and environmental impacts of future solar radiation management interventions over the reef.
The data used in the study are available at https://doi.org/10.6084/m9.figshare.30193285.v1 (Sulo et al., 2025).
The supplement related to this article is available online at https://doi.org/10.5194/ar-4-413-2026-supplement.
J.S. and M.O. wrote the paper, analysed the data, and prepared the figures. J.A., Z.L., E.J.H., L.C., B.M., and L.H. collected the data; and J.S., M.O., J.A., Z.L., and E.J.H. processed the data. B.M, D.H., and Z.R. conceptualized the study. All co-authors provided comments and reviewed the article.
The contact author has declared that none of the authors has any competing interests.
Publisher's note: Copernicus Publications remains neutral with regard to jurisdictional claims made in the text, published maps, institutional affiliations, or any other geographical representation in this paper. The authors bear the ultimate responsibility for providing appropriate place names. Views expressed in the text are those of the authors and do not necessarily reflect the views of the publisher.
The authors would like to acknowledge the Traditional Owners of the Great Barrier Reef, particularly the groups from the PCCC TUMRA for permission to collect atmospheric aerosol data in/on their sea country.
This research was funded by the Reef Restoration and Adaptation Program through the partnership between the Australian Government's Reef Trust and the Great Barrier Reef Foundation, and supported by a grant of sea time on RV Investigator from the CSIRO Marine National Facility (https://ror.org/01mae9353, last access: 25 May 2026).
This paper was edited by Naďa Zíková and reviewed by two anonymous referees.
Adler, A. I. and Painsky, A.: Feature Importance in Gradient Boosting Trees with Cross-Validation Feature Selection, Entropy, 24, 687, https://doi.org/10.3390/e24050687, 2022.
Andrews, E., Zabala, I., Carrillo-Cardenas, G., Titos, G., Casquero-Vera, J. A., and Hallar, A. G.: Harmonized aerosol size distribution, cloud condensation nuclei, chemistry and optical properties at 10 sites, Sci. Data, 12, 937, https://doi.org/10.1038/s41597-025-04931-y, 2025.
Ansmann, A., Ohneiser, K., Engelmann, R., Radenz, M., Griesche, H., Hofer, J., Althausen, D., Creamean, J. M., Boyer, M. C., Knopf, D. A., Dahlke, S., Maturilli, M., Gebauer, H., Bühl, J., Jimenez, C., Seifert, P., and Wandinger, U.: Annual cycle of aerosol properties over the central Arctic during MOSAiC 2019–2020 – light-extinction, CCN, and INP levels from the boundary layer to the tropopause, Atmos. Chem. Phys., 23, 12821–12849, https://doi.org/10.5194/acp-23-12821-2023, 2023.
Australian Government: Coral bleaching events | AIMS, https://www.aims.gov.au/research-topics/environmental-issues/coral-bleaching/coral-bleaching-events (last access: 10 February 2025), 2024.
Berkelmans, R.: Time-integrated thermal bleaching thresholds of reefs and their variation on the Great Barrier Reef, Mar. Ecol. Prog. Ser., 229, 73–82, https://doi.org/10.3354/meps229073, 2002.
Braga, R. C., Rosenfeld, D., Hernandez, D., Medcraft, C., Efraim, A., Moser, M., Lucke, J., Doss, A., and Harrison, D.: Cloud processing dominates the vertical profiles of aerosols in marine air masses over the Great Barrier Reef, Atmos. Res., 315, 107928, https://doi.org/10.1016/j.atmosres.2025.107928, 2025.
Breiman, L.: Random Forests, Mach. Learn., 45, 5–32, https://doi.org/10.1023/A:1010933404324, 2001.
Brown, B. E.: Coral bleaching: causes and consequences, Coral Reefs, 16, S129–S138, https://doi.org/10.1007/s003380050249, 1997.
Carslaw, K. S., Lee, L. A., Reddington, C. L., Pringle, K. J., Rap, A., Forster, P. M., Mann, G. W., Spracklen, D. V., Woodhouse, M. T., Regayre, L. A., and Pierce, J. R.: Large contribution of natural aerosols to uncertainty in indirect forcing, Nature, 503, 67–71, https://doi.org/10.1038/nature12674, 2013.
Chen, Z., Schofield, R., Rayner, P., Zhang, T., Liu, C., Vincent, C., Fiddes, S., Ryan, R. G., Alroe, J., Ristovski, Z. D., Humphries, R. S., Keywood, M. D., Ward, J., Paton-Walsh, C., Naylor, T., and Shu, X.: Characterization of aerosols over the Great Barrier Reef: The influence of transported continental sources, Sci. Total Environ., 690, 426–437, https://doi.org/10.1016/j.scitotenv.2019.07.007, 2019.
Coddington, O., Lean, J. L., Pilewskie, P., Snow, M., and Lindholm, D.: A Solar Irradiance Climate Data Record, Bull. Am. Meteorol. Soc., 97, 1265–1282, https://doi.org/10.1175/BAMS-D-14-00265.1, 2016.
Courtial, L., Roberty, S., Shick, J. M., Houlbrèque, F., and Ferrier-Pagès, C.: Interactive effects of ultraviolet radiation and thermal stress on two reef-building corals, Limnol. Oceanogr., 62, 1000–1013, https://doi.org/10.1002/lno.10481, 2017.
Cropp, R., Gabric, A., van Tran, D., Jones, G., Swan, H., and Butler, H.: Coral reef aerosol emissions in response to irradiance stress in the Great Barrier Reef, Australia, Ambio, 47, 671–681, https://doi.org/10.1007/s13280-018-1018-y, 2018.
Dall'Osto, M., Monahan, C., Greaney, R., Beddows, D. C. S., Harrison, R. M., Ceburnis, D., and O'Dowd, C. D.: A statistical analysis of North East Atlantic (submicron) aerosol size distributions, Atmos. Chem. Phys., 11, 12567–12578, https://doi.org/10.5194/acp-11-12567-2011, 2011.
Deschaseaux, E. S. M., Dunne, E., Schulz, K. G., Eyre, B. D., and Harrison, D. P.: The Central Great Barrier Reef as a Net Source of Climatically Relevant Biogenic Volatile Organic Compounds, J. Geophys. Res.-Oceans, 130, e2024JC021192, https://doi.org/10.1029/2024JC021192, 2025.
Dietzel, A., Bode, M., Connolly, S. R., and Hughes, T. P.: The population sizes and global extinction risk of reef-building coral species at biogeographic scales, Nat. Ecol. Evol., 5, 663–669, https://doi.org/10.1038/s41559-021-01393-4, 2021.
Doshi-Velez, F. and Kim, B.: Towards A Rigorous Science of Interpretable Machine Learning, https://doi.org/10.48550/arXiv.1702.08608, 2017.
Eckert, C., Monteforte, K. I., Harrison, D. P., and Kelaher, B. P.: Exploring Meteorological Conditions and Microscale Temperature Inversions above the Great Barrier Reef through Drone-Based Measurements, Drones, 7, 695, https://doi.org/10.3390/drones7120695, 2023.
Eckert, C., Hernandez-Jaramillo, D. C., Medcraft, C., Harrison, D. P., and Kelaher, B. P.: Drone-Based Measurement of the Size Distribution and Concentration of Marine Aerosols above the Great Barrier Reef, Drones, 8, 292, https://doi.org/10.3390/drones8070292, 2024.
Fiddes, S. L., Woodhouse, M. T., Utembe, S., Schofield, R., Alexander, S. P., Alroe, J., Chambers, S. D., Chen, Z., Cravigan, L., Dunne, E., Humphries, R. S., Johnson, G., Keywood, M. D., Lane, T. P., Miljevic, B., Omori, Y., Protat, A., Ristovski, Z., Selleck, P., Swan, H. B., Tanimoto, H., Ward, J. P., and Williams, A. G.: The contribution of coral-reef-derived dimethyl sulfide to aerosol burden over the Great Barrier Reef: a modelling study, Atmos. Chem. Phys., 22, 2419–2445, https://doi.org/10.5194/acp-22-2419-2022, 2022.
Fossum, K. N., Ovadnevaite, J., Ceburnis, D., Preißler, J., Snider, J. R., Huang, R.-J., Zuend, A., and O'Dowd, C.: Sea-spray regulates sulfate cloud droplet activation over oceans, Npj Clim. Atmos. Sci., 3, 14, https://doi.org/10.1038/s41612-020-0116-2, 2020.
Fox-Kemper, B., Hewitt, H. T., Xiao, C., Aðalgeirsdóttir, G., Drijfhout, S. S., Edwards, T. L., Golledge, N. R., Hemer, M., Kopp, R., Krinner, G., Mix, A., Notz, D., Nowicki, S., Nurhati, I. S., Ruiz, L., Sallée, J.-B., Slangen, A. B. A., and Yu, Y.: Ocean, Cryosphere and Sea Level Change, in: Climate Change 2021: The Physical Science Basis. Contribution of Working Group I to the Sixth Assessment Report of the Intergovernmental Panel on Climate Change, edited by: Masson-Delmotte, V., Zhai, P., Pirani, S. L., Connors, S. L., Péan, C., Berger, S., Caud, Y., Chen, L., Goldfarb, L., Gomis, M. I., Huang, M., Leitzell, K., Lonnoy, E., Matthews, J. B. R., Maycock, T. K., Waterfield, T., Yelekçi, O., Yu, R., and Zhou, B., Cambridge University Press, Cambridge, United Kingdom and New York, NY, USA, 1211–1362, https://doi.org/10.1017/9781009157896.011, 2021.
Friedman, J. H.: Greedy function approximation: A gradient boosting machine., Ann. Stat., 29, 1189–1232, https://doi.org/10.1214/aos/1013203451, 2001.
Great Barrier Reef Marine Park Authority: Great Barrier Reef (GBR) Features, https://eatlas.org.au/geonetwork/srv/api/records/ac8e8e4f-fc0e-4a01-9c3d-f27e4a8fac3c (last access: 27 February 2025), 2007.
Harris, D. L., Rovere, A., Casella, E., Power, H., Canavesio, R., Collin, A., Pomeroy, A., Webster, J. M., and Parravicini, V.: Coral reef structural complexity provides important coastal protection from waves under rising sea levels, Sci. Adv., 4, eaao4350, https://doi.org/10.1126/sciadv.aao4350, 2018.
Hernandez-Jaramillo, D. C., Medcraft, C., Braga, R. C., Butcherine, P., Doss, A., Kelaher, B., Rosenfeld, D., and Harrison, D. P.: New airborne research facility observes sensitivity of cumulus cloud microphysical properties to aerosol regime over the great barrier reef, Environ. Sci. Atmos., 4, 861–871, https://doi.org/10.1039/D4EA00009A, 2024.
Hernandez-Jaramillo, D. C., Harrison, L., Gunner, G., McGrath, A., Junkermann, W., Lieff, W., Hacker, J., Rosenfeld, D., Kelaher, B., and Harrison, D. P.: First generation outdoor marine cloud brightening trial increases aerosol concentration at cloud base height, Environ. Res. Lett., 20, 054065, https://doi.org/10.1088/1748-9326/adccd7, 2025.
Hersbach, H., Bell, B., Berrisford, P., Biavati, G., Horányi, A., Muñoz Sabater, J., Nicolas, J., Peubey, C., Radu, R., Schepers, D., Simmons, A., Soci, C., Dee, D., and Thépaut, J.-N.: ERA5 hourly data on single levels from 1940 to present, Copernicus Climate Change Service (C3S) Climate Data Store (CDS), https://doi.org/10.24381/cds.adbb2d47, 2023.
Hoppel, W. A., Fitzgerald, J. W., and Larson, R. E.: Aerosol size distributions in air masses advecting off the east coast of the United States, J. Geophys. Res.-Atmos., 90, 2365–2379, https://doi.org/10.1029/JD090iD01p02365, 1985.
Horchler, E. J., Alroe, J., Harrison, L., Cravigan, L., Harrison, D. P., and Ristovski, Z. D.: Measurement report: Aerosol and cloud nuclei properties along the Central and Northern Great Barrier Reef – impact of continental emissions, Atmos. Chem. Phys., 25, 10075–10087, https://doi.org/10.5194/acp-25-10075-2025, 2025.
Hughes, T. P., Barnes, M. L., Bellwood, D. R., Cinner, J. E., Cumming, G. S., Jackson, J. B. C., Kleypas, J., van de Leemput, I. A., Lough, J. M., Morrison, T. H., Palumbi, S. R., van Nes, E. H., and Scheffer, M.: Coral reefs in the Anthropocene, Nature, 546, 82–90, https://doi.org/10.1038/nature22901, 2017a.
Hughes, T. P., Kerry, J. T., Álvarez-Noriega, M., Álvarez-Romero, J. G., Anderson, K. D., Baird, A. H., Babcock, R. C., Beger, M., Bellwood, D. R., Berkelmans, R., Bridge, T. C., Butler, I. R., Byrne, M., Cantin, N. E., Comeau, S., Connolly, S. R., Cumming, G. S., Dalton, S. J., Diaz-Pulido, G., Eakin, C. M., Figueira, W. F., Gilmour, J. P., Harrison, H. B., Heron, S. F., Hoey, A. S., Hobbs, J.-P. A., Hoogenboom, M. O., Kennedy, E. V., Kuo, C., Lough, J. M., Lowe, R. J., Liu, G., McCulloch, M. T., Malcolm, H. A., McWilliam, M. J., Pandolfi, J. M., Pears, R. J., Pratchett, M. S., Schoepf, V., Simpson, T., Skirving, W. J., Sommer, B., Torda, G., Wachenfeld, D. R., Willis, B. L., and Wilson, S. K.: Global warming and recurrent mass bleaching of corals, Nature, 543, 373–377, https://doi.org/10.1038/nature21707, 2017b.
Humphries, R. S., McRobert, I. M., Ponsonby, W. A., Ward, J. P., Keywood, M. D., Loh, Z. M., Krummel, P. B., and Harnwell, J.: Identification of platform exhaust on the RV Investigator, Atmos. Meas. Tech., 12, 3019–3038, https://doi.org/10.5194/amt-12-3019-2019, 2019.
Humphries, R. S., Keywood, M. D., Gribben, S., McRobert, I. M., Ward, J. P., Selleck, P., Taylor, S., Harnwell, J., Flynn, C., Kulkarni, G. R., Mace, G. G., Protat, A., Alexander, S. P., and McFarquhar, G.: Southern Ocean latitudinal gradients of cloud condensation nuclei, Atmos. Chem. Phys., 21, 12757–12782, https://doi.org/10.5194/acp-21-12757-2021, 2021a.
Humphries, R. S., Keywood, M. D., Gribben, S., McRobert, I. M., Ward, J. P., Selleck, P., Taylor, S., Harnwell, J., Flynn, C., Kulkarni, G. R., Mace, G. G., Protat, A., Alexander, S. P., and McFarquhar, G.: Southern Ocean latitudinal gradients of cloud condensation nuclei, Atmos. Chem. Phys., 21, 12757–12782, https://doi.org/10.5194/acp-21-12757-2021, 2021b.
Humphries, R. S., Keywood, M. D., Ward, J. P., Harnwell, J., Alexander, S. P., Klekociuk, A. R., Hara, K., McRobert, I. M., Protat, A., Alroe, J., Cravigan, L. T., Miljevic, B., Ristovski, Z. D., Schofield, R., Wilson, S. R., Flynn, C. J., Kulkarni, G. R., Mace, G. G., McFarquhar, G. M., Chambers, S. D., Williams, A. G., and Griffiths, A. D.: Measurement report: Understanding the seasonal cycle of Southern Ocean aerosols, Atmos. Chem. Phys., 23, 3749–3777, https://doi.org/10.5194/acp-23-3749-2023, 2023.
Isokääntä, S., Kim, P., Mikkonen, S., Kühn, T., Kokkola, H., Yli-Juuti, T., Heikkinen, L., Luoma, K., Petäjä, T., Kipling, Z., Partridge, D., and Virtanen, A.: The effect of clouds and precipitation on the aerosol concentrations and composition in a boreal forest environment, Atmos. Chem. Phys., 22, 11823–11843, https://doi.org/10.5194/acp-22-11823-2022, 2022.
Jackson, R., Gabric, A., and Cropp, R.: Effects of ocean warming and coral bleaching on aerosol emissions in the Great Barrier Reef, Australia, Sci. Rep., 8, 14048, https://doi.org/10.1038/s41598-018-32470-7, 2018.
Kangasluoma, J., Cai, R., Jiang, J., Deng, C., Stolzenburg, D., Ahonen, L. R., Chan, T., Fu, Y., Kim, C., Laurila, T. M., Zhou, Y., Dada, L., Sulo, J., Flagan, R. C., Kulmala, M., Petäjä, T., and Lehtipalo, K.: Overview of measurements and current instrumentation for 1–10 nm aerosol particle number size distributions, J. Aerosol Sci., 148, 105584, https://doi.org/10.1016/j.jaerosci.2020.105584, 2020.
Kawana, K., Miyazaki, Y., Omori, Y., Tanimoto, H., Kagami, S., Suzuki, K., Yamashita, Y., Nishioka, J., Deng, Y., Yai, H., and Mochida, M.: Number-Size Distribution and CCN Activity of Atmospheric Aerosols in the Western North Pacific During Spring Pre-Bloom Period: Influences of Terrestrial and Marine Sources, J. Geophys. Res.-Atmos., 127, e2022JD036690, https://doi.org/10.1029/2022JD036690, 2022.
Knowlton, N., Brainard, R. E., Fisher, R., Moews, M., Plaisance, L., and Caley, M. J.: Coral Reef Biodiversity, in: Life in the World's Oceans, John Wiley & Sons, Ltd, 65–78, https://doi.org/10.1002/9781444325508.ch4, 2010.
Krüger, M. L., Mertes, S., Klimach, T., Cheng, Y. F., Su, H., Schneider, J., Andreae, M. O., Pöschl, U., and Rose, D.: Assessment of cloud supersaturation by size-resolved aerosol particle and cloud condensation nuclei (CCN) measurements, Atmos. Meas. Tech., 7, 2615–2629, https://doi.org/10.5194/amt-7-2615-2014, 2014.
Kulmala, M., Junninen, H., Dada, L., Salma, I., Weidinger, T., Thén, W., Vörösmarty, M., Komsaare, K., Stolzenburg, D., Cai, R., Yan, C., Li, X., Deng, C., Jiang, J., Petäjä, T., Nieminen, T., and Kerminen, V.-M.: Quiet new particle formation in the atmosphere, Front. Environ. Sci., 10, 912385, https://doi.org/10.3389/fenvs.2022.912385, 2022.
Laing, J. R., Jaffe, D. A., and Sedlacek, I. I. I. A. J.: Comparison of Filter-based Absorption Measurements of Biomass Burning Aerosol and Background Aerosol at the Mt. Bachelor Observatory, Aerosol Air Qual. Res., 20, 663–678, https://doi.org/10.4209/aaqr.2019.06.0298, 2020.
Law, C. S., Smith, M. J., Harvey, M. J., Bell, T. G., Cravigan, L. T., Elliott, F. C., Lawson, S. J., Lizotte, M., Marriner, A., McGregor, J., Ristovski, Z., Safi, K. A., Saltzman, E. S., Vaattovaara, P., and Walker, C. F.: Overview and preliminary results of the Surface Ocean Aerosol Production (SOAP) campaign, Atmos. Chem. Phys., 17, 13645–13667, https://doi.org/10.5194/acp-17-13645-2017, 2017.
Lundberg, S. M. and Lee, S.-I.: A Unified Approach to Interpreting Model Predictions, in: Advances in Neural Information Processing Systems, 30, 4765–4774, https://proceedings.neurips.cc/paper_files/paper/2017/hash/8a20a8621978632d76c43dfd28b67767-Abstract.html (last access: 3 September 2026), 2017.
Manshausen, P., Watson-Parris, D., Christensen, M. W., Jalkanen, J.-P., and Stier, P.: Invisible ship tracks show large cloud sensitivity to aerosol, Nature, 610, 101–106, https://doi.org/10.1038/s41586-022-05122-0, 2022.
Marelle, L., Myhre, G., Thomas, J. L., and Raut, J.-C.: Aerosol Background Concentrations Influence Aerosol-Cloud Interactions as Much as the Choice of Aerosol-Cloud Parameterization, Geophys. Res. Lett., 52, e2024GL111780, https://doi.org/10.1029/2024GL111780, 2025.
Marto, J. P., Zhang, J., and Schwab, J. J.: Plume analysis from field evaluations of a portable air quality monitoring system, J. Air Waste Manage. Assoc., 71, 70–80, https://doi.org/10.1080/10962247.2020.1834010, 2021.
Milic, A., Mallet, M. D., Cravigan, L. T., Alroe, J., Ristovski, Z. D., Selleck, P., Lawson, S. J., Ward, J., Desservettaz, M. J., Paton-Walsh, C., Williams, L. R., Keywood, M. D., and Miljevic, B.: Biomass burning and biogenic aerosols in northern Australia during the SAFIRED campaign, Atmos. Chem. Phys., 17, 3945–3961, https://doi.org/10.5194/acp-17-3945-2017, 2017.
Modini, R. L., Ristovski, Z. D., Johnson, G. R., He, C., Surawski, N., Morawska, L., Suni, T., and Kulmala, M.: New particle formation and growth at a remote, sub-tropical coastal location, Atmos. Chem. Phys., 9, 7607–7621, https://doi.org/10.5194/acp-9-7607-2009, 2009.
Noble, S. R. and Hudson, J. G.: Effects of Continental Clouds on Surface Aitken and Accumulation Modes, J. Geophys. Res.-Atmos., 124, 5479–5502, https://doi.org/10.1029/2019JD030297, 2019.
Pedregosa, F., Varoquaux, G., Gramfort, A., Michel, V., Thirion, B., Grisel, O., Blondel, M., Prettenhofer, P., Weiss, R., Dubourg, V., Vanderplas, J., Passos, A., Cournapeau, D., Brucher, M., Perrot, M., and Duchesnay, É.: Scikit-learn: Machine Learning in Python, J. Mach. Learn. Res., 12, 2825–2830, 2011.
Peltola, M., Rose, C., Trueblood, J. V., Gray, S., Harvey, M., and Sellegri, K.: New particle formation in coastal New Zealand with a focus on open-ocean air masses, Atmos. Chem. Phys., 22, 6231–6254, https://doi.org/10.5194/acp-22-6231-2022, 2022.
Petters, M. D. and Kreidenweis, S. M.: A single parameter representation of hygroscopic growth and cloud condensation nucleus activity, Atmos. Chem. Phys., 7, 1961–1971, https://doi.org/10.5194/acp-7-1961-2007, 2007.
Reaka-Kudla, M. L.: The global biodiversity of coral reefs: A comparison with rain forests, in: Biodiversity II: Understanding and Protecting Our Biological Resources, edited by: Reaka-Kudla, M. L., Wilson, D. E., and Wilson, E. O., Joseph Henry Press, Washington, D.C., 83–108, https://www.nationalacademies.org/publications/4901 (last access: 20 January 2025), 1997.
Richards, L. S., Siems, S. T., Huang, Y., Zhao, W., Harrison, D. P., Manton, M. J., and Reeder, M. J.: The meteorological drivers of mass coral bleaching on the central Great Barrier Reef during the 2022 La Niña, Sci. Rep., 14, 23867, https://doi.org/10.1038/s41598-024-74181-2, 2024.
Riemer, N., Ault, A. P., West, M., Craig, R. L., and Curtis, J. H.: Aerosol Mixing State: Measurements, Modeling, and Impacts, Rev. Geophys., 57, 187–249, https://doi.org/10.1029/2018RG000615, 2019.
Rowland, M. J., Lambrides ,Ariana B. J., McNiven ,Ian J., and and Ulm, S.: Great Barrier Reef Indigenous archaeology and occupation of associated reef and continental islands, Australas. J. Environ. Manag., 32, 22–45, https://doi.org/10.1080/14486563.2024.2336969, 2025.
Ryan, R. G., Eckert, C., Kelaher, B. P., Harrison, D. P., and Schofield, R.: Boundary layer height above the Great Barrier Reef studied using drone and Mini-Micropulse LiDAR measurements, J. South. Hemisphere Earth Syst. Sci., 74, ES24008, https://doi.org/10.1071/ES24008, 2024.
Santavy, D. L., Horstmann, C. L., Sharpe, L. M., Yee, S. H., and Ringold, P.: What is it about coral reefs? Translation of ecosystem goods and services relevant to people and their well-being, Ecosphere Wash. DC, 12, 1–27, https://doi.org/10.1002/ecs2.3639, 2021.
Schmale, J., Henning, S., Henzing, B., Keskinen, H., Sellegri, K., Ovadnevaite, J., Bougiatioti, A., Kalivitis, N., Stavroulas, I., Jefferson, A., Park, M., Schlag, P., Kristensson, A., Iwamoto, Y., Pringle, K., Reddington, C., Aalto, P., Äijälä, M., Baltensperger, U., Bialek, J., Birmili, W., Bukowiecki, N., Ehn, M., Fjæraa, A. M., Fiebig, M., Frank, G., Fröhlich, R., Frumau, A., Furuya, M., Hammer, E., Heikkinen, L., Herrmann, E., Holzinger, R., Hyono, H., Kanakidou, M., Kiendler-Scharr, A., Kinouchi, K., Kos, G., Kulmala, M., Mihalopoulos, N., Motos, G., Nenes, A., O'Dowd, C., Paramonov, M., Petäjä, T., Picard, D., Poulain, L., Prévôt, A. S. H., Slowik, J., Sonntag, A., Swietlicki, E., Svenningsson, B., Tsurumaru, H., Wiedensohler, A., Wittbom, C., Ogren, J. A., Matsuki, A., Yum, S. S., Myhre, C. L., Carslaw, K., Stratmann, F., and Gysel, M.: Collocated observations of cloud condensation nuclei, particle size distributions, and chemical composition, Sci. Data, 4, 170003, https://doi.org/10.1038/sdata.2017.3, 2017.
Seinfeld, J. H. and Pandis, S. N.: Atmospheric Chemistry and Physics: From Air Pollution to Climate Change, 3rd edn., John Wiley & Sons, Inc., Hoboken, New Jersey, ISBN 9781119221173, 2016.
Sihto, S.-L., Mikkilä, J., Vanhanen, J., Ehn, M., Liao, L., Lehtipalo, K., Aalto, P. P., Duplissy, J., Petäjä, T., Kerminen, V.-M., Boy, M., and Kulmala, M.: Seasonal variation of CCN concentrations and aerosol activation properties in boreal forest, Atmos. Chem. Phys., 11, 13269–13285, https://doi.org/10.5194/acp-11-13269-2011, 2011.
Stein, A. F., Draxler, R. R., Rolph, G. D., Stunder, B. J. B., Cohen, M. D., and Ngan, F.: NOAA's HYSPLIT Atmospheric Transport and Dispersion Modeling System, Bull. Am. Meteorol. Soc., 96, 2059–2077, https://doi.org/10.1175/BAMS-D-14-00110.1, 2015.
Storelvmo, T., Leirvik, T., Lohmann, U., Phillips, P. C. B., and Wild, M.: Disentangling greenhouse warming and aerosol cooling to reveal Earth's climate sensitivity, Nat. Geosci., 9, 286–289, https://doi.org/10.1038/ngeo2670, 2016.
Sulo, J., Okuljar, M., Alroe, J., Li, Z., Horchler, E. J., Cravigan, L., Miljevic, B., Harrison, L., Harrison, D., and Ristovski, Z.: Coral reef emissions enhance aerosol and cloud-condensation nuclei concentrations over the Great Barrier Reef, Figshare [data set], https://doi.org/10.6084/m9.figshare.30193285.v1, 2025.
Swan, H. B.: The Potential for Great Barrier Reef Regional Climate Regulation via Dimethylsulfide Atmospheric Oxidation Products, Front. Mar. Sci., 9, https://doi.org/10.3389/fmars.2022.869166, 2022.
Swan, H. B., Crough, R. W., Vaattovaara, P., Jones, G. B., Deschaseaux, E. S. M., Eyre, B. D., Miljevic, B., and Ristovski, Z. D.: Dimethyl sulfide and other biogenic volatile organic compound emissions from branching coral and reef seawater: potential sources of secondary aerosol over the Great Barrier Reef, J. Atmos. Chem., 73, 303–328, https://doi.org/10.1007/s10874-016-9327-7, 2016.
Tessendorf, S. A., Weeks, C. E., Axisa, D., and Bruintjes, R. T.: Aerosol characteristics observed in southeast Queensland and implications for cloud microphysics, J. Geophys. Res.-Atmos., 118, 2858–2871, https://doi.org/10.1002/jgrd.50274, 2013.
Vaattovaara, P., Swan, H. B., Jones, G. B., Deschaseaux, E., Miljevic, B., Laaksonen, A., and Ristovski, Z. D.: The Contribution of Sulfate and Oxidized Organics in Climatically Important Ultrafine Particles at a Coral Reef Environment, Zenodo, https://doi.org/10.5281/zenodo.1092156, 2014.
Wiedensohler, A., Wiesner, A., Weinhold, K., Birmili, W., Hermann, M., Merkel, M., Müller, T., Pfeifer, S., Schmidt, A., Tuch, T., Velarde, F., Quincey, P., Seeger, S., and Nowak, A.: Mobility particle size spectrometers: Calibration procedures and measurement uncertainties, Aerosol Sci. Technol., 52, 146–164, https://doi.org/10.1080/02786826.2017.1387229, 2018.
Yang, L. and Shami, A.: On hyperparameter optimization of machine learning algorithms: Theory and practice, Neurocomputing, 415, 295–316, https://doi.org/10.1016/j.neucom.2020.07.061, 2020.
Zhao, W., Huang, Y., Siems, S., and Manton, M.: A characterization of clouds over the Great Barrier Reef and the role of local forcing, Int. J. Climatol., 42, 6647–6664, https://doi.org/10.1002/joc.7660, 2022.
Zhao, W., Huang, Y., Siems, S., Manton, M., and Harrison, D.: Interactions between trade wind clouds and local forcings over the Great Barrier Reef: a case study using convection-permitting simulations, Atmos. Chem. Phys., 24, 5713–5736, https://doi.org/10.5194/acp-24-5713-2024, 2024.