the Creative Commons Attribution 4.0 License.
the Creative Commons Attribution 4.0 License.
 | 29 Apr 2025
Particle deliquescence in a turbulent humidity field
Dennis Niedermeier
Rasmus Hoffmann
Silvio Schmalfuss
Wiebke Frey
Fabian Senf
Olaf Hellmuth
Mira Pöhlker
Frank Stratmann
The atmosphere contains aerosol particles, some of which are hygroscopic in nature. These particles have direct and indirect effects on weather and climate. Furthermore, turbulence causes fluctuations in temperature, water vapor content, and relative humidity (RH). Turbulent humidity fluctuations may influence, among others, the phase state of specific hygroscopic particles. One process of particular interest in that context is particle deliquescence, which is the phase transition of solid particles to solution droplets. It occurs at a certain RH, the so-called deliquescence relative humidity (DRH), which in turn depends on, e.g., the particle substance. This study investigates the deliquescence behavior of sodium chloride particles in a turbulent humidity field, in particular addressing the questions of whether and how turbulent relative humidity fluctuations affect the number and number fraction of deliquesced particles. The turbulent moist-air wind tunnel LACIS-T (Turbulent Leipzig Aerosol Cloud Interaction Simulator) is used for this study. The results show that the number of deliquesced particles is influenced by turbulent RH fluctuations. On the one hand, particle deliquescence can be observed although the mean RH is smaller than the DRH. On the other hand, there are cases for which non-deliquesced particles are present even though the mean RH is larger than the DRH. In general, the number fraction of deliquesced particles depends on a combination of mean relative humidity, strength of humidity fluctuations, and residence time of the particles in the turbulent humidity field. The study concludes that relying solely on the mean relative humidity is inadequate for determining the phase state of deliquescent particle species in the atmosphere. It is necessary to additionally consider both the humidity fluctuations and the particle history.
- Article
(3334 KB) - Full-text XML
- BibTeX
- EndNote


A large portion of atmospheric aerosol consists of hygroscopic particles, which feature different sizes and phase states and may have immense impacts on Earth's weather and climate. The particle size affects, for example, particle radiative properties as well as the particles' potential to function as cloud condensation nuclei (CCN). The phase state also influences particle radiative properties, as hygroscopically grown particles have different angular scattering properties and refractive indices compared to their dry counterparts (Titos et al., 2016). The liquid particle fraction scatters more light than the respective solid fraction (e.g., Toon et al., 1976; Sloane, 1984). Furthermore, the phase state influences gas–particle partitioning and heterogeneous and multi-phase chemistry processes as, for example, the presence of water allows for reactions with atmospheric pollutants (e.g., Finlayson-Pitts and Hemminger, 2000; Bahadur and Russell, 2008; Liu et al., 2019).
The phase state depends on the particle properties, i.e., chemical composition and size, as well as the atmospheric conditions, such as temperature and relative humidity (RH). One process of particular interest in that context is particle deliquescence, for which a solid, water-soluble particle turns into an aqueous solution droplet, thereby increasing its size significantly (Khvorostyanov and Curry, 2014, Chap. 11, pp. 547–575). This phase transition occurs at a certain RH, called the deliquescence RH (DRH), and is specific for each deliquescent particle substance. The DRH also depends on temperature (Seinfeld and Pandis, 2006, Chap. 10.2.2, pp. 453–454; Khvorostyanov and Curry, 2014, Chap. 11.4.3, pp. 562–563) and particle size (Bahadur and Russell, 2008). Beyond the DRH, a further increase in the RH leads to the growth of the formed solution droplet. However, if the RH decreases below the DRH, the material dissolved in the solution droplet will not re-crystallize. The solution will become supersaturated and will remain in a metastable state until it reaches another specific RH, called the efflorescence RH (ERH, with ERH < DRH) at which re-crystallization, i.e., efflorescence, occurs. This behavior leads to a hysteresis curve which implies that the phase state of a soluble, deliquescent particle, which is at a RH between the ERH and DRH, depends on its history (Seinfeld and Pandis, 2006, Chap. 10.2, pp. 449–461; Khvorostyanov and Curry, 2014, Chap. 11, pp. 547–575; Titos et al., 2016).
A wide range of theoretical and experimental studies have been performed in the past, and the results obtained significantly increased both the fundamental and quantitative understanding of aerosol particle deliquescence (e.g., Seinfeld and Pandis, 2006, Chap. 10.2, pp. 449–461; Shchekin et al., 2008, 2013, Hellmuth et al., 2013, Chap. 12, pp. 317–347; Khvorostyanov and Curry, 2014, Chap. 11, pp. 547–575; Hellmuth and Shchekin, 2015; Tang et al., 2019; Peng et al., 2022). This holds even for particles with complex chemical composition. Most of the experimental investigations have focused on the process itself using various techniques (Tang et al., 2019). The majority of experiments were carried out under no-flow conditions. Continuous-flow-type experiments (such as in Wex et al., 2007) were carried out under laminar flow conditions. However, the atmosphere is turbulent, and turbulent mixing leads to strong fluctuations in temperature, water vapor concentrations, and consequently RH (Siebert et al., 2006; Bodenschatz et al., 2010), which could affect the phase state of deliquescent particles. To our knowledge, the behavior of deliquescent particles in turbulent humidity fields has not yet been investigated in detail. The questions are whether and how turbulent RH fluctuations affect the number of deliquesced particles and whether or not the number of deliquesced particles is time-dependent due to the hysteresis effect.
With the turbulent moist-air wind tunnel LACIS-T (Turbulent Leipzig Aerosol Cloud Interaction Simulator, Niedermeier et al., 2020), we wanted to address these fundamental questions. We performed various experiments for different mean RHs, RH fluctuation intensities, and residence times and determined the number fraction of deliquesced particles. We used size-selected, monodisperse NaCl particles in this study. NaCl was chosen as it is an atmospherically relevant substance that is, e.g., the main component of sea salt particles (Niedermeier et al., 2008). Furthermore, the deliquescence properties of NaCl are well characterized: the DRH at 15 °C, the temperature used in our experiments, is about 75.5 % (Seinfeld and Pandis, 2006, Chap. 10.2.2, pp. 453–454); the temperature dependence of the DRH is weak for NaCl (Seinfeld and Pandis, 2006, Chap. 10.2.2, pp. 453–454; Khvorostyanov and Curry, 2014, Chap. 11.4.3, pp. 562–563); and for a given temperature, the DRH is constant for particle diameters larger than 100 nm (Bahadur and Russell, 2008).
The experimental investigations at LACIS-T were accompanied by fluid dynamics simulations performed with OpenFOAM. These large-eddy simulations (LESs) assist in setting up the experiments and aid in interpreting the observations. For example, the simulations provide the strength of RH fluctuations that cannot be obtained experimentally.
This section describes the generation, size selection, and pre-conditioning of the NaCl particles and introduces the basic functionality of LACIS-T, the investigated parameter space, and the applied instrumentation.
2.1 Particle generation, size selection, and pre-conditioning
The NaCl particles were generated by means of an atomizer (TSI 3075, TSI Inc., St. Paul, Minnesota, USA) atomizing an aqueous solution of 1 g NaCl L−1 of double de-ionized water. The resulting aerosol was dried in a diffusion dryer to a RH lower than 20 %, i.e., a RH well below the ERH of NaCl particles, which is between 43 % and 45 % for the investigated particle size range (Tang et al., 1977; Cziczo et al., 1997; Gao et al., 2007).
Downstream of the dryer, the particles are charged by means of a neutralizer. A differential mobility analyzer (DMA; Knutson and Whitby, 1975, type “Vienna medium”) is used to select a narrow particle size fraction. Inside the DMA, a further drying occurred as the RH of the DMA sheath air was always ≤ 5 %. For the experiments, we selected a mobility diameter of Dpmob = 400 nm in order to be able to detect dry, solid particles optically by means of a Promo 2000 with a welas 2300 aerosol spectrometer (Palas GmbH, Karlsruhe, Germany) inside LACIS-T as well as to minimize the number of larger, doubly charged particles being present. As it turns out, their proportion in relation to the total number of selected particles is less than 1 %; i.e., doubly charged particles do not affect our results. Note that a particle shape factor has to be considered when converting the mobility diameter to a mass equivalent diameter because of the non-spherical shape of solid NaCl particles. This factor is 1.08 for NaCl particles according to, e.g., Kelly and McMurry (1992). Earlier measurements with the laminar flow tube LACIS (Wex et al., 2005; Niedermeier et al., 2008) confirm that this shape factor is valid for NaCl particles in the selected size range. In consequence, Dpmob = 400 nm corresponds to a mass equivalent diameter of Dpme = 370 nm.
The number concentration of the selected particles was determined utilizing a condensational particle counter (CPC; TSI 3010, TSI Inc., St. Paul, Minnesota, USA) and was kept at about 1000 cm−3 by means of a dilution system upstream of the DMA. The dilution system consists of a bypass, a filter, and two valves for adjustment of the flows. All flows, i.e., aerosol flow, DMA sheath, and excess airflow, as well as the CPC sample flow, were controlled by mass flow controllers (Brooks Instrument GmbH, Dresden, Germany) and checked with a bubble flow meter (Gilian® Gilibrator™, Sensidyne Inc., Clearwater, Florida, USA) on a daily basis.
For the experiments, three different types of pre-conditioning were applied concerning the NaCl particles which were fed into LACIS-T:
-
Case i. The particles were left dry (i.e., RH ≤ 5 %); therefore solid NaCl particles entered the measurement section of LACIS-T. This setup was only used to determine the optical size distribution of solid NaCl particles (see Sect. 4.2), as dry particle injection into LACIS-T reduces the mean RH in the mixing zone of the measurement section significantly (see Appendix A).
-
Case ii. The particles were pre-humidified to a dew-point temperature of Td = 9.6 °C (±0.1 °C) by mixing the dry aerosol with pre-humidified particle-free air by means of a saturator (Perma Pure MH-110-12S-4, Perma Pure LLC, Toms River, New Jersey, USA). This led to a RH of 70.2 % (±0.3 %) at 15 °C; i.e., the NaCl particles were still non-deliquesced before entering LACIS-T. With the RH at the LACIS-T inlet being closer to the DRH, the mean RH inside the measurement section of LACIS-T is not reduced significantly (see LES results in Sect. 4.1). This setup was used for the LACIS-T experiments for different sets of the mean RH as well as strength of RH fluctuations.
-
Case iii. The particles were pre-humidified at RH = 100 % (Td = 12.5 °C; ±0.1 °C) by means of a saturator (Perma Pure MH-110-12S-4, Perma Pure LLC, Toms River, New Jersey, USA); therefore the NaCl particles deliquesce before entering LACIS-T (RH = 85.0 % at 15 °C). This setup was used to determine the optical size distribution of fully deliquesced NaCl particles inside LACIS-T for the different sets of conditions.
2.2 LACIS-T
LACIS-T is a unique turbulent moist-air wind tunnel which has been established to study cloud physical processes, in general, and cloud microphysics–turbulence interactions, in particular. LACIS-T can be operated under a wide range of well-characterized and reproducible initial and boundary conditions resembling atmospheric warm, mixed-phase and cold clouds. The design, functionality, and capabilities of the setup are described in detail in Niedermeier et al. (2020), and only a brief description will be given here.
LACIS-T is a closed-loop wind tunnel of Göttingen type (Fig. 1). The unique characteristic of LACIS-T is that it features two parallel flow branches, in which two particle-free airflows, “A” and “B”, can be separately conditioned and controlled with respect to volume flow rate (through the radial blowers and valves, up to 6000 L min−1 each), water vapor content in terms of a dew-point temperature (through the humidification system, dew-point temperature range −40 °C < Td < 25 °C, with an accuracy of 0.1 K), and temperature (through the heat exchangers, temperature range −40 °C < T < 25 °C, with an accuracy of 0.05 K). These two airflows pass passive square-mesh grids through which defined turbulence is induced. They then enter the measurement section, at the entrance of which the particle-free airflows are combined and turbulently mixed. The measurement section is of cuboid shape with the dimensions of 200 cm × 80 cm × 20 cm. The aerosol particles are introduced into the mixing zone of the two turbulent particle-free airflows. This mixing zone provides an ideal environment for studying the influence of the turbulent fluctuations on aerosol and cloud microphysical processes. Downstream of the measurement section, the flow is directed towards an adsorption dehumidifying system where it is dried and heated. Afterwards, the flow is split up into the two branches, cleaned by particle filters, and the whole cycle starts again.
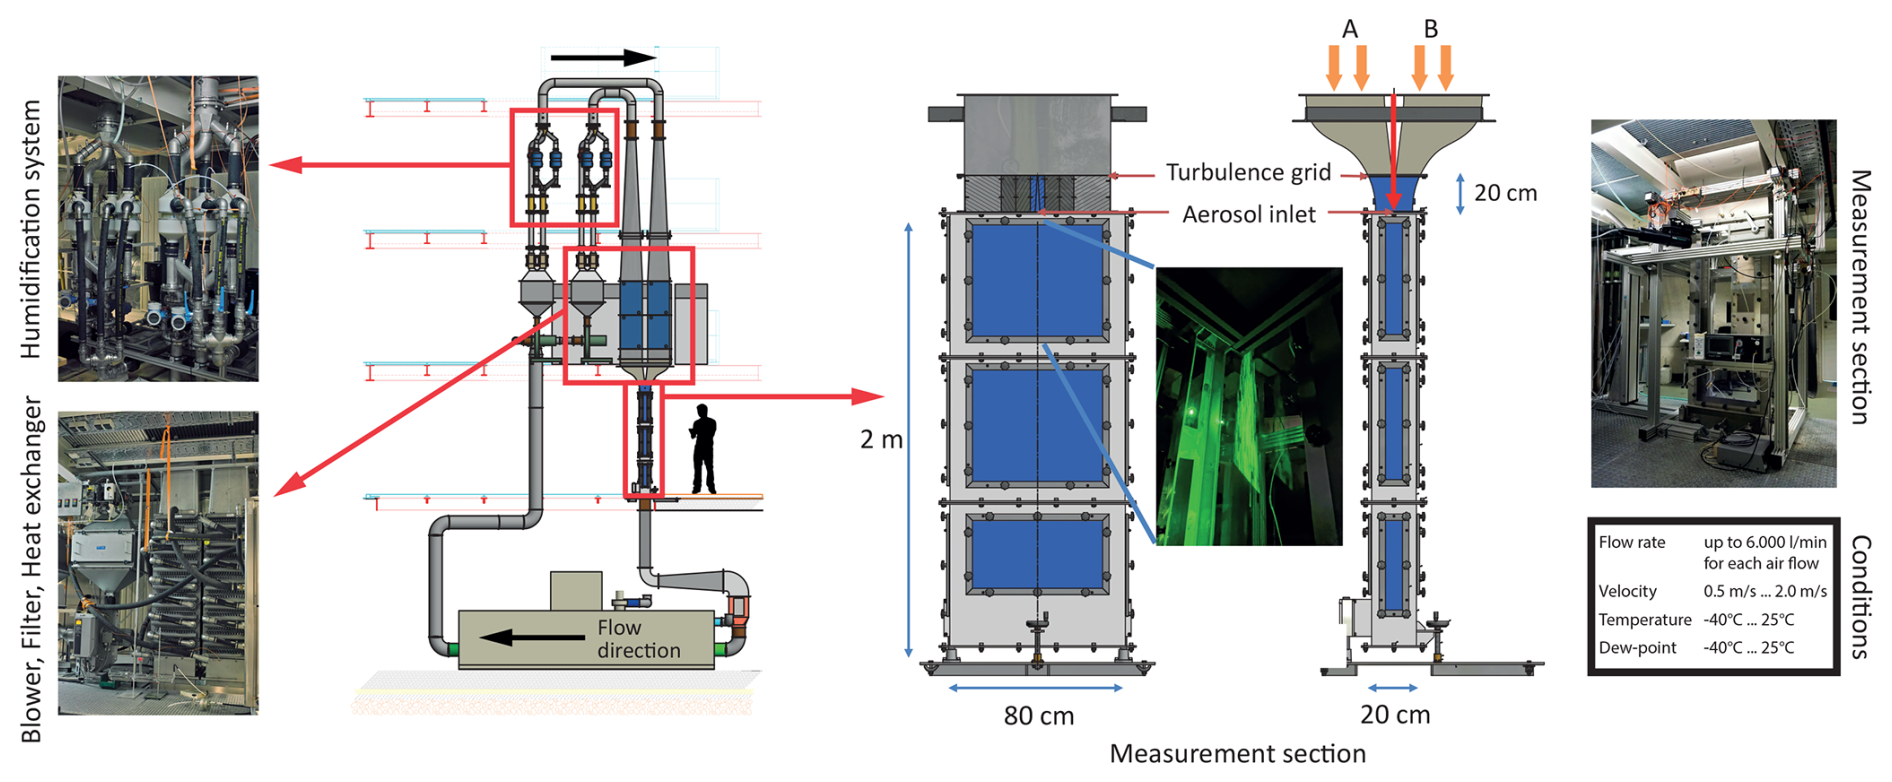
Figure 1Schematic of LACIS-T including main components and possible conditions. Schematic copyrights: Ingenieurbüro Mathias Lippold, VDI; TROPOS. The figure is adapted from Niedermeier et al. (2020) and modified.
In this study, the flow rate was set to 4300 L min−1 for each particle-free airflow, leading to a mean flow velocity of 1.35 m s−1 in the measurement section. Turbulence conditions inside the measurement section are determined by means of hot-wire anemometry (Dantec Dynamics Inc., Skovlunde, Denmark) and LESs and are very similar to those described in Niedermeier et al. (2020). For example, the eddy turnover time τmix, which is a measure for the turbulent mixing timescale, is between τmix = 0.1–0.7 s. It increases due to the decaying turbulence inside the measurement section and is given as τmix = (e.g., Baker et al., 1984; Lehmann et al., 2009). The quantity ε represents the energy dissipation rate, while lT denotes the Taylor microscale. In the context of atmospheric conditions, the Taylor microscale is frequently considered to be the appropriate mixing length scale (Lehmann et al., 2009).
We use isothermal conditions in this study; i.e., the temperature in both particle-free airflows was identical, set to TA = TB = 15 °C and monitored via PT100 temperature sensors ( class B, DIN EN 60751, accuracy of ). The dew-point temperature was set individually in each particle-free airflow and monitored by means of two dew-point mirrors (DPMs; model 973 by MBW Calibration AG, accuracy of ≤ ±0.1 K; reproducibility of ≤ ±0.05 K), sampling air in each flow branch between the heat exchanger and turbulence grid. Due to the individual settings of the dew-point temperatures, and thus the individual RH values in each flow branch, various RH mixing conditions could be established. That means different mean RH values, and different strengths of RH fluctuations, could be set in the mixing region (see Fig. 2a as an example for a specific set of RH conditions in branch A and B). In general, the larger the difference between RHA and RHB, the larger the strength of the RH fluctuations. However, no direct measurement of dew-point temperature fluctuations and consequently RH fluctuations is available so far. The strengths of the fluctuations are determined by means of LESs, which are described in Sect. 4.1.
Finally, particle size distributions are determined optically via a Promo 2000 with a welas 2300 aerosol spectrometer (Palas GmbH, Karlsruhe, Germany). The welas 2300 sensor is placed inside the measurement section with a 15 cm long stainless-steel tube (5 mm inner diameter) on top of its own inlet tube. This additional long tube ensures particle extraction and detection from the flow field, which is only very weakly influenced by the body of the welas 2300, which disturbs the flow field in its closer vicinity. Please note that the distance of the tip of this stainless-steel tube relative to the aerosol inlet of LACIS-T, called “z”, is used as a reference in the later data description.
In the first set of experiments, the welas 2300 is placed at a fixed position inside the measurement section, leading to a fixed residence time of the particles until the detection occurs. The inlet tube is placed at z = 30 cm below the aerosol inlet of LACIS-T. In the second set of experiments, the position of the tube together with the welas 2300 is varied, leading to different mean residence times of the particles.
Large-eddy simulations directly compute the large-scale motions of the flow fields from the Navier–Stokes equations and parameterize the unresolved small-scale/sub-grid-scale (SGS) motions. We use the dynamic k-equation LES model in OpenFOAM based on Chai and Mahesh (2012), who developed a new transport equation for the subgrid-scale kinetic energy, which has proven to be a good model for decaying turbulence and the transport of thermodynamic quantities. A hexaeder-dominated mesh is applied, refined near turbulence grid and walls, with 7.6 × 10⁶ cells in total. We use an Euler–Lagrange approach for the simulations; i.e., temperature and water vapor mixing ratio are calculated at the grid points, while each individual particle is tracked along its trajectory through the thermodynamic field. Details about the general numerical setup, especially about how to set the initial and boundary conditions, are given in Niedermeier et al. (2020).
Overall, the main goals of these simulations were (a) the determination of the RHs the particles experience along their way through the measurement section for the different experimental conditions and (b) the determination of the deliquesced particle fraction for comparison with the gained experimental data. The RHs, and RH fluctuations the particles experience, which cannot be detected experimentally, were quantified in terms of mean standard deviation of simulation-derived RH probability density functions (pdf's). For this, the RH pdf's are calculated for specific locations along the mixing region inside LACIS-T's measurement section. Furthermore, the numbers of deliquesced and non-deliquesced particles were derived from the simulations and compared with the experimentally obtained ones. Concerning the latter, a dynamical growth law is implemented for the Lagrangian particle simulations accounting for diffusive vapor transport and deposition to the particle surface and latent heat release (Wilck, 1999), as well as deliquescence and efflorescence. However, the feedback effects on heat transport and mass transfer in the gas phase are ignored as the droplet concentrations (mass and volume ratio) considered in this study are too low to influence the continuous phase. As we are modeling the particle hygroscopic growth dynamically, the model requires information concerning the deliquescence timescale for the considered NaCl particles. We assumed deliquescence to occur on the timescale τdel of 10−4 s (the numerical time step is also 10−4 s) once DRH = 75.5 % is reached (note that this timescale is 3 orders of magnitude smaller than the mixing timescale τmix, which is between 0.2 and 0.7 s). This assumption is based on molecular dynamics simulations performed by Bahadur and Russell (2008), who give the timescale τdel required for complete deliquescence of an infinitely extended “planar” NaCl slab to be τdel = 9.96 × 10⁻⁵ s. The extent to which this assumption is reasonable will be the subject of discussion in Appendix B.
For particle efflorescence, we also assume that the re-crystallization occurs on the timescale of 10−4 s once ERH = 45.0 % is reached. Tang and Munkelwitz (1984) show that the re-crystallization of a single micrometer-sized NaCl particle can occur very quickly; however, a clear timescale cannot be determined from Fig. 3 in their paper. Other studies like Ma et al. (2019) show that the timescale for particle efflorescence, which is a nucleation process, depends on the ambient RH and is inversely proportional to the nucleation rate. Various studies show that the ERH of NaCl particles is between 43 % and 45 % for the investigated particle size range (Tang et al., 1977; Cziczo et al., 1997; Gao et al., 2007). As it turned out, the minimum RH reached in our experiments is well above 45 %. From this point of view, our assumption about the timescale of particle efflorescence will supposedly not affect the simulation results as efflorescence is unlikely to occur in our investigations.
This section presents the results of the numerical and experimental investigations. First of all, the LESs provide the RH experienced by the particles. This is then applied to determine the strength of the RH fluctuations, which are later used for the interpretation of the experimental results. The experiments themselves are performed for different mean RHs and strengths of RH fluctuations and for fixed and variable particle residence times. Number fractions of deliquesced particles are determined and discussed.
4.1 Turbulent RH field obtained via LESs
At first, the simulations are employed to determine the RH experienced by the particles, as well as to ascertain the impact of the particles themselves on the RH field within the mixing region inside the measurement section. This is presented exemplarily for the setting of RHA = 60 % and RHB = 85 %, leading to a mean RH of 72.5 % along the center line. About 78 000 monodisperse NaCl particles with a mass equivalent diameter of Dpme = 370 nm are tracked inside the measurement section. The NaCl particles are pre-conditioned according to Case (ii); i.e., the aerosol is injected with RH = 70.2 % (as introduced in Sect. 2.1). In Fig. 2a, a snapshot of the instantaneous RH field in the symmetry plane is shown, including the respective particles deliquescing and growing along the inverse vertical axis. The dashed line represents the center line, where the strongest mixing occurs, as well as where the particles are detected further downstream. As the particles shown move through the channel, statistics are calculated at distinct horizontal planes over time; i.e., data from particles that pass a given horizontal plane are stored and analyzed later on.
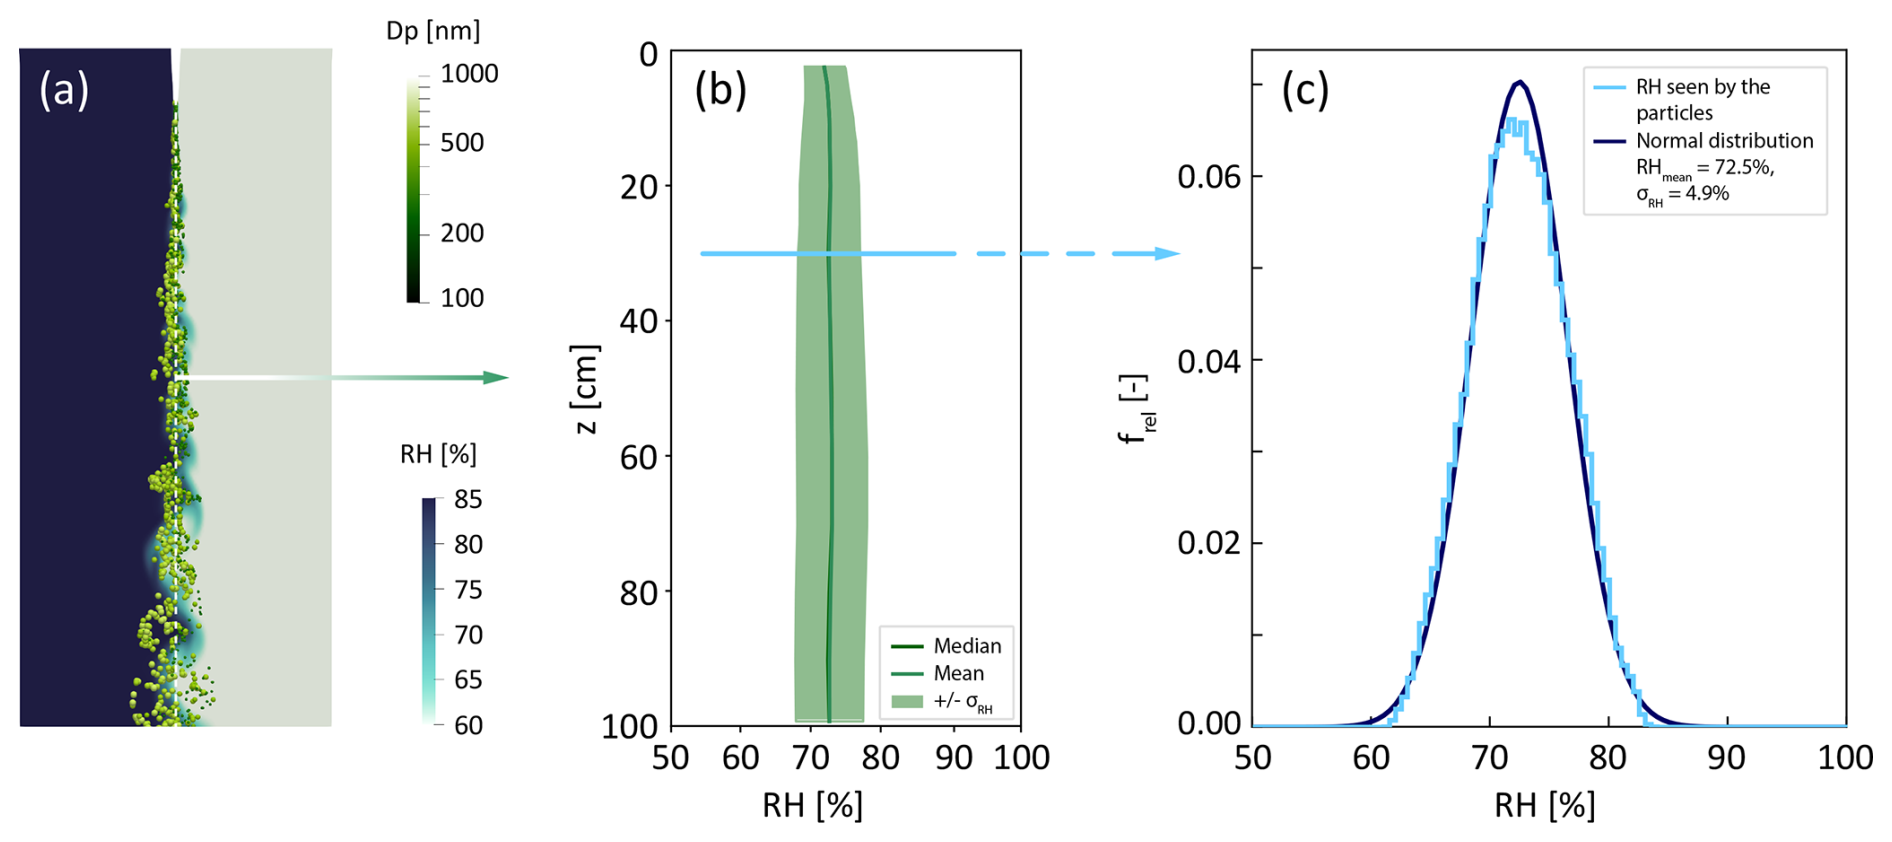
Figure 2(a) A snapshot of the particle simulation with the fluctuating RH field in the background (flow direction from top to bottom). It depicts the scenario of RHA = 60 % (right side) and RHB = 85 % (left side), resulting in a mean RH of 72.5 % along the center line (dashed white line). Note that only 10 % of the particles are depicted. The particles are colored and sized (not to scale) according to their diameter. (b) The obtained temporal median RH, mean RH, and RH fluctuations in terms of ±σRH plotted along the center line as a function of the distance z to the aerosol inlet of the measurement section. Note that the pre-humidified aerosol is injected (Case ii: RH = 70.2 % at 15 °C). (c) The normalized frequency of the RH experienced by the particles. The distribution has a Gaussian shape, as evidenced by the normal distribution with RHmean = 72.5 % and σRH = 4.9 %.
As mentioned, the RH of the introduced aerosol is slightly lower than the mean RH along the center line of the measurement section. This influences the RH field along the center line, which is illustrated in Fig. 2b in terms of the median RH (RHmed), the mean RH (RHmean) and the standard deviation of the RH (σRH). First of all, it can be seen that generally RHmed and RHmean fall together. Secondly, RHmean is observed to be slightly lower close to the location of aerosol injection. However, it increases on the very first centimeters and then reaches a constant value of 72.5 % at a height of approximately z = 15 cm. Additionally, σRH demonstrates an increase within the initial 15 cm, subsequently reaching a constant value of 4.9 %. Consequently, the data obtained for z ≥ 15 cm will be employed for the subsequent data interpretation. As an example, the RH experienced by particles near the center line when passing the horizontal plane at z = 30 cm is shown as normalized frequencies in Fig. 2c, and the obtained RH distribution has a Gaussian shape.
Note that there is an influence of the SGS motions on the simulated fluctuations and consequently σRH. Based on currently ongoing work and in accordance with a study performed by Chandrakar et al. (2022), we estimate the contributions from these SGS fluctuations to the total fluctuations to be max ±0.04 × σRH, which represents the uncertainty of the determined σRH values.
4.2 Obtained particle size distributions and determined deliquesced particle fraction
In order to be able to determine the fraction of deliquesced particles, first the size distributions of both dry and deliquesced particles, as well as those of a mixture of both, need to be considered. Therefore, in a first set of experiments, different RH conditions are adjusted in order to obtain and interpret the corresponding size distributions. The corresponding RHmean values at the center line are calculated from the RH values of the individual particle-free airflows. In general, it turns out from repeated measurements of temperature and dew-point temperature inside the tunnel that there is an absolute uncertainty in RHmean of up to 0.6 %. The width of the RH distribution which is given in terms of σRH is obtained from the LES. For this first set of experiments, the welas 2300 position was fixed, with its inlet being placed at z = 30 cm leading to a mean residence time of the particles before detection of approx. 0.22 s as the mean velocity is 1.35 m s−1. Figure 3 shows the results of four different experiments for the conditions given in Table 1.
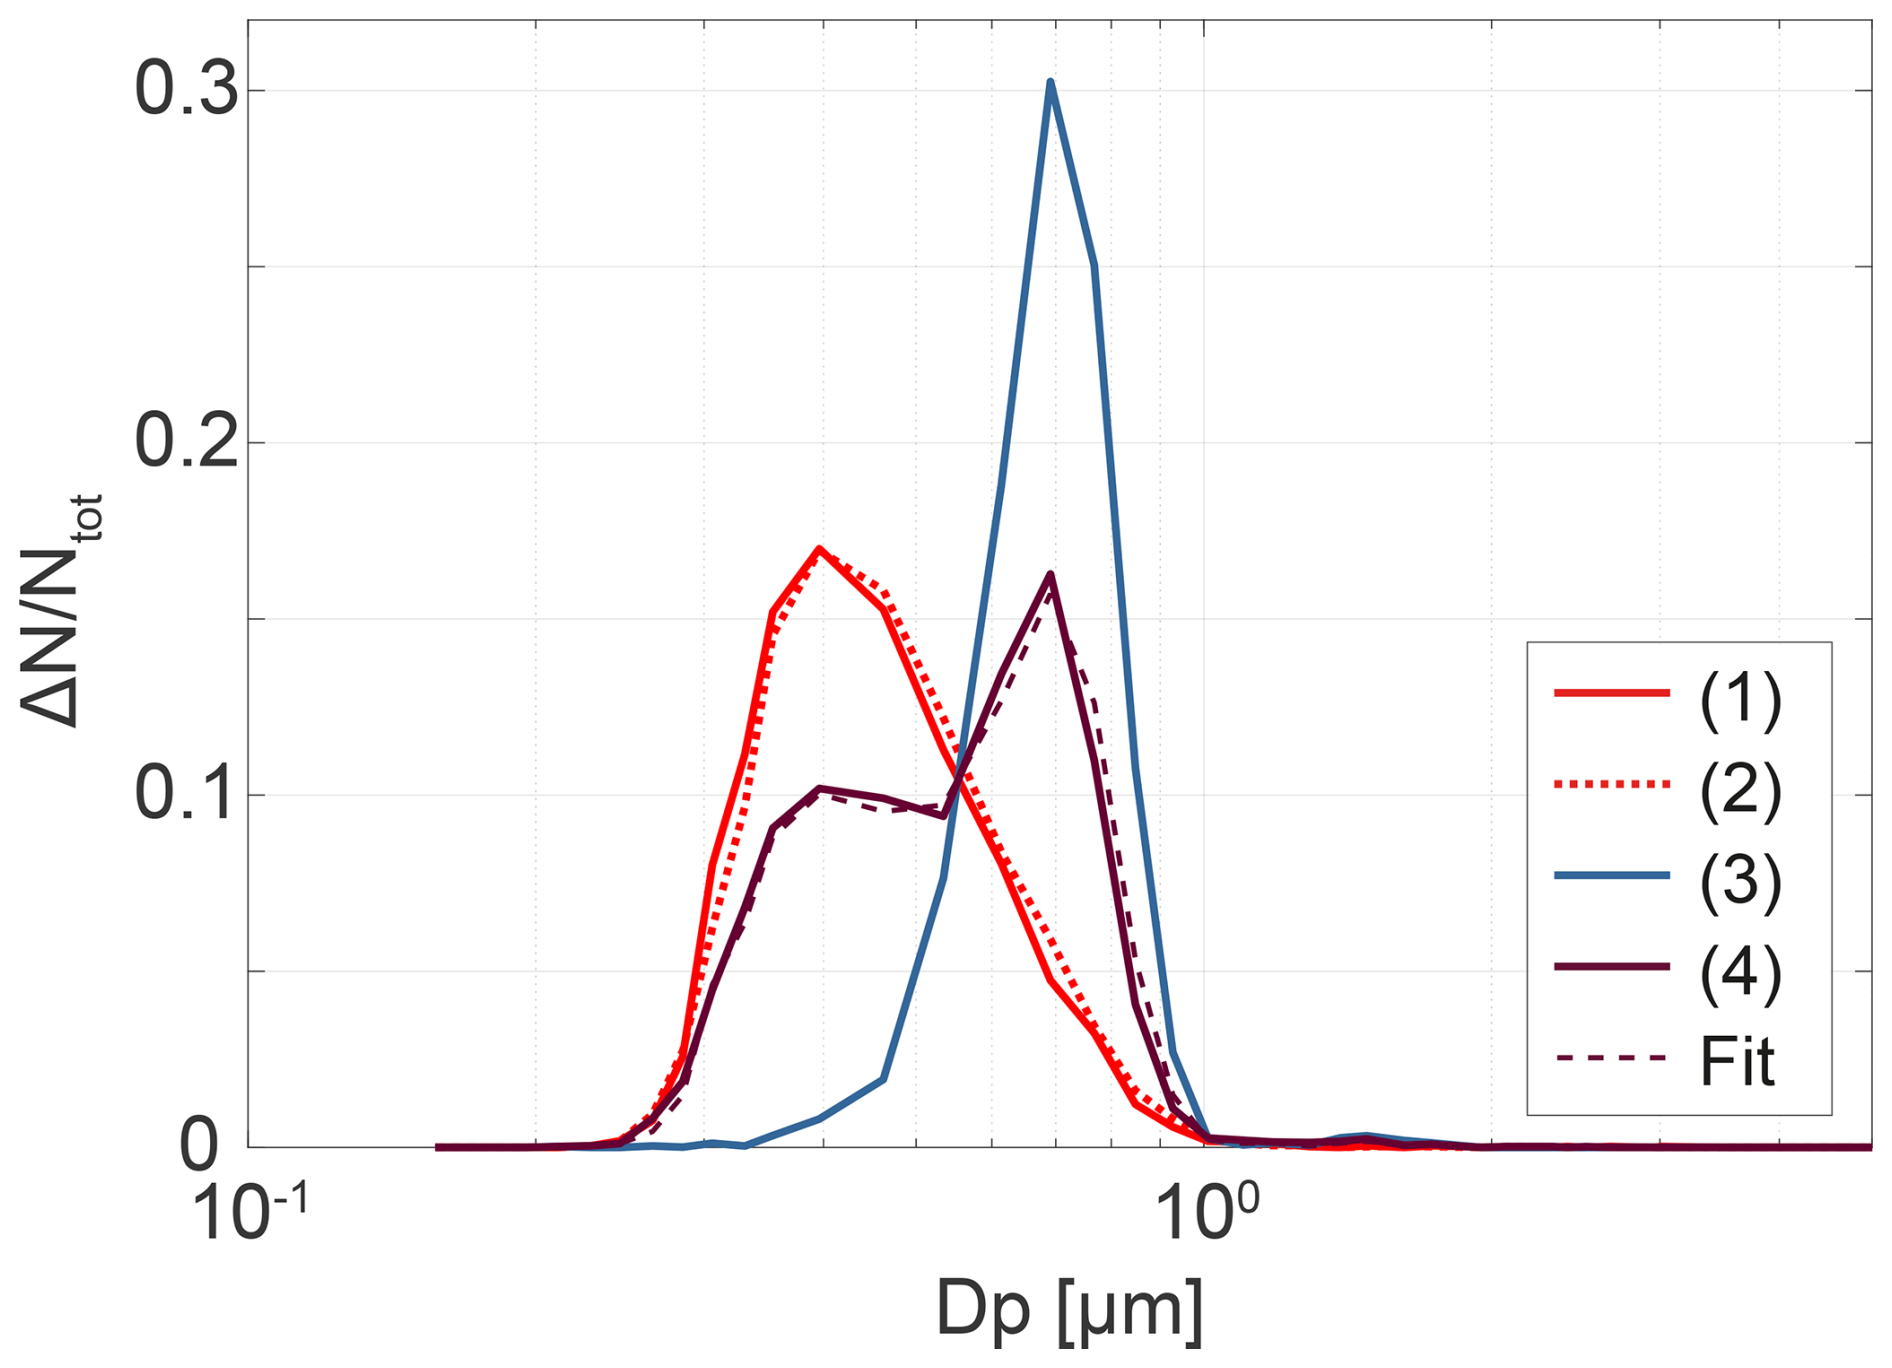
Figure 3Normalized particle number size distributions determined for the four different experiments summarized in Table 1. Experiments (1), (2), and (3) are given by the solid red, dotted red, and solid blue lines, respectively. Note that experiment (4) leads to a bimodal distribution at RHmean = 72.5 % and σRH = 4.9 %, featuring both solid and deliquesced NaCl particles (solid brown curve). The dashed brown curve represents a bimodal fit to the curve of experiment (4) in order to determine the solid and deliquesced particle fractions.
Table 1NaCl particle and LACIS-T conditions for four different experiments. Column 1 gives the experiment number. Column 2 shows the condition of the NaCl particles before they are inserted into LACIS-T. Columns 3 and 4 show the corresponding RH conditions inside LACIS-T in terms of RHmean and σRH.
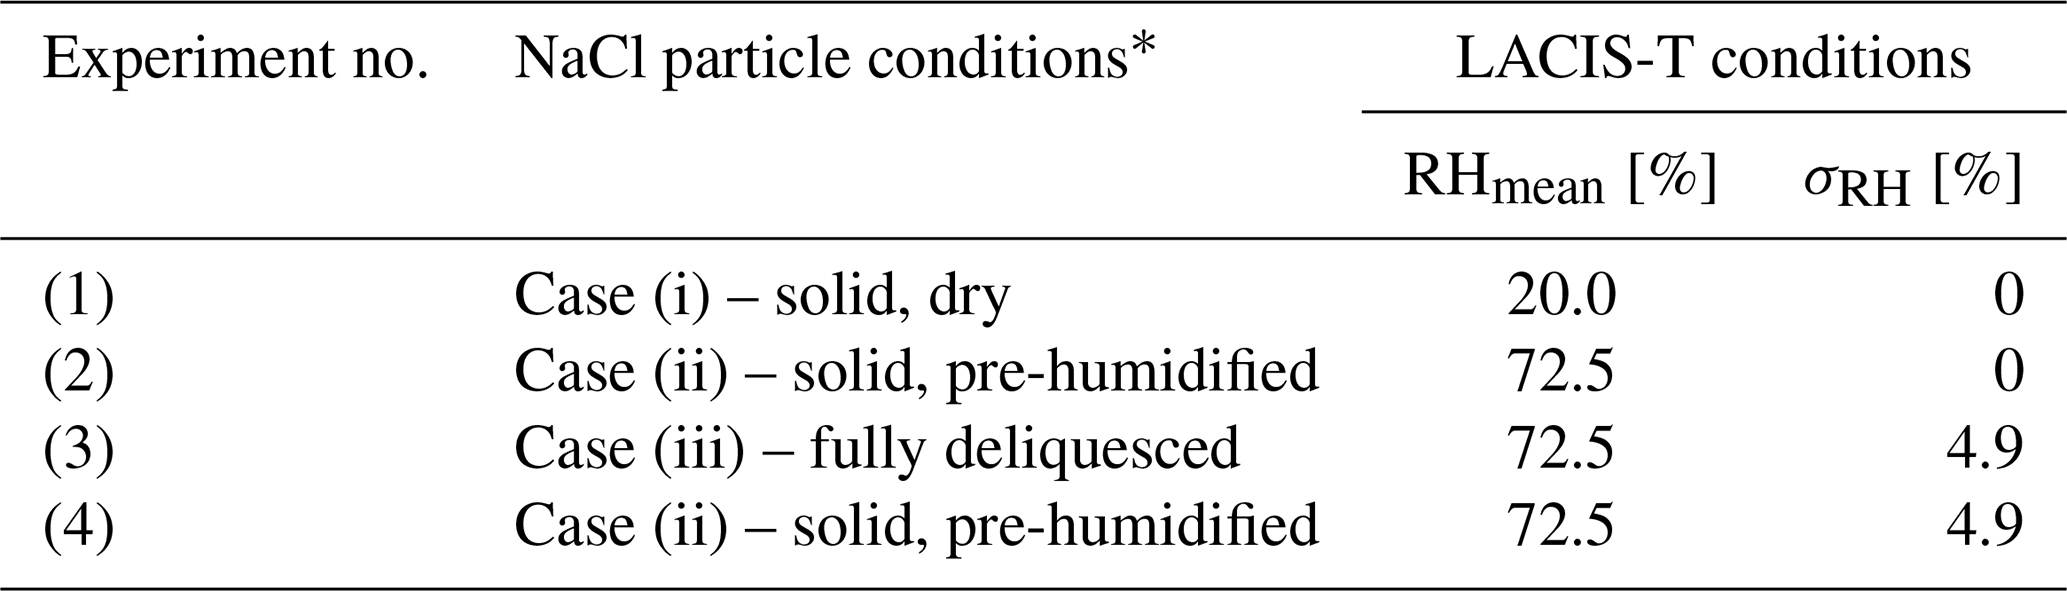
* See Sect. 2.1 for details.
No distinct difference in the obtained particle size distributions is observed for experiments (1) and (2). During experiment (2), the particles most likely start to take up water molecules, leading to a thin liquid shell surrounding the particles; however, particles are still non-deliquesced under these humid conditions. This is in agreement with observations obtained by Krueger et al. (2003) and Wise et al. (2008) for single NaCl particles.
Experiment (3) shows a clear increase in particle size compared to experiments (1) and (2). In this case, the NaCl particles are fully deliquesced. The mean particle diameter determined optically agrees with the diameter calculated with the Köhler equation (Niedermeier et al., 2008) for this RHmean.
Finally, experiment (4) results in two modes. The first mode fits with the one for solid NaCl particles, while the second mode fits with the one obtained for the deliquesced particles. That means we observe both solid and deliquesced particles at the same time. In other words, the humidity fluctuations lead to particle deliquescence although RHmean is smaller than the DRH, which is about 75.5 % at 15°C (Seinfeld and Pandis, 2006, Chap. 10.2.2, pp. 453–454). By fitting both modes with two lognormal distributions (see Fig. 3), the solid and deliquesced particle fractions can be determined, which in the example are 0.57 and 0.43, respectively.
To systematically quantify this effect, such experiments have been performed for various thermodynamic and flow conditions, as well as particle residence time (i.e., welas 2300 sensor positions).
4.3 Dependence of deliquesced particle fraction on RH field and residence time
First of all, the influence of RH fluctuations on the deliquesced particle fraction was determined for a fixed welas 2300 position, i.e. a fixed mean residence time. For this, the welas 2300 inlet was placed again at z = 30 cm. RHmean was varied between 71.6 % and 78.1 %, i.e., from below to above the DRH of the investigated NaCl particles, and σRH was set between 0 % and 9.5 %. A few studies exist (e.g., MacPherson et al., 1992; Lenchow et al., 1994; Kulmala et al., 1997; Siebert and Shaw, 2017) that show σRH values in the range of 1 % to 4.6 %, depending on the environmental conditions. It means that our measurements cover this range of observed strengths of RH fluctuations.
The obtained deliquesced particle fractions fdel are depicted in Fig. 4 as a function of σRH for four different RHmean values.
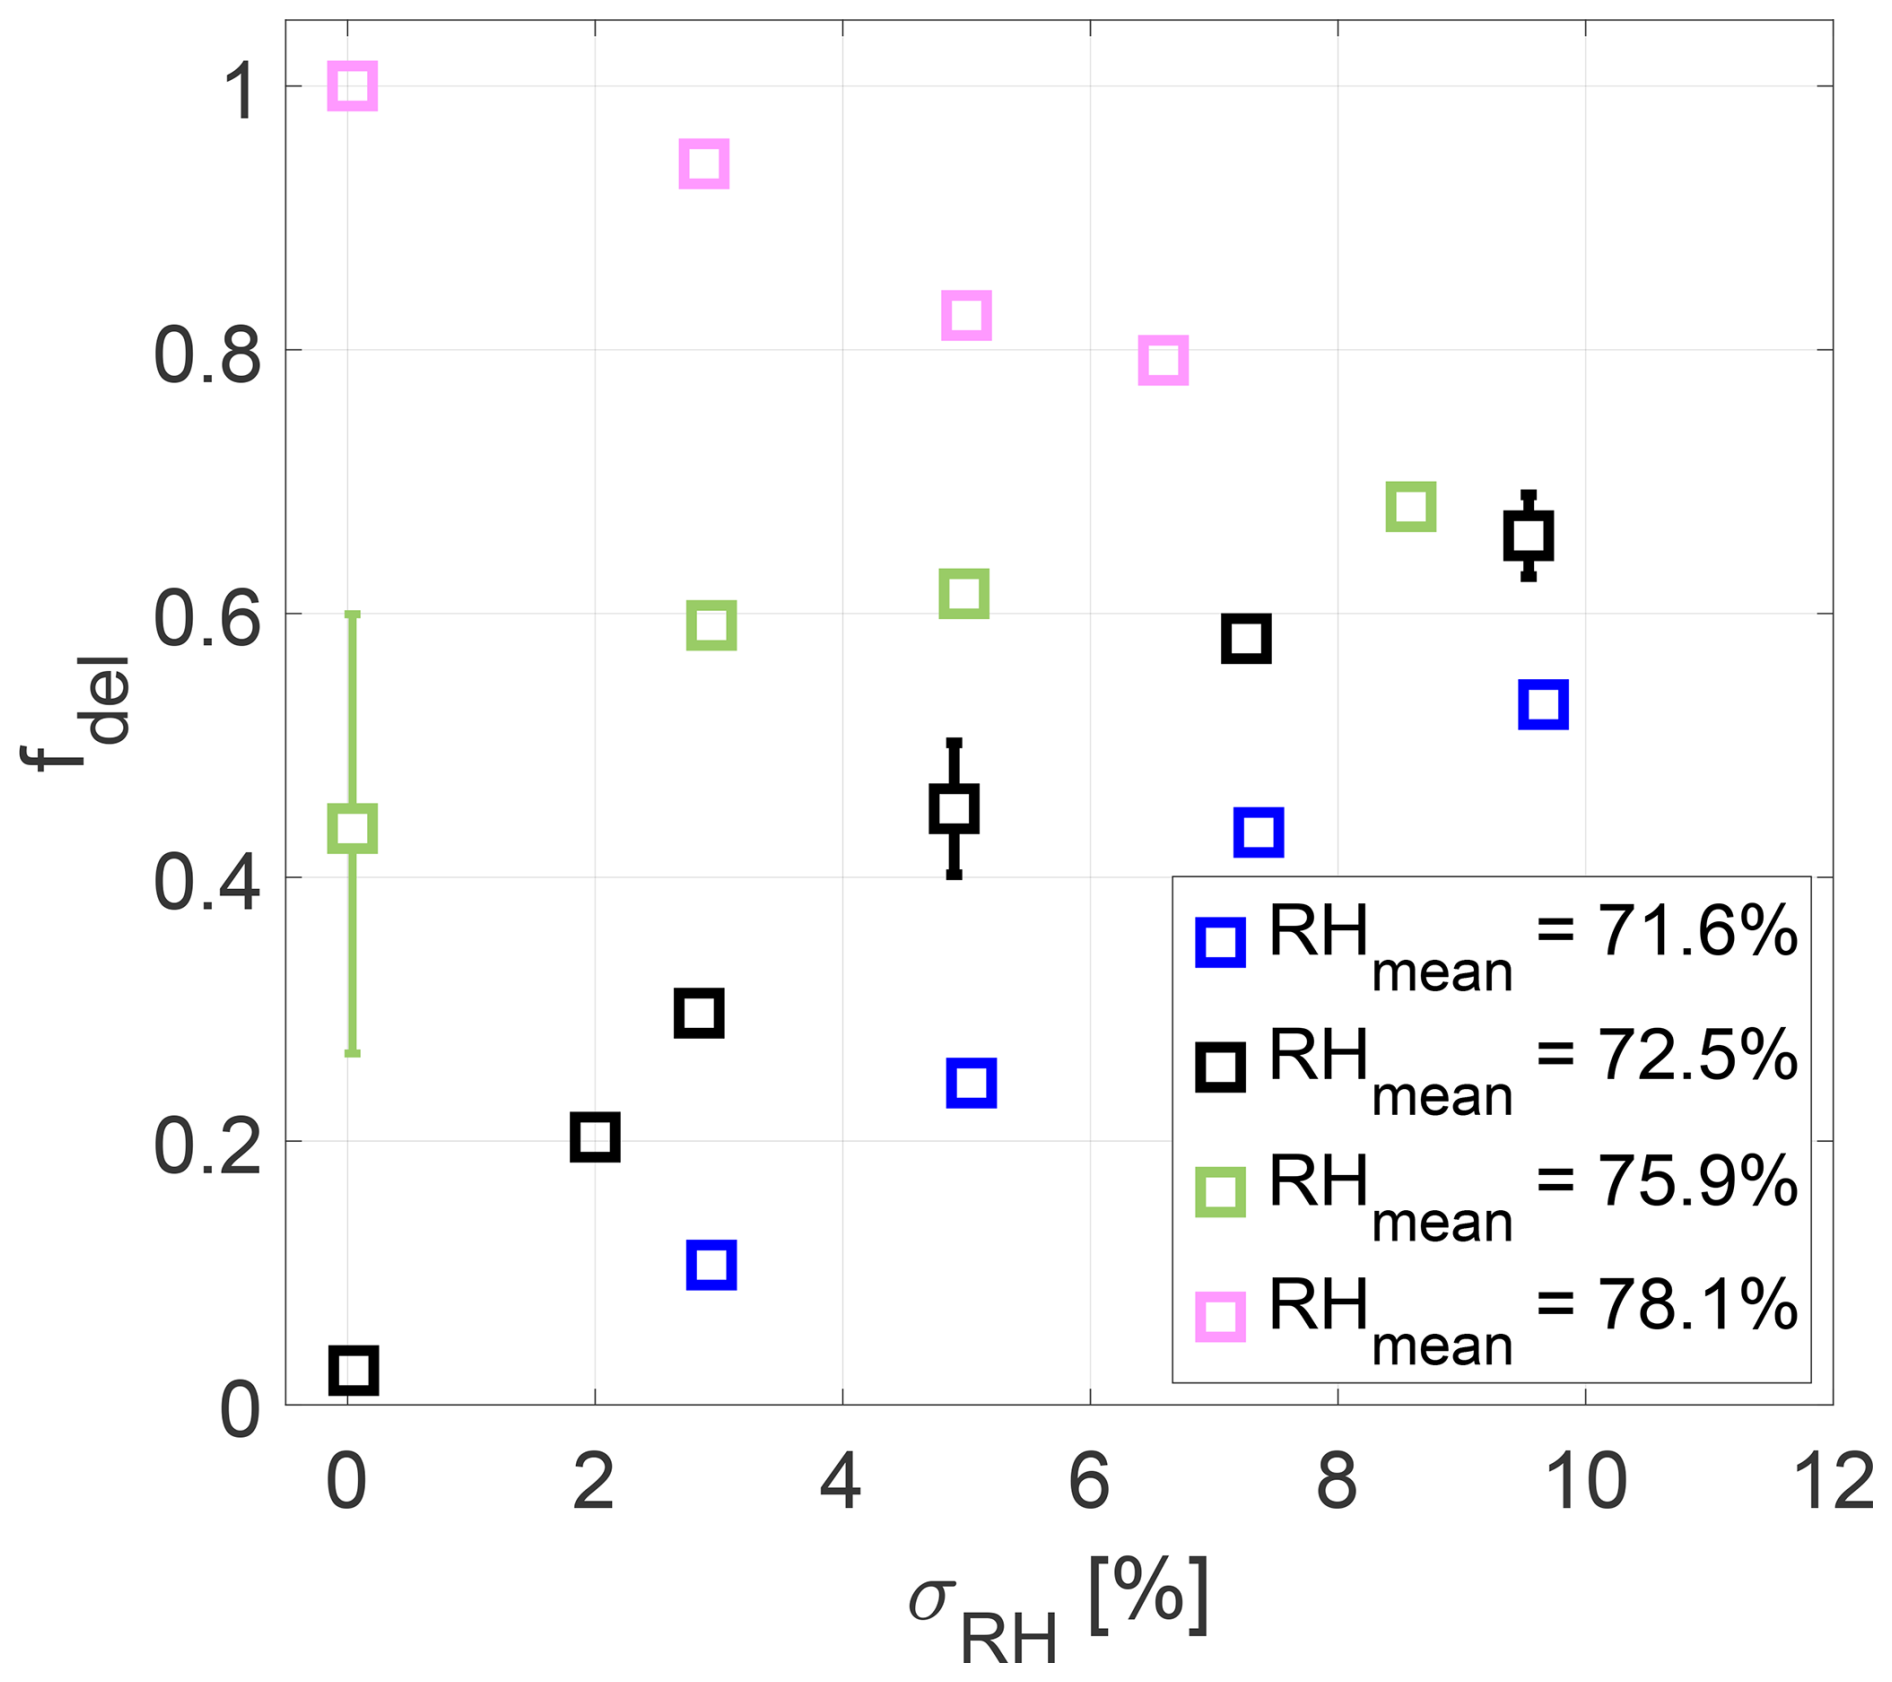
Figure 4Deliquesced particle fraction fdel as a function of the standard deviation of the RH distribution σRH. The error bars shown originate from repeated measurements (three to five times) giving the minimal and maximal obtained fdel, respectively.
Generally, it becomes obvious that the humidity fluctuations have a strong influence on the fraction of deliquesced particles. Particle deliquescence can be observed although RHmean < DRH. Furthermore, we detect an increase in the deliquesced particle fraction with increasing σRH as long as RHmean < DRH. In this case, an increasing σRH increases the probability that solid NaCl particles are in a RH field with RH values higher than the DRH. The slope of fdel flattens for RHmean, which is close to the DRH, and becomes negative for RHmean > DRH as now the increasing σRH increases the probability that solid NaCl particles experience a RH field with RH values lower than the DRH and therefore do not deliquesce. In other words, in this case, not all particles deliquesce although RHmean > DRH.
Secondly, the influence of RH fluctuations on the deliquesced particle fraction was determined as a function of mean particle residence time tres in a fluctuating RH field. This was achieved by changing the position of the welas 2300. The purpose of this type of experiment is as follows. Particles once deliquesced will not recrystallize/effloresce at the DRH. They would do so at the ERH, which is between 43 % and 45 % for NaCl particles of the investigated size range (Tang et al., 1977; Cziczo et al., 1997; Gao et al., 2007). However, in our experiments, even for the broadest RH distributions, we do not reach this ERH. That means if solid NaCl particles are inserted into fluctuating RH fields, the residence time in this field might influence the number and fraction of deliquesced particles.
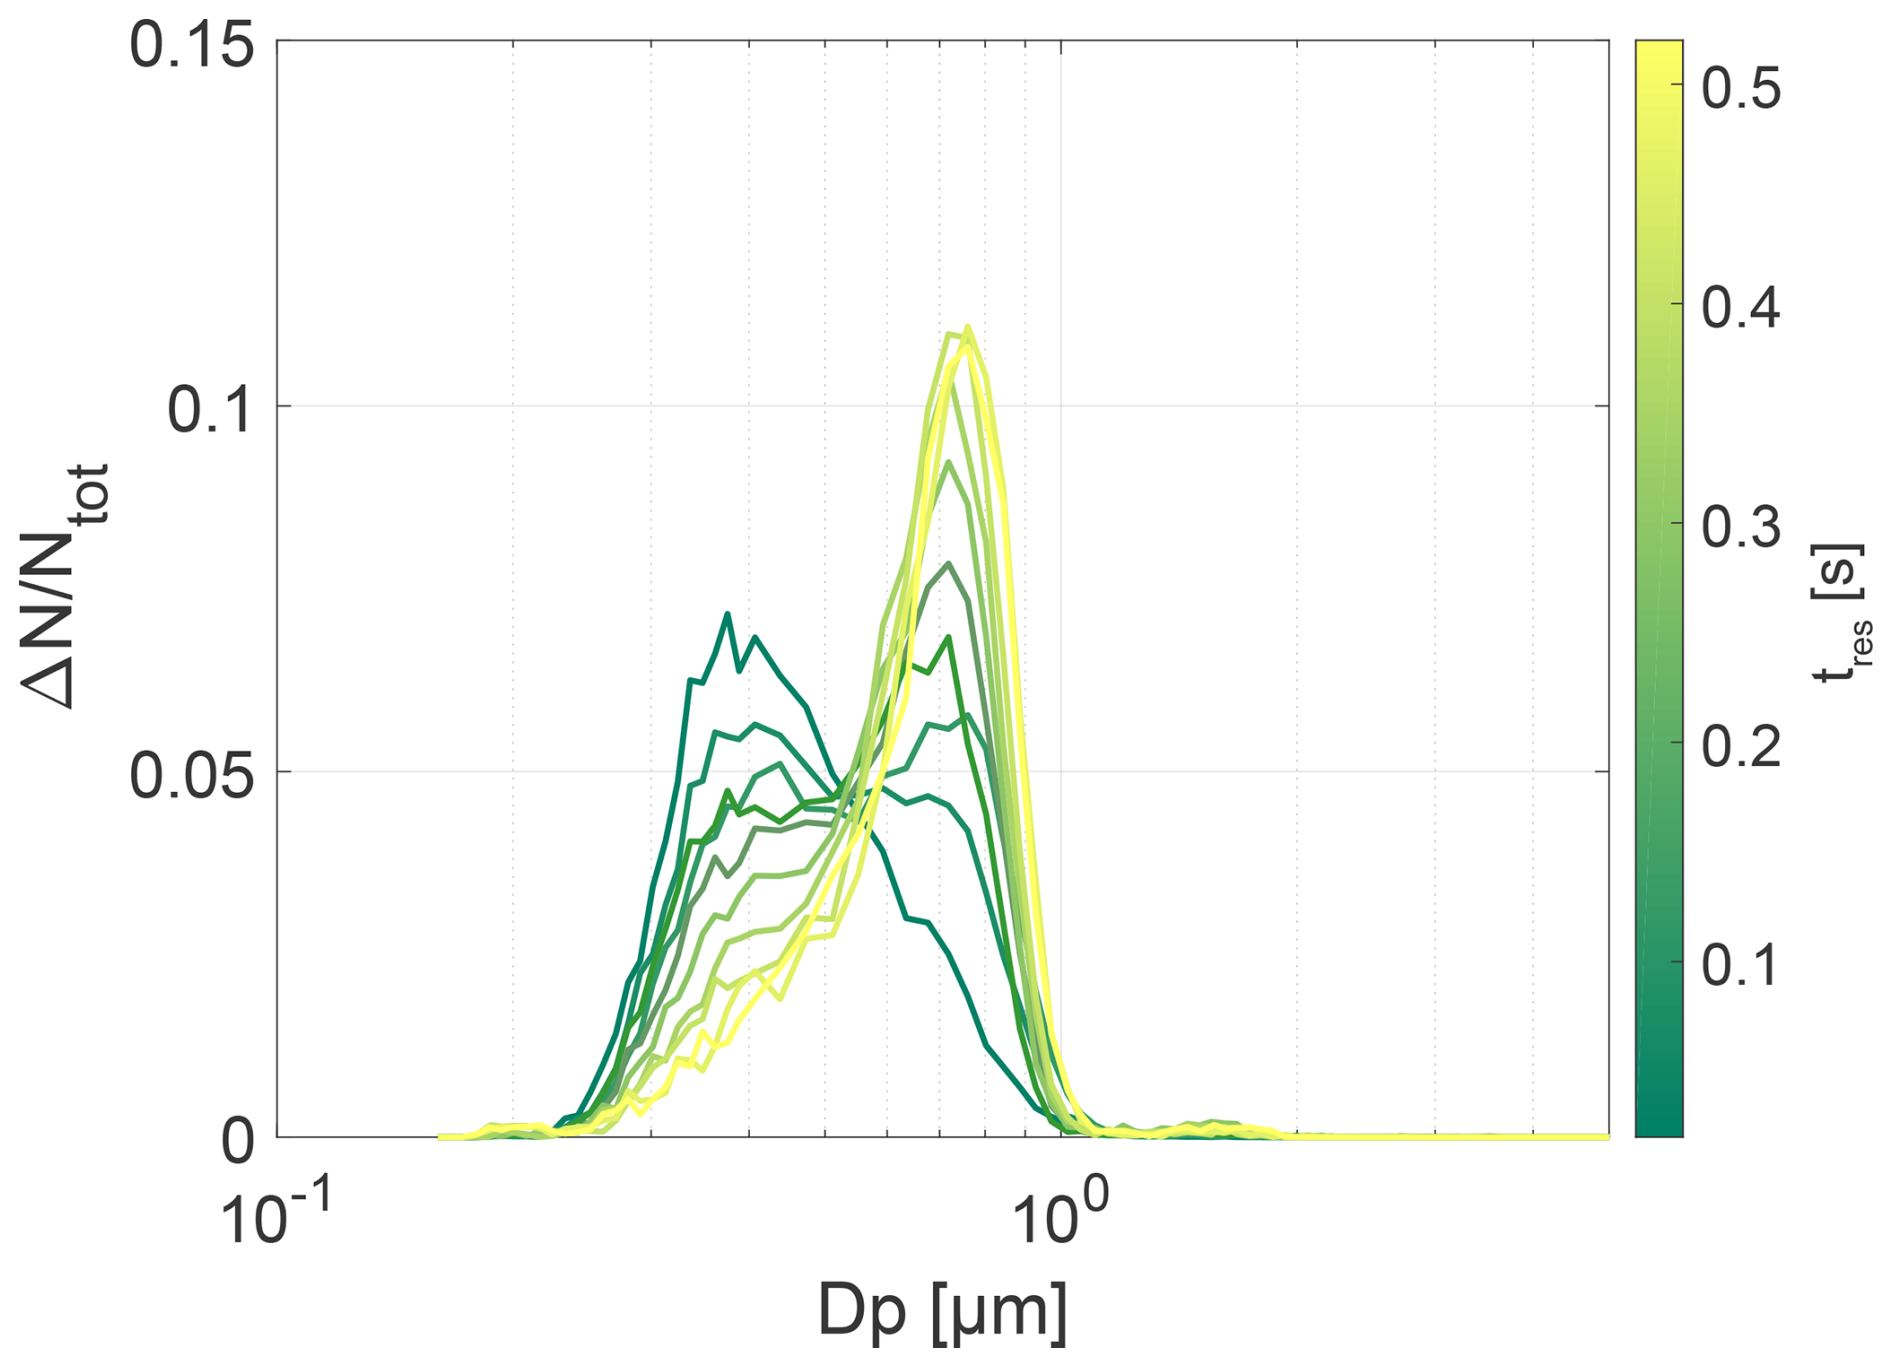
Figure 5Normalized particle number size distributions determined experimentally for RHmean = 75.9 % and σRH = 4.9 % but for different residence times tres inside the measurement section. The colors of the different number distributions correspond to the color map on the right-hand side of the plot denoting tres.
Figure 5 shows a series of normalized particle size distributions for RHmean = 75.9 % and σRH = 4.9 %, with different tres inside the measurement section. It can be seen that the deliquesced particle mode of the distributions (right mode) increases with increasing tres, while the solid particle mode (left mode) decreases. In other words, more particles deliquesce with increasing tres due to the hysteresis effect.
Measurements as presented in Fig. 5 have been carried out for other sets of RHmean and σRH values. The respective results are summarized in Fig. 6. Here, the fraction of deliquesced particles fdel is depicted as a function of tres (logarithmic scale) inside the fluctuating RH environment. In the left plot, RHmean is fixed, and σRH is varied. In the right plot, it is vice versa. The key findings are that the fraction of deliquesced particles increases with increasing tres for all investigated cases. For fixed RHmean, the slope of the three curves looks very similar, pointing towards an approximately exponential relationship between fdel and tres, with the curves shifting upwards to higher values of fdel as σRH increases. When looking at the curves for fixed σRH it can be observed that the slopes become flatter with increasing RHmean, as a greater proportion of the particles is already deliquesced at the lowest measured residence times. Consequently, fewer solid particles are available for deliquescence.
In summary, it can be said that the combination of turbulent RH fluctuations and hysteresis in aerosol particle deliquescence and efflorescence has a significant impact on the fraction of deliquesced particles over time. The time required for all NaCl particles to deliquesce depends on both the mean RH and the strength of the fluctuations, or in other words, the proportion of deliquesced particles is dependent on RHmean, σRH, and residence time.
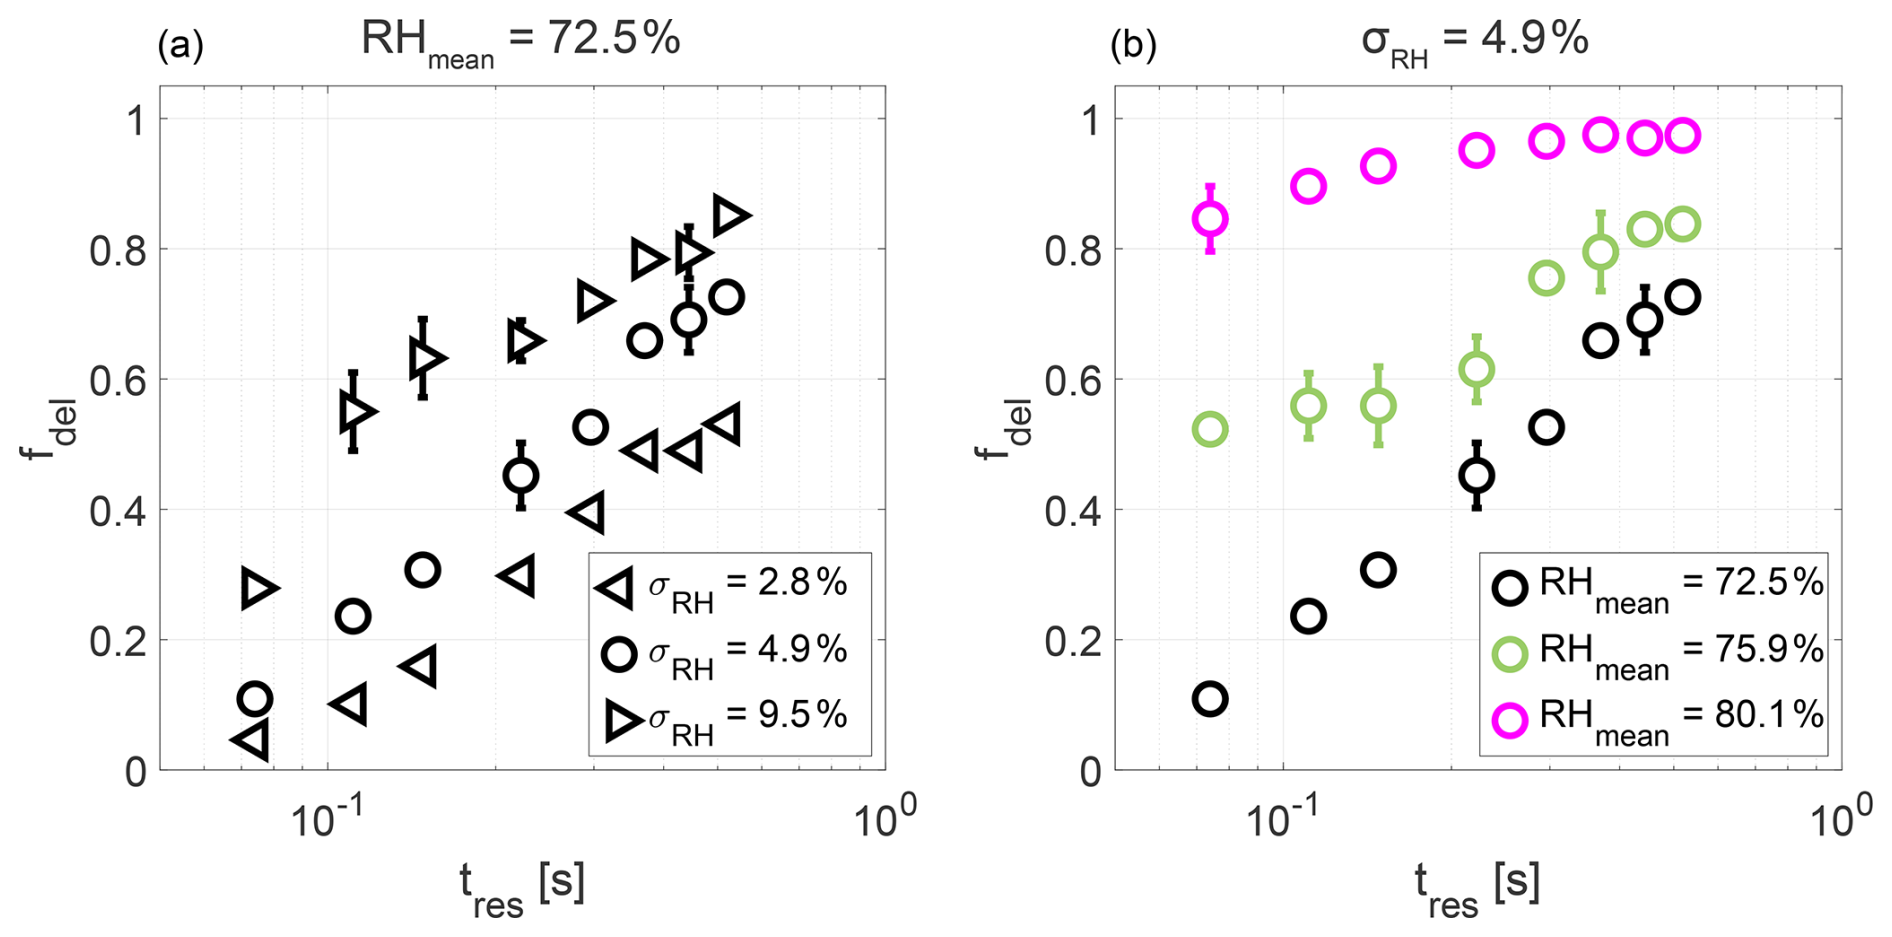
Figure 6Deliquesced particle fraction fdel as a function of particle residence time tres. (a) RHmean was set to 72.5 %, and σRH was varied. (b) σRH was set to 4.9 %, and RHmean was varied.
Finally, we simulated the deliquescence of the NaCl particles in the turbulent RH field by running LESs in OpenFOAM. In general, the time dependence of fdel can also be identified in the model results. However, the simulations appear to overestimate the observed deliquesced particle fractions, which might be caused by our assumption of a constant timescale for the deliquescence process itself. A detailed discussion about this discrepancy and its possible reasoning is given in Appendix B. Nevertheless it is important to point out that this discrepancy between measurement and simulation does not invalidate the experimental observations and central statements. Furthermore, it motivates us to investigate the suitability of different theories in the future (more details given in Appendix B).
We investigated the deliquescence behavior of size-selected, monodisperse NaCl particles in a turbulent humidity field with LACIS-T. The mean RH, the strength of RH fluctuations, and the residence time of the particles in the turbulent humidity field were varied. In general, we found that turbulence affects the number of deliquesced particles in a particle population, and this number depends on the combination of all three of the aforementioned variables. Fluctuations in the RH can lead to particle deliquescence, despite the mean RH being below the deliquescence RH. Conversely, particle deliquescence can be hindered even though the mean RH is above the deliquescence RH. However, a population of solid, non-deliquesced NaCl particles introduced into a fluctuating RH field, where the RH is always greater than the efflorescence RH and the RH fluctuations exceed the DRH, will deliquesce completely due to the combination of the turbulent RH fluctuations and the hysteresis effect. The time required to reach this fully deliquesced state is contingent upon the mean RH and the strength of the fluctuations.
We are able to simulate the general behavior of the NaCl particle deliquescence in the turbulent RH field by running LESs in OpenFOAM. However, the simulations tend to overestimate the observed deliquesced particle fractions, which might be caused by our assumption of a constant timescale for the deliquescence process itself. In order to achieve a more accurate representation of the experimental observations, different theories for the derivation of the deliquescence timescale τdel will be tested in the future. Following, for example, the argumentation of Khvorostyanov and Curry (2014, Chap. 11.3, pp. 553–558), nucleation rates and, with that, characteristic deliquescence timescales – which depend on the RH among other things – will be determined and implemented in the LES model.
Ultimately, the observation of the onset of particle deliquescence below and the presence of non-deliquesced particles above the DRH in a turbulent humid field is in line with the argumentation of Prigogine (1979), according to which a consistent macroscopic description is no longer given in the vicinity of non-equilibrium phase transitions (such as the deliquescence transition). Near the phase transition (here the DRH), the turbulent fluctuations become as important as the mean values. Macroscopic values represent the most likely ones, which are identical with the mean values only if fluctuations can be neglected. In the real atmosphere, however, turbulent fluctuations are always present. A few studies exist (e.g., MacPherson et al., 1992; Lenchow et al., 1994; Kulmala et al., 1997; Siebert and Shaw, 2017) that show σRH values in the range of 1 % to 4.6 %, depending on the environmental conditions. Our investigations cover this range of observed RH fluctuations, and we observe a distinct influence of the turbulent RH fluctuation on the fraction of deliquesced particles at these σRH values. This indicates that our results are relevant for the atmosphere.
Altogether, this implies that the description of hygroscopic growth and shrinking during humidification and dehumidification of the ambient atmosphere, respectively, requires the consideration of both (i) the hysteresis effects during particle evolution and in addition (ii) the turbulent character of the thermodynamic conditions of the ambient atmosphere, which affect the macroscopic boundary conditions of phase transition. This is of particular importance, among others, for the purposes of atmospheric modeling as the optical properties of solid and deliquesced particles differ, which needs to be carefully considered, for example, in radiative transfer schemes in global atmospheric models (Haarig et al., 2017). In that sense, we also suggest collecting additional data on atmospheric RH fluctuations, to be carried out in terrestrial and marine environments, at ground level and above.
Here, we compare the influence of two different types of NaCl particle pre-conditioning, i.e., Case (i) and Case (ii), as introduced in Sect. 2.1, on the RH field along the center line within the measurement section where the particles are injected, transported, and later detected. The comparison is based on the LESs performed in OpenFOAM. In both cases, the settings are RHA = 60 % and RHB = 85 %, leading to a mean RH of 72.5 % along the center line, and about 78 000 monodisperse NaCl particles with a mass equivalent diameter of Dpme = 370 nm tracked inside the measurement section. The RH that the particles experience is shown in Fig. A1 in terms of the median RH (RHmed), the mean RH (RHmean), and the standard deviation of the RH (σRH). For both cases, RHmed and RHmean fall together. The RH fluctuation distributions (not shown here) have a Gaussian shape. For Case (i), the aerosol is injected with RH ≤ 5 %, and it can be observed that RHmean in the mixing zone is lowered significantly close to the aerosol inlet due to the low aerosol RH. The obtained RHmean is about 46 % which is 26.5 % lower as it would occur in case of no particle injection. With increasing distance to the aerosol inlet, RHmean rises until about z = 30 cm distance where it starts to become constant. Due to this increase in RHmean, the whole RH distribution gets shifted towards larger RH values which additionally influences σRH. This steep increase in RHmean combined with the increase in σRH would complicate the data interpretation. Therefore, this setup was not used for our investigations.
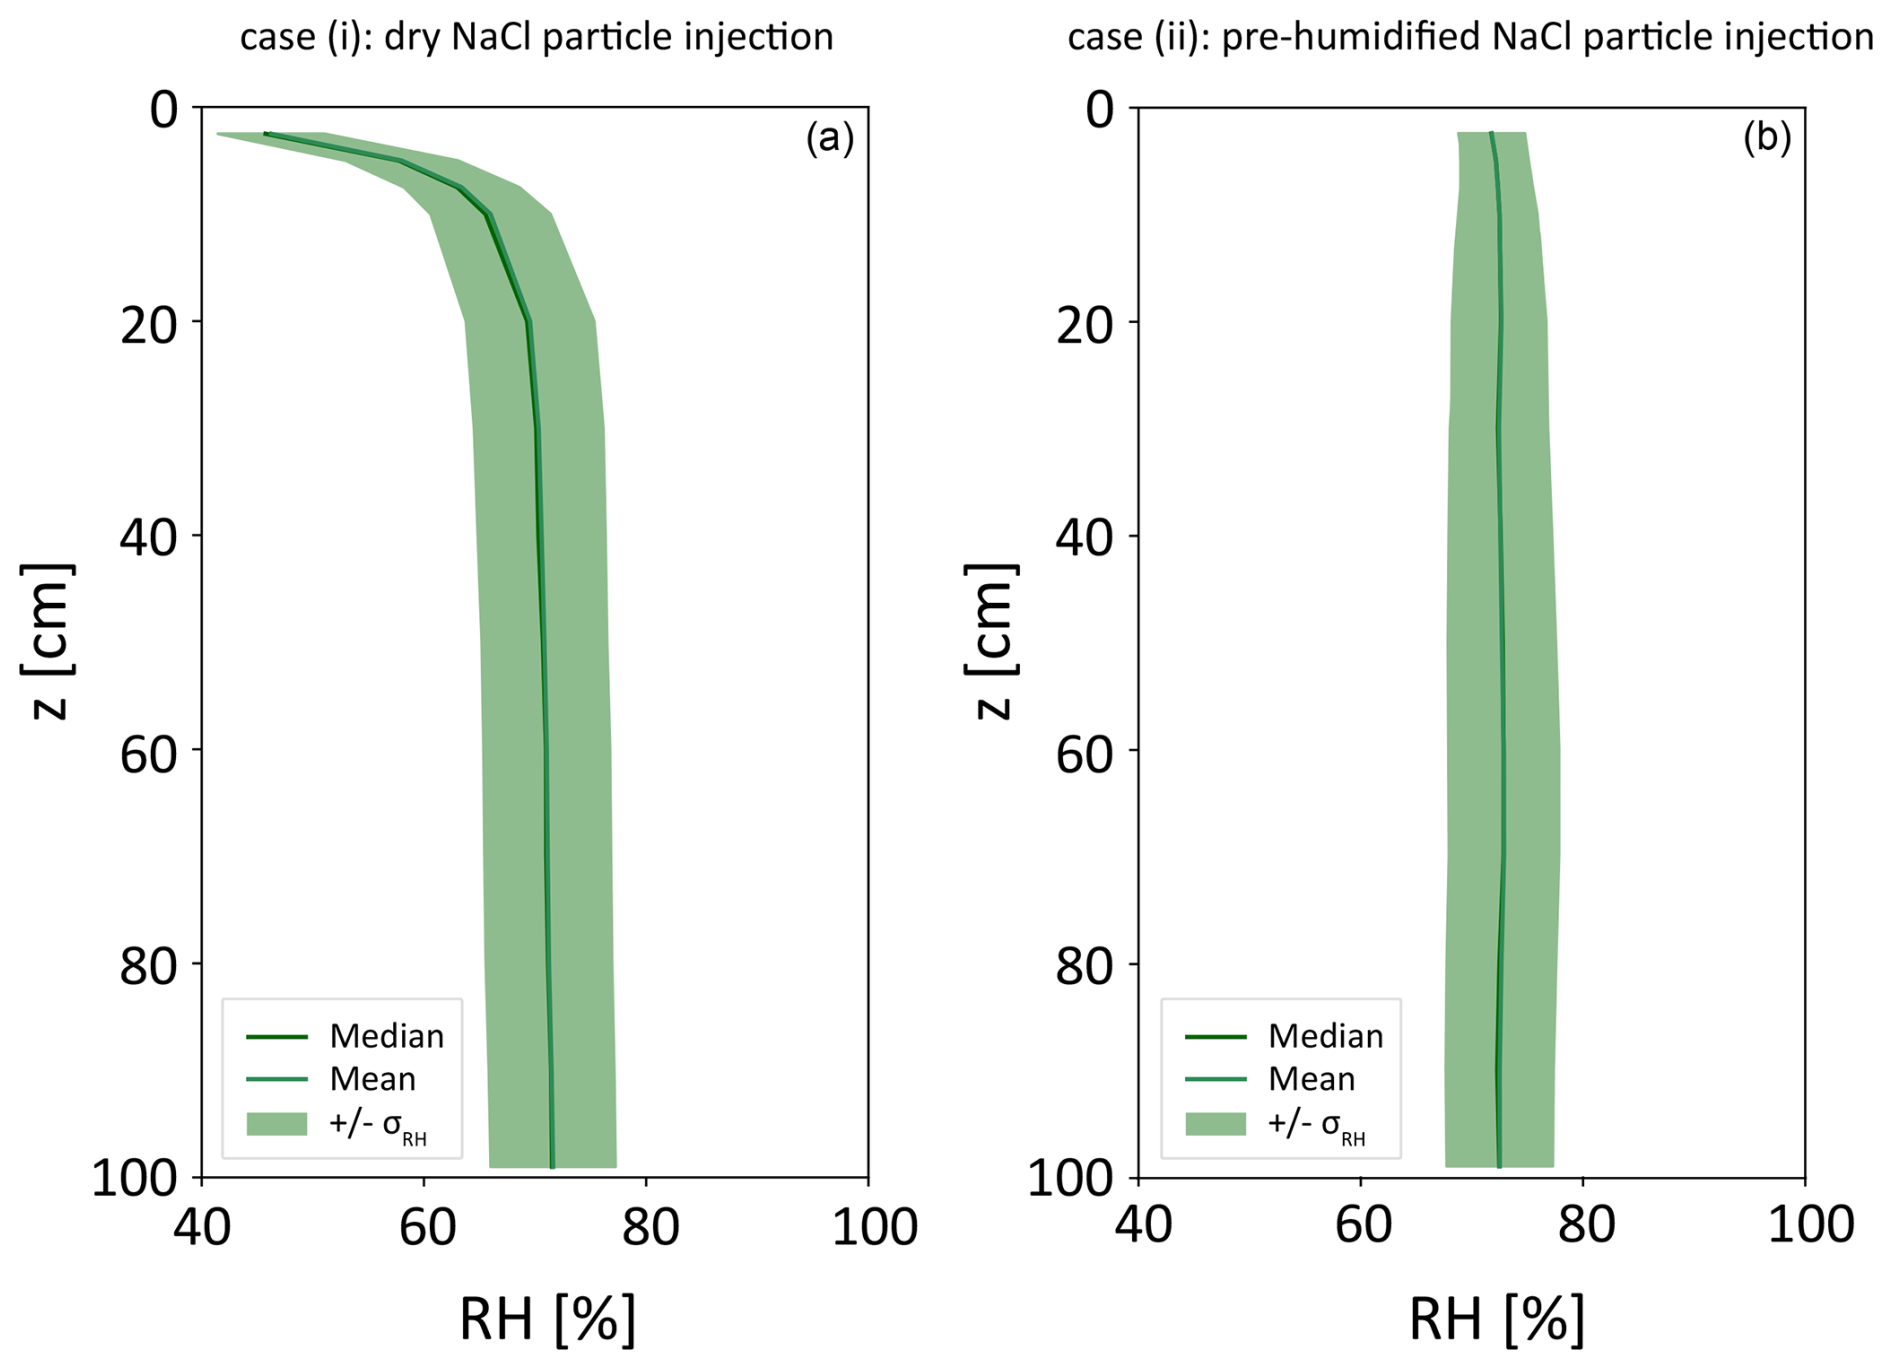
Figure A1LES results for the scenario of RHA = 60 % and RHB = 85 %, which results in a mean RH of 72.5 % along the center region (i.e., the main mixing zone). The obtained median RH, mean RH, and RH fluctuations in terms of ±σRH are plotted for the center region as a function of the distance z to the aerosol inlet of the measurement section for two different types of particle injection. (a) Injection of dry aerosol (Case i: RH ≤ 5 % at 15 °C). (b) Injection of pre-humidified aerosol (Case ii: RH = 70.2 % at 15 °C).
For Case (ii), the aerosol is injected with RH = 70.2 %, which results in an only slightly lowered RHmean in the mixing zone. σRH increases within the first 15 cm, becoming constant to a value of 4.9 %. Therefore, this setup was applied for our experiments, and data obtained for z ≥ 15 cm were used for the later data interpretation.
The model study was performed to test whether or not we are sensitive enough to observe the effects of turbulent RH fluctuations on the fraction of deliquesced particles. In Fig. B1, the measured and simulated deliquesced particle fractions fdel are plotted as a function of particle residence time tres exemplarily for RHmean = 72.5 % and three different σRH values. In general, the time dependence of fdel can also be identified in the model results. However, the simulations tend to overestimate fdel for the cases of σRH = 4.9 % and 9.5 % and for residence times below 0.3 s. For the σRH = 2.8 % case, there is closer agreement between the measurement and the simulation. However, the simulated slope differs from the experimentally determined one. This latter observation also holds for the other two cases.
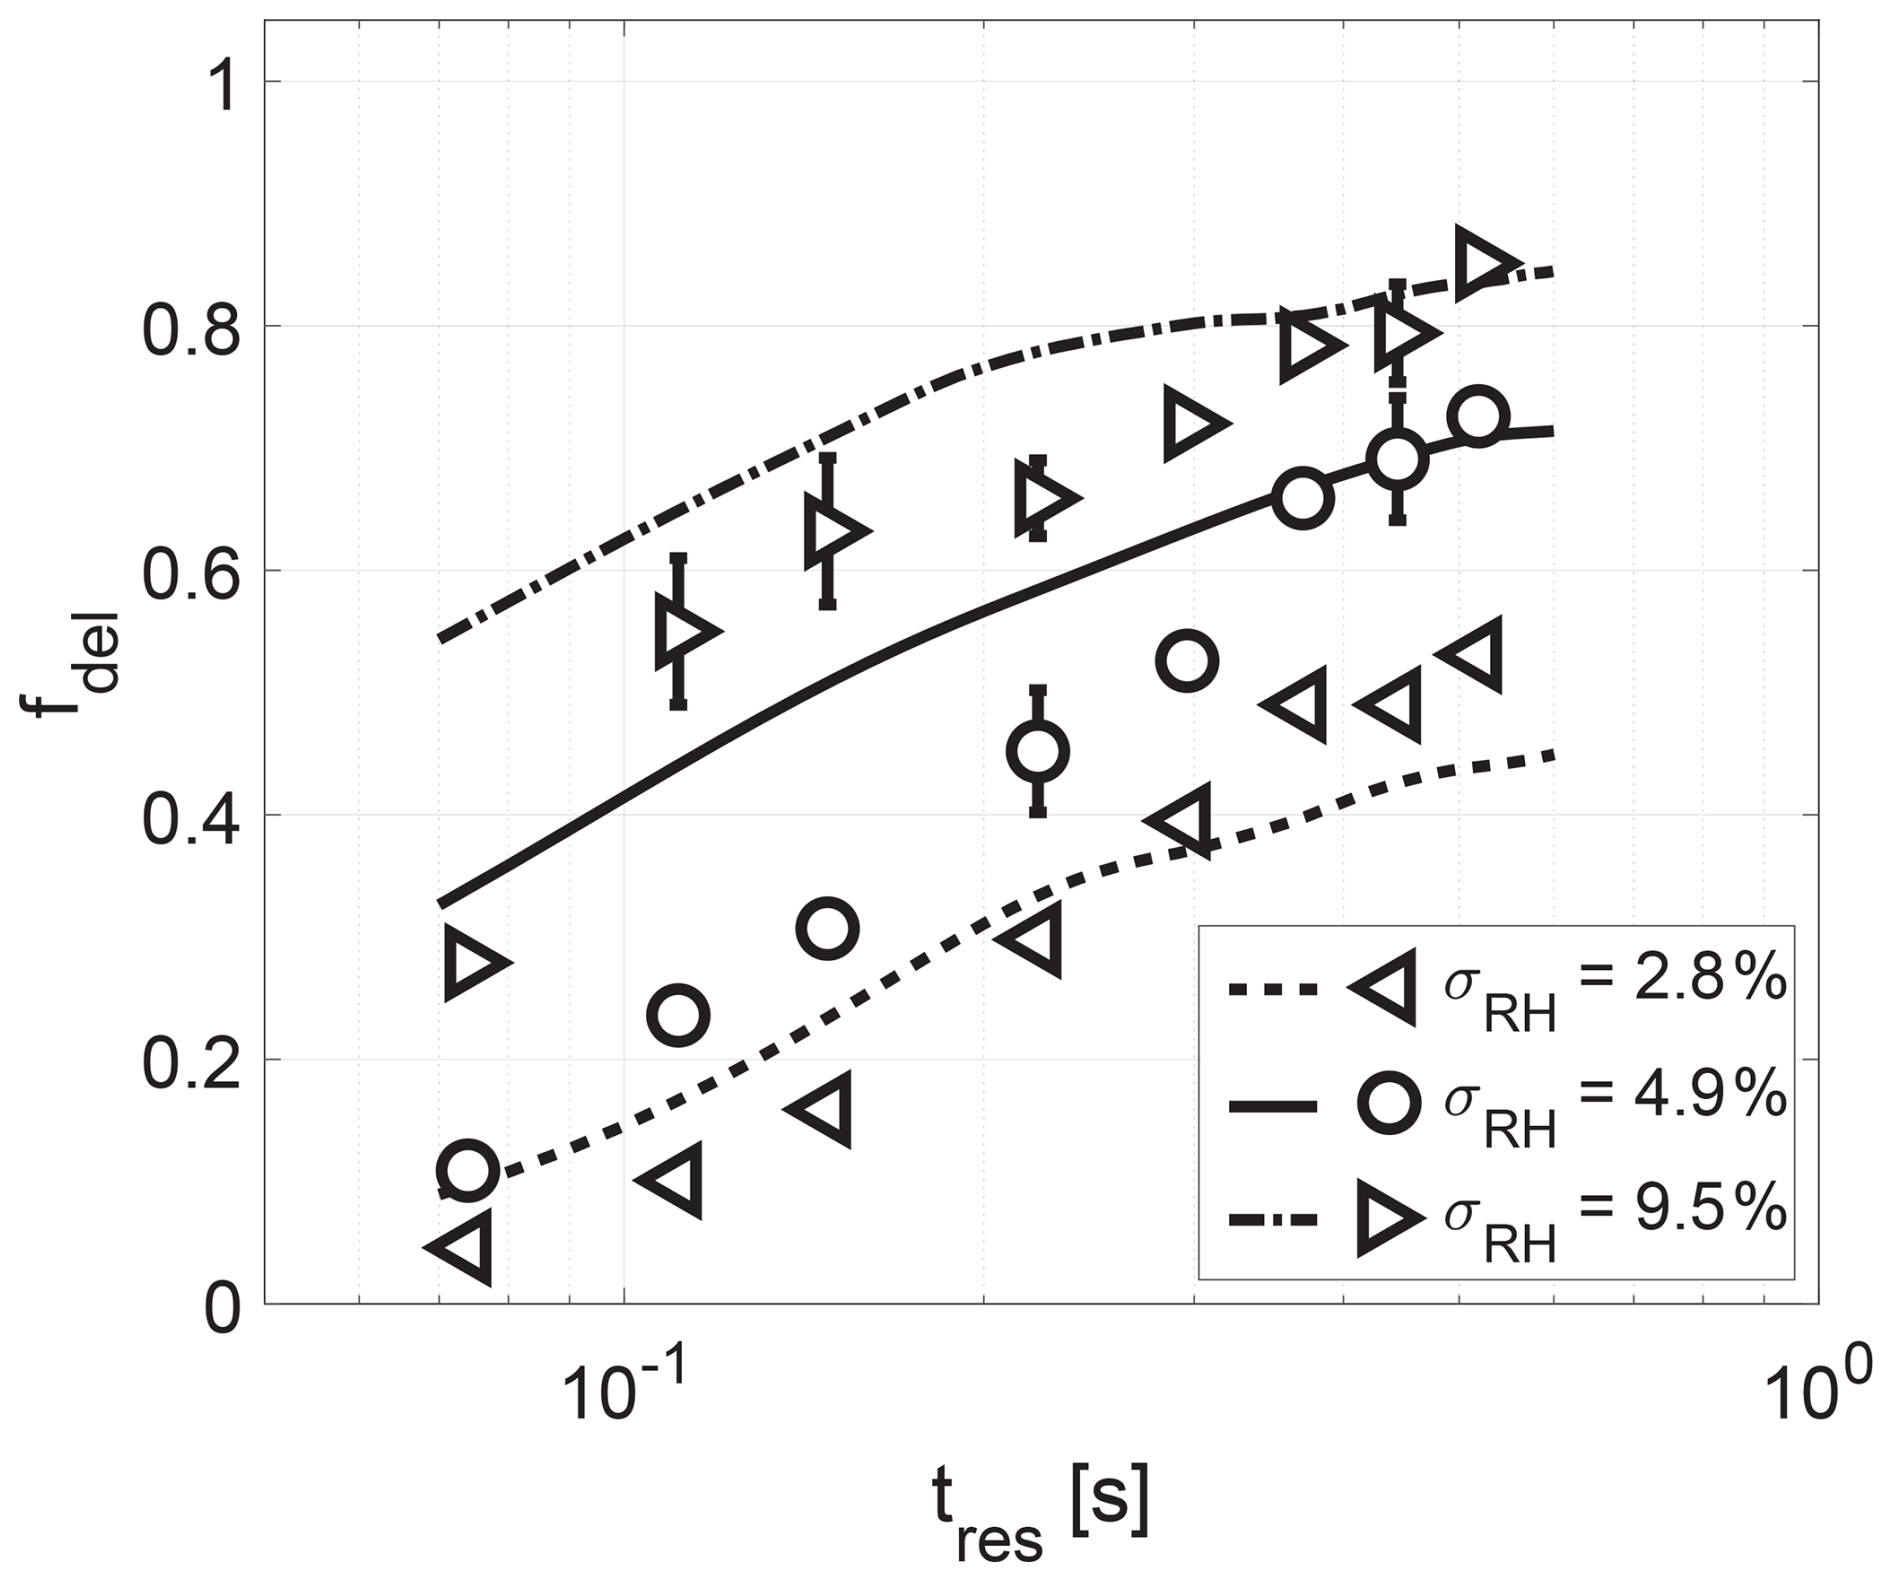
Figure B1Measured (symbols) and simulated (lines) deliquesced particle fraction fdel as a function of particle residence time tres for RHmean = 72.5 %.
The question arises about the reason for this discrepancy. In general, the LES model has proven to be an effective tool for simulating the thermodynamic and fluidic conditions inside the measurement section as well as the hygroscopic and dynamic growth of droplets which formed on NaCl particles (Niedermeier et al., 2020). In view of the lack of full information of the microscopic state of the investigated system, the modeling setup required some closure assumptions, in which uncertainties are inherent. Perhaps our assumption about the timescale of deliquescence (τdel) is too simplified. We assumed – as mentioned before – that NaCl deliquescence occurs on the timescale of 10−4 s once DRH = 75.5 % is reached based on molecular dynamics simulations performed by Bahadur and Russell (2008). An increase in the deliquescence timescale τdel to 10−3 s does not lead to a significant change in the simulated deliquesced particle fractions (not shown) because the mixing timescale τmix (in the order of 10−1 s) is still 2 orders of magnitude larger than τdel; therefore the microphysical system is able to react to thermodynamic changes.
Several other theories of deliquescence have been developed during the last decades (McGraw and Lewis, 2009; Lamb and Verlinde, 2011, Chap. 7.1, pp. 290–295; Hellmuth et al., 2013, Chap. 12.2, pp. 319–334; Shchekin et al., 2013; Khvorostyanov and Curry, 2014, Chap. 11.3, pp. 553–558) that are based on different approaches. For example, Khvorostyanov and Curry (2014, Chap. 11.3, pp. 553–558) describe deliquescence as a nucleation process (in line with experiments performed by Cantrell et al., 2002), beginning with the formation of a liquid solution germ on a crystal surface. Consequently, they derive a nucleation rate in analogy to surface melting. From this nucleation rate, τdel for the deliquescence process of NaCl particles could be determined, which depends, among others, on the actual RH. However, it should be noted that we were not able to observe/resolve the nucleation process itself in our laboratory experiments.
One could also think about an experimental approach in order to determine τdel. However, for these measurements, energy dissipation rates ranging from 10−2 up to 106 m2 s−3 would be needed so that the mixing timescale τmix could be varied, ranging from values larger than τdel to values smaller than it. In the two extremes, the microphysical system will either be able to react to thermodynamic changes (fast microphysics, τmix ≫ τdel) or not (slow microphysics, τmix ≪ τdel). The transition region (τmix ≈ τdel) could give an estimate for the deliquescence timescale.
However, testing different theories and performing additional experiments for the derivation of τdel are beyond the scope of this study. It has to be the objective of future studies to investigate the suitability of different theories and experimental approaches in this context.
Data sets are available via ACTRIS/EUROCHAMP Data Centre at https://doi.org/10.25326/H5TE-AS54 (Niedermeier, 2025a) and https://doi.org/10.25326/CD1K-QF91 (Niedermeier, 2025b). For further information, please contact Dennis Niedermeier (dennis.niedermeier@tropos.de).
DN and RH wrote the manuscript with contributions from all co-authors. LACIS-T measurements and data evaluation were performed by DN and RH, with contributions from SiS, WF, MP, and FrS. Numerical simulations were performed by SiS, with contributions from DN, RH, FaS, OH, and FrS. All authors discussed the experimental and numerical results.
The contact author has declared that none of the authors has any competing interests.
Publisher's note: Copernicus Publications remains neutral with regard to jurisdictional claims made in the text, published maps, institutional affiliations, or any other geographical representation in this paper. While Copernicus Publications makes every effort to include appropriate place names, the final responsibility lies with the authors.
Wiebke Frey has received funding from the European Union's Horizon 2020 RI program as an Individual Fellowship under the Marie Skłodowska-Curie Action, grant agreement no. 835305.
This research has been supported by the Bundesministerium für Bildung und Forschung (grant nos. 01LK2001A-K and 01LK2002A-G) in the context of ACTRIS-D, which is the German contribution to the Aerosols, Clouds and Trace Gases Research Infrastructure (ACTRIS).
This paper was edited by Jose Castillo and reviewed by two anonymous referees.
Bahadur, R. and Russell, L. M.: Water uptake coefficients and deliquescence of NaCl nanoparticles at atmospheric relative humidities from molecular dynamics simulations, J. Chem. Phys., 129, 094508, https://doi.org/10.1063/1.2971040, 2008. a, b, c, d, e
Baker, M. B., Breidenthal, R. E., Choularton, T. W., and Latham, J.: The effects of turbulent mixing in clouds, J. Atmos. Sci., 41, 299–304, https://doi.org/10.1175/1520-0469(1984)041<0299:TEOTMI>2.0.CO;2, 1984. a
Bodenschatz, E., Malinowski, S. P., Shaw, R. A., and Stratmann, F.: Can we understand clouds without turbulence?, Science, 327, 970–971, https://doi.org/10.1126/science.1185138, 2010. a
Cantrell, W., McCrory, C., and Ewing, G. E.: Nucleated deliquescence of salt, J. Chem. Phys., 116, 2116–2120, https://doi.org/10.1063/1.1429924, 2002. a
Chai, X. and Mahesh, K.: Dynamic-equation model for large-eddy simulation of compressible flows, J. Fluid Mech., 699, 385–413, https://doi.org/10.1017/jfm.2012.115, 2012. a
Chandrakar, K. K., Morrison, H., Grabowski, W. W., Bryan, G. H., and Shaw, R. A., Supersaturation variability from scalar mixing: Evaluation of a new subgrid-scale model using direct numerical simulations of turbulent Rayleigh–Bénard convection, J. Atmos. Sci., 79, 1191–1210, https://doi.org/10.1175/JAS-D-21-0250.1, 2022. a
Cziczo, D. J., Nowak, J. B., Hu, J. H., and Abbatt, J. P. D.: Infrared spectroscopy of model tropospheric aerosols as a function of relative humidity: Observation of deliquescence and crystallization, J. Geophys. Res.-Atmos., 102, 18843–18850, https://doi.org/10.1029/97JD01361, 1997. a, b, c
Finlayson-Pitts, B. J. and Hemminger, J. C.: Physical Chemistry of airborne sea salt particles and their components, J. Phys. Chem. A, 104, 11463–11477, https://doi.org/10.1021/jp002968n, 2000. a
Gao, Y., Chen, S. B., and Liya, E. Y.: Efflorescence relative humidity of airborne sodium chloride particles: A theoretical investigation, Atmos. Environ., 41, 2019–2023, https://doi.org/10.1016/j.atmosenv.2006.12.014, 2007. a, b, c
Haarig, M., Ansmann, A., Gasteiger, J., Kandler, K., Althausen, D., Baars, H., Radenz, M., and Farrell, D. A.: Dry versus wet marine particle optical properties: RH dependence of depolarization ratio, backscatter, and extinction from multiwavelength lidar measurements during SALTRACE, Atmos. Chem. Phys., 17, 14199–14217, https://doi.org/10.5194/acp-17-14199-2017, 2017. a
Hellmuth, O., Khvorostyanov, V. I., Curry, J. A., Shchekin, A. K., Schmelzer, J. W. P., Feistel, R., Djikaev, Y. S., and Baidakov, V. G.: Nucleation Theory and Applications: Special issues, Review series on selected topics of atmospheric sol formation, Vol. 1, Joint Institute for Nuclear Research (JINR), Dubna, ISBN: 978-5-9530-0349-0, 2013. a, b
Hellmuth, O. and Shchekin, A. K.: Determination of interfacial parameters of a soluble particle in a nonideal solution from measured deliquescence and efflorescence humidities, Atmos. Chem. Phys., 15, 3851–3871, https://doi.org/10.5194/acp-15-3851-2015, 2015. a
Kelly, W. P. and McMurry, P. H.: Measurement of particle density by inertial classification of differential mobility analyzer-generated monodisperse aerosols, Aerosol Sci. Tech., 17, 199–212, https://doi.org/10.1080/02786829208959571, 1992. a
Khvorostyanov, V. I. and Curry, J. A.: Thermodynamics, kinetics, and microphysics of clouds, Cambridge University Press, ISBN: 978-1-107-01603-3, 2014. a, b, c, d, e, f, g, h
Knutson, E. O. and Whitby, K. T.: Aerosol classification by electric mobility: apparatus, theory, and applications, J. Aerosol Sci., 6, 443–451, https://doi.org/10.1016/0021-8502(75)90060-9, 1975. a
Krueger, B. J., Grassian, V. H., Iedema, M. J., Cowin, J. P., and Laskin, A.: Probing heterogeneous chemistry of individual atmospheric particles using scanning electron microscopy and energy-dispersive X-ray analysis, Anal. Chem., 75, 5170–5179, https://doi.org/10.1021/ac034455t, 2003. a
Kulmala, M., Rannik, Ü., Zapadinsky, E. L., and Clement, C. F.: The effect of saturation fluctuations on droplet growth, J. Aerosol Sci., 28, 1395–1409, https://doi.org/10.1016/S0021-8502(97)00015-3, 1997. a, b
Lamb, D. and Verlinde, J.: Physics and chemistry of clouds, Cambridge University Press, ISBN: 978-0-521-89910-9, 2011. a
Lehmann, K., Siebert, H., and Shaw, R. A.: Homogeneous and inhomogeneous mixing in cumulus clouds: Dependence on local turbulence structure, J. Atmos. Sci., 66, 3641–3659, https://doi.org/10.1175/2009JAS3012.1, 2009. a, b
Lenchow, D. H., Mann, J., and Kristensen, L.: How long is long enough when measuring fluxes and other turbulence statistics?, J. Atmos. Ocean. Tech., 11, 661–673, https://doi.org/10.1175/1520-0426(1994)011<0661:HLILEW>2.0.CO;2, 1994. a, b
Liu, Y., Wu, Z., Huang, X., Shen, H., Bai, Y., Qiao, K., Meng, X., Hu, W., Tang, M., and He, L.: Aerosol phase state and its link to chemical composition and liquid water content in a subtropical coastal megacity, Environ. Sci. Technol., 53, 5027–5033, https://doi.org/10.1021/acs.est.9b01196, 2019. a
Ma, S.-S., Yang, W., Zheng, C.-M., Pang, S.-F., and Zhang, Y.-H.: Subsecond measurements on aerosols: From hygroscopic growth factors to efflorescence kinetics, Atmos. Environ., 210, 177–185, https://doi.org/10.1016/j.atmosenv.2019.04.049, 2019. a
MacPherson, J. I., Grossman, R. L., and Kelly, R. D.: Intercomparison results for FIFE flux aircraft, J. Geophys. Res.-Atmos., 97, 18499–18514, https://doi.org/10.1029/92JD00272, 1992. a, b
McGraw, R. and Lewis, E. R.: Deliquescence and efflorescence of small particles, J. Chem. Phys., 131, 194705, https://doi.org/10.1063/1.3251056, 2009. a
Niedermeier, D., Wex, H., Voigtländer, J., Stratmann, F., Brüggemann, E., Kiselev, A., Henk, H., and Heintzenberg, J.: LACIS-measurements and parameterization of sea-salt particle hygroscopic growth and activation, Atmos. Chem. Phys., 8, 579–590, https://doi.org/10.5194/acp-8-579-2008, 2008. a, b, c
Niedermeier, D., Voigtländer, J., Schmalfuß, S., Busch, D., Schumacher, J., Shaw, R. A., and Stratmann, F.: Characterization and first results from LACIS-T: a moist-air wind tunnel to study aerosol–cloud–turbulence interactions, Atmos. Meas. Tech., 13, 2015–2033, https://doi.org/10.5194/amt-13-2015-2020, 2020. a, b, c, d, e, f
Niedermeier, D.: Atmospheric simulation chamber study: sodium chloride + water + None - Aerosol study - hygroscopicity - 2021-07-13, Version 1.0, AERIS [data set], https://doi.org/10.25326/H5TE-AS54, 2025a. a
Niedermeier, D.: Atmospheric simulation chamber study: sodium chloride + water + None - Aerosol study - hygroscopicity - 2022-03-15, Version 1.0, AERIS [data set], https://doi.org/10.25326/CD1K-QF91, 2025b. a
Peng, C., Chen, L., and Tang, M.: A database for deliquescence and efflorescence relative humidities of compounds with atmospheric relevance, Fundamental Research, 2, 578–587, https://doi.org/10.1016/j.fmre.2021.11.021, 2022. a
Prigogine, I.: Vom Sein zum Werden: Zeit und Komplexität in den Naturwissenschaften. Nobelpreis 1977, R. Piper & Co. Verlag. München/Zürich, 261 pp., ISBN: 978-3-492-02488-4, 1979. a
Seinfeld, J. H. and Pandis, S. N.: Atmospheric chemistry and physics: from air pollution to climate change, John Wiley & Sons, ISBN: 978-0-471-72018-8, 2006. a, b, c, d, e, f
Shchekin, A. K., Shabaev, I. V., and Rusanov, A. I.: Thermodynamics of droplet formation around a soluble condensation nucleus in the atmosphere of a solvent vapor, J. Chem. Phys., 129, 214111, https://doi.org/10.1063/1.3021078, 2008. a
Shchekin, A. K., Shabaev, I. V., and Hellmuth, O.: Thermodynamic and kinetic theory of nucleation, deliquescence and efflorescence transitions in the ensemble of droplets on soluble particles, J. Chem. Phys., 138, 054704, https://doi.org/10.1063/1.4789309, 2013. a, b
Siebert, H., Franke, H., Lehmann, K., Maser, R., Saw, E. W., Schell, D., Shaw, R. A., and Wendisch, M.: Probing finescale dynamics and microphysics of clouds with helicopter-borne measurements, B. Am. Meteorol. Soc., 87, 1727–1738, https://doi.org/10.1175/BAMS-87-12-1727, 2006. a
Siebert, H. and Shaw, R. A.: Supersaturation fluctuations during the early stage of cumulus formation, J. Atmos. Sci., 74, 975–988, https://doi.org/10.1175/JAS-D-16-0115.1, 2017. a, b
Sloane, C.: Optical properties of aerosols of mixed composition, Atmos. Environ., 18, 871–878, https://doi.org/10.1016/0004-6981(84)90273-7, 1984. a
Tang, I. N. and Munkelwitz, H. R.: An investigation of solute nucleation in levitated solution droplets, J. Colloid Interf. Sci., 98, 430–438, https://doi.org/10.1016/0021-9797(84)90167-X, 1984. a
Tang, I. N., Munkelwitz, H. R., and Davis, J. G.: Aerosol growth studies – II. Preparation and growth measurements of monodisperse salt aerosols, J. Aerosol Sci., 8, 149–159, https://doi.org/10.1016/0021-8502(77)90002-7, 1977. a, b, c
Tang, M., Chan, C. K., Li, Y. J., Su, H., Ma, Q., Wu, Z., Zhang, G., Wang, Z., Ge, M., Hu, M., He, H., and Wang, X.: A review of experimental techniques for aerosol hygroscopicity studies, Atmos. Chem. Phys., 19, 12631–12686, https://doi.org/10.5194/acp-19-12631-2019, 2019. a, b
Titos, G., Cazorla, A., Zieger, P., Andrews, E., Lyamani, H., Granados-Muñoz, M. J., Olmo, F. J., and Alados-Arboledas, L.: Effect of hygroscopic growth on the aerosol light-scattering coefficient: A review of measurements, techniques and error sources, Atmos. Environ., 141, 494–507, https://doi.org/10.1016/j.atmosenv.2016.07.021, 2016. a, b
Toon, O. B., Pollack, J. B., and Khare, B. N.: The optical constants of several atmospheric aerosol species: Ammonium sulfate, aluminum oxide, and sodium chloride, J. Geophys. Res.-Oc. Atm., 81, 5733–5748, https://doi.org/10.1029/JC081i033p05733, 1976. a
Wex, H., Kiselev, A., Stratmann, F., Zoboki, J., and Brechtel, F.: Measured and modeled equilibrium sizes of NaCl and (NH4)2SO4 particles at relative humidities up to 99.1 %, J. Geophys. Res.-Atmos., 110, D21212, https://doi.org/10.1029/2004JD005507, 2005. a
Wex, H., Ziese, M., Kiselev, A., Henning, S., and Stratmann, F.: Deliquescence and hygroscopic growth of succinic acid particles measured with LACIS, Geophys. Res. Lett., 34, L17810, https://doi.org/10.1029/2007GL030185, 2007. a
Wilck, M.: Modal Modelling of Multicomponent Aerosols: Modale Modellierung Von Mehrkomponentenaerosolen, Verlag für Wissenschaft und Forschung (VWF), ISBN: 3-89700-080-6, 1999. a
Wise, M. E., Martin, S. T., Russell, L. M., and Buseck, P. R.: Water uptake by NaCl particles prior to deliquescence and the phase rule, Aerosol Sci. Tech., 42, 281–294, https://doi.org/10.1080/02786820802047115, 2008. a
- Abstract
- Introduction
- Experimental setup
- Numerical setup
- Results
- Summary and conclusion
- Appendix A: Comparison of two different NaCl pre-conditioning settings and their effect on the RH field inside LACIS-T
- Appendix B: Comparison between measurements and simulations of fdel as a function of tres
- Data availability
- Author contributions
- Competing interests
- Disclaimer
- Acknowledgements
- Financial support
- Review statement
- References